Recycling
To produce new products from recovered materials requires fewer raw resources and less energy. That’s how recycling household, commercial, and industrial waste can cut emissions.
Reduced/Sequestered
2020–2050
To Implement
Operational Savings
Impact
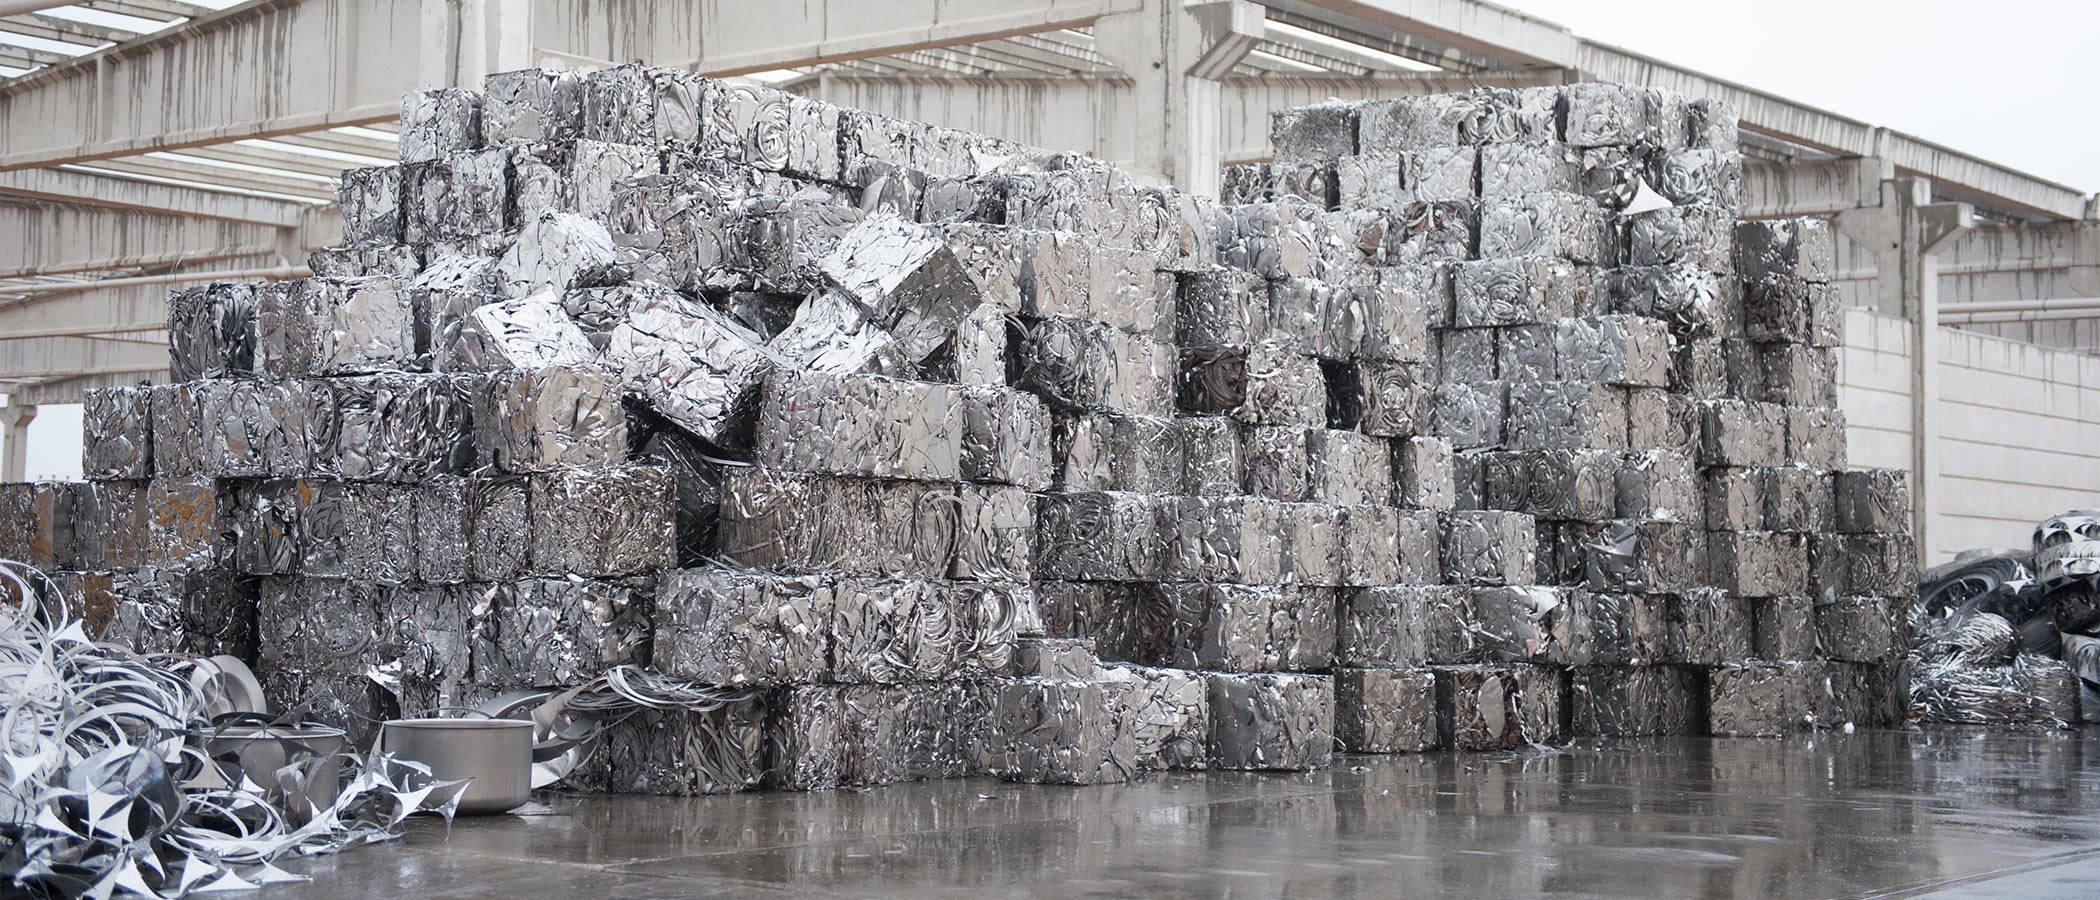
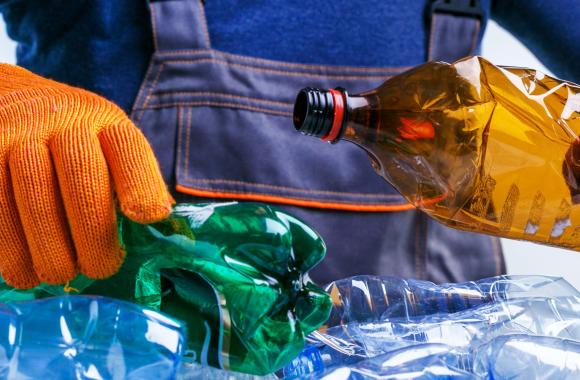
Household and commercial recycling include metals, plastic, glass, and other materials, such as rubber, textiles, and e-waste. (We consider paper products and organic wastes in separate Project Drawdown solutions.) Emissions reductions stem from avoiding emissions associated with landfilling and from substituting recycled materials for virgin feedstock. With about 50 percent of recycled materials coming from households and the rest from industry, if the average worldwide recycling rate of the materials considered here increases to 62–82 percent of total recyclable municipal solid waste, recycling could avoid 10.36–11.29 gigatons of carbon dioxide equivalent emissions by 2050.
Introduction
Recovering and recycling waste materials for use in new products reduces the amount of materials manufactured from virgin sources, produces less greenhouse gas emissions, and reduces the environmental burden of landfilling.
Project Drawdown’s Recycling solution increases recovery of recyclable materials, not including paper or organic materials, from both industrial and residential sectors. Waste included in this solution is post-consumer waste, measured at waste collection centers. Recyclable waste types considered for this solution are metals, plastic, glass, and other (paper products and organic wastes are included in other Project Drawdown solutions). This solution replaces the disposal of recyclable materials in landfills.
Managing household waste tends to be the responsibility of city governments, or of informal waste collection in lower-income cities. Strategies to enhance residential and industrial recycling include:
- fees for landfill waste but not recycling
- redeemable deposits paid at purchase
- extended producer responsibility
- enhanced markets for recycled materials
- innovation in conversion technologies
- circular business models.
Collection, transport, and processing are, for the time being, largely powered by fossil fuels. Even still, recycling remains an effective approach to managing waste while reducing emissions. It also reduces resource extraction, minimizes other pollutants, and creates jobs.
Methodology
We include household and commercial waste in aggregate in our analysis. The fraction of total waste allocated to households and commercial or industrial waste generators is not often reported; we assume that 50 percent of recyclable waste is derived from the industrial sector.
Total Addressable Market
We calculated the total addressable market for recyclable waste using a composite of forecasts, including a linear interpolation of World Bank data from 2010 to 2025, an extrapolation to extend those projections to 2050, and a per capita extrapolation using data from the Intergovernmental Panel on Climate Change (IPCC) and the UN 2015 median urban population forecast. We estimated that by 2050, global organic waste will be approximately 1,459 million metric tons. We estimated current adoption (the amount of functional demand supplied in 2014) of household and commercial recycling at 27 percent of recyclable waste (Hoornweg and Bhada-Tata, 2012).
Adoption Scenarios
Due to the lack of reliable projections for the growth of recycling, we developed three custom adoption estimates based on increasingly ambitious recycling rates for four regions—Organisation for Economic Co-operation and Development (OECD) countries, Eastern Europe, Asia (sans Japan), Middle East & Africa, and Latin America & the Caribbean.
For the first estimate, we set all 2050 non-OECD regional rates to the 2014 OECD recycling rate of approximately 57 percent. For the second estimate, we set non-OECD countries’ recycling target rate for 2050 to the current Austrian recycling rate of 63 percent. For the third estimate, we set recycling rates for non-OECD countries in 2050 to correspond with the current best recycling rate of the countries in the corresponding region. For example, Asia (sans Japan) region’s recycling rate target is set to 61 percent, which is Singapore’s recycling rate in 2015. We used these estimates to create boundaries limiting adoption potential, which are used to create Scenario 2.
We calculated impacts of increased adoption of recycling from 2020 to 2050 by comparing two scenarios with a reference scenario in which the market share was fixed at current levels.
- Scenario 1: Recycling increases to 62 percent of the market, with 557.09 million metric tons of recyclable municipal solid waste recycled by 2050.
- Scenario 2: 583.56 million metric tons (82 percent of the market) of recyclable municipal solid waste are recycled by 2050 with complete optimization of source separation and collection processes as well as aggressive zero waste policy adoption.
Financial Model
To arrive at financial results, we compared the costs of creating and operating material recovery facilities or mechanical-biological treatment facilities with the cost of creating and operating sanitary landfills for an equivalent volume of recyclable waste. The marginal first cost was US$10 billion. When revenues from recovered materials were included, the cost of operating recycling facilities was less than that of operating landfills and sourcing virgin material feedstocks.
Integration
To integrate the Recycling solution with other Industry sector solutions, we first considered the reduction in recyclable waste due to adoption of the Bioplastics solution. As a result, over time the overall market for recycling decreases but the adoption percentage increases.
Results
Scenario 1 yielded a 10.36-gigaton reduction in carbon dioxide equivalent emissions over 2020–2050 at a net first cost to implement of US$9.01 billion. Lifetime net operational costs were US$41.98 billion.
For Scenario 2, the emissions avoided amount to 11.29 gigatons of carbon dioxide equivalent with a net first cost to implement of US$9.69 billion and US$45.84 billion in lifetime costs.
Discussion
Household and industrial recycling provide industry with feedstocks to produce needed goods with fewer emissions. Recycling also extends the life of sanitary landfills and creates economic opportunity and activity in material recovery and reprocessing.
Limitations
We could not easily determine the state of currently operating landfills and material recovery facilities could not be easily determined within the scope of this study. Because we were unable to establish how much waste can be landfilled in currently operating landfills and how much excess capacity currently operating material recovery facilities, first costs are calculated for installing completely new facilities. Similar limitations of the study have been identified with establishing first costs of introducing new solid waste collection systems by municipalities, and the unused capacity of existing ones. Additionally, much of the complexity of recycling ceramics, rubber, textiles and e-waste have been oversimplified with the approach taken. Finally, it is also likely the development in the technologies of material recycling, product recycling and end-of-pipe technologies such as waste identification and sorting technologies, waste disassembly and shredding technologies, and material recovery technologies will have positive impacts on lowering first costs and operating costs of recycling.
References
Hoornweg, D. and Bhada-Tata, P. (2012). What a Waste: A Global Review of Solid Waste Management. World Bank. Accessed at https://documents1.worldbank.org/curated/en/302341468126264791/pdf/68135-REVISED-What-a-Waste-2012-Final-updated.pdf
What You Can Do
Recognize that everything you consume produces greenhouse gases. Reduce, reuse, and recycle whenever possible.
Encourage your workplace or campus and other venues you frequent to provide separate containers for recyclables.
Promote legislation of standardized recyclable packaging for all products.
- Expand your knowledge by exploring another Drawdown solution.
Co-benefits
Recycling reduces natural resource depletion, habitat destruction, and pollution from mining.


