A Primer on Science‑Based Climate Solutions

The Problem 

Humans are changing Earth’s climate. 

How?

Mining, processing, and burning fossil fuels – especially coal, oil, and natural gas – release CO₂, methane, and other greenhouse gases into the atmosphere. In addition, deforestation, large-scale agriculture, and many other land uses release significant amounts of greenhouse gas pollution. Plus, activities such as producing cement, using and disposing of refrigerants, operating landfills, and treating wastewater also release large amounts of greenhouse gases. 

Humans are dumping vast amounts of these gases to the atmosphere faster than nature can process them. The problem? These gases are building up in the atmosphere, trapping heat, warming Earth’s surface. To date, our planet is roughly 1.2 ˚C warmer than it was in preindustrial times.

Scientists have known the basics behind this since the mid-1800s. But now, in the early 21st century, climate change has moved from theory to threat.

While no one can accurately predict the future in any detail, it’s clear that the continued emissions of greenhouse gases will warm the planet even more. Every bit of additional warming will bring additional disruptions to the world’s weather patterns, water supplies, agricultural systems, cities, and natural ecosystems – with profound consequences on people, particularly in the most vulnerable communities.

In short, continued climate change is a serious threat to humanity’s collective future.

But it’s not an inevitable one.

It turns out that the knowledge and tools needed to address climate change are available today. And more tools and ideas are coming every day. The window of opportunity to stop disastrous climate change is closing fast, so it’s critical to deploy these as quickly and effectively as possible.

The Solutions

At Project Drawdown, we use science to identify the most effective solutions to climate change.

Why do we do this?

While many people and organizations offer supposed solutions to climate change, it’s hard to know without in-depth research which are truly effective, which are still in the works, and which are just a distraction. Moreover, now that significant funding and attention are going to climate action, it’s critical to find trusted, independent advisors who know their stuff, want to achieve real climate impact, and are not looking to make a quick buck.

It’s also important to make sure climate solutions are ready, today, for implementation. Addressing climate change is a race against time, and waiting for faraway solutions is exactly the wrong thing to do. Every year spent waiting for a “better” technological marvel to arrive only gives us another year’s worth of greenhouse gas pollution, which locks in a higher level of planetary warming.

To stop climate change before it’s too late – and make no mistake, this is still possible – humanity needs to:

  • listen to science-based organizations that don’t have a vested financial, political, or ideological stake in proposed solutions
  • look for clear, independent sources of evidence that a particular solution is effective, scalable, and economically feasible
  • focus on solutions that are available now and are not dependent on future research and development
  • consider the potential drawbacks of a solution – especially if they could cause harm to vulnerable people or ecosystems – as well as the potential synergistic benefits to people and nature some solutions might offer
  • avoid “silver bullet” thinking, which assumes just one solution – or even a selected handful – will be enough to address climate change
  • look beyond the “what” of a solution – its effectiveness, potential size, overall climate impact, and cost – to “how” it can be realized, including details about its speed, geographic suitability, and associated benefits
  • consider who can help adopt and scale different solutions, using the different levers of action available to them. 

In short, the world needs to engage a trusted, science-based guide for effective climate action. And that’s what Project Drawdown and our Drawdown Explorer platform are all about. 

What Is a Climate Solution?

We define a climate solution as a physical practice or technology that materially lowers the long-term concentration of greenhouse gases (and other warming pollution) in the atmosphere. Climate solutions work by either cutting greenhouse gas emissions or removing greenhouse gases from the atmosphere.

By this definition, new policies, regulations, laws, investments, grants, campaigns, social movements, and protests are not solutions. Instead, we call these “levers” – actions that can help bring physical solutions into the world. We also define “key actors” as the people pushing on the different levers, which can include policymakers, business leaders, community leaders, investors, philanthropists, practitioners, cultural changemakers, activists, and individuals.

In other words, “solutions” are physical practices or technologies, “levers” help them scale, and “key actors” make it happen.

Project Drawdown will “highly recommend” (see more below) a climate solution if it is an identifiable technology or practice that:

  • materially reduces the long-term concentration of greenhouse gases in the atmosphere by cutting emissions at the source or removing them from the atmosphere
  • is readily available today and has a proven ability to mitigate greenhouse gases
  • meaningfully affects greenhouse gases at the global scale, at levels necessary to impact climate change. 

To qualify as a Drawdown Explorer Highly Recommended climate solution, a practice or technology should not:

  • be currently unproven or unavailable
  • increase emissions elsewhere as much as, or more than, the climate benefit it delivers
  • cause irreparable environmental and/or social harm
  • massively accelerate another planetary crisis, such as water loss, untreatable pollution, or biodiversity loss.

Using these criteria, we have identified more than 70 Highly Recommended climate solutions. We no longer rank them because we need to use all of them, together, to have a meaningful impact on the climate.

The Drawdown Explorer Solutions Taxonomy

To evaluate climate solutions, the first place to start is to understand and describe how they work. The Drawdown Explorer Solutions Taxonomy (Table 1) is a simple system to help keep track of how and where each solution has an impact.

To begin, we consider the mode of action of a solution. Does it cut emissions or remove carbon from the atmosphere? Or does it work through some other approach?

Then we consider the sector in which the solution operates. Does it cut emissions from electricity? Or industry? Or agriculture? It’s important to note that sectors can be delineated in different ways. We follow the standard scientific convention of classifying solutions by where the mitigated greenhouse gas emissions occur. For example, if we improve the efficiency of lighting in our homes, that is counted as an electricity solution, not a buildings solution, because the emissions it lowers occur at the power plant, not your home. But insulating your attic can lower buildings emissions, because it makes your furnace or boiler work less often, lowering emissions from the building itself.

We then group solutions into solution clusters that share common traits, such improving efficiency or switching to renewable energy sources.

Table 1. The Drawdown Explorer Solutions Taxonomy

Mode of Action Sector Solution Cluster
Cut Emissions Buildings
  • Shift Energy Sources
Buildings & Electricity
  • Enhance Efficiency
  • Shift Energy Sources
  • Enhance Efficiency
Electricity
  • Enhance Efficiency
  • Shift Production
  • Improve Electrical System
Electricity & Industry
  • Enhance Efficiency
  • Cut Fugitive Emissions
  • Shift Production
Industry, Materials & Waste
  • Improve Materials
  • Improve Processes
  • Cut Fugitive Emissions
  • Use Waste as a Resource
Transportation
  • Enhance Efficiency
  • Shift to Alternatives
  • Electrify Vehicles
  • Switch Fuels
Other Energy
  • Cut Fugitive Emissions
Food, Agriculture, Land & Ocean (FALO)
  • Curb Growing Demands
  • Protect & Manage Ecosystems
  • Shift Agriculture Practices
Cut Emissions & Remove Carbon FALO & Nature-Based Carbon Removal
  • Shift Agriculture Practices
Remove Carbon Nature-Based Carbon Removal
  • Restore & Manage Ecosystems
  • Shift Agriculture Practices
  • Use Degraded Land
Industrial Carbon Removal
  • Biomass Carbon Removal & Storage
Other Health & Education
  • Other

How We Evaluate Solutions

Project Drawdown scientists, engineers, research fellows, and advisors have been evaluating climate solutions for years. We synthesize data from scientific publications, technical reports, white papers, and other public sources from around the world to paint a detailed picture of the current state and future potential of proposed climate solutions. Moreover, we subject these data to rigorous analysis and quality control before summarizing them into global and regional estimates of a solution’s potential performance. And, unlike many organizations, we also consider the additional benefits a climate solution offers to nature and people, beyond greenhouse gas mitigation alone.

When we first consider a potential climate solution, we evaluate it against seven basic criteria: 

  • Is it plausible?

    We evaluate the basic physical, chemical, and biological underpinnings of a solution. Does it obey basic scientific principles? Does it contradict known physical laws?

  • Is it ready?

    We ask whether the solution is commonly available in the world. Many proposed solutions are at some stage of research and development, and will take years to become market-ready. Until something is truly in the world and ready to scale, we don’t count it as a solution.

  • Is there sufficient evidence?

    We also ask whether there is sufficient solid evidence to judge the efficacy of a proposed solution.

  • Does it consistently work?

    Does the solution reliably reduce emissions or remove carbon as intended? Can we count on it to have a predictable and positive climate impact over time?

  • Can it have a sufficient impact?

    At the end of the day, a proposed solution must address a meaningful piece of the climate problem. We define this as being able to scale to at least ~0.1 billion metric tons of CO₂‑equivalent pollution mitigated per year.

  • Does it pose major risks?

    Everything has risks, and we must evaluate the trade-offs they represent. Can we mitigate or adapt to the risks of a new solution? Or does a solution pose potentially irreversible, detrimental, global-scale risks that cannot be overcome?

  • Does it have realistic costs?

    We also judge whether a proposed solution is simply too expensive to ever be realistic. While technologies mature and often fall in price, some remain prohibitive for widespread use.

Depending on the answers to those questions, we sort potential solutions into four categories:

  • Highly Recommended 

    Highly Recommended proposed solutions are effective, impactful at scale, ready to go, and could make a major contribution to addressing climate change. These are the solutions we focus on.

  • Worthwhile

    Worthwhile proposed solutions don’t quite make the cut in terms of overall global impact, but they might play a useful role in particular regions, companies, or communities, or they might have benefits outside of climate pollutant mitigation. We recommend Worthwhile solutions in applications where they can make a difference.

  • Keep Watching

    Keep Watching proposed solutions sound great on paper, but they aren’t ready yet.

  • Not Recommended

    Not Recommended proposed solutions are probably a bad idea because they have fundamental technological or scientific problems, pose major risks that cannot easily be addressed, or are prohibitively expensive. Best skip these.

We continuously review and update our assessment of solutions. Some have shifted categories in our assessment as new evidence came to light, and we anticipate that this will happen in the future. Stay tuned.

Guiding Principles

Starting in 2024, we updated our assessment methodology for evaluating climate solutions. The Drawdown Explorer is a digital repository of the results, providing up-to-date assessments of climate solutions. 

Below are some of the key principles behind our assessment methods. For more details, you can visit our methodology documentation.

  • Our analyses characterize how climate solutions work at the global scale. Where possible and relevant, we also add detail at the regional level.
  • The assessments draw from the most recent available data.
  • As much as possible, we use open-source data that are freely available to anyone.
  • We strive to make our assessments simple, accessible, and transparent. They are not based on hidden “black box” models and instead are based on step-by-step calculations with consistent methods across all solutions. We want our methods, data, and results to be a resource to anyone interested in using them. All Highly Recommended solutions have spreadsheets with assessment data and results available to view.
  • Rather than creating long-term scenarios ourselves, we make the assessments interactive so you can explore how and where you think solutions can scale into the world.
  • We offer tailored recommendations for different key actors on how you can best deploy solutions given your unique circumstances.
  • We assess the benefits climate solutions offer to people and nature beyond climate mitigation.
  • We aim for the highest standards of transparency, elegance, and simplicity in presenting our assessments to a wide audience.
  • Our work is a public good. We don’t charge for it or hide behind a paywall.

We review the most recent data and scientific findings, along with our own analyses, calculations, and syntheses, to provide the following information for each Drawdown Explorer Highly Recommended solution:

Adoption Unit

The physical metric of measurement for quantifying the solution

The adoption unit is the measurement unit used for a particular solution to quantify adoption and standardize assessment values. We choose an adoption unit that is:

  • logically suited to estimating the key quantities we are assessing

  • as close as possible to the data units found in the literature

  • easily understood by a general audience. 

Adoption units generally fall into several main categories:

  • physical quantities of material

  • area covered

  • distance traveled

  • cumulative capacity

  • units of equipment

  • quantities of emissions abated.

Baseline

The current practices the solution is replacing

When defining and quantifying a solution, we do this in reference to the current (2023 or most recent) activities or technologies the solution is replacing. This represents the alternative scenario if the solution is not adopted. To meaningfully compare electricity generation solutions, we use a common baseline that reflects the average emissions from electricity production worldwide as of 2023.

Effectiveness

How well the solution addresses climate change

We define effectiveness as the emissions reduced or carbon removed per adoption unit relative to the baseline. Carbon removal can include engineered CO₂ removal and storage or carbon sequestration in natural sinks. We quantify meaningful reductions in atmospheric CO₂, methane, nitrous oxide, and fluorinated gases (F-gases), and qualitatively assess reductions in black carbon (soot) and contrails (ice and soot clouds from airplane engines).

Different climate pollutants have different effects on the atmosphere, so we convert them all into a standard unit called CO₂‑eq uivalence, which is the amount of CO₂ needed to have the same warming impact. We do this by multiplying by the global warming potential (GWP). GWP is a value that indicates how much warming will result from the emission of 1 metric ton of a climate pollutant relative to the warming resulting from 1 metric ton of CO₂. Typically, GWPs are reported on 20-year or 100-year time frames. Pollutants with shorter lifetimes in the atmosphere will have their warming impact concentrated in the near term, resulting in a higher 20-year GWP than 100-year GWP.

Table 2. Comparison of GWP on a 20- and 100-year time frame for common climate pollutants.

Climate Pollutant Lifetime (yr) GWP-20 GWP-100
CO₂ Varies, can be centuries 1 1
Methane 11.8 81.2 27.9
Nitrous oxide 109 273 273
F-gases
Example: HFC-134a
Depends on gas
HFC-134a: 14
Depends on gas
HFC-134a: 4140
Depends on gas
HFC-134a: 1530

Source: Smith, C., Nicholls, Z. R. J., Armour, K., Collins, W., Forster, P., Meinshausen, M., Palmer, M. D., & Watanabe, M. (2021). The Earth’s energy budget, climate feedbacks, and climate sensitivity supplementary material. In V. Masson-Delmotte, P. Zhai, A. Pirani, S. L. Connors, C. Péan, S. Berger, N. Caud, Y. Chen, L. Goldfarb, M. I. Gomis, M. Huang, K. Leitzell, E. Lonnoy, J. B. R. Matthews, T. K. Maycock, T. Waterfield, O. Yelekçi, R. Yu, & B. Zhou (Eds.), Climate change 2021: The physical science basis. Contribution of Working Group I to the Sixth Assessment Report of the Intergovernmental Panel on Climate Change. https://www.ipcc.ch/

Cost

The relative cost to implement a unit of this solution 

The solution cost is an estimate of how much money installing and operating a climate solution costs or saves relative to current standard practices.

In assigning a cost of deployment to a solution, we specify who we consider to be deploying it. For example, the cost for a city to build a public transit system is different from the cost for an individual to use the system. In our Enhance Public Transit solution, we chose to evaluate public transit’s costs from the transit provider’s perspective in order to provide insight into the large-scale costs of implementing this solution. At the same time, we recognize that the cost to users also influences deployment.

To calculate cost, we consider expenses (one-time initial or capital expenses as well as ongoing operating expenses) and revenues from implementing the solution over its lifetime. We then calculate the net cost of the baseline and solution using this equation:

$$\textit{Solution or baseline net cost} = \frac{\textit{Initial cost}}{\textit{Lifetime (or default 30 years)}} + \frac{\textit{Operating cost}}{\textit{Year}} - \frac{\textit{Revenue}}{\textit{Year}}$$

The initial cost is all up-front costs to deploy the solution, the operating cost is all ongoing costs during use, and revenue is money that the implementer makes as a result of deploying the solution. 

We use the net cost for the baseline and solution cases to calculate two cost values: net relative solution cost and cost per climate impact:

$$\textit{Net relative solution cost} = \textit{Solution net cost} - \textit{Baseline net cost}$$ $$\textit{Cost per unit climate impact} = \frac{\textit{Net relative solution cost }}{\textit{Effectiveness (100-yr)}}$$

We use the cost per unit climate impact to quantify the cost per metric ton of CO₂‑eq reduced or removed for each solution. However, we don’t rank solutions by this value because it is an imperfect tool for comparison in a dynamic economic and technological environment.

Learning Curve

Whether costs fall as we deploy more of this solution

Can we expect solutions not yet widely deployed to cost less as they are adopted more? A learning curve means that costs decrease as more of a solution is adopted due to economies of scale, developments in manufacturing or infrastructure, or other factors. Learning rate is defined as the percent drop in cost of the solution when the adoption doubles. We determine this value based on a literature review, including reported learning rates and historical data relating to changes in adoption and changes in costs.

Some solutions lack learning curves. This is particularly true for solutions that are currently deployed at small scales and therefore lack data and for solutions that are at high technology maturity and aren’t expected to have costs fall further.

Speed of Action

How quickly the climate impact of a solution will be realized

Speed of action refers to how quickly a climate solution physically affects the atmosphere after it is deployed. This is separate from the speed of deployment, which is the pace at which solutions are adopted. At Project Drawdown, we define the speed of action for each climate solution in terms of three categories: Gradual, Emergency Brake, and Delayed.

  • Gradual solutions have a steady impact on the atmosphere. For example, if we replace a gas furnace with an electric heat pump, the heat pump prevents the pollution that the furnace would have emitted on a consistent, ongoing basis. 

  • Emergency brake solutions work faster than gradual solutions. Some do so by leveraging the physics of short-lived, extra-potent climate pollutants, such as methane, F-gases, black carbon, or contrails. Others do so by preventing a large, sudden pulse of CO₂ emissions in the short term after they are deployed, such as preventing the clearing of a forest.

  • Delayed solutions work more slowly than gradual solutions, mainly because they have a built-in delay to reach their full potential once deployed. Nature-based carbon removal schemes, for example, often experience some years of delay because trees and soils take time to ramp up their carbon accumulation potential. Solutions that affect long-term demographic and economic development trends in society also have built-in delays. 

Most climate solutions fall into the Gradual category. Emergency Brake solutions deserve special attention because they can accelerate the impact of climate actions. Delayed solutions can be robust climate solutions, too, but due to their inherent time lags, it’s important not to expect them to reach their full potential for some time.

Current Adoption

The most recent level of uptake of a solution 

We determine the extent to which the solution is currently being used. For some solutions, current adoption is any uptake above zero. For example, any electric cars being driven today represent adoption of that technology. Other solutions, such as those that improve the efficiency of existing equipment, have a less clear benchmark for adoption. In these cases, we specify the methods and assumptions we use to determine current adoption. 

Adoption Trend

How solution uptake has been changing in recent years

Adoption trend conveys how adoption of a solution has been changing year over year. Typically, the adoption trend from the past 5–10 years is relevant to understand how adoption is changing, why adoption is at its current level, and where adoption may be going based on the trend we are seeing now. For technologically mature solutions, we may consider a longer time period. 

Adoption Ceiling

The physical or practical upper limit of the size a solution could reach

The ceiling level of adoption is the practical upper limit of this technology being adopted, absent current social, economic, and policy constraints. When applicable, this will be a physical limit, such as the materials needed for the solution or the amount of land area where the solution can be deployed. We determine this value based on our literature review or use our best judgment based on reasonable assumptions. We don’t expect the adoption ceiling to be reached or exceeded before 2050.

Achievable Adoption Range

The most likely range for actual adoption within the next five to 25 years

Achievable adoption range is an estimate of the level of adoption possible under realistic assumptions – somewhere between the current level and the adoption ceiling. The adoption achievable range provides the most likely range for actual adoption within the next five to 25 years, not to extend beyond the year 2050. The low end of this range is considered low achievable adoption, and the high end of the range is high achievable adoption. We are not making a prediction or forecast of what adoption will be in the future. Instead, we use subjective judgment and a literature review (including net zero studies when relevant) to make these estimations.

Climate Impacts

The worldwide reduction in atmospheric GHG each year that’s possible due to this solution 

The impact a solution has on the climate depends both on how well it mitigates GHG and how widely it is deployed. Therefore, we calculate climate impact as effectiveness multiplied by adoption. This gives a quantitative value for the emission savings or carbon removals each year based on the level of solution activity, in consistent units of t CO₂‑eq (100-yr)/yr for all solutions.

We present the climate impact for four adoption levels: Current, Achievable – Low, Achievable – High, and Ceiling.

Additional Benefits

A solution’s possible benefits beyond addressing climate change

For each solution, we identify and characterize 18 additional benefits within three categories:

Climate Adaptation
  • .st0 { fill: #231f20; } Heat stress: Adverse effects of extreme temperatures on humans, wildlife, ecosystems, and infrastructure.
  • .st0 { fill: #231f20; } Wildfires: Unplanned and uncontrolled fires that ignite and consume vegetation and structures in areas such as forests, grasslands, or prairies.
  • .st0 { fill: #231f20; } Sea-level rise: Increasing ocean levels that threaten coastal communities, livelihoods, ecosystems, and infrastructure.
  • .st0 { fill: #231f20; } Extreme weather events: Severe wind, dust, or storms, including hurricanes and tornadoes, that impact communities, ecosystems, infrastructure, and social systems.
  • .st0 { fill: #231f20; } Floods: Excessive and destructive accumulation of water from abnormal, prolonged periods of above-average precipitation or from the rising of waterways that impact communities, livelihoods, ecosystems, and infrastructure.
  • .st0 { fill: #231f20; } Droughts: Abnormal, prolonged periods of below-average precipitation affecting water supply that impact communities, livelihoods, ecosystems, and infrastructure.
Human well-being
  • .st0 { fill: #231f20; } Income & work: Access to employment opportunities that support the economic status of households, communities, or governments.
  • .st0 { fill: #231f20; } Food security: Sufficient, nutritious, and safe nourishment that is physically and economically accessible at all times.
  • .st0 { fill: #231f20; } Water & sanitation: Clean water and effective sanitation, such as waste management, promote hygiene and reduce the risk of illness.
  • .st0 { fill: #231f20; } Energy availability: Access to electricity and clean cooking fuels.
  • .st0 { fill: #231f20; } Health: Physical and mental wellness, including prevention of illness, injury, and premature mortality.
  • .st0 { fill: #231f20; } Equality: Equal rights, opportunities, and treatment of all populations regardless of social, economic, cultural, and gender identities.
Environment
  • .st0 { fill: #231f20; } Nature protection: Protections that safeguard the amount, health, and diversity of species and ecosystems.
  • .st0 { fill: #231f20; } Animal well-being: Treatment of animals so as to reduce physical and psychological harm.
  • .st0 { fill: #231f20; } Land resources: The amount and health of land, including soil quality, for ecological and human use.
  • .st0 { fill: #231f20; } Water resources: Surface, ground, and rainwater used for ecological and human use.
  • .st0 { fill: #231f20; } Water quality: The amount of pollutants, sediments, and microorganisms in fresh and marine water systems that affects the health of humans, wildlife, and ecosystems.
  • .st0 { fill: #231f20; fill-rule: evenodd; } Air quality: The amount of pollution in the atmosphere that affects the health of humans, wildlife, and ecosystems.

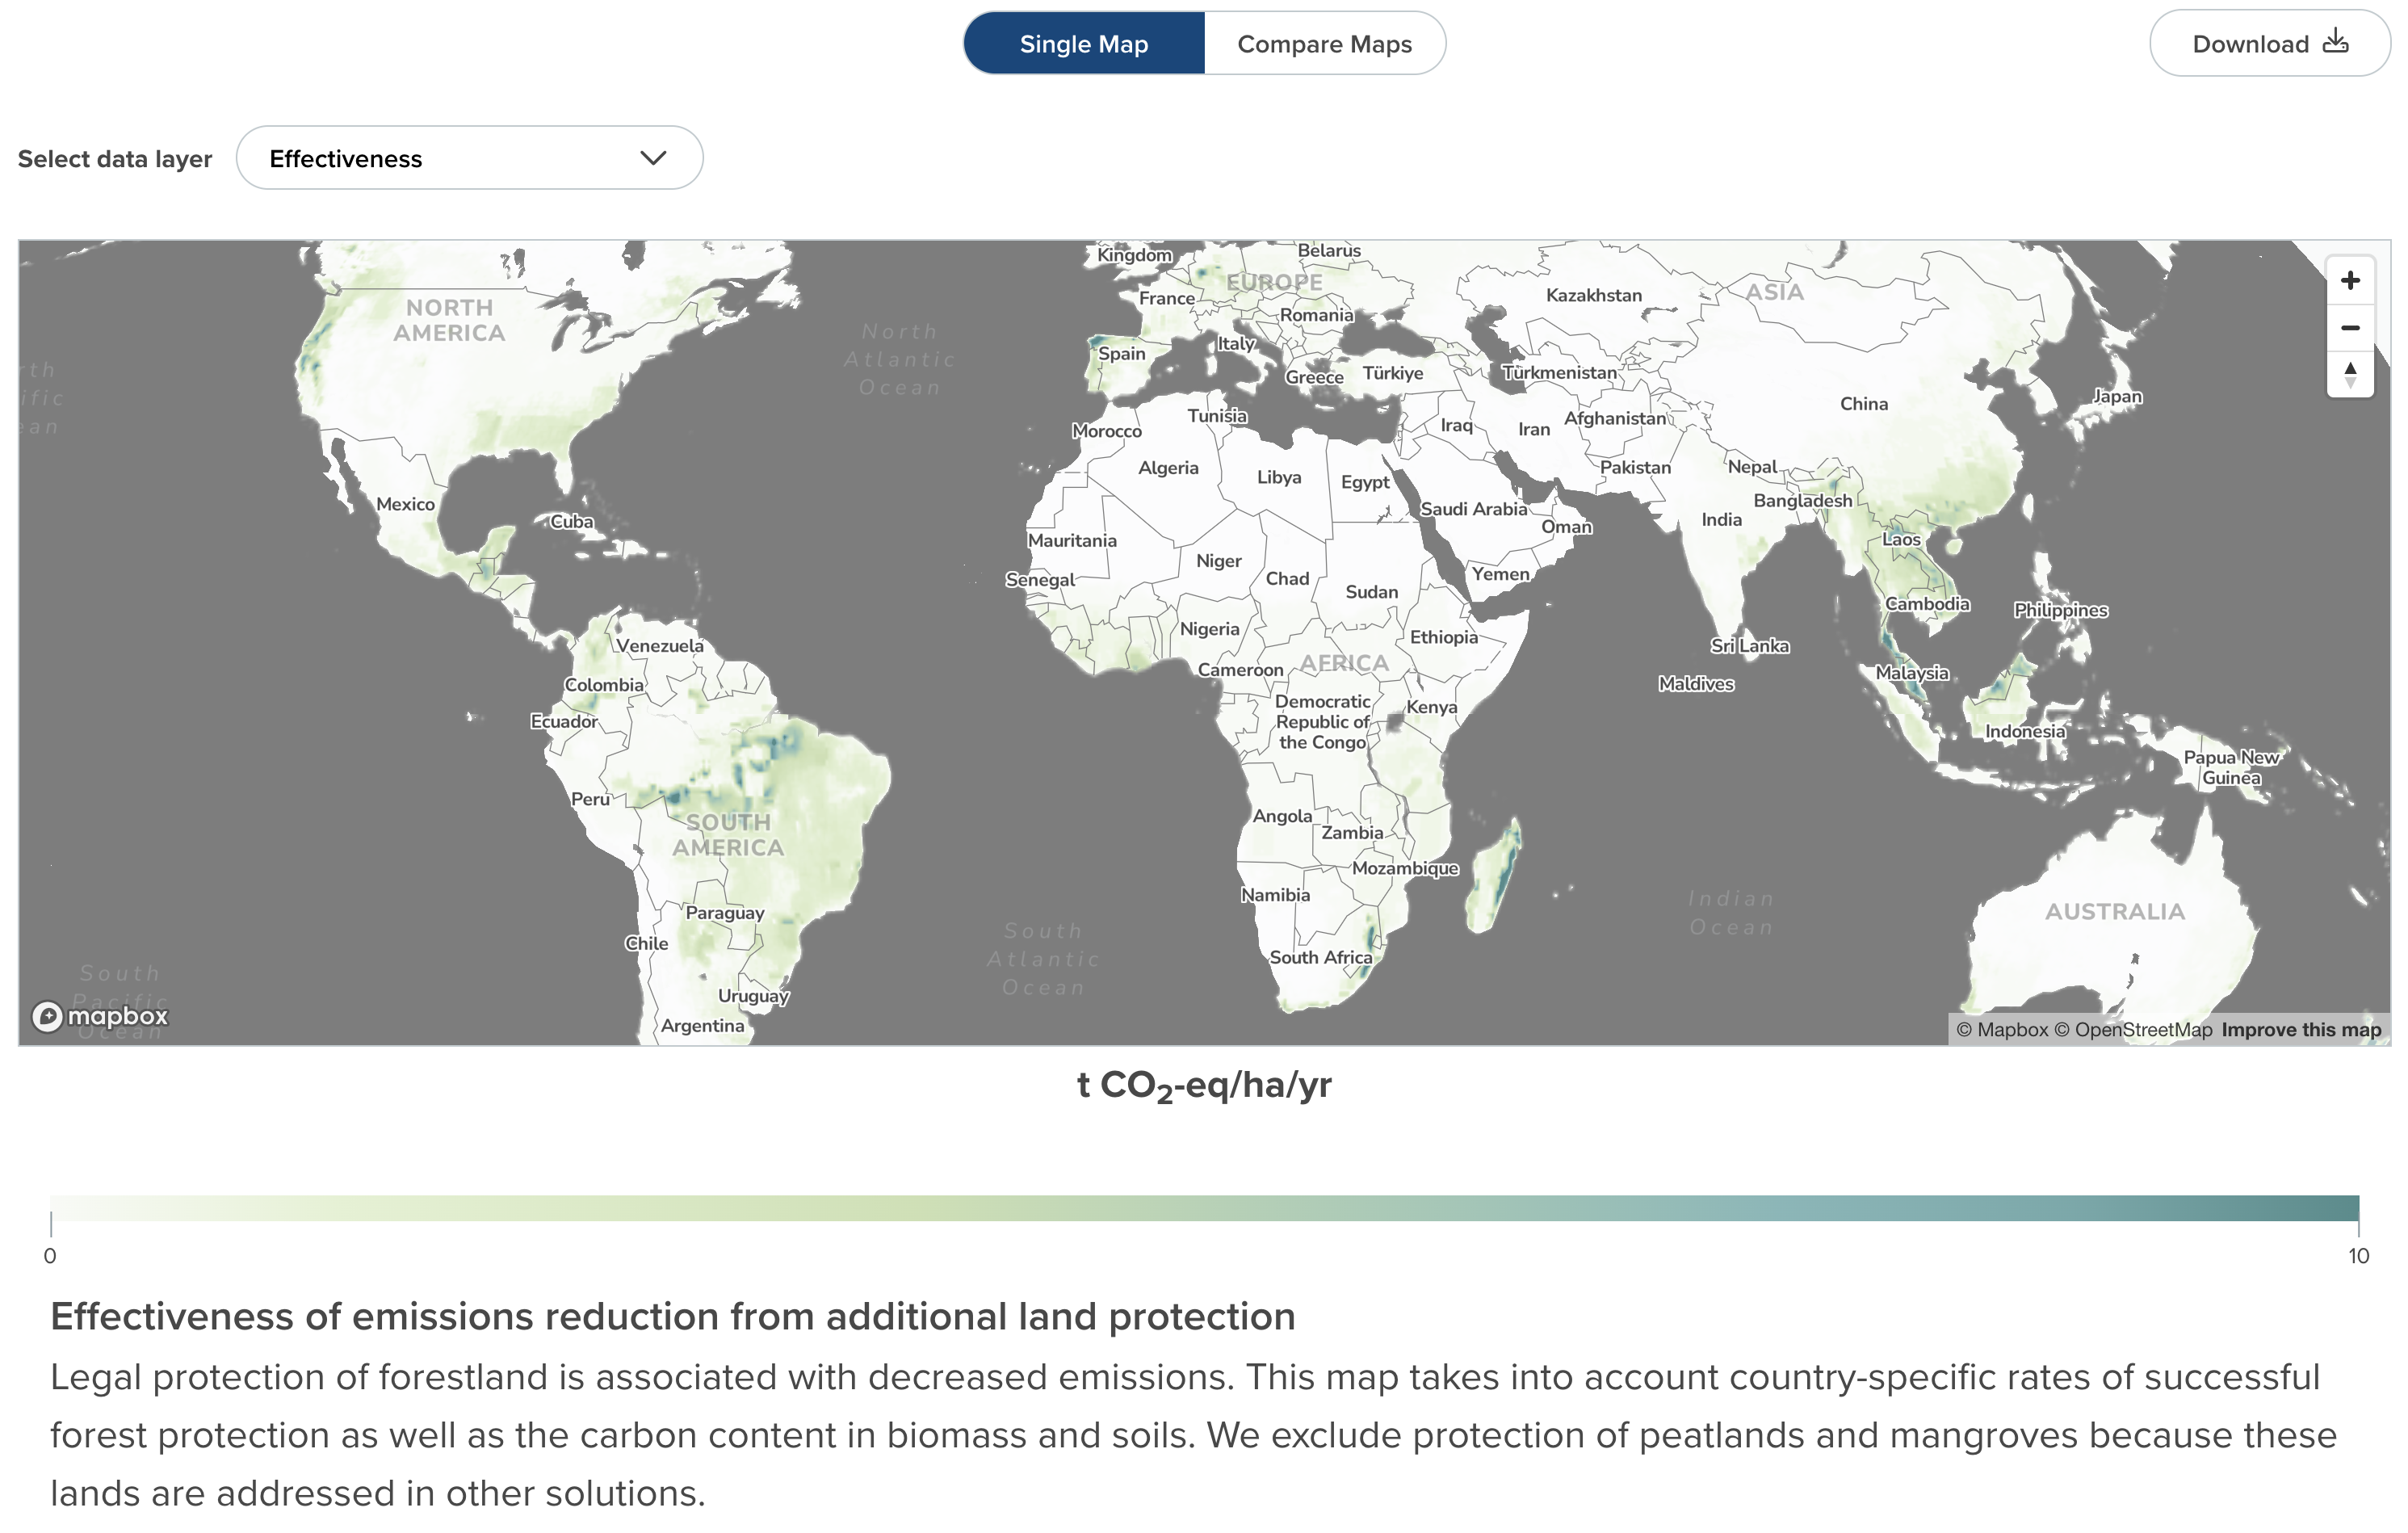
To help users maximize the impact of their climate actions, we provide detailed maps highlighting where in the world solutions are most applicable, where they aren’t applicable, and where solutions may have strong future potential. For instance, Improve Nonmotorized Transportation has greater potential for mitigating GHG emissions in urban areas than in rural ones, and Protect Forests will be most impactful where intact ecosystems store millennia’s worth of carbon in undisturbed soils. 

Questions asked and answered include:

  • In what regions of the world is this solution most effective at mitigating climate change?
  • Where is the solution adopted now? Where could it be best adopted in the future?
  • What are the best geographic targets for scaling this solution, with maximum effectiveness and the highest potential for adoption?

Depending on the solution, we provide a written summary of the solution’s effectiveness around the world or in the regions in which it is applicable. Based on the geospatial analysis, we pinpoint hotspots for focusing future action with this solution.

The maps we include with each solution tell a place-based story that includes (as data are available):

  • current status of the problem the solution is addressing

  • potential effectiveness

  • current levels of adoption

  • corresponding impact on GHG mitigation

  • potential for future adoption and GHG mitigation

  • additional benefits the solution offers.

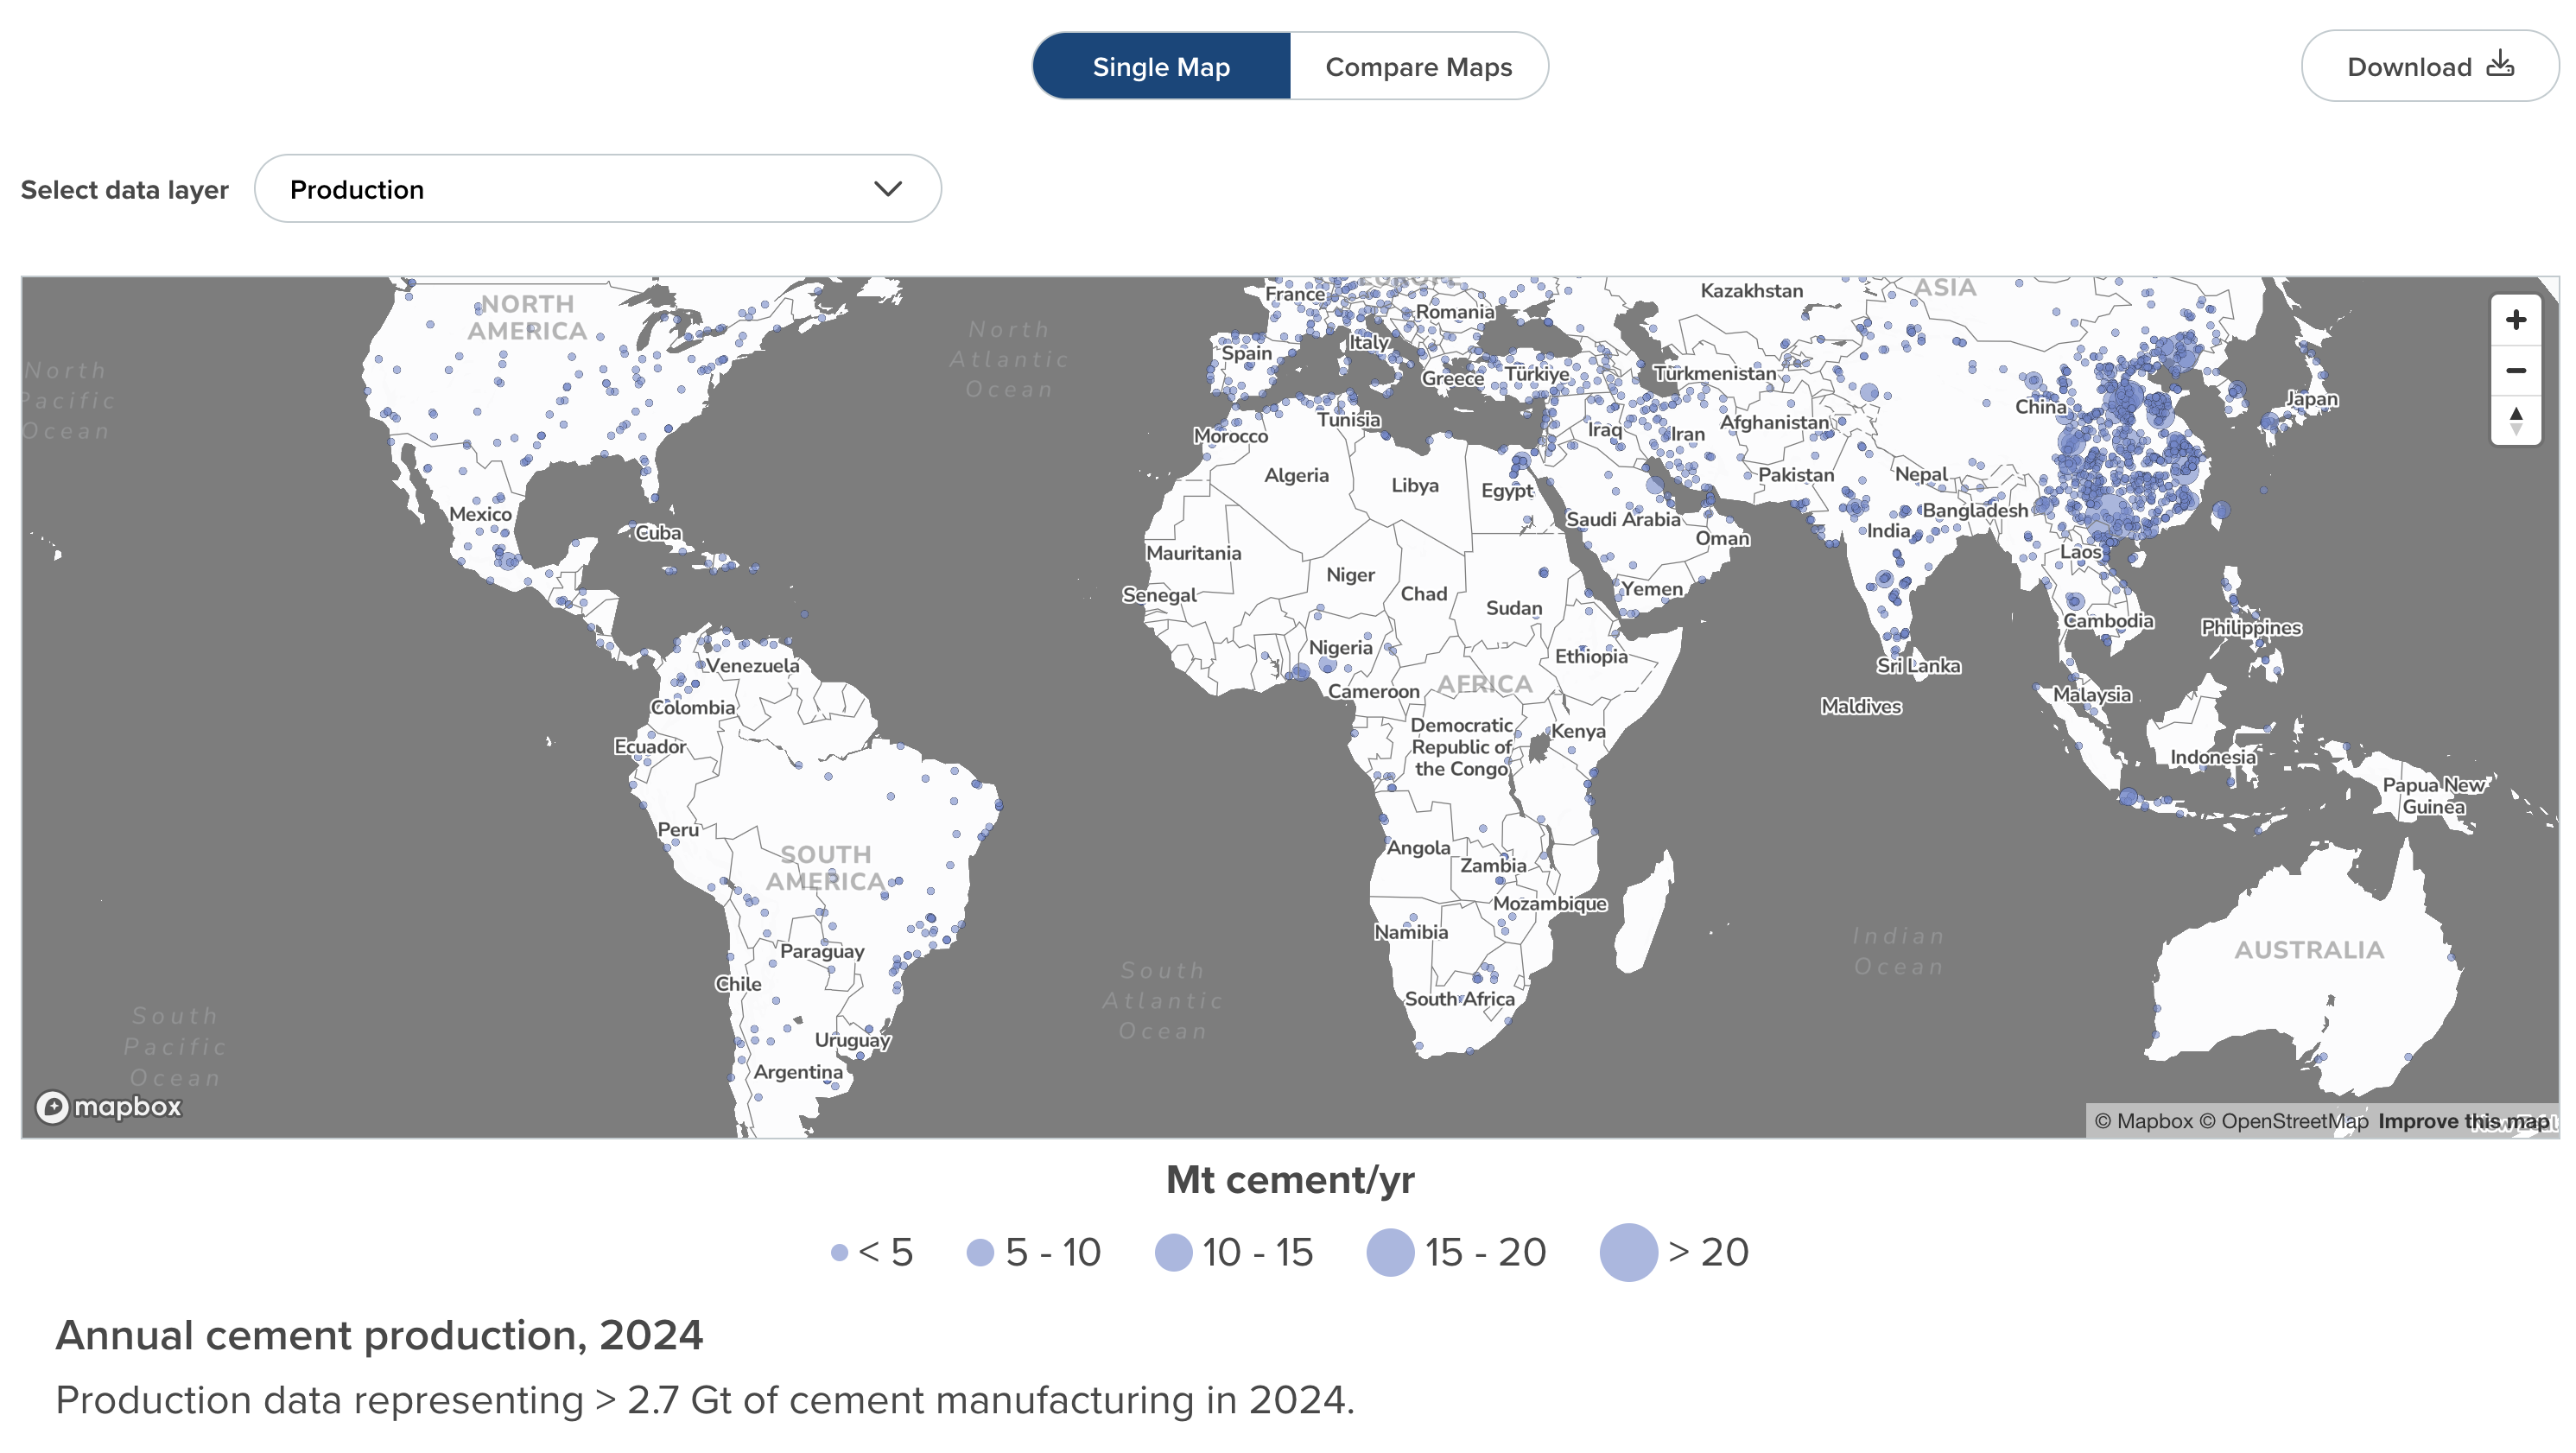
Depending on the data available, maps may present information at the level of an entire country, a smaller jurisdiction, or individual facilities. We use both raster (grids of cells like pixels) and vector (lines, points, polygons) geospatial data formats.

Raster

Image
Screenshot of example raster map for Forest Protection

Vector

Image
Screenshot of example vector map for Cement Production

We obtain geospatial data from multiple sources, including peer-reviewed journals, credible international organizations, and national governments. We process the data using Matlab or Python and map the effectiveness of this solution across the world using meta-analysis, georeferenced data points, geospatial proxy data sets, and AI “data fusion” techniques that we have developed. In most cases, the Drawdown Explorer lets users zoom in on specific locations at a resolution that enables them to see large rivers, small countries, and subnational areas within large countries. Users can also compare two maps side by side within a solution and save specific map views for further analysis or sharing with others.

A spectrum of external factors influences the circumstances under which a solution can or should be implemented. We identify caveats, risks, trade-offs, and ways in which the solution reinforces or competes with other solutions. We also characterize the evidence base for our analysis. 

Caveats

Caveats are considerations of factors that might reduce a solution’s ability to have the desired climate impact. They can include additionality and permanence.

Additionality

Additionality describes whether emissions reductions or carbon sequestration would have occurred without implementing the solution. For example, protecting forests on land that is not under threat of deforestation would not count as reducing emissions or sequestering carbon. Additionality concerns we consider include:

  • Common practice: If the emissions reduced or the carbon removed by implementing the solution might reasonably be included in the baseline case, then this solution may not be as effective at mitigating GHG as the numbers show.
  • Financial additionality: If the financing directed toward the solution is not certain to contribute to additional adoption, or if adoption relies on revenue from carbon credits, the solution may have financial additionality concerns.

We consider any adoption to be part of a solution’s effectiveness, regardless of what drives it. When solution adoption is regulated by policy, we acknowledge that this is the lever driving adoption, but still consider any resulting impacts to be additional.

Other organizations that aim to standardize and regulate carbon markets have different criteria for what makes a project additional, but in our work, we aim to evaluate whether solutions are likely to have the positive climate benefits that we found in our assessment.

Permanence

Permanence refers to whether the GHGs under consideration can be permanently mitigated. In evaluating the solution, we ask: How long does the solution-caused reduction in GHGs in the atmosphere last? What factors contribute to permanence, and how can they be amplified? What factors compromise permanence, and how can they be mitigated?

If the emissions reduced or the carbon sequestered by implementing the solution could be reversed, the solution may have permanence concerns. We describe how the GHG reduction could be reversed, how quickly it might be reversed, and how likely it is that reversal would occur.

If a significant portion of the solution’s climate impact is in question due to additionality or permanence concerns, we may move the solution into Worthwhile, Keep Watching, or Not Recommended solution categories.

Risks

We consider how implementing the solution could harm people and the environment. Examples include low resource availability, poor technological performance, necessary cultural or behavioral shifts, increased inequity, rebound effects, land use change, and increased waste. 

We also consider risks related to incorrect assumptions. The Enhance Public Transit solution, for example, assumes that public transit rides replace individual car rides. If public transit replaces bicycling or walking instead, the climate impact will be far different. Similarly, a solution that depends on behavior change could be limited by a lack of willingness to change. 

Trade-Offs

We look at how implementing a solution might have adverse effects elsewhere, such as increasing emissions in other sectors or increasing embodied emissions. For example, adoption of the Deploy Offshore Wind Turbines solution could incur GHG emissions related to the production and transportation of materials, installation of facilities and cabling, and so on. When possible, we describe the magnitude of these emissions relative to the emissions savings.

Interactions with Other Solutions

We summarize how the solution might affect the benefits other solutions offer.

  • Reinforcing means the solution could increase the benefit of another solution – for example, increase its effectiveness, lower the cost, boost adoption, or enhance additional benefits to people and nature.
  • Competing means the solution could reduce the benefit of another solution.

We list solution interactions in order of our best judgment of importance and impact.

Beyond describing the solution, we offer some ideas as to how various actors can contribute to the beneficial impacts of the solution, as well as links to helpful resources. 

Key actor categories are:

Lawmakers and Policymakers 

  • Elected officials and their staff
  • Bureaucrats and civil servants
  • Regulators, attorneys

Practitioners

  • People who most directly interface with the solution
  • People who influence whether the solution is available or used 

Business Leaders

  • Leaders of businesses selling or distributing related equipment and technology
  • Business leaders who want to support adoption

Nonprofit Leaders

  • Leaders of social welfare organizations
  • Leaders of civic or business leagues
  • Leaders of social clubs
  • Leaders of labor organizations

Investors

  • Individuals or leaders of institutions seeking to lend money in search of a return on their investment
  • Philanthropists and leaders of international aid agencies
  • Leaders of private, national, or multilateral organizations that provide aid through in-kind or financial donations

Thought Leaders

  • Individuals with an established audience, including current or former elected or government officials, authors, academics and researchers, experts, social commentators, entertainers, influencers, athletes, opinion makers, technical experts, pundits
  • Journalists
  • Educators

Technologists and Researchers

  • Technology developers, including founders, designers, inventors, R&D staff, and creators seeking to overcome technical or practical challenges

Communities, Households, and Individuals

  • Members of groups willing to act on the solution directly or indirectly, including neighbors, volunteer organizations, hobbyist and interest groups, online communities of early adopters
  • Collections of individuals occupying a residence
  • Private citizens seeking to support the solution

We recognize a number of limitations of our assessments.

Changes in Future Demand

We assume that today’s costs, production amounts, and other activity levels hold steady. This is not likely to be the case, but predicting future demand introduces uncertainty, and we therefore do not factor it in. 

If demand for a solution grows in the future, this could mean that overall GHG emissions increase despite increased adoption. For example:

  • If overall global cement production increases, the total emissions of cement manufacturing could increase even as adoption of our Improve Cement Production solution grows.
  • If oil and gas production and use ramps up, overall emissions could increase, even if the Manage Oil and Gas Methane solution is adopted in higher quantities. This is an example of a solution where decreasing adoption could reflect a positive climate impact, if coupled with reduced oil and gas use.

This does not mean these solutions are not important to adopt. In fact, if climate-harming activities are increasing, the solutions become even more critical.

Quantification of Interactions

Although we acknowledge that solutions interact, we don’t quantify interactions for the most part. In reality, adoption of solutions and changes in the technology landscape will affect the adoption, effectiveness, and cost of solutions that target the same emissions, compete for the same resources, or rely on the development of similar technologies. 

Electricity Sector Baseline

Numerous technologies are used to generate electricity today. For Drawdown Explorer solutions that focus on electricity generation, we use a common baseline mix of global electricity generation based on an estimated annual energy output for each existing technology. We assume that the total generation by the global baseline mix is proportional to global annual emissions from electricity generation, which is not necessarily the case. We also assume a single emission factor for different classes of technologies using the same energy source (e.g., all types of wind energy generation).

One limitation to this approach is that we’re comparing new solutions with the typical way electricity is generated today. Since electricity technologies and costs vary from place to place, deeper analysis is often needed to support decisions in specific regions. Due to the challenges in estimating global baseline costs for electricity generation, we discuss some costs for individual technologies but don’t compare them with a global baseline.

Life-Cycle Considerations

Embodied emissions are greenhouse gas emissions accrued over the lifetime of a material or product. They are often attributed to other sectors, but they influence the overall climate impact of the technology. Examples include emissions produced by manufacturing cement used in transportation infrastructure, or the shipping of components used to assemble solar cells. We don’t quantify embodied emissions for most solutions, except for those specifically assessing embodied production emissions (e.g., Deploy Alternative Insulation Materials, Reduce Food Loss & Waste).

Another consideration in assessing the full life-cycle impact of a product-based solution is its disposal. We do not consider end-of-life emissions or costs in our assessment unless they are directly assessed by a particular solution (e.g., Improve Refrigerant Management).

Costs

Global average costs are hard to determine and don’t necessarily reflect real implementation. Local costs of most Drawdown Explorer solutions vary depending on energy generation technologies, supply chains, local resources, land conditions, and other factors. 

We don’t quantitatively include revenues from carbon credit systems (systems that create economic incentives to reduce GHG emissions) in our assessments because these markets tend to be volatile and are heavily influenced by policy. 

Geographic and Data Availability 

Our assessments are often limited by available data, and, outside of the Maps section, most offer broad global averages. Assessments are often skewed towards countries and regions with greater data access and availability, and may not represent a true global picture. 

Primer Updated: June 30, 2025