Cut Emissions Other Energy Cut Fugitive Emissions

Manage Oil & Gas Methane

Highly Recommended
Image
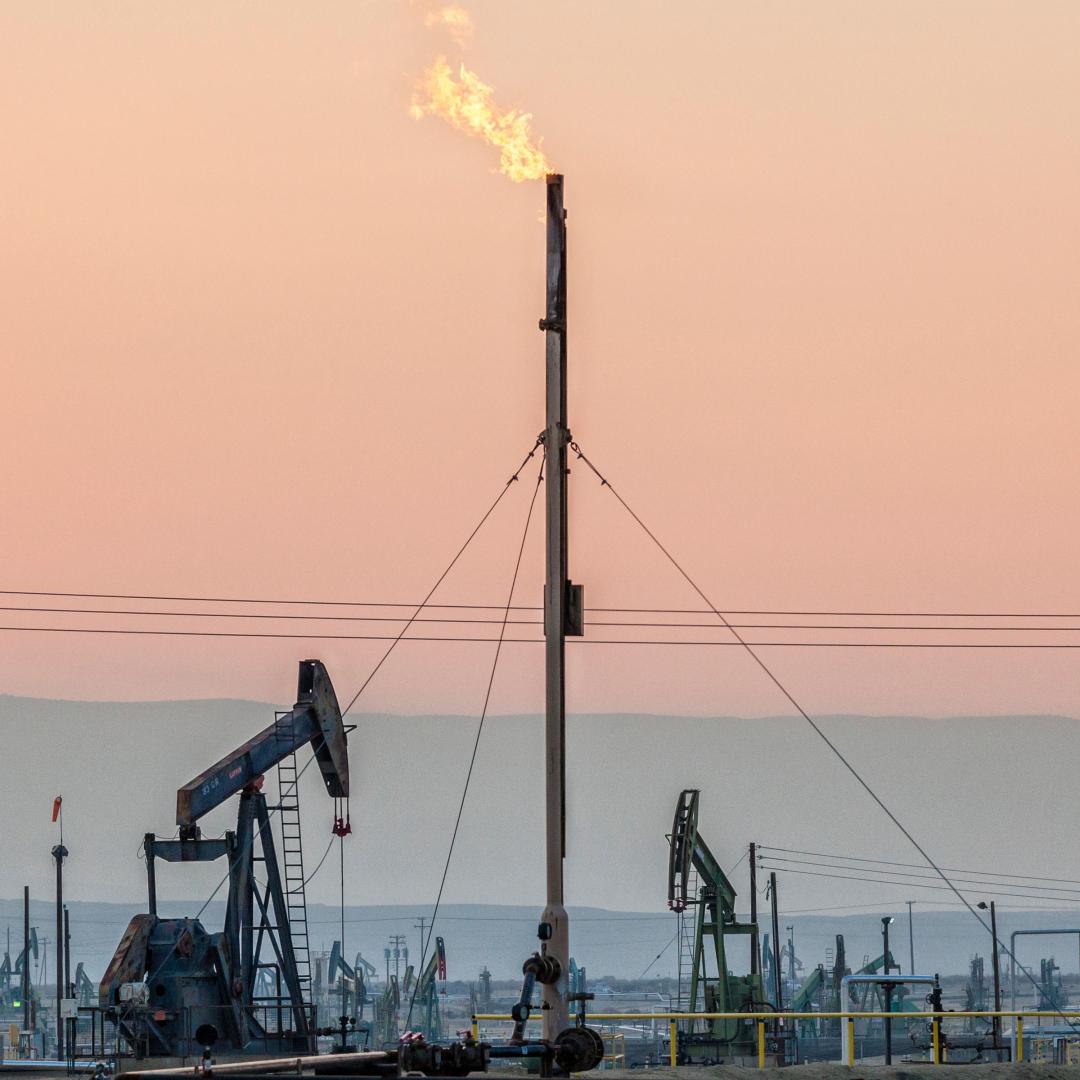
Oil wells and flame coming from flare stack

Oil and gas methane management is the process of reducing methane emissions from oil and gas (O&G) supply chains. These supply chains release methane when pipes and other system parts leak or methane is intentionally vented for operation and safety reasons. We define the Manage Oil & Gas Methane solution as adopting approaches to reduce methane emissions, including fixing leaks in components, upgrading control equipment, changing procedures, and destroying methane by burning methane as a fuel or in flares.

Last updated June 30, 2025

Solution Basics

Mt methane abated

tCO2-eq/unit
2.79×10⁷
units/yr
Current 03.268.84
Achievable (Low to High)

Climate Impact

GtCO2-eq/yr
Current 0 0.09 0.25
US$ per tCO2-eq
-6
Emergency Brake

CH₄

Additional Benefits

187
    183
  • 184
  • 185
  • 186
  • 187
  • 188
194

Overview

Oil and gas methane management is the process of reducing methane emissions from oil and gas (O&G) supply chains. These supply chains release methane when pipes and other system parts leak or methane is intentionally vented for operation and safety reasons. We define the Manage Oil & Gas Methane solution as adopting approaches to reduce methane emissions, including fixing leaks in components, upgrading control equipment, changing procedures, and destroying methane by burning methane as a fuel or in flares.

Impact Calculator

Adjust effectiveness and adoption using range sliders to see resulting climate impact potential.

Effectiveness

2.79×10⁷
t CO2-eq/Mt methane abated

Adoption

0
Mt methane abated
Low
3.26
High
8.84
0
current
Achievable Range

Climate Impact

0.000
Gt CO2-eq/yr (100-yr)
06 Gt
0.000%
of total global emissions*
*59.09 Gt CO2-eq/yr (100-yr basis)

Maps

Methane abatement is recommended for all oil and gas (O&G) production. The levels of achievable abatement can vary geographically, depending on the extraction technology used (i.e., conventional drilling versus hydraulic fracturing). The Middle East, Europe, Asia, and North America are among the largest O&G producers and have the highest related methane emissions, according to the IEA (2025). Research from Shindell et al. (2024) found that North America, Russia, and several countries in the Middle East and Africa have the most methane abatement potential in O&G. O&G methane abatement could be accelerated if technologies and strategies used in high-income countries are shared with other O&G producing countries.

Mt CO2–eq
< 50
50–100
100–200
200–300
> 300
Refining
Production
Transport

Annual emissions from oil and gas sources, 2024

Globally, oil and gas sources (production, refining, and transport) are responsible for 78 of the 347 Mt of anthropogenic methane emissions in 2023. This is equivalent to 2,106 Mt CO2-eq based on a 100-year time scale. Methane emissions occur throughout the supply chain due to equipment imperfections, leaks, and intentional venting.

International Energy Agency. (2024). Methane tracker: Data tools. https://www.iea.org/data-and-statistics/data-tools/methane-tracker

Schmeisser, L., Tecza, A., Huffman, M., Bylsma, S., Delang, M., Stanger, J., Conway, TJ, and Gordon, D. (2024). Fossil fuel operations sector: Oil and gas production and transport emissions [Data set]. RMI, Climate TRACE Emissions Inventory. Retrieved April 18, 2025 from https://climatetrace.org

Wang, J., Fallurin, J., Peltier, M., Conway, TJ, and Gordon, D. (2024). Fossil fuel operations sector: Refining emissions [Data set]. RMI, Climate TRACE Emissions Inventory. Retrieved April 18, 2025 from https://climatetrace.org

The Details

Current State

Methane can be unintentionally released due to imperfections and faults along the supply chain or intentionally released as part of operations and maintenance. Atmospheric methane has a GWP of 81 over a 20-yr time basis and a GWP of 28 over a 100-yr time basis (IPCC, 2023). This means methane is 81 times more effective at trapping heat than CO₂.  Because methane is a short-lived climate pollutant that has a much stronger warming effect than CO₂ over a given time period, abating methane will have a relatively large near-term impact on slowing global climate change (IEA, 2023b).

The first step to reduce methane releases from O&G production is to identify where releases occur along the supply chain. Many occur during O&G extraction as methane is either intentionally vented or unintentionally emitted. The International Energy Agency (IEA, 2024) estimated more than 60% of global energy-related methane emissions originated from the O&G sector in 2023, with the remaining emissions mostly coming from coal use and some bioenergy (Figure 1). The United Nations Environment Programme (UNEP) has formed a transparency and accountability initiative whose members are responsible for 42% of global O&G production. It reported that activities involved in exploration and processing of O&G accounted for 83% of total reported O&G emissions from 2020 to 2023, with production processes being responsible for 90% of those emissions (UNEP 2024). Alvarez et al. (2018) found that in the United States, more than 58% of O&G methane emissions came from production and about 20% came from extraction in 2015. 

Figure 1. Methane emissions (kt) from energy sources (IEA, 2025).

Source: International Energy Agency. (2025). Methane tracker: Data tools. https://www.iea.org/data-and-statistics/data-tools/methane-tracker 

O&G producers can reduce their methane emissions by preventing its release or by converting it to CO₂ through combustion. Strategies for reducing O&G methane emissions can be put into two broad categories (Climate & Clean Air Coalition [CCAC], 2021):

Device conversion, replacement, and installation is the practice of fixing leaks in pipes, valves, compressors, pumps, and other equipment. This can include converting natural gas–powered devices to electric, driving compressors/pneumatics with air instead of natural gas, or replacing emitting components with non-emitting ones (Pembina Institute, 2024).

Changes to operations and maintenance practices seek to reduce the intentional venting of methane. They include eliminating the need for blow-down (releasing gases during the maintenance or operation of pipe infrastructure), reducing venting, and capturing methane before it is released into the atmosphere, then using it as fuel for product refining or burning it to convert it into CO₂.

 Leak detection and repair (LDAR) is the practice of regularly monitoring for methane leaks and modifying or replacing leaking equipment. 

Each Mt of methane that is not emitted avoids 81.2 million t CO₂‑eq on a 20-yr basis and 27.9 million t CO₂‑eq on a 100-yr basis (Smith et al., 2021). The GWP of methane is shown in Table 1. If the methane is burned (converted into CO₂ ), the contribution to climate change will still be less than that of methane released directly into the atmosphere. Methane abatement can have a more immediate impact on future global temperature rise because it has a larger and faster warming effect than CO₂. Mitigating methane emissions in the near term can give us more time for reducing GHG emissions in hard to abate sectors.

Table 1. Effectiveness at reducing emissions.

Unit: t CO₂‑eq /Mt of methane abated

100-yr Global Warming Potential 27,900,000
20-yr Global Warming Potential 81,200,000

The cost of methane abatement will vary depending on the type of O&G production, the methane content of the O&G resource, and the strategies used to address it. We averaged the costs for various abatement strategies; methane content is sufficiently high to utilize methane abatement strategies, and energy infrastructure is available to utilize abated methane. The initial cost to abate 1 Mt of methane is US$594 million, the revenue is about US$193 million, and the overall net savings over a 30-yr amortization period is US$173 million. This means that reducing O&G methane emissions offers a net economic gain for O&G producers. We were not able to find operating cost information for the solution, meaning the net economic gain may be lower in practice. 

We considered the baseline scenario where O&G producers do not have systems or practices in place to monitor or stop methane from escaping to the atmosphere and found very limited cost data. We assumed baseline costs to be 0 for initial costs, operational costs, and revenue because current practices and infrastructure are releasing methane to the atmosphere as a part of their existing cost of doing business. 

Many of the initial cost data for methane abatement come from studies estimating how much capital would be required to reach methane emission targets for the O&G industry. These costs are for the global scale of O&G methane abatement and not from the point of view of an individual O&G producer. These studies do not go into detail about the cost of specific abatement strategies or their potential revenues. The context and assumptions are difficult to identify, since the abatement strategies must be tailored to each site. Ocko et al (2021) noted that most (around 80%) of economically feasible methane abatement actions are from the O&G sector. 

Table 2 shows the costs per t CO₂‑eq .The value of the methane sold, instead of released, will often bring in revenue that covers the costs of abatement. Refer to the Appendix for information on the proportion of strategies that O&G producers could implement at low to no cost.

Table 2. Net cost per unit of climate impact.

Unit: 2023 US$/t CO₂‑eq

median (100-yr basis) -6.20

Many of the technology solutions for reducing methane emissions are mature, and we were unable to find literature suggesting the costs to implement these solutions will fall in the future. There may be efficiencies to be gained in LDAR, but little research offers insights into the costs of LDAR programs (Delphi Group, 2017, ICF 2016). 

Speed of action refers to how quickly a climate solution physically affects the atmosphere after it is deployed. This is different from speed of deployment, which is the pace at which solutions are adopted.

At Project Drawdown, we define the speed of action for each climate solution as gradualemergency brake, or delayed.

Manage OIl & Gas Methane is an EMERGENCY BRAKE climate solution. It has the potential to deliver a more rapid impact than nominal and delayed solutions. Because emergency brake solutions can deliver their climate benefits quickly, they can help accelerate our efforts to address dangerous levels of climate change. For this reason, they are a high priority.

Adoption

We found little literature quantifying the current adoption of methane management; much of the methane abatement research revolves around the amount of methane that needs to be abated to reach certain climate targets. Based on data from Global Methane Initiative (GMI, 2024), 0 Mt of methane was abated in 2023 and is shown in Table 3.


GMI (2024) provided a conservative estimate of cumulative methane emissions abated each year, with a total of 153.6 Mt CO₂‑eq (5.51 Mt methane) abated as of 2023. The methane is given as a cumulative value to show the incremental increase in total methane abated and to avoid double counting methane abated. GMI members only cover 70% of human-caused methane emissions, and the organization does not capture methane mitigation that occurs outside of GMI members. This suggests that even in years where methane was abated, it would likely still be an underestimate of what may have actually occurred globally. The untapped potential for methane abatement suggests that O&G companies are investing in increasing natural gas production, which may be due to relatively smaller profits from abatement and nonbinding regulations (Shindell et al., 2024). 

Table 3. Current (2023) adoption level.

Unit: Mt of methane abated/yr

median (50th percentile) 0

Although there is little research specifically quantifying the adoption of methane abatement strategies over time, we estimate the average adoption trend in recent years to be about 0.35 Mt/yr of methane abated. To create this estimate, we relied on GMI analysis (GMI, 2024). GMI showed methane abatement gradually increasing from 2011 to 2023, then tapering off around 2020 and beginning to decrease among its member organizations. Table 4 shows the adoption trend for O&G methane abatement.

The IEA (2025) compiled country-level reporting for GHG emissions with data up to 2024. However, we were not able to use the data for the adoption trend because the changes in methane emissions could have been due to reasons other than methane abatement. In reality, methane emissions may be affected by multiple factors such as natural disasters, political conditions, changes in O&G demand, and changes in O&G industry practices.

Oil and Gas Climate Initiative (2023) data on methane abatement to date for 12 major O&G companies indicate that methane emissions decreased 50% from 2017 to 2022; however, we cannot assume the rest of the O&G industry has made the same level of progress. 

Table 4. Adoption trend, 2011–2022.

Unit: Mt methane abated/yr

median (50th percentile) 0.35

We found an adoption ceiling of 80.7 Mt/yr of methane based on the IEA’s (2025) estimate for total methane emissions from the O&G sector. We assumed that current O&G methane emissions would remain the same into the future with no changes in O&G production or demand. Table 5 shows the adoption ceiling for O&G methane abatement.

Even in the IEA’s (2023c) highest methane abatement energy scenario, only 93% of the methane emissions are reduced by 2050. This would still leave methane emissions being released into the atmosphere by the O&G sector. Reduced O&G production will reduce the amount of methane emissions produced by the O&G sector and consequently reduce the amount of methane that needs to be controlled with methane abatement. 

Table 5. Adoption ceiling.

Unit: Mt methane abated/yr

median (50th percentile) 80.7

Based on the limited data available for current adoption and adoption trend, we expect 3.26–8.84 Mt/yr of methane abated. The Achievable – Low value aligns with the IEA (2023c) baseline energy scenario (STEPS), in which partial methane abatement is used but not all technically possible methane is abated. The Achievable – High value aligns with the IEA (2023c) baseline scenario (STEPS), in which full methane abatement is employed (all technically possible methane is abated). We determined this range by taking the total methane abated in these scenarios and dividing by the difference between the target year and 2024 to determine an average amount of methane abated each year to reach the scenario target. Under both scenarios, reduced demand for O&G would reduce methane emissions produced and lower the adoption ceiling possible for methane abatement. Even in scenarios where there is reduced O&G demand, methane abatement would still be required to control fugitive methane emissions from O&G infrastructure and limit global climate change. 

The amount of methane that can be abated varies greatly depending on how much methane the O&G industry produces. If O&G production remains steady, cumulative methane abatement could be 21–81 Mt, according to the IEA energy scenarios. If O&G demand drops 80% (IEA’s Net Zero Emissions scenario), total methane emissions would decline to 18 Mt, and the use of methane abatement would reduce methane emissions further by 17 Mt, leaving only 1 Mt of methane emitted in 2050. 

There has been growing interest from governments and academia to more accurately identify methane emissions using technologies such as satellite sensing (MethaneSat, 2024); UNEP (2024) has set up a monitoring and operator’s alliance group that will share best practices among O&G producers. This alliance group has identified more than 1,200 methane releases, but only 15 responses from government or companies provided detail about the source of the emissions or whether any mitigation action was considered or taken. This shows there are still many opportunities to abate methane emissions. 

More than 150 countries (representing 50% of the world’s human-caused methane emissions) have joined the Global Methane Pledge to reduce methane emissions 30% from 2020 to 2030 (UNEP, 2021). The IEA (2023b) found that many governments already have announced or put into place measures to cut methane emissions, so we expect global methane abatement to grow. 

Conrad et al. (2023) found that the emission inventories reported by the Alberta, Canada, government underestimate the methane emissions from the O&G sector, with a large portion coming from venting. These sources of methane are relatively easier to address and can allow the O&G sector to quickly reduce methane emissions. Table 6 shows the statistical low and high achievable ranges for O&G methane abatement based on different sources for future uptake of O&G methane abatement.

Table 6. Achievable adoption.

Unit: Mt methane abated/yr

Current Adoption 0
Achievable – Low 3.26
Achievable – High 8.84
Adoption Ceiling 80.66

Impacts

We estimate that the O&G industry is currently abating approximately 0 Gt CO₂‑eq/yr on a 100-yr basis and 0 Gt CO₂‑eq/yr on a 20-yr basis using methane abatement strategies. 

As the O&G industry grows or shrinks its emissions, the amount of methane available to abate will change accordingly. If O&G demand and production stay constant to 2050, we estimate 0.09–0.25 Gt CO₂‑eq/yr of methane could be abated. 

However, if O&G demand drops, the methane abatement potential would drop because the O&G sector is producing less methane. This is projected in the different energy scenarios modeled by the IEA (2023). The range between the current O&G methane abatement and the adoption ceiling is shown in Table 7.

Table 7. Climate impact at different levels of adoption.

Unit: Gt CO₂‑eq/yr, 100-yr basis

Current Adoption 0
Achievable – Low 0.09
Achievable – High 0.25
Adoption Ceiling 2.25

Air pollution and health

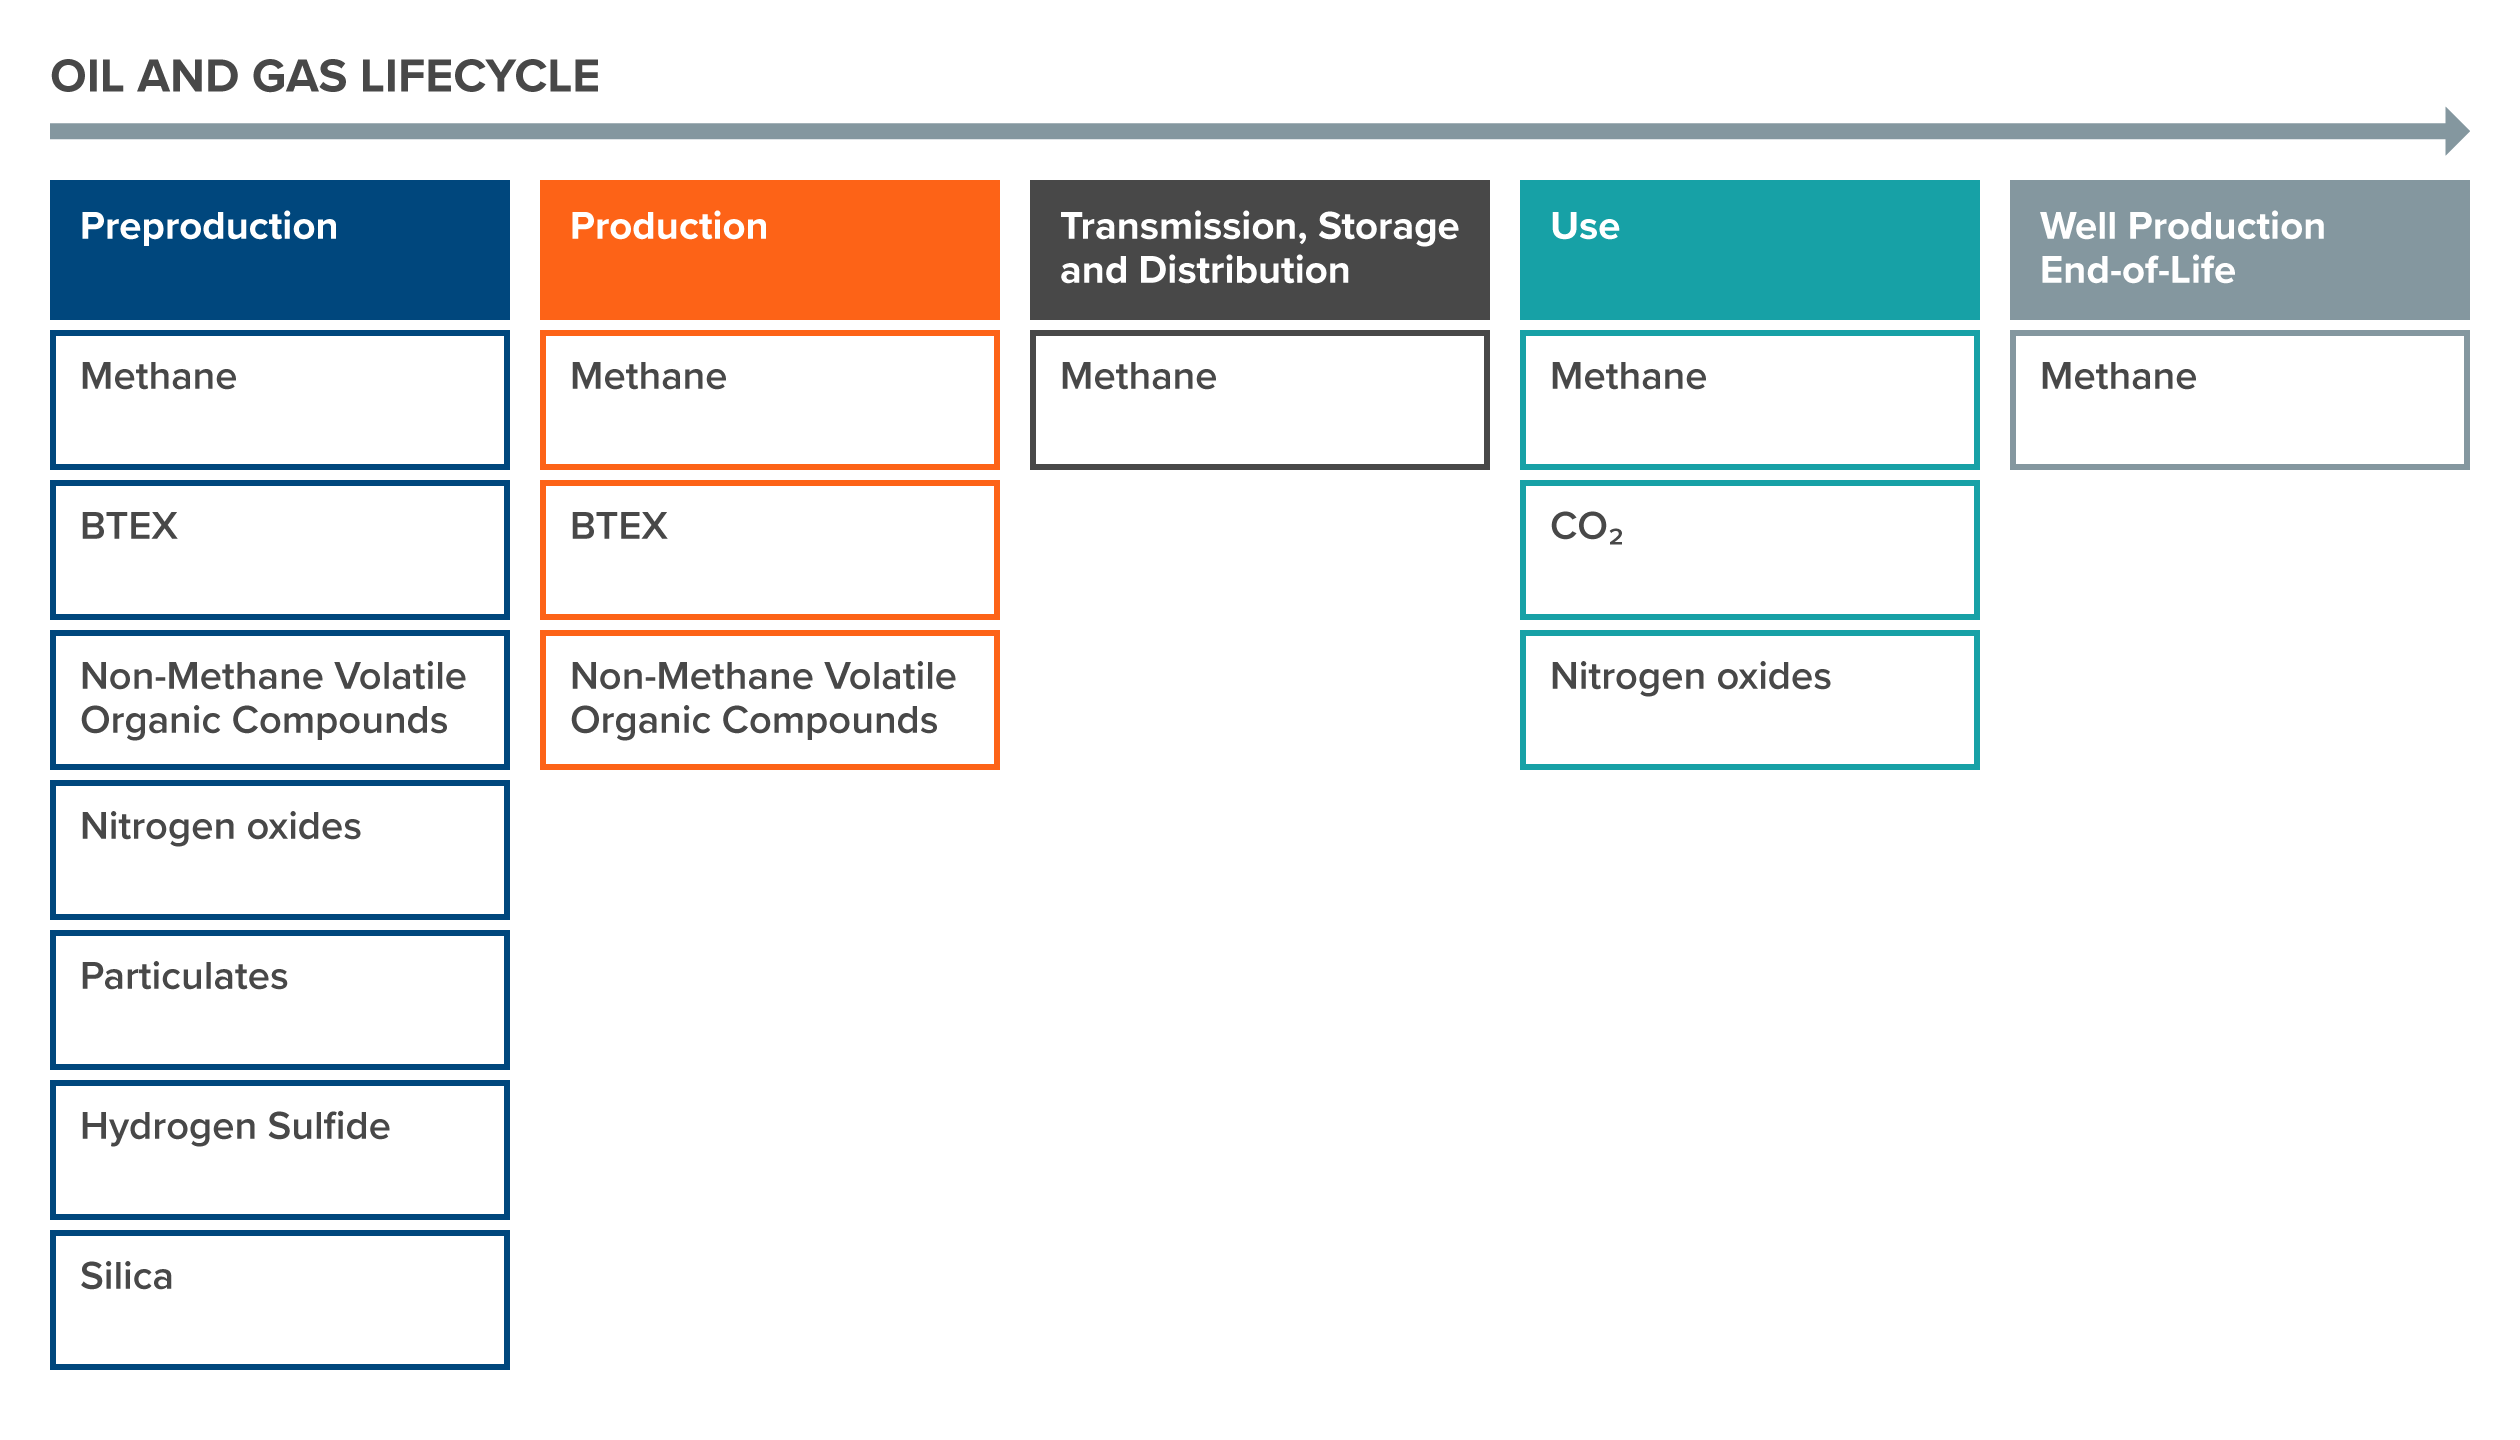
Methane reacts with other pollutants to create ground-level ozone (Mar et al., 2022), and incomplete combustion of methane releases CO₂, carbon monoxide, black carbon, and other pollutants such as volatile organic compounds (Fawole et al., 2016; Johnson and Coderre, 2012; Motte et al., 2021). These pollutants cause respiratory, reproductive, and neurological diseases; cancer; and premature death (Michanowicz et al., 2021; Motte et al., 2021; Tran et al., 2024), so reducing methane release can improve human health. Reducing or stopping flaring at a small number of the largest active sites can significantly reduce air pollution (Anejionu et al., 2015; Johnson and Coderre, 2012). Van Dingenen et al. (2018) estimate that ambitious methane reduction could prevent 70,000 to 130,000 ozone-related deaths worldwide each year.

Figure 2. Air pollutants emitted along the O&G life cycle (Moore et al., 2014). BTEX = benzene, toluene, ethylbenzene, xylene.

Image
Diagram listing air pollutants emitted along the oil and gas life cycle

Source: Moore, C. W., Zielinska, B., Pétron, G., & Jackson, R. B. (2014). Air impacts of increased natural gas acquisition, processing, and use: A critical review. Environmental Science & Technology48(15), 8349–8359. https://doi.org/10.1021/es4053472

Food security

Methane reacts with chemicals like VOCs to form tropospheric, or ground-level ozone (Fiore et al., 2002). Ground-level ozone has been linked to reduced crop growth and yields (Mills et al., 2018; Samperdo et al., 2023; Tai et al., 2021). Mitigating methane emissions from O&G could improve food security by reducing ground-level ozone and its harmful impacts on agricultural productivity (Tai et al., 2014; Ramya et al., 2023)

Other

Burning methane produces CO₂. Though the GWP is far less than that of releasing methane into the atmosphere, the practice still creates a negative climate impact. Depending on the type of O&G production, methane abatement is already practiced with natural gas production and is likely to bring additional profit. However, oil producers who are not already producing methane for profit may not be able to abate methane at a profit. 

Avoiding fossil fuel extraction, transport, and use is the only way to permanently reduce emissions from O&G production. For many low- and middle-income countries (LMICs), O&G is the main source of energy, and it is challenging for them to completely eliminate O&G from their energy mix while they are simultaneously working to improve living standards. High-income countries can help LMICs develop clean energy infrastructure by providing financial and technological support. This will prevent new investments in O&G infrastructure (Laan, et al., 2024), which would result in ongoing emissions for decades. It would also allow LMICs a realistic pathway to transition away from their existing O&G usage. O&G demand must fall by 80% between 2022 and 2050 to stay in alignment with the net-zero emissions scenarios modeled by IEA (2023c). O&G methane abatement will decrease over time as the O&G industry produces less methane to be abated.

Our assessment does not include the impact of the CO₂ created from the destruction of methane.

If natural gas prices drop there would be less economic reason for industries to voluntarily abate methane (IEA, 2021). Without policy support enforcing the use of methane abatement technologies, methane could continue to be released into the atmosphere. The use of methane abatement will be needed regardless of whether O&G demand remains the same or decreases over time because it has an immediate effect on reducing global temperature rise in the near term.

Methane abatement could increase the use of O&G resources without a broader strategy to reduce reliance on O&G as an energy resource. The use of methane abatement strategies to extend the use of existing O&G infrastructure, or building new O&G infrastructure, will not result in a net decrease in emissions. Beck et al. (2020) found that more than 57% of the GHG emissions from the O&G supply chain are from methane emissions, while the rest is due to CO₂ emissions (15% from the extraction process and 28% from O&G energy use). Even with methane mitigation, continued use of O&G will generate CO₂ emissions and will contribute to global temperature rise. 

Reinforcing

Managing O&G methane can reinforce other solutions that reduce the amount of methane released to the atmosphere. The use of solutions such as applying changes to operations and maintenance; converting, replacing, and installing devices; and LDAR in the O&G industry can help demonstrate the effectiveness and economic case for methane abatement elsewhere and build momentum for adoption of methane abatement in other sectors. 

Competing

Managing O&G methane has the potential to compete with solutions that provide clean electricity and solutions that focus on fuel switching in transportation because this solution increases O&G supply and can reduce the cost of O&G products. As a result, it could prolong the use of fossil fuels and slow down the transition to clean electricity.

Consensus of effectiveness of abating methane emissions in the O&G sector: High

There is a high level of consensus about the effectiveness of methane abatement strategies. These strategies can be deployed cost effectively in many cases and have an immediate impact on reducing global temperature rise. 

Authoritative sources such as the IEA (2023d), UNEP (2021), and Global Methane Hub (2024) agree that reducing methane emissions can noticeably reduce the rate of global temperature rise. DeFabrizio et al. (2021) identified that methane abatement strategies such as LDAR, switching from natural gas fuel to electric power, using air for pneumatic devices, and using vapor recovery units could reduce O&G methane emissions by 40% by 2030 based on global 2017 O&G emissions. With methane being the second largest contributor to climate change after CO₂, reductions in methane emissions can quickly reduce global temperature rise.

Others (Marks Levi, 2022; DeFabrizio et al., 2021; Malley et al., 2023) have identified that many methane abatement strategies can use existing technologies, often at low cost. Dunsky (2023) found that implementing 24 of the least expensive abatement measures in the exploration and production phases of Canada’s O&G industry could help Canada achieve its 2030 methane target. The IEA (2023a) noted that the O&G industry was responsible for 80 Mt of methane in 2022 and had the largest potential for abatement in the near term. The O&G industry has the potential to abate 60 Mt of methane by 2030 using abatement strategies; 40% of that could be abated at no net cost based on average natural gas prices from 2017 to 2021 (IEA, 2023a).

The results presented in this document summarize findings from more than 15 reviews and meta-analyses and more than 10 original studies reflecting current evidence from two countries, primarily from the United States and Canada, and from global sources. We recognize this limited geographic scope creates bias, and hope this work inspires research and data-sharing on this topic in underrepresented regions.

Take Action

Looking to get involved? Below are some key actions for this solution that can get you started, arranged according to different roles you may play in your professional or personal life.

These actions are meant to be starting points for involvement and are not intended to be prescriptive or necessarily suggest they are the most important or impactful actions to take. We encourage you to explore and get creative!

Lawmakers and Policymakers

  • Hold well owners accountable for harm caused to the public and environment.
  • Introduce performance goals for emissions reductions.
  • Use economic measures such as taxes or financial incentives.
  • Regulate key aspects of abatement, such as the use of LDAR, and enforce existing regulations.
  • Utilize data-driven public information programs such as collecting and publishing monitoring and reporting data (“naming and shaming”).
  • Distribute information to operators, such as technology options that fit relevant regulations. 

Practitioners

  • Shift business models toward 100% renewable energy.
  • Detect and repair methane leaks.
  • Implement device conversion, replacement, and installation and LDAR.
  • Change operations and maintenance practices to reduce or recover vented methane.
  • Implement zero-tolerance policies for methane leaks.
  • Increase transparency on emissions and practices.
  • Join cross-company and industry coalitions that facilitate implementation.

Business Leaders

  • Eliminate major methane O&G emitters in your value chains or pressure them to improve performance.
  • Create a plan to transition to renewable energy.
  • Center methane in net-zero strategies, such as establishing internal methane pricing mechanisms and requiring suppliers to meet standards for monitoring and reducing methane emissions in your operations.
  • Identify technology partners that are monitoring and reducing methane emissions and make market commitments.
  • If your company is participating in the voluntary carbon market, look into funding projects that plug methane leaks.
  • Proactively collaborate with government and regulatory actors to support methane abatement policies.
  • Join or support transparency initiatives led by trusted third parties, such as the Oil and Gas Methane Partnership 2.0.

Nonprofit Leaders

  • Help with monitoring and reporting by, for example, utilizing satellite data.
  • Help design policies and regulations that support methane abatement.
  • Educate the public on the urgent need to abate methane.
  • Join or support efforts such as the Global Methane Alliance.
  • Encourage policymakers to create ambitious targets and regulations.
  • Pressure O&G companies to improve their practices.
  • Take or support legal action when companies do not follow relevant regulations.
  • Work with journalists and the media to support public education on the importance of methane abatement.

Investors

  • Pressure and influence portfolio companies to incorporate methane abatement into their operations, noting that this saves money and adds value for investors.
  • Provide capital for nascent methane abatement strategies and leak detection and monitoring instruments.
  • Invest in green bonds and other financial instruments that support methane abatement projects.
  • Seek impact investment opportunities such as sustainability-linked loans in entities that set methane abatement targets.
  • Invest in projects that plug methane leaks. 

Philanthropists and International Aid Agencies

  • Provide capital for methane monitoring, de-risking, and abatement in the early stages of implementation.
  • Support global, national, and local policies that reduce methane emissions.
  • Support accelerators or multilateral initiatives like the Global Methane Hub.
  • If working in a fossil fuel–producing nation, support sustainable developments in other sectors of the economy.
  • Explore opportunities to fund the plugging of abandoned oil or gas wells that leak methane.
  • Advance awareness of the public health and climate threats from the O&G industry. 

Thought Leaders

  • Provide technical assistance (e.g., monitoring and reporting) to businesses, government agencies, and other entities working to reduce methane emissions.
  • Help design policies and regulations that support methane abatement.
  • Analyze historical emissions patterns to identify and publicize successful programs.
  • Educate the public on the urgent need to abate methane.
  • Join or support joint efforts such as the Global Methane Alliance.
  • Advocate to policymakers for more ambitious targets and regulations.
  • Pressure O&G companies to improve their practices.

Technologists and Researchers

  • Develop new LDAR technologies that reduce cost and required capacity.
  • Develop new technologies for measuring and verifying emissions.
  • Conduct longitudinal studies to measure emissions against objectives or means of enforcement. 

Communities, Households, and Individuals

  • If you are impacted by harmful O&G methane management practices, document your experiences.
  • Reduce household consumption of fossil fuels by adopting clean energy sources, increasing energy efficiency, and replacing fossil fuel-powered equipment with electricity-powered equipment.
  • Share documentation of harmful practices and/or other key messages with policymakers, the press, and the public.
  • Encourage policymakers to improve regulations.
  • Support public education efforts on the urgency and need to address the issue.

References

Alvarez, R., Zavala-Araiza, D., Lyon, D. R., Allen, D. T., Barkley, Z. B., Brandt, A. R., Davis, K. J., Herndon, S. C., Jacob, D. J., Karion, A., Kort, E. A., Lamb, B. K., Lauvaux, T., Maasakkers, J. D., Marchese, A. J., Omara, M., Pacala, S. W., Peischl, J., Robinson, A. L., Shepson, P. B., Sweeney, C., Townsend-Small, A., Wofsy, S. C., & Hamburg, S. P. (2018). Assessment of methane emissions from the U.S. oil and gas supply chain. Science, 361(6398), 186-188. https://doi.org/10.1126/science.aar7204 

Anejionu, O. C., Whyatt, J. D., Blackburn, G. A., & Price, C. S. (2015). Contributions of gas flaring to a global air pollution hotspot: spatial and temporal variations, impacts and alleviation. Atmospheric Environment, 118, 184-193. https://doi.org/10.1016/j.atmosenv.2015.08.006 

Beck, C., Rashidbeigi, S., Roelofsen, O., & Speelman, E. (2020). The future is now: how oil and gas companies can decarbonize. McKinsey & Companyhttps://www.mckinsey.com/industries/oil-and-gas/our-insights/the-future-is-now-how-oil-and-gas-companies-can-decarbonize 

Carbon Limits. (2014). Quantifying cost-effectiveness of systematic leak detection and repair program using infrared cameras. https://www.catf.us/resource/quantifying-cost-effectiveness-ldar/ 

Clean Air Task Force. (2022). Fossil fumes (2022 update): A public health analysis of toxic air pollution from the oil and gas industry. https://www.catf.us/resource/fossil-fumes-public-health-analysis/ 

Climate & Clean Air Coalition. (2021). Global methane assessment: Summary for decision makers. https://www.ccacoalition.org/resources/global-methane-assessment-summary-decision-makers 

Climate & Clean Air Coalition. (n.d.). Methane. Retrieved July 19, 2024. https://www.ccacoalition.org/short-lived-climate-pollutants/methane#:~:text=While%20methane%20does%20not%20cause,rise%20in%20tropospheric%20ozone%20levels

Climateworks Foundation. (2024). Reducing methane emissions on a global scale. https://climateworks.org/blog/reducing-methane-emissions-on-a-global-scale/ 

Conrad, B. M., Tyner, D. R., Li, H. Z., Xie, D. & Johnson, M. R. (2023). A measurement-based upstream oil and gas methane inventory for Alberta, Canada reveals higher emissions and different sources than official estimates. Earth & Environmenthttps://doi.org/10.1038/s43247-023-01081-0 

DeFabrizio, S., Glazener, W., Hart, C., Henderson, K., Kar, J., Katz, J., Pratt, M. P., Rogers, M., Ulanov, A., & Tryggestad, C. (2021). Curbing methane emissions: How five industries can counter a major climate threat. McKinsey Sustainabilityhttps://www.mckinsey.com/~/media/mckinsey/business%20functions/sustainability/our%20insights/curbing%20methane%20emissions%20how%20five%20industries%20can%20counter%20a%20major%20climate%20threat/curbing-methane-emissions-how-five-industries-can-counter-a-major-climate-threat-v4.pdf 

Dunsky. (2023, July 21). Canada’s methane abatement opportunity. https://dunsky.com/project/methane-abatement-opportunities-in-the-oil-gas-extraction-sector/ 

Fawole, O. G., Cai, X. M., & MacKenzie, A. R. (2016). Gas flaring and resultant air pollution: A review focusing on black carbon. Environmental pollution216, 182-197. https://doi.org/10.1016/j.envpol.2016.05.075 

Fiore, A. M., Jacob, D. J., & Field, B. D. (2002). Linking ozone pollution and climate change: The case for controlling methane. Geophysical Research Letters29(19), 182-197. https://doi.org/10.1029/2002GL015601 

Giwa, S. O., Nwaokocha, C. N., Kuye, S. I., & Adama, K. O. (2019). Gas flaring attendant impacts of criteria and particulate pollutants: A case of Niger Delta region of Nigeria. Journal of King Saud University-Engineering Sciences31(3), 209-217. https://doi.org/10.1016/j.jksues.2017.04.003 

Global Energy Monitor (2024). Global Methane Emitters Tracker [Data set, September 2024 release]. Retrieved April 18, 2025 from https://globalenergymonitor.org/projects/global-methane-emitters-tracker/ 

Global Methane Initiative (2019). GMI methane data EPA [Data set]. https://www.globalmethane.org/methane-emissions-data.aspx 

Global Methane Initiative (2024). 2023 Accomplishments in methane mitigation, recovery, and use through U.S.-supported international efforts. https://www.epa.gov/gmi/us-government-global-methane-initiative-accomplishments 

Global Methane Pledge. (n.d.). Global methane pledge. Retrieved August 16, 2024 from https://www.globalmethanepledge.org/ 

Guarin, J. R., Jägermeyr, J., Ainsworth, E. A., Oliveira, F. A., Asseng, S., Boote, K., ... & Sharps, K. (2024). Modeling the effects of tropospheric ozone on the growth and yield of global staple crops with DSSAT v4. 8.0. Geoscientific Model Development17(7), 2547-2567. https://doi.org/10.5194/gmd-17-2547-2024 

Hong, C., Mueller, N. D., Burney, J. A., Zhang, Y., AghaKouchak, A., Moore, F. C., Qin, Y., Tong, D., & Davis, S. J. (2020). Impacts of ozone and climate change on yields of perennial crops in California. Nature Food1(3), 166-172. https://doi.org/10.1038/s43016-020-0043-8 

ICF International. (2016). Economic analysis of methane emission reduction potential from natural gas systems. https://onefuture.us/wp-content/uploads/2018/05/ONE-Future-MAC-Final-6-1.pdf 

Intergovernmental Panel on Climate Change (IPCC). (2023). In: Climate change 2023: Synthesis report. Contribution of working groups I, II and III to the sixth assessment report of the intergovernmental panel on climate change [core writing team, H. Lee and J. Romero (eds.)]. IPCC, Geneva, Switzerland, pp. 1-34, doi: 10.59327/IPCC/AR6-9789291691647.001 https://www.ipcc.ch/report/ar6/syr/ 

International Energy Agency. (2021). Global methane tracker 2021: Methane abatement and regulation. https://www.iea.org/reports/methane-tracker-2021/methane-abatement-and-regulation 

International Energy Agency. (2023a). Financing reductions in oil and gas methane emissions. https://www.iea.org/reports/financing-reductions-in-oil-and-gas-methane-emissions 

International Energy Agency. (2023b). Net zero roadmap: A global pathway to keep the 1.5℃ goal in reach - 2023 update. https://www.iea.org/reports/net-zero-roadmap-a-global-pathway-to-keep-the-15-0c-goal-in-reach 

International Energy Agency. (2023c). The imperative of cutting methane from fossil fuels. https://www.iea.org/reports/the-imperative-of-cutting-methane-from-fossil-fuels 

International Energy Agency. (2023d). World energy outlook 2023. https://www.iea.org/reports/world-energy-outlook-2023 

International Energy Agency. (2025). Methane tracker: Data tools. https://www.iea.org/data-and-statistics/data-tools/methane-tracker 

Ismail, O. S., & Umukoro, G. E. (2012). Global impact of gas flaring. Energy and Power Engineering4(4), 290-302. http://dx.doi.org/10.4236/epe.2012.44039 

Johnson, M. R., & Coderre, A. R. (2012). Opportunities for CO₂ equivalent emissions reductions via flare and vent mitigation: A case study for Alberta, Canada. International Journal of Greenhouse Gas Control8, 121-131. https://doi.org/10.1016/j.ijggc.2012.02.004 

Laan, T., Do, N., Haig, S., Urazova, I., Posada, E., & Wang, H. (2024). Public financial support for renewable power generation and integration in the G20 countries. International Institute for Sustainable Developmenthttps://www.iisd.org/system/files/2024-09/renewable-energy-support-g20.pdf 

Malley, C. S., Borgford-Parnell, N. Haeussling, S., Howard, L. C., Lefèvre E. N., & Kuylenstierna J. C. I. (2023). A roadmap to achieve the global methane pledge. Environmental Research: Climate, 2(1). https://doi.org/10.1088/2752-5295/acb4b4 

Mar, K. A., Unger, C., Walderdorff, L., & Butler, T. (2022). Beyond CO₂ equivalence: The impacts of methane on climate, ecosystems, and health. Environmental Science & Policy134, 127-136. https://doi.org/10.1016/j.envsci.2022.03.027 

Marks, L. (2022). The abatement cost of methane emissions from natural gas production. Journal of the Association of Environmental and Resource Economists, 9(2). https://doi.org/10.1086/716700 

Methane Guiding Principles Partnership. (n.d.). Reducing methane emissions on a global scale. Retrieved August 16, 2024 from https://methaneguidingprinciples.org/ 

MethaneSAT. (2024). Solving a crucial climate challenge. Retrieved September 2, 2024 https://www.methanesat.org/satellite/ 

Michanowicz, D. R., Lebel, E. D., Domen, J. K., Hill, L. A. L., Jaeger, J. M., Schiff, J. E., Krieger, E. M., Banan, Z., Goldman, J. S. W., Nordgaard, C. L., & Shonkoff, S. B.C. (2021). Methane and health-damaging air pollutants from the oil and gas sector: Bridging 10 years of scientific understanding. PSE Healthy Energyhttps://www.psehealthyenergy.org/work/methane-and-health-damaging-air-pollutants-from-oil-and-gas/ 

Mills, G., Sharps, K., Simpson, D., Pleijel, H., Frei, M., Burkey, K., Emberson, L., Cuddling, J., Broberg, M., Feng, Z., Kobayashi, K. & Agrawal, M. (2018). Closing the global ozone yield gap: Quantification and cobenefits for multistress tolerance. Global Change Biology24(10), 4869-4893. https://doi.org/10.1111/gcb.14381 

Moore, C. W., Zielinska, B., Pétron, G., & Jackson, R. B. (2014). Air impacts of increased natural gas acquisition, processing, and use: A critical review. Environmental Science & Technology48(15), 8349–8359. https://doi.org/10.1021/es4053472

Motte, J., Alvarenga, R. A., Thybaut, J. W., & Dewulf, J. (2021). Quantification of the global and regional impacts of gas flaring on human health via spatial differentiation. Environmental Pollution291, 118213. https://doi.org/10.1016/j.envpol.2021.118213 

National Atmospheric and Ocean Agency (2024). Carbon cycle greenhouse gases in CH₄ . Retrieved July 19, 2024. https://gml.noaa.gov/ccgg/trends_ch4/

Ocko, I. B., Sun, T., Shindell, D., Oppenheimer, M. Hristov, A. N., Pacala, S. W., Mauzerall, D. L., Xu, Y. & Hamburg, S. P. (2021). Acting rapidly to deploy readily available methane mitigation measures by sector can immediately slow global warming. Environmental Research, 16(5). https://doi.org/10.1088/1748-9326/abf9c8 

Odjugo, P. A. O. & Osemwenkhae, E. J. (2009). Natural gas flaring affects microclimate and reduces maize (Zea mays) yield.. International Journal of Agriculture and Biology11(4), 408-412. https://www.cabidigitallibrary.org/doi/full/10.5555/20093194660

Oil and Gas Climate Initiative. (2023). Building towards net zero. https://www.ogci.com/progress-report/building-towards-net-zero 

Olczak, M., Piebalgs, A., & Balcombe, P. (2023). A global review of methane policies reveals that only 13% of emissions are covered with unclear effectiveness. One Earth, 6(5), 519–535. https://doi.org/10.1016/j.oneear.2023.04.009

Pembina Institute. (2024). Comments on environment and climate change Canada’s (ECCC) regulations amending the regulations respecting reduction in the release of methane and certain volatile organic compounds (upstream oil and gas sector). https://www.pembina.org/reports/2024-02-joint-methane-submission-eccc.pdf 

Project Drawdown. (2021). Climate solutions at work. https://drawdown.org/publications/climate-solutions-at-work 

Project Drawdown. (2022). Legal job function action guide. https://drawdown.org/programs/drawdown-labs/job-function-action-guides/legal 

Project Drawdown. (2023). Government relations and public policy job function action guide. https://drawdown.org/programs/drawdown-labs/job-function-action-guides/government-relations-and-public-policy 

Project Drawdown. (2024, May 29). Unsung (climate) hero: The business case for curbing methane | presented by Stephan Nicoleau [video]. YouTube. https://www.youtube.com/watch?v=Y5y0i-RMfJ0 

Ramya, A., Dhevagi, P., Poornima, R., Avudainayagam, S., Watanabe, M., & Agathokleous, E. (2023). Effect of ozone stress on crop productivity: A threat to food security. Environmental Research, 236(2), 116816. https://doi.org/10.1016/j.envres.2023.116816 

Ravikumar, A. P., & Brandt, A. R. (2017). Designing better methane mitigation policies: The challenge of distributed small sources in the natural gas sector. Environmental Research Letters, 12(4), 044023. https://doi.org/10.1088/1748-9326/aa6791

Rissman, J. (2021). Benefits of the build back better act’s methane fee. Energy Innovation. https://energyinnovation.org/wp-content/uploads/2021/10/Benefits-of-the-Build-Back-Better-Act-Methane-Fee.pdf 

Sampedro, J., Waldhoff, S., Sarofim, M., & Van Dingenen, R. (2023). Marginal damage of methane emissions: Ozone impacts on agriculture. Environmental and Resource Economics84(4), 1095-1126. https://doi.org/10.1007/s10640-022-00750-6 

Schiffner, D., Kecinski, M., & Mohapatra, S. (2021). An updated look at petroleum well leaks, ineffective policies and the social cost of methane in Canada’s largest oil-producing province. Climatic Change, 164(3-4). https://doi.org/10.1007/s10584-021-03044-w

Shindell, D., Sadavarte, P., Aben, I., Bredariol, T. O., Dreyfus, G., Höglund-Isaksson, L., Poulter, B., Saunois, M., Schmidt, G. A., Szopa, S., Rentz, K., Parsons, L., Qu, Z., Faluvegi, G., & Maasakkers, J. D. (2024). The methane imperative. Frontiershttps://www.frontiersin.org/journals/science/articles/10.3389/fsci.2024.1349770/full

Schmeisser, L., Tecza, A., Huffman, M., Bylsma, S., Delang, M., Stanger, J., Conway, TJ, and Gordon, D. (2024). Fossil Fuel Operations Sector: Oil and Gas Production and Transport Emissions [Data set]. RMI, Climate TRACE Emissions Inventory. Retrieved April 18, 2025 from https://climatetrace.org 

Smith, C., Nicholls, Z. R. J., Armour, K., Collins, W., Forster, P., Meinshausen, M., Palmer, M. D., & Watanabe, M. (2021). The earth’s energy budget, climate feedbacks, and climate sensitivity supplementary material (climate change 2021: The physical science basis. Contribution of working group I to the sixth assessment report of the Intergovernmental Panel on Climate Change). Intergovernmental Panel on Climate Change (IPCC). https://www.ipcc.ch/ 

Tai, A. P., Sadiq, M., Pang, J. Y., Yung, D. H., & Feng, Z. (2021). Impacts of surface ozone pollution on global crop yields: Comparing different ozone exposure metrics and incorporating co-effects of CO₂.  Frontiers in Sustainable Food Systems5, 534616. https://doi.org/10.3389/fsufs.2021.534616 

Tradewater. (2023). Methane. Retrieved August 16, 2024, from https://www.ogci.com/progress-report/building-towards-net-zero 

Tran, H., Polka, E., Buonocore, J. J., Roy, A., Trask, B., Hull, H., & Arunachalam, S. (2024). Air quality and health impacts of onshore oil and gas flaring and venting activities estimated using refined satellite‐based emissions. GeoHealth8(3), e2023GH000938. https://doi.org/10.1029/2023GH000938 

UN Environment Program. (2021). Global methane assessment: Benefits and costs of mitigating methane emissions. https://www.unep.org/resources/report/global-methane-assessment-benefits-and-costs-mitigating-methane-emissions 

UN Environment Program. (2024). An eye on methane: Invisible but not unseen. https://www.unep.org/interactives/eye-on-methane-2024/ 

U.S. Department of Commerce, Commercial Law Development Programme. (2023). Methane abatement for oil and gas - handbook for policymakers. https://cldp.doc.gov/sites/default/files/2023-09/CLDP%20Methane%20Abatement%20Handbook.pdf

U.S. Energy Information Administration. (2024). What countries are the top producers and consumers of oil?. https://www.eia.gov/tools/faqs/faq.php?id=709&t=6

U.S. Environmental Protection Agency. (2019). Global non-CO₂ greenhouse gas emission projections & mitigation 2015 - 2050https://www.epa.gov/ozone-layer-protection/transitioning-low-gwp-alternatives-residential-and-commercial-air

Van Dingenen, R., Crippa, M., Maenhout, G., Guizzardi, D., & Dentener, F. (2018). Global trends of methane emissions and their impacts on ozone concentrations. Joint Research Commission (European Commission)https://op.europa.eu/en/publication-detail/-/publication/c40e6fc4-dbf9-11e8-afb3-01aa75ed71a1/language-en

Wang, J., Fallurin, J., Peltier, M., Conway, TJ, and Gordon, D. (2024). Fossil Fuel Operations Sector: Refining Emissions [Data set]. RMI, Climate TRACE Emissions Inventory. Retrieved April 18, 2025 from https://climatetrace.org

World Bank Group. (2023). What you need to know about abatement costs and decarbonizationhttps://www.worldbank.org/en/news/feature/2023/04/20/what-you-need-to-know-about-abatement-costs-and-decarbonisation 

World Bank Group. (2024). Global flaring and methane reduction partnership (GFMR). Retrieved August 16, 2024, from https://www.worldbank.org/en/programs/gasflaringreduction 

Appendix

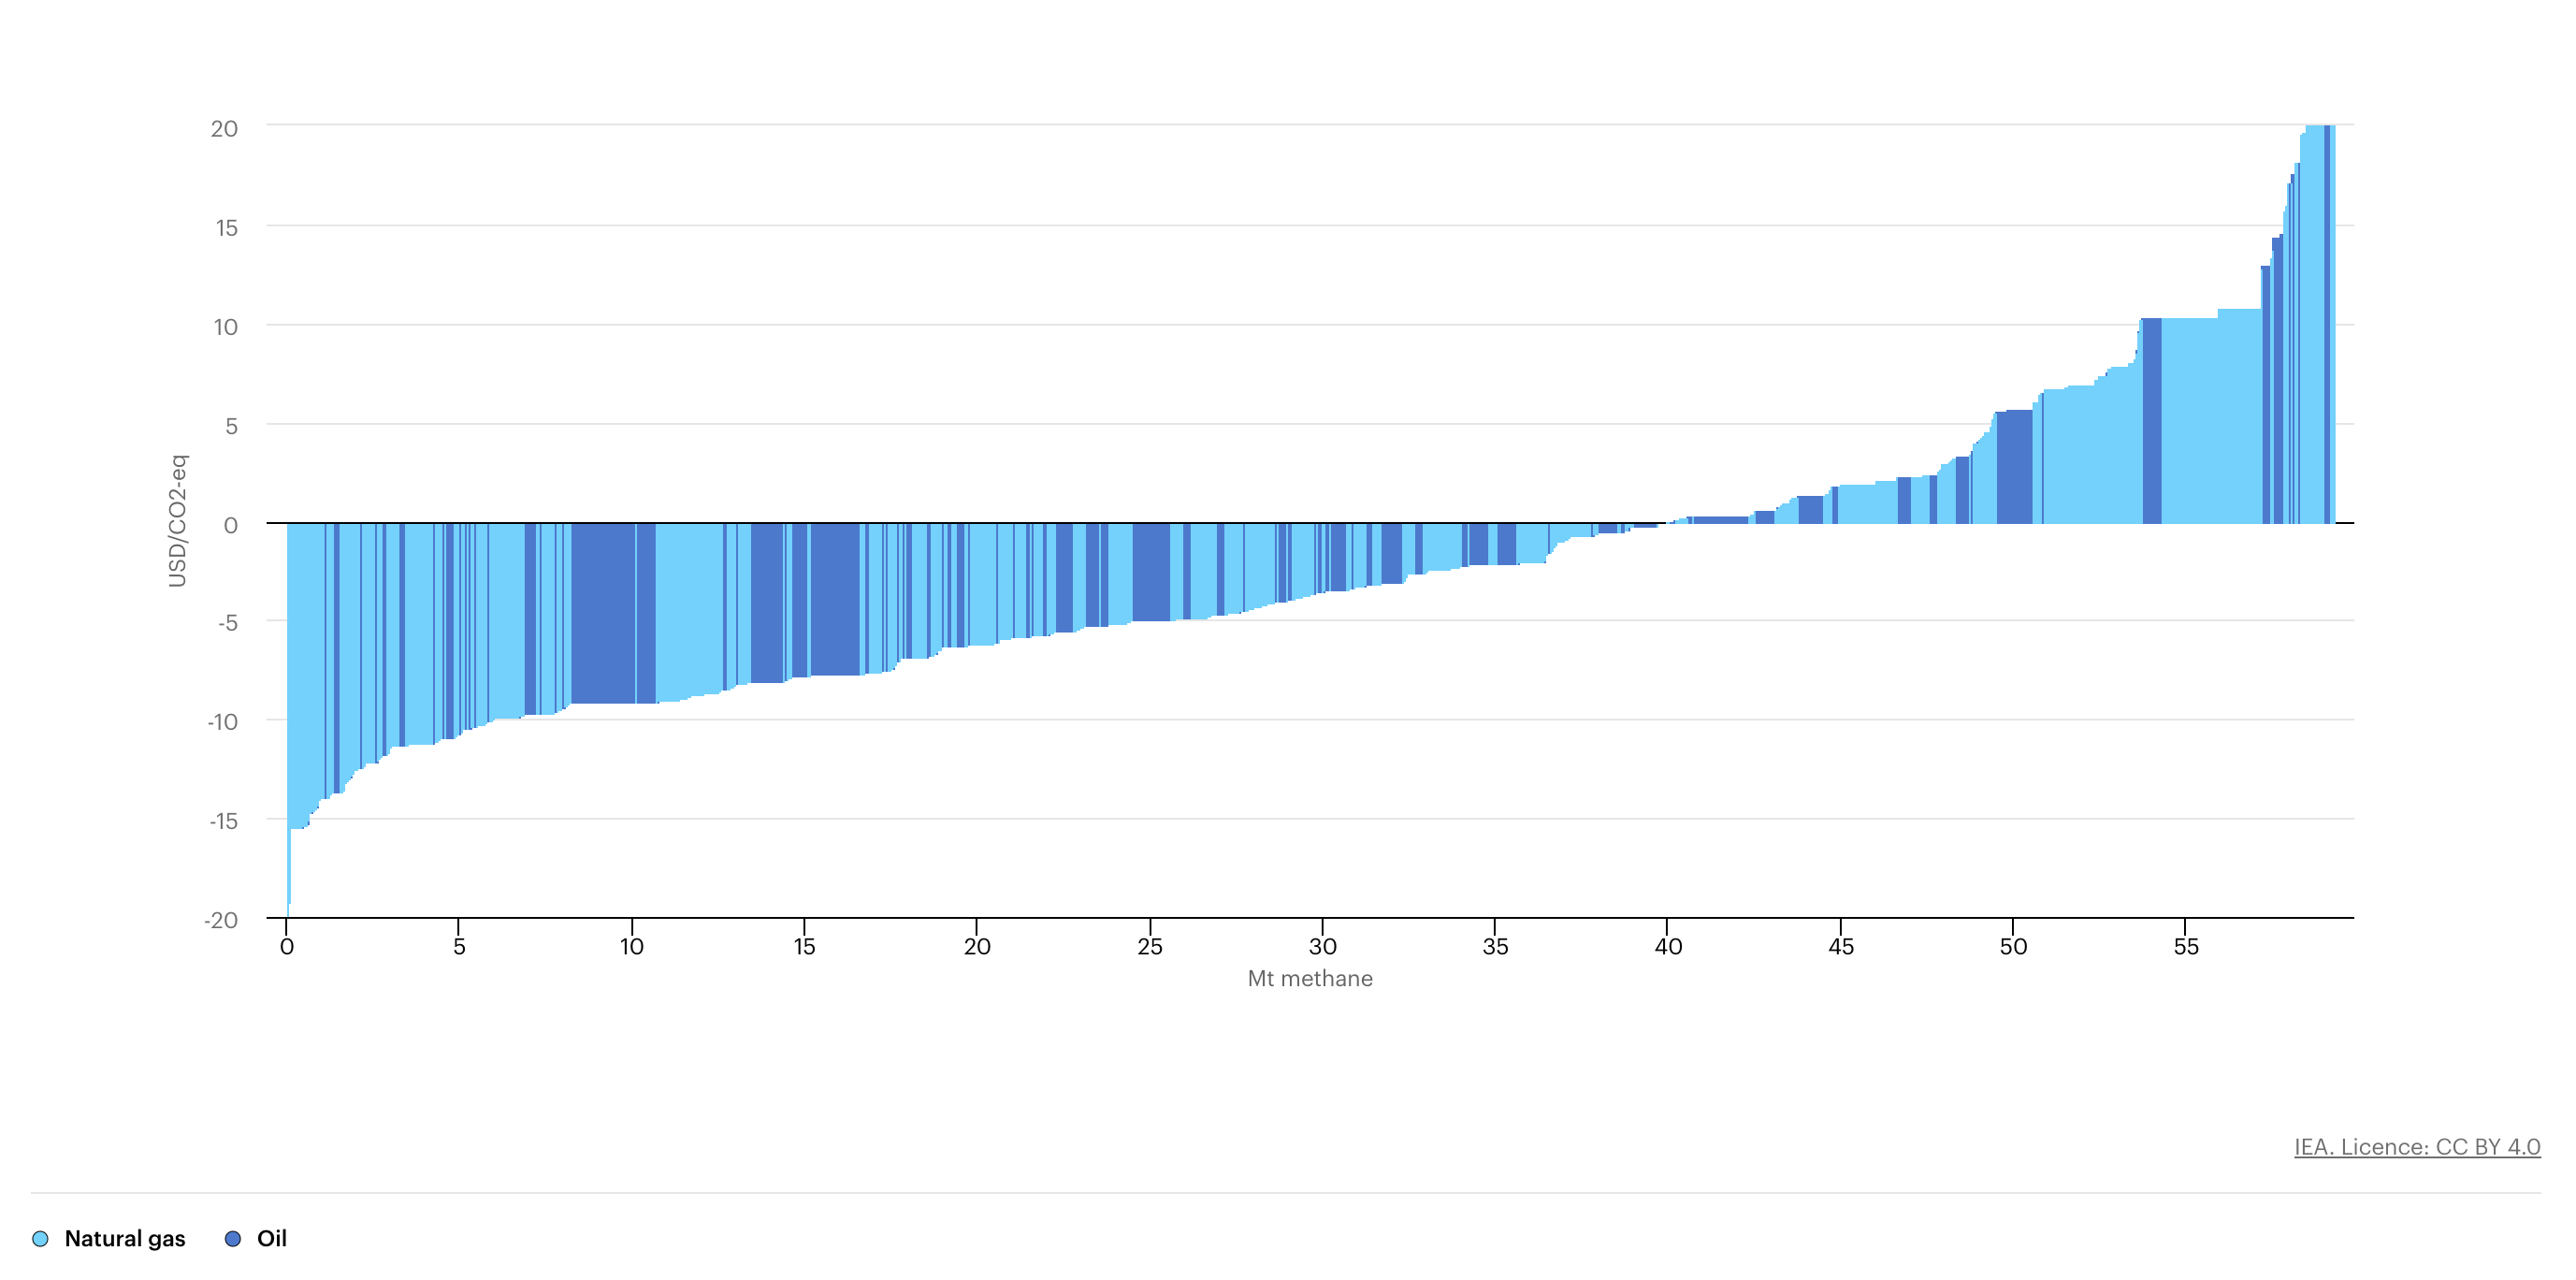
Data describing methane abatement potential in the O&G industry are often shown in marginal abatement cost curves (MACCs), which incorporate the initial cost, operating cost, revenue, and any extra costs per unit of emissions reduced as one value.

Figure A1. Marginal abatement cost curves (MACC) for methane abatement in the O&G industry (IEA, 2024).

Image
Cost curve chart.

Source: International Energy Agency (Global Methane Tracker 2024).

MACCs indicate a range of potential climate actions and show at a glance the magnitude of financial return or financial cost across that range. In Figure A1, for the blocks below the horizontal axis, the value received from the sale of the captured methane is greater than the cost of the solution employed. The width of a block shows the annual amount of emissions a technology can abate, with wider blocks abating more emissions than narrower blocks.

MACCs are useful for identifying which climate action could have the most impact at reducing emissions or which options have a net economic gain. However, they do not illustrate the intricacies that may be in play among different climate actions and can lead users to ignore hard-to-abate emissions. The World Bank (2023) identified that MACCs are useful to find which option will reduce emissions by a set percentage but less useful for reducing absolute emissions to near zero. 

Credits

Lead Fellow

  • Jason Lam

Contributors

  • Ruthie Burrows, Ph.D.

  • James Gerber, Ph.D.

  • Yusuf Jameel, Ph.D.

  • Daniel Jasper

  • Alex Sweeney

Internal Reviewers

  • Aiyana Bodi

  • Hannah Henkin

  • Ted Otte

  • Amanda Smith, Ph.D.

  • Paul West, Ph.D.

  • Greenhouse gas quantity expressed relative to CO₂ with the same warming impact over 100 years, calculated by multiplying emissions by the 100-yr GWP for the emitted gases.

  • Greenhouse gas quantity expressed relative to CO with the same warming impact over 20 years, calculated by multiplying emissions by the 20-yr GWP for the emitted gases.

  • Reducing greenhouse gas concentrations in the atmosphere by preventing or reducing emissions.

  • The process of increasing the acidity of water or soil due to increased levels of certain air pollutants.

  • Benefits of climate solutions that extend beyond their ability to reduce emissions or store carbon (e.g., benefits to public health, water quality, biodiversity, advancing human rights).

  • The extent to which emissions reduction or carbon removal is above and beyond what would have occurred without implementing a particular action or solution.

  • An upper limit on solution adoption based on physical or technical constraints, not including economic or policy barriers. This level is unlikely to be reached and will not be exceeded.

  • The quantity and metric to measure implementation for a particular solution that is used as the reference unit for calculations within that solution.

  • Farming practices that work to create socially and ecologically sustainable food production.

  • Addition of trees and shrubs to crop or animal farming systems.

  • Spread out the cost of an asset over its useful lifetime.

  • A crop that live one year or less from planting to harvest; also called annual.

  • black carbon

  • Made from material of biological origin, such as plants, animals, or other organisms.

  • A renewable energy source generated from organic matter from plants and/or algae.

  • An energy source composed primarily of methane and CO that is produced by microorganisms when organic matter decomposes in the absence of oxygen.

  • Carbon stored in biological matter, including soil, plants, fungi, and plant products (e.g., wood, paper, biofuels). This carbon is sequestered from the atmosphere but can be released through decomposition or burning.

  • Living or dead renewable matter from plants or animals, not including organic material transformed into fossil fuels. Peat, in early decay stages, is partially renewable biomass.

  • A type of carbon sequestration that captures carbon from CO via photosynthesis and stores it in soils, sediments, and biomass, distinct from sequestration through chemical or industrial pathways.

  • A climate pollutant, also called soot, produced from incomplete combustion of organic matter, either naturally (wildfires) or from human activities (biomass or fossil fuel burning).

  • High-latitude (>50°N or >50°S) climate regions characterized by short growing seasons and cold temperatures.

  • The components of a building that physically separate the indoors from the outdoor environment.

  • Businesses involved in the sale and/or distribution of solution-related equipment and technology, and businesses that want to support adoption of the solution.

  • A chemical reaction involving heating a solid to a high temperature: to make cement clinker, limestone is calcined into lime in a process that requires high heat and produces CO.

  • A four-wheeled passenger vehicle.

  • Technologies that collect CO before it enters the atmosphere, preventing emissions at their source. Collected CO can be used onsite or in new products, or stored long term to prevent release.

  • A greenhouse gas that is naturally found in the atmosphere. Its atmospheric concentration has been increasing due to human activities, leading to warming and climate impacts.

  • Total GHG emissions resulting from a particular action, material, technology, or sector.

  • Amount of GHG emissions released per activity or unit of production. 

  • A marketplace where carbon credits are purchased and sold. One carbon credit represents activities that avoid, reduce, or remove one metric ton of GHG emissions.

  • A colorless, odorless gas released during the incomplete combustion of fuels containing carbon. Carbon monoxide can harm health and be fatal at high concentrations.

  • Activities or technologies that pull CO out of the atmosphere, including enhancing natural carbon sinks and deploying engineered sinks.

  • Long-term storage of carbon in soils, sediment, biomass, oceans, and geologic formations after removal of CO from the atmosphere or CO capture from industrial and power generation processes.

  • carbon capture and storage

  • carbon capture, utilization, and storage

  • A binding ingredient in concrete responsible for most of concrete’s life-cycle emissions. Cement is made primarily of clinker mixed with other mineral components.

  • methane

  • Gases or particles that have a planet-warming effect when released to the atmosphere. Some climate pollutants also cause other forms of environmental damage.

  • A binding ingredient in cement responsible for most of the life-cycle emissions from cement and concrete production.

  • carbon monoxide

  • Neighbors, volunteer organizations, hobbyists and interest groups, online communities, early adopters, individuals sharing a home, and private citizens seeking to support the solution.

  • A solution that potentially lowers the benefit of another solution through reduced effectiveness, higher costs, reduced or delayed adoption, or diminished global climate impact.

  • A farming system that combines reduced tillage, cover crops, and crop rotations.

  • carbon dioxide

  • A  measure standardizing the warming effects of greenhouse gases relative to CO. CO-eq is calculated as quantity (metric tons) of a particular gas multiplied by its GWP.

  • carbon dioxide equivalent

  • The process of cutting greenhouse gas emissions (primarily CO) from a particular sector or activity.

  • A solution that works slower than gradual solutions and is expected to take longer to reach its full potential.

  • Microbial conversion of nitrate into inert nitrogen gas under low-oxygen conditions, which produces the greenhouse gas nitrous oxide as an intermediate compound.

  • Greenhouse gas emissions produced as a direct result of the use of a technology or practice.

  • Ability of a solution to reduce emissions or remove carbon, expressed in CO-eq per installed adoption unit. Effectiveness is quantified per year when the adoption unit is cumulative over time.

  • Greenhouse gas emissions accrued over the lifetime of a material or product, including as it is produced, transported, used, and disposed of.

  • Solutions that work faster than gradual solutions, front-loading their impact in the near term.

  • Methane produced by microbes in the digestive tracts of ruminant livestock, such as cattle, sheep and goats.

  • environmental, social, and governance

  • exchange-traded fund

  • A process triggered by an overabundance of nutrients in water, particularly nitrogen and phosphorus, that stimulates excessive plant and algae growth and can harm aquatic organisms.

  • The scientific literature that supports our assessment of a solution's effectiveness.

  • A group of human-made molecules that contain fluorine atoms. They are potent greenhouse gases with GWPs that can be hundreds to thousands times higher than CO.

  • food loss and waste

  • Food discarded during pre-consumer supply chain stages, including production, harvest, and processing.

  • Food discarded at the retail and consumer stages of the supply chain.

  • Combustible materials found in Earth's crust that can be burned for energy, including oil, natural gas, and coal. They are formed from decayed organisms through prehistoric geological processes.

  • greenhouse gas

  • gigajoule or billion joules

  • The glass layers or panes in a window.

  • A measure of how effectively a gas traps heat in the atmosphere relative to CO. GWP converts greenhouse gases into CO-eq emissions based on their 20- or 100-year impacts.

  • A solution that has a steady impact so that the cumulative effect over time builds as a straight line. Most climate solutions fall into this category.

  • A gas that traps heat in the atmosphere, contributing to climate change.

  • metric gigatons or billion metric tons

  • global warming potential

  • hectare

  • household air pollution

  • Number of years a person is expected to live without disability or other limitations that restrict basic functioning and activity.

  • A unit of land area comprising 10,000 square meters, roughly equal to 2.5 acres.

  • hydrofluorocarbon

  • hydrofluoroolefin

  • Particles and gases released from use of polluting fuels and technologies such as biomass cookstoves that cause poor air quality in and around the home.

  • Organic compounds that contain hydrogen and carbon.

  • Human-made F-gases that contain hydrogen, fluorine, and carbon. They typically have short atmospheric lifetimes and GWPs hundreds or thousands times higher than CO

  • Human-made F-gases that contain hydrogen, fluorine, and carbon, with at least one double bond. They have low GWPs and can be climate-friendly alternatives to HFC refrigerants.

  • internal combustion engine

  • Greenhouse gas emissions produced as a result of a technology or practice but not directly from its use.

  • Device used to power vehicles by the intake, compression, combustion, and exhaust of fuel that drives moving parts.

  • The annual discount rate that balances net cash flows for a project over time. Also called IRR, internal rate of return is used to estimate profitability of potential investments.

  • Individuals or institutions willing to lend money in search of a return on their investment.

  • internal rate of return

  • A measure of energy

  • International agreement adopted in 2016 to phase down the use of high-GWP HFC F-gases over the time frame 2019–2047.

  • A measure of energy equivalent to the energy delivered by 1,000 watts of power over one hour.

  • kiloton or one thousand metric tons

  • kilowatt-hour

  • A land-holding system, e.g. ownership, leasing, or renting. Secure land tenure means farmers or other land users will maintain access to and use of the land in future years.

  • Gases, mainly methane and CO, created by the decomposition of organic matter in the absence of oxygen.

  • leak detection and repair

  • Regular monitoring for fugitive methane leaks throughout oil and gas, coal, and landfill sector infrastructure and the modification or replacement of leaking equipment.

  • Relocation of emissions-causing activities outside of a mitigation project area rather than a true reduction in emissions.

  • The rate at which solution costs decrease as adoption increases, based on production efficiencies, technological improvements, or other factors.

  • Percent decrease in costs per doubling of adoption.

  • landfill gas

  • Greenhouse gas emissions from the sourcing, production, use, and disposal of a technology or practice.

  • low- and middle-income countries

  • liquefied petroleum gas

  • A measure of the amount of light produced by a light source per energy input.

  • square meter kelvins per watt (a measure of thermal resistance, also called R-value)

  • marginal abatement cost curve

  • Livestock grazing practices that strategically manage livestock density, grazing intensity, and timing. Also called improved grazing, these practices have environmental, soil health, and climate benefits, including enhanced soil carbon sequestration.

  • A tool to measure and compare the financial cost and abatement benefit of individual actions based on the initial and operating costs, revenue, and emission reduction potential.

  • A greenhouse gas with a short lifetime and high GWP that can be produced through a variety of mechanisms including the breakdown of organic matter.

  • A measure of mass equivalent to 1,000 kilograms (~2,200 lbs).

  • million hectares

  • Soils mostly composed of inorganic materials formed through the breakdown of rocks. Most soils are mineral soils, and they generally have less than 20% organic matter by weight.

  • A localized electricity system that independently generates and distributes power. Typically serving limited geographic areas, mini-grids can operate in isolation or interconnected with the main grid.

  • Reducing the concentration of greenhouse gases in the atmosphere by cutting emissions or removing CO.

  • Percent of trips made by different passenger and freight transportation modes.

  • megaton or million metric tons

  • A commitment from a country to reduce national emissions and/or sequester carbon in alignment with global climate goals under the Paris Agreement, including plans for adapting to climate impacts.

  • A gaseous form of hydrocarbons consisting mainly of methane.

  • Chemicals found in nature that are used for cooling and heating, such as CO, ammonia, and some hydrocarbons. They have low GWPs and are ozone friendly, making them climate-friendly refrigerants.

  • Microbial conversion of ammonia or ammonium to nitrite and then to nitrate under aerobic conditions.

  • A group of air pollutant molecules composed of nitrogen and oxygen, including NO and NO.

  • A greenhouse gas produced during fossil fuel combustion and agricultural and industrial processes. NO is hundreds of times more potent than CO at trapping atmospheric heat, and it depletes stratospheric ozone.

  • Social welfare organizations, civic leagues, social clubs, labor organizations, business associations, and other not-for-profit organizations.

  • A material or energy source that relies on resources that are finite or not naturally replenished at the rate of consumption, including fossil fuels like coal, oil, and natural gas.

  • nitrogen oxides

  • nitrous oxide

  • The process of increasing the acidity of seawater, primarily caused by absorption of CO from the atmosphere.

  • An agreement between a seller who will produce future goods and a purchaser who commits to buying them, often used as project financing for producers prior to manufacturing.

  • Productive use of wet or rewetted peatlands that does not disturb the peat layer, such as for hunting, gathering, and growing wetland-adapted crops for food, fiber, and energy.

  • A measure of transporting one passenger over a distance of one kilometer.

  • The longevity of any greenhouse gas emission reductions or removals. Solution impacts are considered permanent if the risk of reversing the positive climate impacts is low within 100 years.

  • A mixture of hydrocarbons, small amounts of other organic compounds, and trace amounts of metals used to produce products such as fuels or plastics.

  • Private, national, or multilateral organizations dedicated to providing aid through in-kind or financial donations.

  • An atmospheric reaction among sunlight, VOCs, and nitrogen oxide that leads to ground-level ozone formation. Ground-level ozone, a component of smog, harms human health and the environment.

  • passenger kilometer

  • particulate matter

  • Particulate matter 2.5 micrometers or less in diameter that can harm human health when inhaled.

  • Elected officials and their staff, bureaucrats, civil servants, regulators, attorneys, and government affairs professionals.

  • System in a vehicle that generates power and delivers it to the wheels. It typically includes an engine and/or motor, transmission, driveshaft, and differential.

  • People who most directly interface with a solution and/or determine whether the solution is used and/or available. 

  • The process of converting inorganic matter, including carbon dioxide, into organic matter (biomass), primarily by photosynthetic organisms such as plants and algae.

  • Defined by the International Union for the Conservation of Nature as: "A clearly defined geographical space, recognised, dedicated and managed, through legal or other effective means, to achieve the long-term conservation of nature with associated ecosystem services and cultural values". References to PAs here also include other effective area-based conservation measures defined by the IUCN. 

  • Very large or small numbers are formatted in scientific notation. A positive exponent multiplies the number by powers of ten; a negative exponent divides the number by powers of ten.

  • Small-scale family farmers and other food producers, often with limited resources, usually in the tropics. The average size of a smallholder farm is two hectares (about five acres).

  • soil organic carbon

  • Carbon stored in soils, including both organic (from decomposing plants and microbes) and inorganic (from carbonate-containing minerals).

  • Carbon stored in soils in organic forms (from decomposing plants and microbes). Soil organic carbon makes up roughly half of soil organic matter by weight.

  • Biologically derived matter in soils, including living, dead, and decayed plant and microbial tissues. Soil organic matter is roughly half carbon on a dry-weight basis.

  • soil organic matter

  • sulfur oxides

  • sulfur dioxide

  • The rate at which a climate solution physically affects the atmosphere after being deployed. At Project Drawdown, we use three categories: emergency brake (fastest impact), gradual, or delayed (slowest impact).

  • Climate regions between latitudes 23.4° to 35° above and below the equator characterized by warm summers and mild winters.

  • A polluting gas produced primarily from burning fossil fuels and industrial processes that directly harms the environment and human health.

  • A group of gases containing sulfur and oxygen that predominantly come from burning fossil fuels. They contribute to air pollution, acid rain, and respiratory health issues.

  • Processes, people, and resources involved in producing and delivering a product from supplier to end customer, including material acquisition.

  • metric tons

  • Technology developers, including founders, designers, inventors, R&D staff, and creators seeking to overcome technical or practical challenges.

  • Climate regions between 35° to 50° above and below the equator characterized by moderate mean annual temperatures and distinct seasons, with warm summers and cold winters.

  • A measure of how well a material prevents heat flow, often called R-value or RSI-value for insulation. A higher R-value means better thermal performance.

  • Individuals with an established audience for their work, including public figures, experts, journalists, and educators.

  • Low-latitude (23.4°S to 23.4°N) climate regions near the Equator characterized by year-round high temperatures and distinct wet and dry seasons.

  • United Nations

  • Self-propelled machine for transporting passengers or freight on roads.

  • A measure of one vehicle traveling a distance of one kilometer.

  • vehicle kilometer

  • volatile organic compound

  • Gases made of organic, carbon-based molecules that are readily released into the air from other solid or liquid materials. Some VOCs are greenhouse gases or can harm human health.

  • watt

  • A measure of power equal to one joule per second.

  • A subset of forest ecosystems that may have sparser canopy cover,  smaller-stature trees, and/or trees characterized by basal branching rather than a single main stem.

  • year