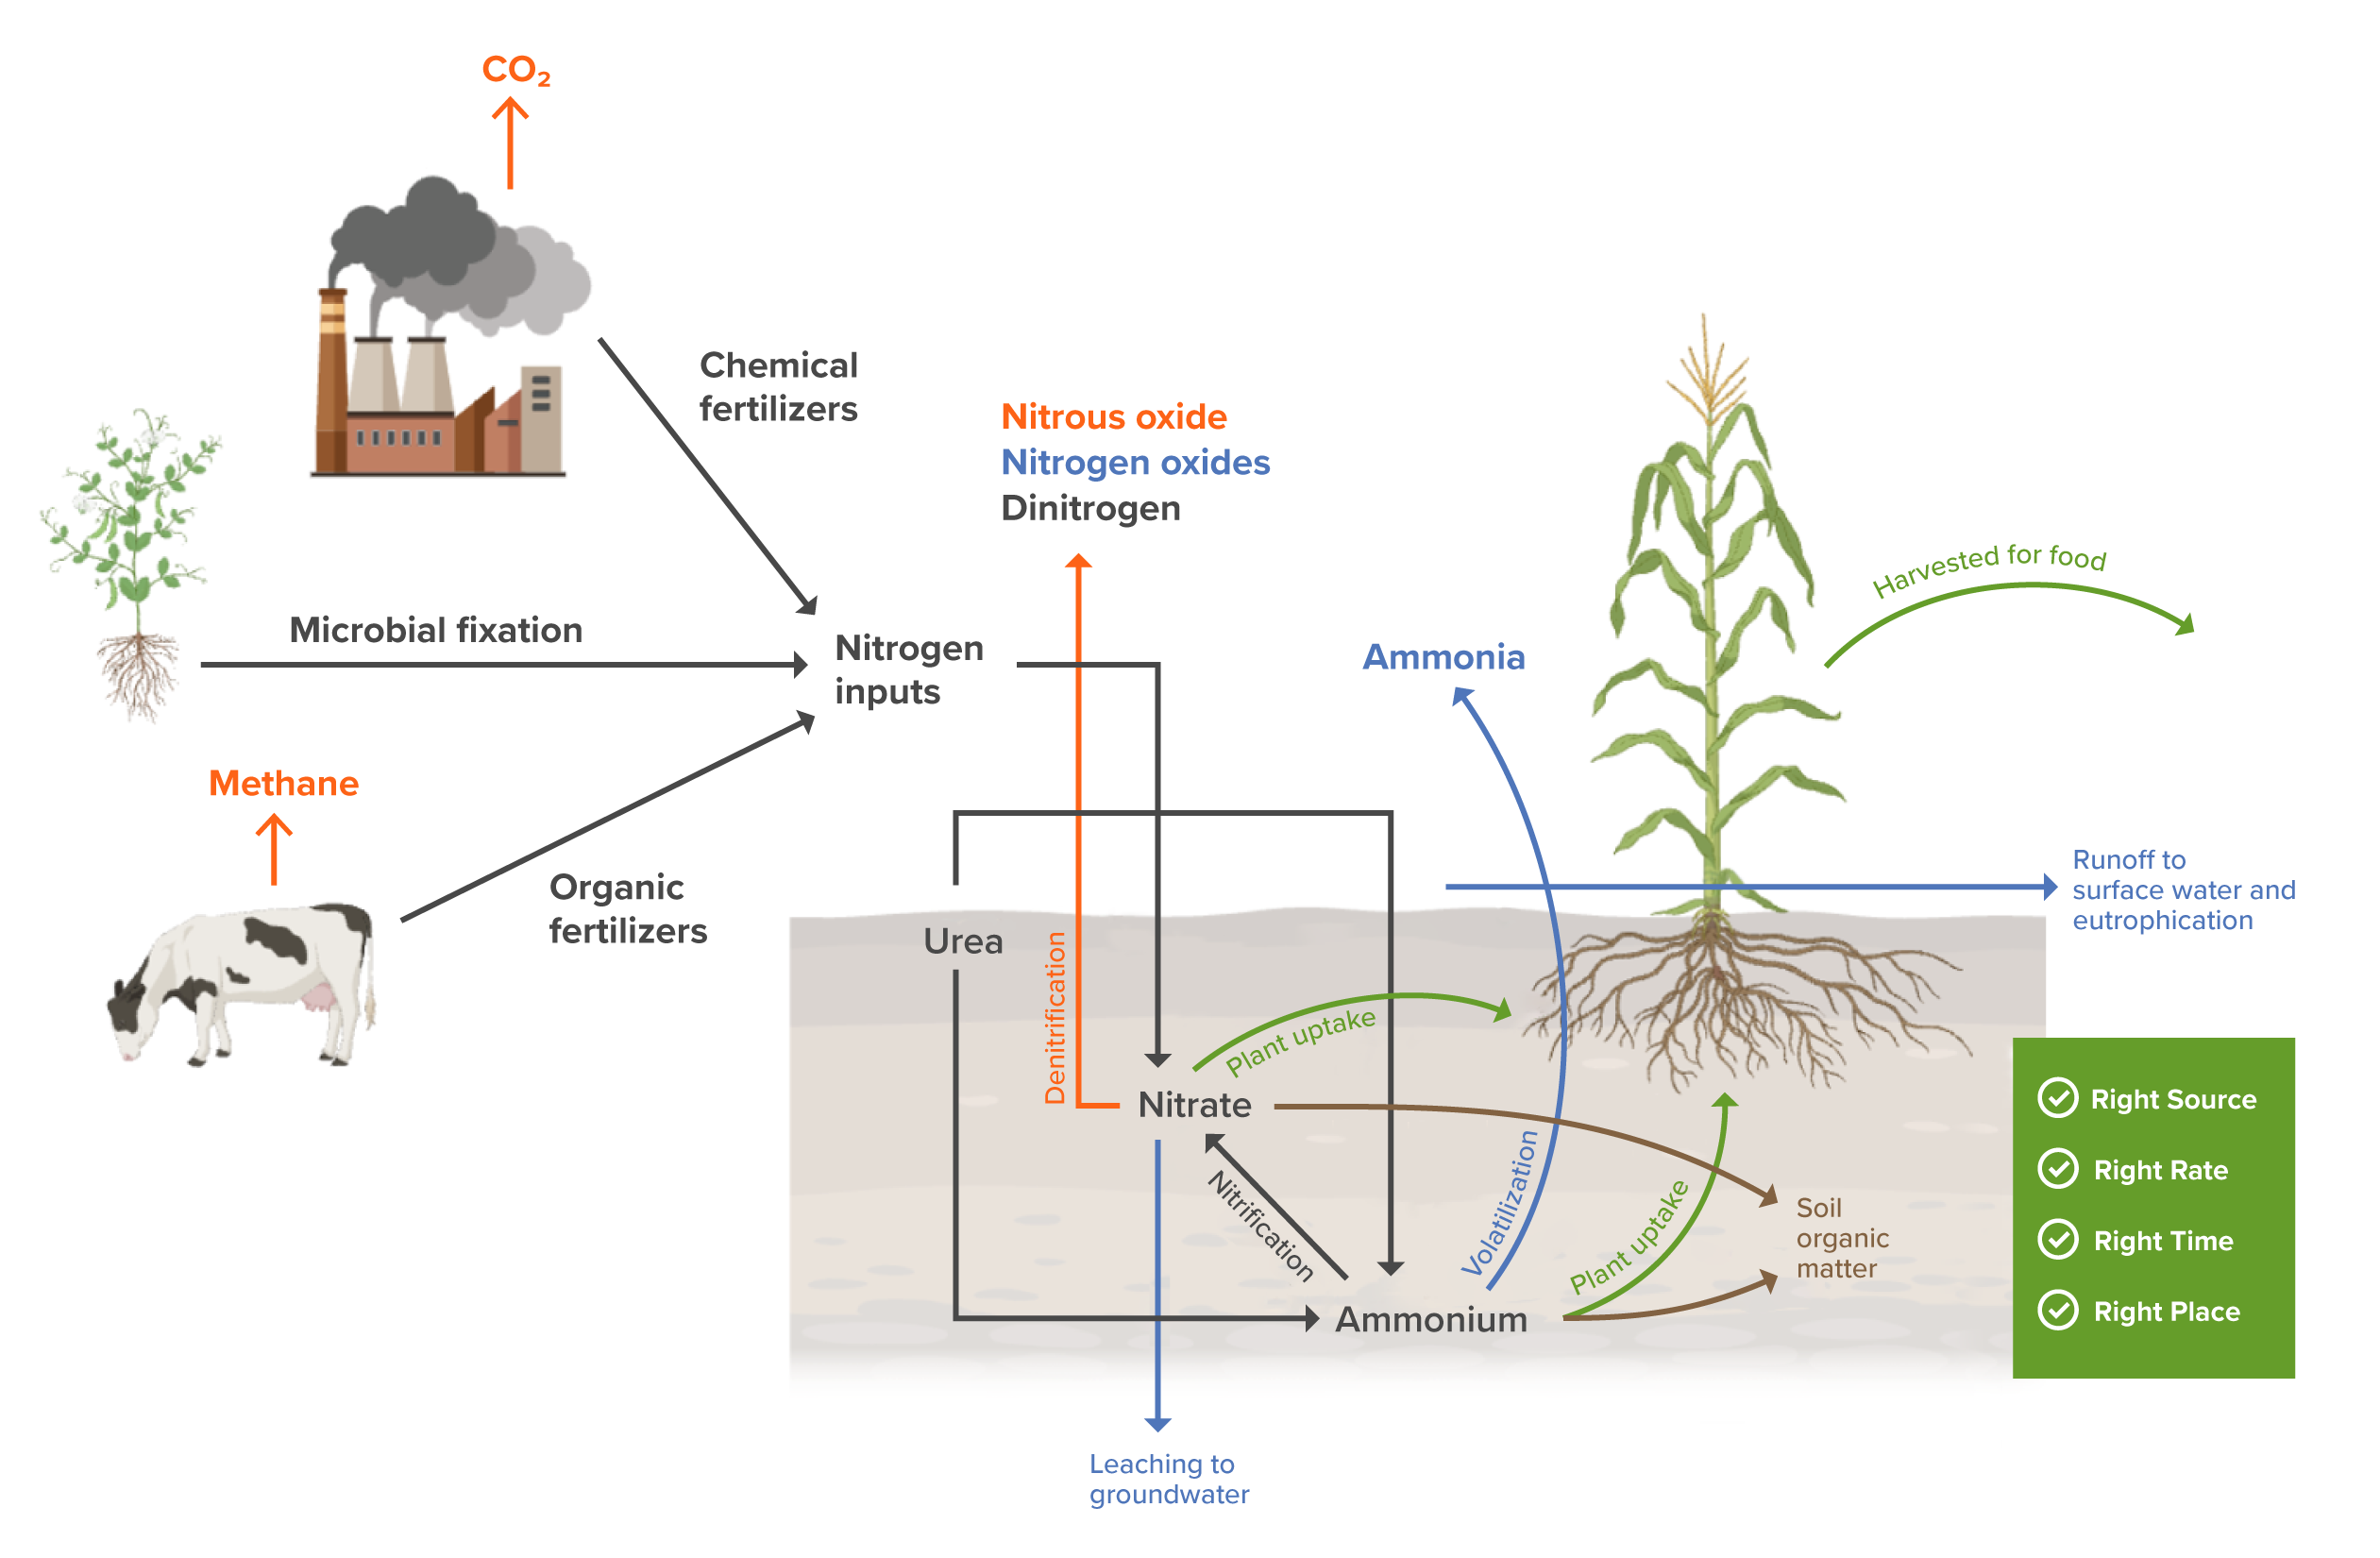
Agriculture is the dominant source of human-caused emissions of nitrous oxide (Tian et al., 2020). Nitrogen is critical for plant growth and is added to croplands in synthetic forms, such as urea, ammonium nitrate, or anhydrous ammonia; in organic forms, such as manure or compost; and by growing legume crops, which host microbes that capture nitrogen from the air and add it to the soil (Adalibieke et al., 2023; Ludemann et al., 2024). If more nitrogen is added than crops can use, the excess can be converted to other forms, including nitrous oxide, through microbial processes called denitrification and nitrification (Figure 1; Reay et al., 2012).
Cut Emissions
Food, Agriculture, Land & Ocean (FALO)
Shift Agriculture Practices
Improve Nutrient Management
Image
We define the Improve Nutrient Management solution as reducing excessive nitrogen use on croplands. Nitrogen is critical for crop production and is added to croplands as synthetic or organic fertilizers and through microbial activity. However, farmers often add more nitrogen to croplands than crops can use. Some of that excess nitrogen is emitted to the atmosphere as nitrous oxide, a potent GHG.
Last updated
December 23, 2025
Solution Basics
t avoided excess nitrogen application
t CO₂-eq (100-yr)/unit
04.26median
units/yr
Current 1.045×10⁷
06.985×10⁷9.106×10⁷
Achievable (Low to High)
Climate Impact
Gt CO₂-eq (100-yr)/yr
Current 0.06
0.420.54
US$ per t CO₂-eq
-85
Gradual
N₂O
Additional Benefits
182
183,184,187
189
Overview
Figure 1. The agricultural nitrogen cycle represents the key pathways by which nitrogen is added to croplands and lost to the environment, including as nitrous oxide. The “4R” nutrient management principles – right source, right rate, right time, right place – increase the proportion of nitrogen taken up by the plant, therefore reducing nitrogen losses to the environment.
Image
Illustrations: BioRender CC-BY 4.0
Farmers can reduce nitrous oxide emissions from croplands by using the right amount and the right type of fertilizer at the right time and in the right place (Fixen, 2020; Gao & Cabrera Serrenho, 2023). Together, these four “rights” increase nitrogen use efficiency – the proportion of applied nitrogen that the crop uses (Congreves et al., 2021). Improved nutrient management is often a win-win for the farmer and the environment, reducing fertilizer costs while also lowering nitrous oxide emissions (Gu et al., 2023).
Improving nutrient management involves reducing the amount of nitrogen applied to match the crop’s requirements in areas where nitrogen is currently overapplied. A farmer can implement the other three principles – type, time, and place – in a number of ways. For example, fertilizing just before planting instead of after the previous season’s harvest better matches the timing of nitrogen addition to that of plant uptake, reducing nitrous oxide emissions before the crop is planted. Certain types of fertilizers are better suited for maximizing plant uptake, such as extended-release fertilizers, which allow the crop to steadily absorb nutrients over time. Techniques such as banding, in which farmers apply fertilizers in concentrated bands close to the plant roots instead of spreading them evenly across the soil surface, also reduce nitrous oxide emissions. Each of these practices can increase nitrogen use efficiency and decrease the amount of excess nitrogen lost as nitrous oxide (Gao & Cabrera Serrenho, 2023; Gu et al., 2023; Wang et al., 2024; You et al., 2023).
For this solution, we estimated a target rate of nitrogen application for major crops as the 20th percentile of the current rate of nitrogen application (in t N/t crop) in areas where yields are near a realistic ceiling. Excess nitrogen was defined as the amount of nitrogen applied beyond the target rate (see Adoption and Appendix for more details). Our emissions estimates include nitrous oxide from croplands, fertilizer runoff, and fertilizer volatilization. They do not include emissions from fertilizer manufacturing, which are addressed in the Deploy Low-Emission Industrial Feedstocks and Boost Industrial Efficiency solutions. We excluded nutrient management on pastures from this solution due to data limitations and address nutrient management in paddy rice systems in the Improve Rice Production solution instead.
Impact Calculator
Adjust effectiveness and adoption using range sliders to see resulting climate impact potential.
Effectiveness
6
t CO₂-eq (100-yr)/t avoided excess nitrogen application
Adoption
1.045×10⁷
t avoided excess nitrogen application/yr
Climate Impact
0.06
Gt CO₂-eq/yr (100-yr)
which is the equivalent of
0.11%
of global emissions
Maps
Improved nutrient management will have the greatest emissions reduction if it is targeted at areas with the largest excesses of nitrogen fertilizer use. In 2020, China, India, and the United States alone accounted for 52% of global excess nitrogen application (Ludemann et al., 2024). Improved nutrient management could be particularly beneficial in China and India, where nutrient use efficiency is currently lower than average (Ludemann et al., 2024). You et al. (2023) also found potential for large increases in nitrogen use efficiency in parts of China, India, Australia, Northern Europe, the United States Midwest, Mexico, and Brazil under standard best management practices. Gu et al. (2024) found that nitrogen input reductions are economically feasible in most of Southern Asia, Northern and Western Europe, parts of the Middle East, North America, and Oceania.
In addition to regional patterns in the adoption ceiling, greater nitrous oxide emissions reductions are possible in wet climates or on irrigated croplands compared to dry climates. Nitrous oxide emissions tend to peak when nitrogen availability is high and soil moisture is in the ~70–90% range (Betterbach-Bahl et al., 2013; Elberling et al., 2023; Hao et al., 2025; Lawrence et al., 2021), though untangling the drivers of nitrous oxide emissions is complex (Lawrence et al., 2021). Water management to avoid prolonged periods of soil moisture in this range is an important complement to nutrient management in wet climates and on irrigated croplands (Deng et al., 2018).
Importantly, improved nutrient management, as defined here, is not appropriate for implementation in areas with nitrogen deficits or negligible nitrogen surpluses, including much of Africa. In these areas, crop yields are constrained by nitrogen availability, and an increase in nutrient inputs may be needed to achieve target yields. Additionally, nutrient management in paddy (flooded) rice systems is not included in this solution but rather in the Improve Rice Production solution.
t CO2-eq/ha/yr
The problem: nitrous oxide emissions from over-fertilized soils
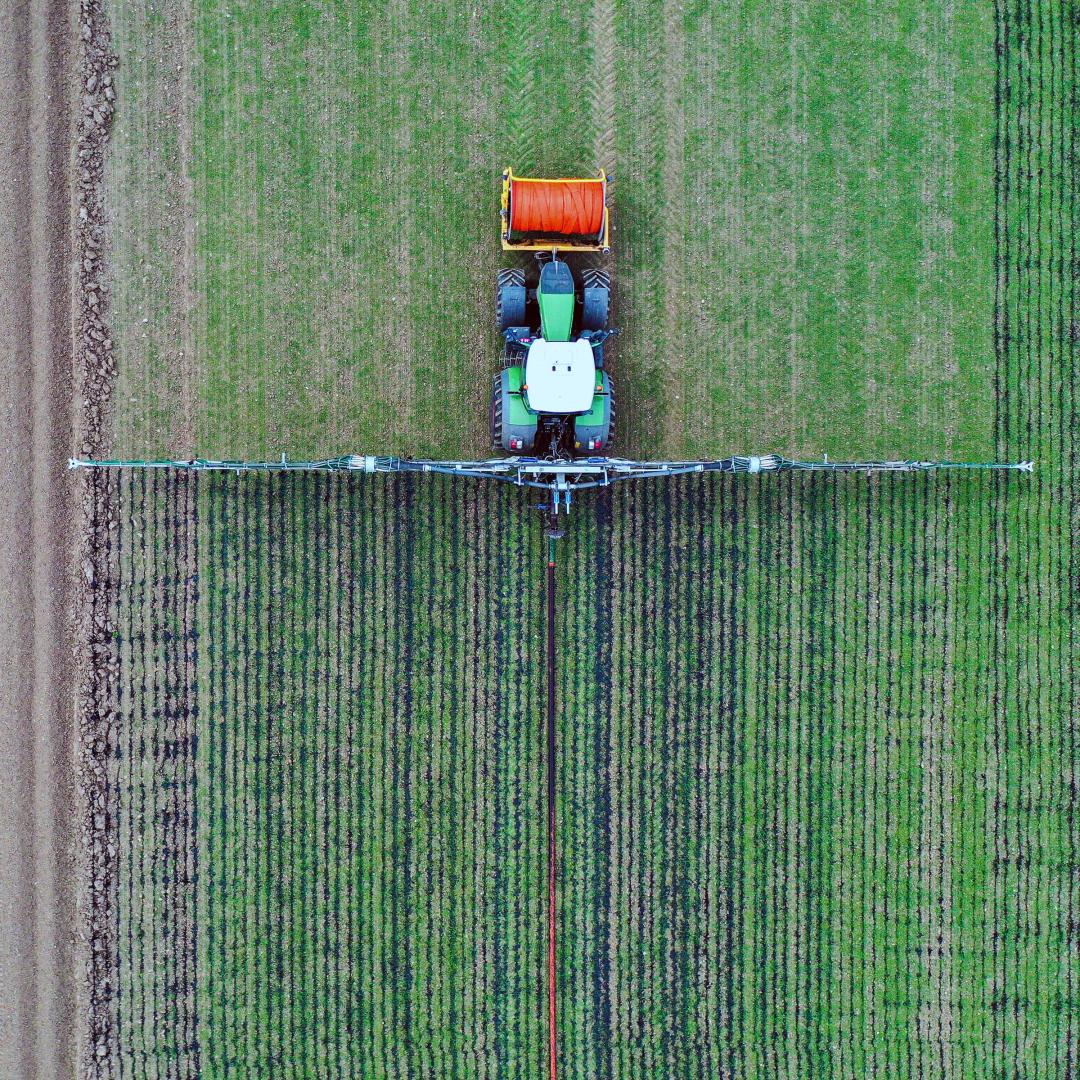
The world’s agricultural lands can emit high levels of nitrous oxide, the third most powerful greenhouse gas. These emissions stem from overusing nitrogen-based fertilizers, especially in regions in China, India, Western Europe, and central North America (in red). While crops absorb some of the nitrogen fertilizer we apply, much of what remains is lost to the atmosphere as nitrous oxide pollution or to local waterways as nitrate pollution. Using fertilizers more wisely can dramatically reduce greenhouse gas emissions and water pollution while maintaining high levels of crop production.
Project Drawdown
t CO2-eq/ha/yr
The problem: nitrous oxide emissions from over-fertilized soils
The world’s agricultural lands can emit high levels of nitrous oxide, the third most powerful greenhouse gas. These emissions stem from overusing nitrogen-based fertilizers, especially in regions in China, India, Western Europe, and central North America (in red). While crops absorb some of the nitrogen fertilizer we apply, much of what remains is lost to the atmosphere as nitrous oxide pollution or to local waterways as nitrate pollution. Using fertilizers more wisely can dramatically reduce greenhouse gas emissions and water pollution while maintaining high levels of crop production.
Project Drawdown
The Details
Current State
Effectiveness
We relied on the 2019 Intergovernmental Panel on Climate Change (IPCC) emissions factors to calculate the emissions impacts of improved nutrient management. These are disaggregated by climate zone (“wet” vs. “dry”) and by fertilizer type (“organic” vs. “synthetic”). Nitrogen use reductions in wet climates, which include ~65% of the cropland area represented in this analysis (see Appendix for details), have the largest impact. In these areas, a 1 t reduction in nitrogen use reduces emissions by 8.7 t CO₂‑eq on average for synthetic fertilizers and by 5.0 t CO₂‑eq for organic fertilizers. Emissions savings are lower in dry climates, where a 1 t reduction in nitrogen use reduces emissions by 2.4 t CO₂‑eq for synthetic fertilizers and by 2.6 t CO₂‑eq for organic fertilizers. While these values reflect the median emissions reduction for each climate zone and fertilizer type, they are associated with large uncertainties because emissions are highly variable depending on climate, soil, and management conditions.
Based on our analysis of the adoption ceiling for each climate zone and fertilizer type (see Appendix), we estimated that a 1 t reduction in nitrogen use reduces emissions by 6.0 t CO₂‑eq at the global median (Table 1). This suggests that ~1.4% of the applied nitrogen is emitted as nitrous oxide at the global average, which is consistent with existing estimates (IPCC, 2019).
Table 1. Effectiveness at reducing emissions.
Unit: t CO₂‑eq /t nitrogen, 100-yr basis
| 25th percentile | 4.2 |
| Median (50th percentile) | 6.0 |
| 75th percentile | 7.7 |
Cost
Improving nutrient management typically reduces fertilizer costs while maintaining or increasing yields, resulting in a net financial benefit to the producer. Gu et al. (2023) found that a 21% reduction in global nitrogen use would be economically beneficial, notably after accounting for increased fertilizer use in places that do not currently have adequate access. Using data from their study, we evaluated the average cost of reduced nitrogen application considering the following nutrient management practices: increased use of high-efficiency fertilizers, organic fertilizers, and/or legumes; optimizing fertilizer rates; altering the timing and/or placement of fertilizer applications; and use of buffer zones. Implementation costs depend on the strategy used to improve nutrient management. For example, optimizing fertilizer rates requires soil testing and the ability to apply different fertilizer rates to different parts of a field. Improving timing can involve applying fertilizers at two different times during the season, increasing labor and equipment operation costs. Furthermore, planting legumes incurs seed purchase and planting costs.
Gu et al. (2023) estimated that annual reductions of 42 Mt of nitrogen were achievable globally using these practices, providing total fertilizer savings of US$37.2 billion and requiring implementation costs of US$15.9 billion, adjusted for inflation to 2023. A 1 t reduction in excess nitrogen application, therefore, was estimated to provide an average of US$507.80 of net cost savings, corresponding to a savings of US$85.21 per t CO₂‑eq of emissions reductions (Table 2).
Table 2. Cost per unit of climate impact, 100-yr basis.
Unit: 2023 US$/t CO₂‑eq
| Mean | -85.21 |
Learning Curve
The improved nutrient management strategies considered for this solution are already well established and widely deployed (Fixen, 2020). Large nitrogen excesses are relatively easy to mitigate through simple management changes with low implementation costs. As nitrogen use efficiency increases, further reductions may require increasingly complex mitigation practices and increasing marginal costs. Therefore, a learning curve was not quantified for this solution.
Speed of Action
Speed of action refers to how quickly a climate solution physically affects the atmosphere after it is deployed. This is different from speed of deployment, which is the pace at which solutions are adopted.
At Project Drawdown, we define the speed of action for each climate solution as emergency brake, gradual, or delayed.
Improve Nutrient Management is a GRADUAL climate solution. It has a steady, linear impact on the atmosphere. The cumulative effect over time builds as a straight line.
Adoption
Current Adoption
Given that improved nutrient management takes a variety of forms and data on the adoption of individual practices are very limited, we leveraged several global datasets related to nitrogen use and yields to directly assess improvements in nitrogen use efficiency (see Appendix for details).
First, we calculated nitrogen use per metric ton of crop produced using global maps of nitrogen fertilizer use (Adalibieke et al., 2023) and global maps of crop yields (Gerber et al., 2024) for 17 major crops (see Appendix). Next, we determined a target nitrogen use rate (t nitrogen/t crop) for each crop, corresponding to the 20th percentile of nitrogen use rates observed in croplands with yield gaps at or below the 20th percentile, meaning that actual yields were close to an attainable yield ceiling (Gerber et al., 2024). Areas with large yield gaps were excluded from the calculation of target nutrient use efficiency because insufficient nitrogen supply may be compromising yields (Mueller et al., 2012). Yield data were not available for a small number of crops; for these, we assumed reductions in nitrogen use to be proportional to those of other crops.
We considered croplands that had achieved the target rate and had yield gaps lower than the global median to have adopted the solution. We calculated the amount of excess nitrogen use avoided from these croplands as the difference in total nitrogen use under current fertilization rates relative to median fertilizer application rates. As of 2020, croplands that had achieved the adoption threshold for improved nutrient management avoided 10.45 Mt of nitrogen annually relative to the median nitrogen use rate (Table 3), equivalent to 11% of the adoption ceiling.
Table 3. Current (2020) adoption level.
Unit: t nitrogen/yr
| Estimate | 10,450,000 |
Adoption Trend
Global average nitrogen use efficiency increased from 47.7% to 54.6% between 2000 and 2020, a rate of approximately 0.43%/yr (Ludemann et al., 2024). This increase accelerated somewhat in the latter decade, from an average rate of 0.38%/yr to 0.53%/yr. Underlying this increase were increases in both the amount of nitrogen used and the amount of excess nitrogen. Total nitrogen additions increased by approximately 2.64 Mt/yr, with the amount of nitrogen used increasing more rapidly (1.99 Mt/yr) than the amount of excess nitrogen (0.65 Mt/yr) between 2000 and 2020 (Ludemann et al., 2024). Although nitrogen use increased between 2000 and 2020 as yields increased, the increase in nitrogen use efficiency suggests uptake of this solution.
Adoption Ceiling
We estimated the adoption ceiling of improved nutrient management to be 95.13 Mt avoided excess nitrogen use/year, not including current adoption (Table 4). This value reflects our estimate of the maximum potential reduction in nitrogen application while avoiding large yield losses and consists of the potential to avoid 62.25 Mt of synthetic nitrogen use and 32.88 Mt of manure and other organic nitrogen use, in addition to current adoption. In total, this is equivalent to an additional 68% reduction in global nitrogen use. The adoption ceiling was calculated as the difference between total nitrogen use at the current rate and total nitrogen use at the target rate (as described in Current Adoption), assuming no change in crop yields. For nitrogen applied to crops for which yield data were not available, the potential reduction in nitrogen use was assumed to be proportional to that of crops for which full data were available.
Table 4. Adoption ceiling.
Unit: t nitrogen/yr
| Estimate | 105,580,000 |
Achievable Adoption
We estimated that fertilizer use reductions of 69.85–91.06 Mt of nitrogen are achievable, reflecting current adoption plus nitrogen savings due to the achievement of nitrogen application rates equal to the median and 30th percentile of nitrogen application rates occurring in locations where yield gaps are small (Table 5).
This range is more ambitious than a comparable recent estimate by Gu et al. (2023), who found that reductions of approximately 42 Mt of nitrogen are avoidable via cost-effective implementation of similar practices. Differences in target nitrogen use efficiencies underlie differences between our estimates and those of Gu et al., whose findings correspond to an increase in global average cropland nitrogen use efficiency from 42% to 52%. Our estimates reflect higher target nitrogen use efficiencies. Nitrogen use efficiencies greater than 52% have been widely achieved through basic practice modification without compromising yields or requiring prohibitively expensive additional inputs. For instance, You et al. (2023) estimated that the global average nitrogen use efficiency could be increased to 78%. Similarly, cropland nitrogen use efficiency in the United States in 2020 was estimated to be 71%, and substantial opportunities for improved nitrogen use efficiency are still available within the United States (Ludemann et al., 2024), though Lu et al. (2019) and Swaney et al. (2018) report slightly lower estimates. These findings support our slightly more ambitious range of achievable nitrogen use reductions for this solution.
Table 5. Range of achievable adoption levels.
Unit: t nitrogen/yr
| Current adoption | 10,450,000 |
| Achievable – low | 69,850,000 |
| Achievable – high | 91,060,000 |
| Adoption ceiling | 105,580,000 |
Impacts
Climate Impact
We estimated that improved nutrient management has the potential to reduce emissions by 0.63 Gt CO₂‑eq/yr, with achievable emissions reductions of 0.42–0.54 Gt CO₂‑eq/yr (Table 6). This is equivalent to an additional 56–76% reduction in total nitrous oxide emissions from fertilizer use, based on the croplands represented in our analysis.
We estimated avoidable emissions by multiplying our estimates of adoption ceiling and achievable adoption by the relevant IPCC 2019 emissions factors, disaggregated by climate zone and fertilizer type. Under the adoption ceiling scenario, approximately 70% of emissions reductions occurred in wet climates, where emissions per t of applied fertilizer are higher. Reductions in synthetic fertilizer use, which are larger than reductions in organic fertilizer use, contributed about 76% of the potential avoidable emissions. We estimated that the current implementation of improved nutrient management was associated with 0.06 Gt CO₂‑eq/yr of avoided emissions.
Our estimates are slightly more optimistic but well within the range of the IPCC 2021 estimates, which found that improved nutrient management could reduce nitrous oxide emissions by 0.06–0.7 Gt CO₂‑eq/yr.
Table 6. Climate impact at different levels of adoption.
Unit: Gt CO₂-eq/yr, 100-yr basis
| Current adoption | 0.06 |
| Achievable – low | 0.42 |
| Achievable – high | 0.54 |
| Adoption ceiling | 0.63 |
Additional Benefits
Droughts
Balanced nutrient concentration contributes to long-term soil fertility and improved soil health by enhancing organic matter content, microbial diversity, and nutrient cycling (Antil & Raj, 2020; Selim, 2020). Healthy soil experiences reduced erosion and has higher water content, which increases its resilience to droughts and extreme heat (Rockström et al., 2017).
Income and Work
Better nutrient management reduces farmers' input costs and increases profitability (Rurinda et al., 2020; Wang et al., 2020). It is especially beneficial to smallholder farmers in sub-Saharan Africa, where site-specific nutrient management programs have demonstrated a significant increase in yield (Chivenge et al., 2021). A review of 61 studies across 11 countries showed that site-specific nutrient management resulted in an average increase in yield by 12% and increased farmer’s’ income by 15% while improving nitrogen use efficiency (Chivenge et al., 2021).
Food Security
While excessive nutrients cause environmental problems in some parts of the world, insufficient nutrients are a significant problem in others, resulting in lower agricultural yields (Foley et al., 2011). Targeted, site-specific, efficient use of fertilizers can improve crop productivity (Mueller et al., 2012; Vanlauwe et al., 2015), improving food security globally.
Health
Domingo et al. (2021) estimated about 16,000 premature deaths annually in the United States are due to air pollution from the food sector and found that more than 3,500 premature deaths per year could be avoided through reduced use of ammonia fertilizer, a secondary particulate matter precursor. Better agriculture practices overall can reduce particulate matter-related premature deaths from the agriculture sector by 50% (Domingo et al., 2021). Nitrogen oxides from fertilized croplands are another source of agriculture-based air pollution, and improved management can lead to decreased respiratory and cardiovascular disease (Almarez et al., 2018; Sobota et al., 2015).
Nitrate contamination of drinking water due to excessive runoff from agriculture fields has been linked to several health issues, including blood disorders and cancer (Patel et al., 2022; Ward et al., 2018). Reducing nutrient runoff through better management is critical to minimize these risks (Ward et al., 2018).
Nature Protection
Nutrient runoff from agricultural systems is a major driver of water pollution globally, leading to eutrophication and hypoxic zones in aquatic ecosystems (Bijay-Singh & Craswell, 2021). Nitrogen pollution also harms terrestrial biodiversity through soil acidification and increases productivity of fast-growing species, including invasives, which can outcompete native species (Porter et al., 2013). Improved nutrient management is necessary to reduce nitrogen and phosphorus loads to water bodies (Withers et al., 2014; van Grinsven et al., 2019) and terrestrial ecosystems (Porter et al., 2013). These practices have been effective in reducing harmful algal blooms and preserving biodiversity in sensitive water systems (Scavia et al., 2014).
Other
Caveats
Emissions reductions from improved nutrient management are permanent, though they may not be additional in all cases.
Permanence
As this solution reduces emissions rather than enhancing sequestration, permanence is not applicable.
Additionality
Additionality requires that the emissions benefits of the practice are attributable to climate-related incentives and would not have occurred in the absence of incentives (Michaelowa et al., 2019). If they are not contingent on external incentives, fertilizer use reductions implemented solely to maximize profits do not meet the threshold for additionality. However, fertilizer reductions may be additional if incentives are required to provide access to the technical knowledge and soil testing required to identify optimal rates. Other forms of nutrient management (e.g., applying nitrification inhibitors, using extended-release or organic fertilizers, or splitting applications between two time points) may involve additional costs, substantial practice change, and technical expertise. Thus, these practices are likely to be additional.
Risks
Although substantial reductions in nitrogen use can be achieved in many places with no or minimal impacts on yields, reducing nitrogen application by too much can lead to yield declines, which in turn can boost demand for cropland, causing GHG-producing land use change. Reductions in only excess nitrogen application will prevent substantial yield losses.
Some nutrient management practices are associated with additional emissions. For example, nitrification inhibitors reduce direct nitrous oxide emissions (Qiao et al., 2014) but can increase ammonia volatilization and subsequent indirect nitrous oxide emissions (Lam et al., 2016). Additionally, in wet climates, nitrous oxide emissions may be reduced through the use of manure instead of synthetic fertilizers (Hergoualc’h et al., 2019), though impacts vary across sites and studies (Zhang et al., 2020). Increased demand for manure could increase livestock production, which has high associated GHG emissions. Emissions also arise from transporting manure to the site of use (Qin et al., 2021).
Although nitrous oxide has a strong direct climate-warming effect, fertilizer use can cool the climate through emissions of other reactive nitrogen-containing compounds (Gong et al., 2024). First, aerosols from fertilizers scatter heat from the sun and cool the climate (Shindell et al., 2009; Gong et al., 2024). Moreover, other reactive nitrogen compounds from fertilizers shorten the lifespan of methane in the atmosphere, reducing its warming effects (Pinder et al., 2012). Finally, nitrogen fertilizers that leave farm fields through volatilization or runoff are ultimately deposited elsewhere, enhancing photosynthesis and storing more carbon in plants and soils (Zaehle et al., 2011; Gong et al., 2024). Improved nutrient management would reduce these cooling effects.
Interactions with Other Solutions
Reinforcing
Improved nutrient management will reduce emissions from the production phase of biomass crops, increasing their benefit.
(mixed) Improving nutrient management can reduce nutrient pollution in nearby and downstream ecosystems, aiding in their protection or restoration. However, this interaction can be mixed as fertilizer can also enhance terrestrial primary productivity and carbon sequestration in some landscapes.
Competing
Improved nutrient management will reduce the GHG production associated with each calorie and, therefore, the impacts of the Improve Diets and Reduce Food Loss and Waste solutions will be reduced.
Each of these solutions could decrease emissions associated with fertilizer production, but improved nutrient management will reduce total demand for fertilizers.
Evidence Base
Consensus of effectiveness in reducing nitrous oxide emissions from croplands: High
There is high scientific consensus that reducing nitrogen surpluses through improved nutrient management reduces nitrous oxide emissions from croplands.
Nutrient additions to croplands produce an estimated 0.9 Gt CO₂‑eq/yr (range 0.7–1.1 Gt CO₂‑eq/yr ) of direct nitrous oxide emissions from fields, plus approximately 0.3 Gt CO₂‑eq/yr of emissions from fertilizers that runoff into waterways or erode (Tian et al., 2020). Nitrous oxide emissions from croplands are directly linked to the amount of nitrogen applied. Furthermore, the amount of nitrous oxide emitted per unit of applied nitrogen is well quantified for a range of different nitrogen sources and field conditions (Reay et al., 2012; Shcherbak et al., 2014; Gerber et al., 2016; Intergovernmental Panel on Climate Change [IPCC], 2019; Hergoualc’h et al., 2021). Tools to improve nutrient management have been extensively studied, and practices that improve nitrogen use efficiency through right rate, time, place, and type principles have been implemented in some places for several decades (Fixen, 2020; Ludemann et al., 2024).
Recently, Gao & Cabrera Serrenho (2023) estimated that fertilizer-related emissions could be reduced up to 80% by 2050 relative to current levels using a combination of nutrient management and new fertilizer production methods. You et al. (2023) found that adopting improved nutrient management practices would increase nitrogen use efficiency from a global average of 48% to 78%, substantially reducing excess nitrogen. Wang et al. (2024) estimated that the use of enhanced-efficiency fertilizers could reduce nitrogen losses to the environment 70–75% for maize and wheat systems. Chivenge et al. (2021) found comparable results in smallholder systems in Africa and Asia.
The results presented in this document were produced through analysis of global datasets. We recognize that geographic biases can influence the development of global datasets and hope this work inspires research and data sharing on this topic in underrepresented regions.
Take Action
Looking to get involved? Below are some key actions for this solution that can get you started, arranged according to different roles you may play in your professional or personal life.
These actions are meant to be starting points for involvement and are not intended to be prescriptive or necessarily suggest they are the most important or impactful actions to take. We encourage you to explore and get creative!
Lawmakers and Policymakers
- Focus policies and regulations on the four nutrient management principles – right rate, type, time, and place.
- Create dynamic nutrient management policies that account for varying practices, environments, drainage, historical land use, and other factors that may require adjusting nutrient regulations.
- Offer financial assistance responsive to local soil and weather conditions, such as grants and subsidies, insurance programs, and tax breaks, to encourage farmers to comply with regulations.
- Mandate insurance schemes that allow farmers to reduce fertilizer use.
- Mandate nutrient budgets or ceilings that are responsive to local yield, weather, and soil conditions.
- Require farmers to formulate nutrient management and fertilizer plans.
- Mandate efficiency rates for manure-spreading equipment.
- Ensure access to and require soil tests to inform fertilizer application.
- Invest in research on alternative organic nutrient sources.
- Create and expand education programs and extension services that highlight the problems that arise from the overuse of fertilizers, benefits of soil management such as cost-savings, and penalties for non-compliance
- Create ongoing support groups among farmers.
Further information:
- Toolbox. Global Partnership on Nutrient Management
- Government relations and public policy job function action guide. Project Drawdown (2022)
- Legal job function action guide. Project Drawdown (2022)
- Nutrient management. U.S. Department of Agriculture
- Nutrient management. Watershed Agricultural Council
Practitioners
- Use the four nutrient management principles – right rate, type, time, and place – to guide fertilizer application.
- Utilize or advocate for financial assistance and tax breaks for farmers to improve nutrient management techniques.
- Create and adhere to nutrient and fertilizer management plans.
- Conduct soil tests to inform fertilizer application.
- Use winter cover crops, crop rotations, residue retention, and split applications for fertilizer.
- Improve the efficiency of, and regularly calibrate, manure-spreading equipment.
- Leverage agroecological practices such as nutrient recycling and biological nitrogen fixation.
- Join, create, or participate in partnerships or certification programs dedicated to improving nutrient management.
- Take advantage of education programs, support groups, and extension services focused on improved nutrient management.
Further information:
- Toolbox. Global Partnership on Nutrient Management
- Nutrient management. U.S. Department of Agriculture
- Nutrient management. Watershed Agricultural Council
Business Leaders
- Provide incentives for farmers in primary sourcing regions to adopt best management practices for reducing nitrogen application.
- Invest in companies that use improved nutrient management techniques or produce equipment or research for fertilizer application and testing.
- Advocate to policymakers for improved nutrient management techniques, incentives, and regulations.
- Join, create, or participate in partnerships or certification programs dedicated to improving nutrient management practices.
- Promote products produced with improved nutrient management techniques and educate consumers about the importance of the practice.
- Create or support education programs and extension services that highlight the problems that arise from the overuse of fertilizers, benefits of soil management such as cost-savings, and penalties for non-compliance.
- Create ongoing support groups among farmers.
Further information:
- Toolbox. Global Partnership on Nutrient Management
- Climate solutions at work. Project Drawdown (2021)
- Drawdown-aligned business framework. Project Drawdown (2021)
- Nutrient management. U.S. Department of Agriculture
- Nutrient management. Watershed Agricultural Council
Nonprofit Leaders
- Start model farms to demonstrate improved nutrient management techniques, conduct experiments, and educate local farmers.
- Conduct and share research on improved nutrient management techniques, alternative organic fertilizers, or local policy options.
- Advocate to policymakers for improved nutrient management techniques, incentives, and regulations.
- Engage with businesses to encourage corporate responsibility and/or monitor water quality and soil health.
- Join, create, or participate in partnerships or certification programs dedicated to improving nutrient management practices.
- Create or support education programs and extension services that highlight the problems that arise from the overuse of fertilizers, benefits of soil management such as cost-savings, and penalties for non-compliance.
- Create ongoing support groups among farmers.
Further information:
- Toolbox. Global Partnership on Nutrient Management
- Nutrient management. U.S. Department of Agriculture
- Nutrient management. Watershed Agricultural Council
Investors
- Invest in companies developing technologies that support improved nutrient management such as precision fertilizer applicators, alternative fertilizers, soil management equipment, and software.
- Invest in ETFs and ESG funds that hold companies committed to improved nutrient management techniques in their portfolios.
- Encourage companies in your investment portfolio to adopt improved nutrient management.
- Provide access to capital at reduced rates for farmers adhering to improved nutrient management.
Further information:
- Toolbox. Global Partnership on Nutrient Management
- Nutrient management. U.S. Department of Agriculture
- Nutrient management. Watershed Agricultural Council
Philanthropists and International Aid Agencies
- Provide financing for farmers to improve nutrient management.
- Start model farms to demonstrate nutrient management techniques, conduct experiments, and educate local farmers.
- Conduct and share research on improved nutrient management, alternative organic fertilizers, or local policy options.
- Advocate to policymakers for improved nutrient management techniques, incentives, and regulations.
- Engage with businesses to encourage corporate responsibility and/or monitor water quality and soil health.
- Join, create, or participate in partnerships or certification programs dedicated to improving nutrient management practices.
- Create or support education programs and extension services that highlight the problems that arise from the overuse of fertilizers, benefits of soil management such as cost-savings, and penalties for non-compliance.
- Create ongoing support groups among farmers.
Further information:
- Toolbox. Global Partnership on Nutrient Management
- Nutrient management. U.S. Department of Agriculture
- Nutrient management. Watershed Agricultural Council
Thought Leaders
- Start model farms to demonstrate techniques, conduct experiments, and educate local farmers.
- Conduct and share research on improved nutrient management, alternative organic fertilizers, or local policy options.
- Advocate to policymakers for improved nutrient management techniques, incentives, and regulations.
- Engage with businesses to encourage corporate responsibility and/or monitor water quality and soil health.
- Join, create, or participate in partnerships dedicated to improving nutrient management practices.
- Create or support education programs and extension services that highlight the problems that arise from the overuse of fertilizers, benefits of soil management such as cost-savings, and penalties for non-compliance.
- Create ongoing support groups among farmers.
Further information:
- Toolbox. Global Partnership on Nutrient Management
- Nutrient management. U.S. Department of Agriculture
- Nutrient management. Watershed Agricultural Council
Technologists and Researchers
- Improve technology and cost-effectiveness of precision fertilizer application, slow-release fertilizer, alternative organic fertilizers, nutrient recycling, and monitoring equipment.
- Create tracking and monitoring software to support farmers' decision-making.
- Research and develop the application of AI and robotics for precise fertilizer application.
- Improve data and analytics to monitor soil and water quality, assist farmers, support policymaking, and assess the impacts of policies.
- Develop education and training applications to promote improved nutrient management and provide real-time feedback.
Further information:
- Toolbox. Global Partnership on Nutrient Management
- Nutrient management. U.S. Department of Agriculture
- Nutrient management. Watershed Agricultural Council
Communities, Households, and Individuals
- Create or join community-supported agriculture programs that source from farmers who used improved nutrient management practices.
- Conduct soil tests on your lawn and garden and reduce fertilizer use if you are over-fertilizing.
- Volunteer for soil and water quality monitoring and restoration projects.
- Start model farms to demonstrate techniques, conduct experiments, and educate local farmers.
- Advocate to policymakers for improved nutrient management techniques, incentives, and regulations.
- Engage with businesses to encourage corporate responsibility and/or monitor water quality and soil health.
- Join, create, or participate in partnerships dedicated to improving nutrient management.
- Create or support education programs and extension services that highlight the problems that arise from the overuse of fertilizers, benefits of soil management such as cost-savings, and penalties for non-compliance.
- Create ongoing support groups among farmers.
Further information:
- Toolbox. Global Partnership on Nutrient Management
- Nutrient management. U.S. Department of Agriculture
- Nutrient management. Watershed Agricultural Council
“Take Action” Sources
- Which factors influence farmers’ intentions to adopt nutrient management planning?, Daxini, A., et al. (2018)
- Quantification of environmental-economic trade-offs in nutrient management policies, Kaye-Blake, et al. (2019)
- Regulating farmer nutrient management: A three-state case study on the Delmarva Peninsula, Perez, M. R. (2015)
- Promise and performance of agricultural nutrient management policy: lessons from the Baltic Sea, Thorsøe, M. H., et al. (2021)
- Exploring nutrient management options to increase nitrogen and phosphorus use efficiencies in food production of China, Wang, M., et al. (2018)
- Quantifying nutrient budgets for sustainable nutrient management, Zhang, X., et al. (2020)
References
Adalibieke, W., Cui, X., Cai, H., You, L., & Zhou, F. (2023). Global crop-specific nitrogen fertilization dataset in 1961–2020. Scientific Data, 10(1), 617. Link to source: https://doi.org/10.1038/s41597-023-02526-z
Almaraz, M., Bai, E., Wang, C., Trousdell, J., Conley, S., Faloona, I., & Houlton, B. Z. (2018). Agriculture is a major source of NOx pollution in California. Science Advances, 4(1), eaao3477. Link to source: https://doi.org/10.1126/sciadv.aao3477
Antil, R. S., & Raj, D. (2020). Integrated nutrient management for sustainable crop production and improving soil health. In R. S. Meena (Ed.), Nutrient Dynamics for Sustainable Crop Production (pp. 67–101). Springer. Link to source: https://doi.org/10.1007/978-981-13-8660-2_3
Bijay-Singh, & Craswell, E. (2021). Fertilizers and nitrate pollution of surface and ground water: An increasingly pervasive global problem. SN Applied Sciences, 3(4), 518. Link to source: https://doi.org/10.1007/s42452-021-04521-8
Chivenge, P., Saito, K., Bunquin, M. A., Sharma, S., & Dobermann, A. (2021). Co-benefits of nutrient management tailored to smallholder agriculture. Global Food Security, 30, 100570. Link to source: https://doi.org/10.1016/j.gfs.2021.100570
Deng, J., Guo, L., Salas, W., Ingraham, P., Charrier-Klobas, J. G., Frolking, S., & Li, C. (2018). Changes in irrigation practices likely mitigate nitrous oxide emissions from California cropland. Global Biogeochemical Cycles, 32(10), 1514–1527. Link to source: https://doi.org/10.1029/2018GB005961
Domingo, N. G. G., Balasubramanian, S., Thakrar, S. K., Clark, M. A., Adams, P. J., Marshall, J. D., Muller, N. Z., Pandis, S. N., Polasky, S., Robinson, A. L., Tessum, C. W., Tilman, D., Tschofen, P., & Hill, J. D. (2021). Air quality–related health damages of food. Proceedings of the National Academy of Sciences, 118(20), e2013637118. Link to source: https://doi.org/10.1073/pnas.2013637118
Elberling, B. B., Kovács, G. M., Hansen, H. F. E., Fensholt, R., Ambus, P., Tong, X., Gominski, D., Mueller, C. W., Poultney, D. M. N., & Oehmcke, S. (2023). High nitrous oxide emissions from temporary flooded depressions within croplands. Communications Earth & Environment, 4(1), 1–9. Link to source: https://doi.org/10.1038/s43247-023-01095-8
Fixen, P. E. (2020). A brief account of the genesis of 4R nutrient stewardship. Agronomy Journal, 112(5), 4511–4518. Link to source: https://doi.org/10.1002/agj2.20315
Foley, J. A., Ramankutty, N., Brauman, K. A., Cassidy, E. S., Gerber, J. S., Johnston, M., Mueller, N. D., O’Connell, C., Ray, D. K., West, P. C., Balzer, C., Bennett, E. M., Carpenter, S. R., Hill, J., Monfreda, C., Polasky, S., Rockström, J., Sheehan, J., Siebert, S., … Zaks, D. P. M. (2011). Solutions for a cultivated planet. Nature, 478(7369), 337–342. Link to source: https://doi.org/10.1038/nature10452
Gao, Y., & Cabrera Serrenho, A. (2023). Greenhouse gas emissions from nitrogen fertilizers could be reduced by up to one-fifth of current levels by 2050 with combined interventions. Nature Food, 4(2), 170–178. Link to source: https://doi.org/10.1038/s43016-023-00698-w
Gerber, J. S., Carlson, K. M., Makowski, D., Mueller, N. D., Garcia de Cortazar-Atauri, I., Havlík, P., Herrero, M., Launay, M., O’Connell, C. S., Smith, P., & West, P. C. (2016). Spatially explicit estimates of nitrous oxide emissions from croplands suggest climate mitigation opportunities from improved fertilizer management. Global Change Biology, 22(10), 3383–3394. Link to source: https://doi.org/10.1111/gcb.13341
Gerber, J. S., Ray, D. K., Makowski, D., Butler, E. E., Mueller, N. D., West, P. C., Johnson, J. A., Polasky, S., Samberg, L. H., & Siebert, S. (2024). Global spatially explicit yield gap time trends reveal regions at risk of future crop yield stagnation. Nature Food, 5(2), 125–135. Link to source: https://doi.org/10.1038/s43016-023-00913-8
Gong, C., Tian, H., Liao, H., Pan, N., Pan, S., Ito, A., Jain, A. K., Kou-Giesbrecht, S., Joos, F., Sun, Q., Shi, H., Vuichard, N., Zhu, Q., Peng, C., Maggi, F., Tang, F. H. M., & Zaehle, S. (2024). Global net climate effects of anthropogenic reactive nitrogen. Nature, 632(8025), 557–563. Link to source: https://doi.org/10.1038/s41586-024-07714-4
Gu, B., Zhang, X., Lam, S. K., Yu, Y., van Grinsven, H. J. M., Zhang, S., Wang, X., Bodirsky, B. L., Wang, S., Duan, J., Ren, C., Bouwman, L., de Vries, W., Xu, J., Sutton, M. A., & Chen, D. (2023). Cost-effective mitigation of nitrogen pollution from global croplands. Nature, 613(7942), 77–84. Link to source: https://doi.org/10.1038/s41586-022-05481-8
Hergoualc’h, K., Akiyama, H., Bernoux, M., Chirinda, N., del Prado, A., Kasimir, Å., MacDonald, J. D., Ogle, S. M., Regina, K., & van der Weerden, T. J. (2019). Chapter 11: nitrous oxide Emissions from managed soils, and CO2 emissions from lime and urea application (2019 Refinement to the 2006 IPCC Guidelines for National Greenhouse Gas Inventories). Intergovernmental Panel on Climate Change. https://www.ipcc-nggip.iges.or.jp/public/2019rf/pdf/4_Volume4/19R_V4_Ch11_Soils_nitrous oxide_CO2.pdf
Hergoualc’h, K., Mueller, N., Bernoux, M., Kasimir, Ä., van der Weerden, T. J., & Ogle, S. M. (2021). Improved accuracy and reduced uncertainty in greenhouse gas inventories by refining the IPCC emission factor for direct nitrous oxide emissions from nitrogen inputs to managed soils. Global Change Biology, 27(24), 6536–6550. Link to source: https://doi.org/10.1111/gcb.15884
IPCC, 2019. Summary for Policymakers. In: Climate Change and Land: an IPCC special report on climate change, desertification, land degradation, sustainable land management, food security, and greenhouse gas fluxes in terrestrial ecosystems [P.R. Shukla, J. Skea, E. Calvo Buendia, V. Masson-Delmotte, H.-O. Pörtner, D. C. Roberts, P. Zhai, R. Slade, S. Connors, R. van Diemen, M. Ferrat, E. Haughey, S. Luz, S. Neogi, M. Pathak, J. Petzold, J. Portugal Pereira, P. Vyas, E. Huntley, K. Kissick, M. Belkacemi, J. Malley, (eds.)].
Lam, S. K., Suter, H., Mosier, A. R., & Chen, D. (2017). Using nitrification inhibitors to mitigate agricultural nitrous oxide emission: A double-edged sword? Global Change Biology, 23(2), 485–489. Link to source: https://doi.org/10.1111/gcb.13338
Lawrence, N. C., Tenesaca, C. G., VanLoocke, A., & Hall, S. J. (2021). Nitrous oxide emissions from agricultural soils challenge climate sustainability in the US Corn Belt. Proceedings of the National Academy of Sciences, 118(46), e2112108118. Link to source: https://doi.org/10.1073/pnas.2112108118
Ludemann, C. I., Wanner, N., Chivenge, P., Dobermann, A., Einarsson, R., Grassini, P., Gruere, A., Jackson, K., Lassaletta, L., Maggi, F., Obli-Laryea, G., van Ittersum, M. K., Vishwakarma, S., Zhang, X., & Tubiello, F. N. (2024). A global FAOSTAT reference database of cropland nutrient budgets and nutrient use efficiency (1961–2020): Nitrogen, phosphorus and potassium. Earth System Science Data, 16(1), 525–541. Link to source: https://doi.org/10.5194/essd-16-525-2024
Menegat, S., Ledo, A., & Tirado, R. (2022). Greenhouse gas emissions from global production and use of nitrogen synthetic fertilisers in agriculture. Scientific Reports, 12(1), 14490. Link to source: https://doi.org/10.1038/s41598-022-18773-w
Michaelowa, A., Hermwille, L., Obergassel, W., & Butzengeiger, S. (2019). Additionality revisited: Guarding the integrity of market mechanisms under the Paris Agreement. Climate Policy, 19(10), 1211–1224. Link to source: https://doi.org/10.1080/14693062.2019.1628695
Mueller, N. D., Gerber, J. S., Johnston, M., Ray, D. K., Ramankutty, N., & Foley, J. A. (2012). Closing yield gaps through nutrient and water management. Nature, 490(7419), Article 7419. Link to source: https://doi.org/10.1038/nature11420
Patel, N., Srivastav, A. L., Patel, A., Singh, A., Singh, S. K., Chaudhary, V. K., Singh, P. K., & Bhunia, B. (2022). Nitrate contamination in water resources, human health risks and its remediation through adsorption: A focused review. Environmental Science and Pollution Research, 29(46), 69137–69152. Link to source: https://doi.org/10.1007/s11356-022-22377-2
Pinder, R. W., Davidson, E. A., Goodale, C. L., Greaver, T. L., Herrick, J. D., & Liu, L. (2012). Climate change impacts of US reactive nitrogen. Proceedings of the National Academy of Sciences, 109(20), 7671–7675. Link to source: https://doi.org/10.1073/pnas.1114243109
Porter, E. M., Bowman, W. D., Clark, C. M., Compton, J. E., Pardo, L. H., & Soong, J. L. (2013). Interactive effects of anthropogenic nitrogen enrichment and climate change on terrestrial and aquatic biodiversity. Biogeochemistry, 114(1), 93–120. Link to source: https://doi.org/10.1007/s10533-012-9803-3
Qiao, C., Liu, L., Hu, S., Compton, J. E., Greaver, T. L., & Li, Q. (2015). How inhibiting nitrification affects nitrogen cycle and reduces environmental impacts of anthropogenic nitrogen input. Global Change Biology, 21(3), 1249–1257. Link to source: https://doi.org/10.1111/gcb.12802
Qin, Z., Deng, S., Dunn, J., Smith, P., & Sun, W. (2021). Animal waste use and implications to agricultural greenhouse gas emissions in the United States. Environmental Research Letters, 16(6), 064079. Link to source: https://doi.org/10.1088/1748-9326/ac04d7
Reay, D. S., Davidson, E. A., Smith, K. A., Smith, P., Melillo, J. M., Dentener, F., & Crutzen, P. J. (2012). Global agriculture and nitrous oxide emissions. Nature Climate Change, 2(6), 410–416. Link to source: https://doi.org/10.1038/nclimate1458
Rockström, J., Williams, J., Daily, G., Noble, A., Matthews, N., Gordon, L., Wetterstrand, H., DeClerck, F., Shah, M., Steduto, P., de Fraiture, C., Hatibu, N., Unver, O., Bird, J., Sibanda, L., & Smith, J. (2017). Sustainable intensification of agriculture for human prosperity and global sustainability. Ambio, 46(1), 4–17. Link to source: https://doi.org/10.1007/s13280-016-0793-6
Rurinda, J., Zingore, S., Jibrin, J. M., Balemi, T., Masuki, K., Andersson, J. A., Pampolino, M. F., Mohammed, I., Mutegi, J., Kamara, A. Y., Vanlauwe, B., & Craufurd, P. Q. (2020). Science-based decision support for formulating crop fertilizer recommendations in sub-Saharan Africa. Agricultural Systems, 180, 102790. Link to source: https://doi.org/10.1016/j.agsy.2020.102790
Scavia, D., David Allan, J., Arend, K. K., Bartell, S., Beletsky, D., Bosch, N. S., Brandt, S. B., Briland, R. D., Daloğlu, I., DePinto, J. V., Dolan, D. M., Evans, M. A., Farmer, T. M., Goto, D., Han, H., Höök, T. O., Knight, R., Ludsin, S. A., Mason, D., … Zhou, Y. (2014). Assessing and addressing the re-eutrophication of Lake Erie: Central basin hypoxia. Journal of Great Lakes Research, 40(2), 226–246. Link to source: https://doi.org/10.1016/j.jglr.2014.02.004
Selim, M. M. (2020). Introduction to the integrated nutrient management strategies and their contribution to yield and soil properties. International Journal of Agronomy, 2020(1), 2821678. https://doi.org/10.1155/2020/2821678
Shcherbak, I., Millar, N., & Robertson, G. P. (2014). Global metaanalysis of the nonlinear response of soil nitrous oxide (nitrous oxide) emissions to fertilizer nitrogen. Proceedings of the National Academy of Sciences, 111(25), 9199–9204. Link to source: https://doi.org/10.1073/pnas.1322434111
Shindell, D. T., Faluvegi, G., Koch, D. M., Schmidt, G. A., Unger, N., & Bauer, S. E. (2009). Improved attribution of climate forcing to emissions. Science, 326(5953), 716–718. Link to source: https://doi.org/10.1126/science.1174760
Sobota, D. J., Compton, J. E., McCrackin, M. L., & Singh, S. (2015). Cost of reactive nitrogen release from human activities to the environment in the United States. Environmental Research Letters, 10(2), 025006. Link to source: https://doi.org/10.1088/1748-9326/10/2/025006
Tian, H., Xu, R., Canadell, J. G., Thompson, R. L., Winiwarter, W., Suntharalingam, P., Davidson, E. A., Ciais, P., Jackson, R. B., Janssens-Maenhout, G., Prather, M. J., Regnier, P., Pan, N., Pan, S., Peters, G. P., Shi, H., Tubiello, F. N., Zaehle, S., Zhou, F., … Yao, Y. (2020). A comprehensive quantification of global nitrous oxide sources and sinks. Nature, 586(7828), 248–256. Link to source: https://doi.org/10.1038/s41586-020-2780-0
van Grinsven, H. J. M., Bouwman, L., Cassman, K. G., van Es, H. M., McCrackin, M. L., & Beusen, A. H. W. (2015). Losses of ammonia and nitrate from agriculture and their effect on nitrogen recovery in the European Union and the United States between 1900 and 2050. Journal of Environmental Quality, 44(2), 356–367. Link to source: https://doi.org/10.2134/jeq2014.03.0102
Vanlauwe, B., Descheemaeker, K., Giller, K. E., Huising, J., Merckx, R., Nziguheba, G., Wendt, J., & Zingore, S. (2015). Integrated soil fertility management in sub-Saharan Africa: Unravelling local adaptation. SOIL, 1(1), 491–508. Link to source: https://doi.org/10.5194/soil-1-491-2015
Wang, C., Shen, Y., Fang, X., Xiao, S., Liu, G., Wang, L., Gu, B., Zhou, F., Chen, D., Tian, H., Ciais, P., Zou, J., & Liu, S. (2024). Reducing soil nitrogen losses from fertilizer use in global maize and wheat production. Nature Geoscience, 17(10), 1008–1015. Link to source: https://doi.org/10.1038/s41561-024-01542-x
Wang, Y., Li, C., Li, Y., Zhu, L., Liu, S., Yan, L., Feng, G., & Gao, Q. (2020). Agronomic and environmental benefits of Nutrient Expert on maize and rice in Northeast China. Environmental Science and Pollution Research, 27(22), 28053–28065. Link to source: https://doi.org/10.1007/s11356-020-09153-w
Ward, M. H., Jones, R. R., Brender, J. D., de Kok, T. M., Weyer, P. J., Nolan, B. T., Villanueva, C. M., & van Breda, S. G. (2018). Drinking water nitrate and human health: an updated review. International Journal of Environmental Research and Public Health, 15(7), 1557. Link to source: https://doi.org/10.3390/ijerph15071557
Withers, P. J. A., Neal, C., Jarvie, H. P., & Doody, D. G. (2014). Agriculture and eutrophication: where do we go from here? Sustainability, 6(9), Article 9. Link to source: https://doi.org/10.3390/su6095853
You, L., Ros, G. H., Chen, Y., Shao, Q., Young, M. D., Zhang, F., & de Vries, W. (2023). Global mean nitrogen recovery efficiency in croplands can be enhanced by optimal nutrient, crop and soil management practices. Nature Communications, 14(1), 5747. Link to source: https://doi.org/10.1038/s41467-023-41504-2
Zaehle, S., Ciais, P., Friend, A. D., & Prieur, V. (2011). Carbon benefits of anthropogenic reactive nitrogen offset by nitrous oxide emissions. Nature Geoscience, 4(9), 601–605. Link to source: https://doi.org/10.1038/ngeo1207
Zhang, X., Fang, Q., Zhang, T., Ma, W., Velthof, G. L., Hou, Y., Oenema, O., & Zhang, F. (2020). Benefits and trade-offs of replacing synthetic fertilizers by animal manures in crop production in China: A meta-analysis. Global Change Biology, 26(2), 888–900. Link to source: https://doi.org/10.1111/gcb.14826
Appendix
In this analysis, we calculated the potential for reducing crop nitrogen inputs and associated nitrous oxide emissions by integrating spatially explicit, crop-specific data on nitrogen inputs, crop yields, attainable yields, irrigated extent, and climate. Broadly, we calculated a “target” yield-scaled nitrogen input rate based on pixels with low yield gaps and calculated the difference between nitrous oxide emissions under the current rate and under the hypothetical target emissions rate, using nitrous oxide emissions factors disaggregated by fertilizer type and climate.
Emissions Factors
We used Tier 1 emissions factors from the IPCC 2019 Refinement to the 2006 Guidelines for National Greenhouse Gas Inventories, including direct emissions factors as well as indirect emissions from volatilization and leaching pathways. Direct emissions factors represent the proportion of applied nitrogen emitted as nitrous oxide, while we calculated volatilization and leaching emissions factors by multiplying the proportion of applied nitrogen lost through these pathways by the proportion of volatilized or leached nitrogen ultimately emitted as nitrous oxide. Including both direct and indirect emissions, organic and synthetic fertilizers emit 4.97 kg CO₂‑eq/kg nitrogen and 8.66 kg CO₂‑eq/kg nitrogen, respectively, in wet climates, and 2.59 kg CO₂‑eq/kg nitrogen and 2.38 kg CO₂‑eq/kg nitrogen in dry climates. We included uncertainty bounds (2.5th and 97.5th percentiles) for all emissions factors.
We classified each pixel as “wet” or “dry” using an aridity index (AI) threshold of 0.65, calculated as the ratio of annual precipitation to potential evapotranspiration (PET) from TerraClimate data (1991–2020), based on a threshold of 0.65. For pixels in dry climates that contained irrigation, we took the weighted average of wet and dry emissions factors based on the fraction of cropland that was irrigated (Mehta et al., 2024). We excluded irrigated rice from this analysis due to large differences in nitrous oxide dynamics in flooded rice systems.
Current, Target, and Avoidable Nitrogen Inputs and Emissions
Using highly disaggregated data on nitrogen inputs from Adalibieke et al. (2024) for 21 crop groups (Table S1), we calculated total crop-specific inputs of synthetic and organic nitrogen. We then averaged over 2016–2020 to reduce the influence of interannual variability in factors like fertilizer prices. These values are subsequently referred to as “current” nitrogen inputs. We calculated nitrous oxide emissions under current nitrogen inputs as the sum of the products of nitrogen inputs and the climatically relevant emissions factors for each fertilizer type.
Next, we calculated target nitrogen application rates in terms of kg nitrogen per ton of crop yield using data on actual and attainable yields for 17 crops from Gerber et al., 2024 (Table S1). For each crop, we first identified pixels in which the ratio of actual to attainable yields was above the 80th percentile globally. The target nitrogen application rate was then calculated as the 20th percentile of nitrogen application rates across low-yield-gap pixels. Finally, we calculated total target nitrogen inputs as the product of actual yields and target nitrogen input rates. We calculated hypothetical nitrous oxide emissions from target nitrogen inputs as the product of nitrogen inputs and the climatically relevant emissions factor for each fertilizer type.
The difference between current and target nitrogen inputs represents the amount by which nitrogen inputs could hypothetically be reduced without compromising crop productivity (i.e., “avoidable” nitrogen inputs). We calculated avoidable nitrous oxide emissions as the difference between nitrous oxide emissions with current nitrogen inputs and those with target nitrogen inputs. For crops for which no yield or attainable yield data were available, we applied the average percent reduction in nitrogen inputs under the target scenario from available crops to the nitrogen input data for missing crops to calculate the avoidable nitrogen inputs and emissions.
This simple and empirically driven method aimed to identify realistically low but nutritionally adequate nitrogen application rates by including only pixels with low yield gaps, which are unlikely to be substantially nutrient-constrained. We did not control for other factors affecting nitrogen availability, such as historical nutrient application rates or depletion, rotation with nitrogen fixing crops, or tillage and residue retention practices.
Table S1. Crops represented by the source data on nitrogen inputs (Adalibieke et al., 2024) and estimated and attainable yields (Gerber et al., 2024). Crop groups included consistently in both datasets are marked as “both,” and crop groups represented in the nitrogen input data but not in the yield datasets are marked as “nitrogen only.”
| Crop | Dataset(s) |
|---|---|
| Barley | Both |
| Cassava | Both |
| Cotton | Both |
| Maize | Both |
| Millet | Both |
| Oil palm | Both |
| Potato | Both |
| Rice | Both |
| Rye | Both |
| Rapeseed | Both |
| Sorghum | Both |
| Soybean | Both |
| Sugarbeet | Both |
| Sugarcane | Both |
| Sunflower | Both |
| Sweet potato | Both |
| Wheat | Both |
| Groundnut | Nitrogen only |
| Fruits | Nitrogen only |
| Vegetables | Nitrogen only |
| Other | Nitrogen only |
Credits
Lead Fellow
Avery Driscoll
Contributors
Ruthie Burrows, Ph.D.
James Gerber, Ph.D.
Yusuf Jameel, Ph.D.
Daniel Jasper
Alex Sweeney
Eric Toensmeier
Internal Reviewers
Aiyana Bodi
Hannah Henkin
Ted Otte
Methods and Supporting Data
-
Greenhouse gas quantity expressed relative to CO₂ with the same warming impact over 100 years, calculated by multiplying emissions by the 100-yr GWP for the emitted gases.
-
Greenhouse gas quantity expressed relative to CO₂ with the same warming impact over 20 years, calculated by multiplying emissions by the 20-yr GWP for the emitted gases.
-
8th World Congress on Conservation Agriculture
-
Reducing greenhouse gas concentrations in the atmosphere by preventing or reducing emissions.
-
A liquid with a low pH (below 7).
-
The process of increasing acidity.
-
The extent to which emissions reduction or carbon removal is above and beyond what would have occurred without implementing a particular action or solution.
-
An upper limit on solution adoption based on physical or technical constraints, not including economic or policy barriers. This level is unlikely to be reached and will not be exceeded.
-
The quantity and metric to measure implementation for a particular solution that is used as the reference unit for calculations within that solution.
-
A composting method in which organic waste is processed in freestanding piles that can be aerated actively with forced air or passively by internal convection.
-
The interactions of aerodynamic forces and flexible structures, often including the stucture's control system.
-
A process in which microbes break down organic materials in the presence of oxygen. This process converts food and green waste into nutrient-rich compost.
-
Establishment of new forests in areas that did not historically support forests.
-
Farming practices that work to create socially and ecologically sustainable food production.
-
Addition of trees and shrubs to crop or animal farming systems.
-
Artificial intelligence
-
Spread out the cost of an asset over its useful lifetime.
-
A process in which microorganisms break down organic material in the absence of oxygen. Methane and CO₂ are the main byproducts.
-
A crop that live one year or less from planting to harvest; also called annual.
-
aerated static piles
-
Hardware required to support PV modules and arrays, including racking and mounting structures, wires, and other physical components.
-
Building Automation System(s)
-
Electric power delivered at a steady, around-the-clock rate, to cover power demand that exists at all times. Baseload power is typically supplied by high availability, low operating-cost plants, such as nuclear or geothermal.
-
A liquid with a high pH (above 7).
-
black carbon
-
Solar panels that generate electricity from sunlight captured on both sides, increasing energy output by reflecting light from the ground and surroundings.
-
Made from material of biological origin, such as plants, animals, or other organisms.
-
A renewable energy source generated from organic matter from plants and/or algae.
-
An energy source composed primarily of methane and CO₂ that is produced by microorganisms when organic matter decomposes in the absence of oxygen.
-
Carbon stored in biological matter, including soil, plants, fungi, and plant products (e.g., wood, paper, biofuels). This carbon is sequestered from the atmosphere but can be released through decomposition or burning.
-
Living or dead renewable matter from plants or animals, not including organic material transformed into fossil fuels. Peat, in early decay stages, is partially renewable biomass.
-
Biogas refined to the same quality as natural gas. CO₂ and impurities are removed, and the biomethane can be distributed and used in existing natural gas technologies.
-
A type of carbon sequestration that captures carbon from CO₂ via photosynthesis and stores it in soils, sediments, and biomass, distinct from sequestration through chemical or industrial pathways.
-
A synthetic organic compound used to make a type of hard, clear plastic for food and drink packaging and many consumer goods.
-
A climate pollutant, also called soot, produced from incomplete combustion of organic matter, either naturally (wildfires) or from human activities (biomass or fossil fuel burning).
-
A secure, decentralized way of digitally tracking transactions that could be used to improve the transparency and efficiency of carbon markets.
-
Fixed income debt instruments focused on sustainable ocean projects. Blue bonds work in the same manner as traditional bonds and may be issued by corporations, financial institutions, and governments.
-
A global initiative launched by Germany and the IUCN in 2011 to restore 150 Mha of land by 2020 and 350 Mha by 2030.
-
High-latitude (>50°N or >50°S) climate regions characterized by short growing seasons and cold temperatures.
-
Balance-of-system
-
bisphenol A
-
Revenue from carbon credits reserved for payout to land- and rights-holders in the event of a disturbance such as a fire; similar to insurance scheme.
-
The components of a building that physically separate the indoors from the outdoor environment.
-
Businesses involved in the sale and/or distribution of solution-related equipment and technology, and businesses that want to support adoption of the solution.
-
Compound annual growth rate
-
A chemical reaction involving heating a solid to a high temperature; to make cement clinker, limestone is calcined into lime in a process that requires high heat and produces CO₂.
-
The ratio of the actual electricity an energy technology generates over a period of time to the maximum it could have produced if it operated continuously at full capacity.
-
A four-wheeled passenger vehicle.
-
Average number of people traveling in a car per trip.
-
Technologies that collect CO₂ before it enters the atmosphere, preventing emissions at their source. Collected CO₂ can be used onsite or in new products, or stored long term to prevent release.
-
A greenhouse gas that is naturally found in the atmosphere. Its atmospheric concentration has been increasing due to human activities, leading to warming and climate impacts.
-
Total GHG emissions resulting from a particular action, material, technology, or sector.
-
Amount of GHG emissions released per activity or unit of production.
-
A marketplace where carbon credits are purchased and sold. One carbon credit represents activities that avoid, reduce, or remove one metric ton of GHG emissions.
-
A colorless, odorless gas released during the incomplete combustion of fuels containing carbon. Carbon monoxide can harm health and be fatal at high concentrations.
-
The time it takes for the emissions reduction from a measure to equal the emissions invested in implementing the measure.
-
Activities or technologies that pull CO₂ out of the atmosphere, including enhancing natural carbon sinks and deploying engineered sinks.
-
Long-term storage of carbon in soils, sediment, biomass, oceans, and geologic formations after removal of CO₂ from the atmosphere or CO₂ capture from industrial and power generation processes.
-
The interconnected pool of dissolved inorganic carbon forms in water. Composed of dissolved CO₂, carbonic acid, bicarbonate ions, and carbonate ions.
-
The stocking rate a pasture can sustain without degrading forage supply or vegetation condition.
-
carbon capture and storage
-
carbon capture, utilization, and storage
-
Cooling degree days
-
A binding ingredient in concrete responsible for most of concrete’s life-cycle emissions. Cement is made primarily of clinker mixed with other mineral components.
-
chlorofluorocarbon
-
Processes that use chemical reactions or heat to break down plastic waste into basic molecular components or feedstocks that can then be used to make new plastic products.
-
Process that uses chemical reactions or heat to break down plastic waste into basic molecular components that can be used to make new plastic products.
-
methane
-
A system in which resources, materials, and products are used for as long as possible through reuse, repair, refurbishment, and recycling.
-
Energy sources that have little to no negative environmental or climate impacts during operation relative to fossil fuel–based energy sources.
-
A factor that warms or cools the planet.
-
Gases or particles that have a planet-warming effect when released to the atmosphere. Some climate pollutants also cause other forms of environmental damage.
-
Areas that have natural buffers from local climate change impacts, offering safe havens for species and ecosystems.
-
A binding ingredient in cement responsible for most of the life-cycle emissions from cement and concrete production.
-
A waste management process where waste is made into the same original product, preserving quality and value so materials can be reused multiple times while keeping resources in continuous use.
-
A system that encompasses both forward supply chains (from producer to consumer) and reverse logistics for reuse, recycling, or proper disposal.
-
Neighbors, volunteer organizations, hobbyists and interest groups, online communities, early adopters, individuals sharing a home, and private citizens seeking to support the solution.
-
A solution that potentially lowers the benefit of another solution through reduced effectiveness, higher costs, reduced or delayed adoption, or diminished global climate impact.
-
The average annual rate at which a value grows over a specified period, assuming profits are reinvested and growth occurs steadily each year.
-
Funding with substantially more generous terms than market loans (typically due to lower interest rates, longer repayment periods, or partial grants) used to support projects with public or development benefits.
-
A farming system that combines reduced tillage, cover crops, and crop rotations.
-
The proportion of water used or applied that is evaporated, transpired, or incorporated into a product and therefore is not returned to the local hydrological system through runoff or leaching.
-
Risk-sharing financial agreements in which two parties (e.g., renewable generator, government) guarantee a fixed price (e.g., electricity price). If market prices fluctuate, one party pays the other the difference.
-
Persistent long, thin clouds that form behind aircraft when water vapor in the exhaust condenses, then freezes into ice crystals at high altitudes.
-
A measure of the total space cooling demand to maintain an indoor temperature below 24 °C
-
carbon dioxide
-
A measure standardizing the warming effects of greenhouse gases relative to CO₂. CO₂-eq is calculated as quantity (metric tons) of a particular gas multiplied by its GWP.
-
carbon dioxide equivalent
-
Plant materials left over after a harvest, such as stalks, leaves, and seed husks.
-
A granular material made by crushing broken or waste glass.
-
direct air capture
-
Financial agreements in which government creditors forgive a portion of debt in exchange for specific conservation commitments.
-
The process of cutting greenhouse gas emissions (primarily CO₂) from a particular sector or activity.
-
An industrial process that removes printing ink from used or waste paper fibers, creating clean pulp that can be turned into new paper products.
-
A solution that works slower than gradual solutions and is expected to take longer to reach its full potential.
-
Microbial conversion of nitrate into inert nitrogen gas under low-oxygen conditions, which produces the greenhouse gas nitrous oxide as an intermediate compound.
-
Electronic document that verifies whether a product has been manufactured according to environmental and social standards and/or material origins, environmental impact, and disposal recommendations.
-
Electronic documents that verify whether or not a product has been manufactured according to environmental and social standards and/or material origins, environmental impact, and disposal recommendations.
-
Greenhouse gas emissions produced as a direct result of the use of a technology or practice.
-
Electric power that can be increased, decreased, or turned on/off to match real-time fluctuations in grid conditions. Typically supplied by fast-responding plants such as natural gas, hydroelectric, or battery storage.
-
The inorganic forms of carbon dissolved in seawater. Composed of dissolved CO₂, carbonic acid, bicarbonate ions, and carbonate ions.
-
A system of underground distribution pipes that supply heat from centralized sources to a large number of buildings for space and water heating or industrial use.
-
A window consisting of two glass panes separated by a sealed gap and typically filled with air or an inert gas to improve the heat flow resistance.
-
A waste management system that transforms waste into different products of lower quality and value, making materials harder to recycle again and limiting reuse.
-
Flexible benchmarks derived from independent, publicly available, frequently updated data sets.
-
European Energy Agency
-
Ability of a solution to reduce emissions or remove carbon, expressed in CO₂-eq per installed adoption unit. Effectiveness is quantified per year when the adoption unit is cumulative over time.
-
Enhanced geothermal system
-
Exajoule (one quintillion joules)
-
A process that uses electric current to drive a reaction, such as using electricity to split water molecules into hydrogen and oxygen.
-
Produced by electrolysis.
-
Greenhouse gas emissions accrued over the lifetime of a material or product, including as it is produced, transported, used, and disposed of.
-
Solutions that work faster than gradual solutions, front-loading their impact in the near term.
-
Methane produced by microbes in the digestive tracts of ruminant livestock, such as cattle, sheep and goats.
-
The unintended capture of organisms in intake flows.
-
Environmental Protection Agency
-
Extended Producer Responsibility
-
expanded polystyrene
-
Environmental Research & Education Foundation
-
environmental, social, and governance
-
exchange-traded fund
-
A process triggered by an overabundance of nutrients in water, particularly nitrogen and phosphorus, that stimulates excessive plant and algae growth and can harm aquatic organisms.
-
Electric vehicle
-
The movement of water from the earth’s surface to the atmosphere directly from land or water surfaces (evaporation) and through plant tissues (transpiration).
-
The scientific literature that supports our assessment of a solution's effectiveness.
-
A policy framework that assigns responsibility to producers for the end-of-life servicing of their products.
-
A group of human-made molecules that contain fluorine atoms. They are potent greenhouse gases with GWPs that can be hundreds to thousands times higher than CO₂.
-
Food, agriculture, land, and ocean
-
Food and Agriculture Organization of the United Nations
-
feed conversion ratio
-
The efficiency with which an animal converts feed into increased body mass, measured as the ratio of the weight of the feed given to weight gain. Lower FCR means less feed for the same growth.
-
A policy mechanism that incentivizes renewables through contracts that guarantee a set price for the electricity generated.
-
Raw material inputs for manufacturing, processing, and managing waste.
-
Containing or consisting of iron.
-
A measure of fishing activity over time and area, commonly measured by number of trips, vessel time, or gear deployed.
-
A solar PV system with panels mounted at a constant angle.
-
Glass is manufactured by floating molten glass on a molten tin bath, producing a smooth, flat product with high optical clarity, often used for window applications.
-
food loss and waste
-
Food discarded during pre-consumer supply chain stages, including production, harvest, and processing.
-
Food discarded during pre-consumer supply chain stages, including production, harvest, and processing, along with food discarded wt the retail and consumer stages of the supply chain.
-
Food discarded at the retail and consumer stages of the supply chain.
-
Combustible materials found in Earth's crust that can be burned for energy, including oil, natural gas, and coal. They are formed from decayed organisms through prehistoric geological processes.
-
Free, prior, and informed consent
-
A principled process of working with Indigenous communities that requires consent from Indigenous peoples for any decision, action, or activity that impacts their community and/or lands.
-
Unintentional leaks of gases or vapor into the atmosphere.
-
A group of countries representing the majority of the world's population, trade, and GDP. There are 19 member countries plus the European Union and the African Union
-
Gas collection and control system
-
A design or approach to policy, programs, or activities that addresses the different situations, roles, needs, and interests of women, men, girls, and boys.
-
Manipulating the environment to influence the quantities or impact of climate pollutants in the atmosphere.
-
greenhouse gas
-
Global horizontal irradiance
-
gigajoule or billion joules
-
The glass layers or panes in a window.
-
The intensity of all solar radiant energy on a horizontal surface over a specific time frame, which limits PV power output. Measured as energy per area per year (kWh/m2/yr).
-
A measure of how effectively a gas traps heat in the atmosphere relative to CO₂. GWP converts greenhouse gases into CO₂-eq emissions based on their 20- or 100-year impacts.
-
A solution that has a steady impact on the atmosphere. Effectiveness is expected to be constant over time rather than having a higher impact in the near or long term.
-
A system that uses the slope of a field and furrows, borders, or flooding to apply water without pumping.
-
Hydrogen produced from natural gas, most commonly by combining heated steam with methane. Producing grey hydrogen emits CO₂ and leaks methane. Most hydrogen made today is grey.
-
A fixed income debt instrument focused on sustainable projects. Green bonds work in the same manner as traditional bonds and may be issued by corporations, financial institutions, and governments.
-
A fixed income debt instrument focused on sustainable projects. They work in the same manner as traditional bonds and may be issued by corporations, financial institutions, and governments.
-
Hydrogen gas made through electrolysis using electricity produced onsite using renewable energy sources.
-
The practice of charging more for renewable energy than for conventional energy to cover added costs .
-
Roofs that are designed to be partially or completely covered in vegetation.
-
Biomass discarded during landscaping and gardening.
-
A gas that traps heat in the atmosphere, contributing to climate change.
-
The makeup of electricity generation on a power grid, showing the share contributed by various energy sources (e.g., coal, natural gas, nuclear, wind, solar, hydro) relative to total electricity production.
-
A process by which GHGs dissolved in groundwater are released to the atmosphere when the groundwater is extracted from the aquifer.
-
metric gigatons or billion metric tons
-
global warming potential
-
A low-carbon steel-making technology that uses hydrogen from water, direct reduction of iron, and electric arc furnaces.
-
hectare
-
household air pollution
-
A sector or process that is exceptionally challenging to decarbonize, often because of a lack of mature technology options.
-
hydrochlorofluorocarbon
-
Number of years a person is expected to live without disability or other limitations that restrict basic functioning and activity.
-
A measure of the total space heating demand to maintain an indoor temperature above 18 °C
-
A unit of land area comprising 10,000 square meters, roughly equal to 2.5 acres.
-
Hybrid electric car
-
hydrofluorocarbon
-
hydrofluoroolefin
-
hydrofluoroolefin
-
high-income countries
-
Metal waste that is produced at a mill or foundry during the metal production process and recycled internally.
-
Particles and gases released from use of polluting fuels and technologies such as biomass cookstoves that cause poor air quality in and around the home.
-
heating, ventilation, air conditioning, and refrigeration
-
Organic compounds that contain hydrogen and carbon.
-
Human-made F-gases that contain hydrogen, fluorine, and carbon. They typically have short atmospheric lifetimes and GWPs hundreds or thousands times higher than CO₂.
-
Human-made F-gases that contain hydrogen, fluorine, and carbon, with at least one double bond. They have low GWPs and can be climate-friendly alternatives to HFC refrigerants.
-
A recycling process that separates fibers from contaminants for reuse. Paper or cardboard is mixed with water to break down fibrous materials into pulp.
-
internal combustion engine
-
International Energy Agency
-
Aerobic decomposition of organic waste in a sealed container or bin/bay system.
-
Greenhouse gas emissions produced as a result of a technology or practice but not directly from its use.
-
A solid block of purified silicon formed by melting and crystallizing raw silicon; it serves as the base material for slicing into wafers used in solar cells.
-
Device used to power vehicles by the intake, compression, combustion, and exhaust of fuel that drives moving parts.
-
The annual discount rate that balances net cash flows for a project over time. Also called IRR, internal rate of return is used to estimate profitability of potential investments.
-
Individuals or institutions willing to lend money in search of a return on their investment.
-
Intergovernmental Panel on Climate Change
-
Indigenous peoples’ land
-
Integrated pest management.
-
internal rate of return
-
The timing and amount of irrigation water applied.
-
International Union for Conservation of Nature
-
The most comprehensive global list of species threatened with extinction, maintained by the International Union for Conservation of Nature.
-
International agreement adopted in 2016 to phase down the use of high-GWP HFC F-gases over the time frame 2019–2047.
-
A measure of energy equivalent to the energy delivered by 1,000 watts of power over one hour.
-
kiloton or one thousand metric tons
-
kilowatt-hour
-
The intentional or unintentional act of property use crossing ownership boundaries without permission.
-
A land-holding system, e.g. ownership, leasing, or renting. Secure land tenure means farmers or other land users will maintain access to and use of the land in future years.
-
Gases, mainly methane and CO₂, created by the decomposition of organic matter in the absence of oxygen.
-
levelized cost of electricity
-
leak detection and repair
-
Regular monitoring for fugitive methane leaks throughout oil and gas, coal, and landfill sector infrastructure and the modification or replacement of leaking equipment.
-
Relocation of emissions-causing activities outside of a mitigation project area rather than a true reduction in emissions.
-
The rate at which solution costs decrease as adoption increases, based on production efficiencies, technological improvements, or other factors.
-
Percent decrease in costs per doubling of adoption.
-
A metric describing the expected break-even cost of generating electricity per megawatt-hour ($/MWh), combining costs related to capital, operation, and fuel (if used) and dividing by total output over the generator's lifetime.
-
landfill gas
-
Greenhouse gas emissions from the sourcing, production, use, and disposal of a technology or practice.
-
A process that converts biomass, plastics, or other solid wastes into liquid fuel or chemicals.
-
The total weight of an organism before any meat processing.
-
low- and middle-income countries
-
liquefied petroleum gas
-
land use change
-
A measure of the amount of light produced by a light source per energy input.
-
live weight
-
Mobility as a Service
-
marginal abatement cost curve
-
Livestock grazing practices that strategically manage livestock density, grazing intensity, and timing. Also called improved grazing, these practices have environmental, soil health, and climate benefits, including enhanced soil carbon sequestration.
-
Intertidal coastal wetlands with salt-tolerant trees and shrubs found in tropical and subtropical regions.
-
A tool to measure and compare the financial cost and abatement benefit of individual actions based on the initial and operating costs, revenue, and emission reduction potential.
-
Periods of unusually warm ocean temperatures that typically last from days to months and can affect large areas of the ocean.
-
Defined by the International Union for Conservation of Nature as: "A clearly defined geographical space, recognised, dedicated and managed, through legal or other effective means, to achieve the long-term conservation of nature with associated ecosystem services and cultural values." References to PAs here also include other effective area-based conservation measures defined by the IUCN.
-
The transfer of economic activity or environmental impact from one area to another as a result of conservation activities, often having the effect of reducing or offsetting intended benefits.
-
The transfer of economic activity or environmental impact from one location to another as a result of conservation activities, often having the effect of reducing or offsetting intended benefits.
-
A facility that receives recyclable waste from residential, commercial, and industrial sources; separates, processes, and prepares them; and then sells them to manufacturers for reuse in new products.
-
A measure of energy equivalent to the energy delivered by one million watts of power over one hour.
-
A greenhouse gas with a short lifetime and high GWP that can be produced through a variety of mechanisms including the breakdown of organic matter.
-
A measure of mass equivalent to 1,000 kilograms (~2,200 lb), also known as tonne.
-
million hectares
-
The natural process by which microbes convert matter to energy, often producing CO₂ or other GHGs as a byproduct.
-
Soils mostly composed of inorganic materials formed through the breakdown of rocks. Most soils are mineral soils, and they generally have less than 20% organic matter by weight.
-
A localized electricity system that independently generates and distributes power. Typically serving limited geographic areas, mini-grids can operate in isolation or interconnected with the main grid.
-
Reduce adverse impact of
-
A reduction in adverse impact
-
megajoule or one million joules
-
Digital platform that integrates transport modes such as public transit, carpooling, and bike sharing into a single service, allowing users to plan, book, and pay for multimodal trips through one application.
-
Percent of trips made by different passenger and freight transportation modes.
-
A condition of being diseased, unhealthy, or injured.
-
Marine Protected Area
-
materials recovery facility
-
Municipal solid waste
-
megaton or million metric tons
-
Materials discarded from residential and commercial sectors, including organic waste, glass, metals, plastics, paper, and cardboard.
-
megawatt
-
Megawatt-hour
-
micro wind turbine
-
square meter kelvins per watt (a measure of thermal resistance, also called R-value)
-
nitrous oxide
-
The enclosed housing at the top of a wind turbine tower that contains the main mechanical and electrical components of the turbine.
-
A commitment from a country to reduce national emissions and/or sequester carbon in alignment with global climate goals under the Paris Agreement, including plans for adapting to climate impacts.
-
A gaseous form of hydrocarbons consisting mainly of methane.
-
Chemicals found in nature that are used for cooling and heating, such as CO₂, ammonia, and some hydrocarbons. They have low GWPs and are ozone friendly, making them climate-friendly refrigerants.
-
The rate of primary production for photosynthetic organisms, excluding the carbon they respire for their own metabolic processes.
-
The rate at which photosynthetic organisms convert carbon dioxide into organic matter, minus the carbon they respire for their own metabolic processes.
-
Microbial conversion of ammonia or ammonium to nitrite and then to nitrate under aerobic conditions.
-
A group of air pollutant molecules composed of nitrogen and oxygen, including NO and NO₂.
-
A greenhouse gas produced during fossil fuel combustion and agricultural and industrial processes. N₂O is hundreds of times more potent than CO₂ at trapping atmospheric heat, and it depletes stratospheric ozone.
-
Metals or alloys that do not contain significant amounts of iron.
-
Social welfare organizations, civic leagues, social clubs, labor organizations, business associations, and other not-for-profit organizations.
-
A material or energy source that relies on resources that are finite or not naturally replenished at the rate of consumption, including fossil fuels like coal, oil, and natural gas.
-
nitrogen oxides
-
Net primary production
-
nitrous oxide
-
The process of increasing the acidity of seawater, primarily caused by absorption of CO₂ from the atmosphere.
-
Organisation for Economic Co-operation and Development
-
An agreement between a seller who will produce future goods and a purchaser who commits to buying them, often used as project financing for producers prior to manufacturing.
-
Waste made of plant or animal matter, including food waste and green waste.
-
Systems to connect buyers with a network of smallholder farmers to stabilize supply and demand (sometimes called "contract farming.”
-
organic waste
-
Protected area
-
Protected Area
-
A certification that verifies a metric ton of packaging waste has been recovered and is being exported for reprocessing.
-
A certification that verifies a metric ton of packaging waste has been recovered and reprocessed.
-
Productive use of wet or rewetted peatlands that does not disturb the peat layer, such as for hunting, gathering, and growing wetland-adapted crops for food, fiber, and energy.
-
A legally protected area that lacks effective enforcement or management, resulting in minimal to no conservation benefit.
-
Airborne particles composed of solids and liquids.
-
A measure of transporting one passenger over a distance of one kilometer.
-
Incentive payments to landowners or managers to conserve natural resources and promote healthy ecological functions or ecosystem services.
-
Small, hardened pieces of plastic made from cooled resin that can be melted to make new plastic products.
-
Transitional zone between urban and rural areas that combines features of both such as housing, farms, lower-density development, and mixed land uses.
-
The longevity of any greenhouse gas emission reductions or removals. Solution impacts are considered permanent if the risk of reversing the positive climate impacts is low within 100 years.
-
Packaging waste export recovery note
-
High-efficiency solar cells with a traditional silicon base and a thin-film perovskite layer on top that allows the combined cell to capture more energy without significantly increasing its size.
-
Advanced solar cells combining perovskite and silicon layers to capture more of the solar spectrum, achieving higher efficiency than conventional silicon cells.
-
Payments for ecosystem services
-
A mixture of hydrocarbons, small amounts of other organic compounds, and trace amounts of metals used to produce products such as fuels or plastics.
-
Per- and polyfluoroalkyl substances, a class of synthetic chemicals that do not degrade easily in the environment. They can pollute the environment and can have negative impacts on human health.
-
A measure of the acidity (pH<7) or alkalinity (pH>7) of a solution.
-
Reduce the use of a material or practice over time.
-
Eliminate the use of a material or practice over time.
-
Plug-in hybrid electric car
-
Private, national, or multilateral organizations dedicated to providing aid through in-kind or financial donations.
-
A chemical or material that initiates or accelerates a chemical reaction when exposed to light without being consumed.
-
An atmospheric reaction among sunlight, VOCs, and nitrogen oxide that leads to ground-level ozone formation. Ground-level ozone, a component of smog, harms human health and the environment.
-
The process by which certain materials, such as those in solar cells, convert sunlight into electricity by releasing electrons.
-
The process by which sunlight is converted into electricity. When light hits certain materials, such as those in solar panels, it mobilizes electrons, creating an electric current.
-
A family of synthetic organic compounds used to make plastics softer, more flexible, and durable. They are added to a wide range of plastics for consumer and industrial uses.
-
polyisocyanurate
-
The adjustment of turbine blade angles around their long axis in which a control system rotates blades slightly forward or backward to regulate wind capture and optimize electricity generation.
-
passenger kilometer
-
particulate matter
-
Particulate matter 2.5 micrometers or less in diameter that can harm human health when inhaled.
-
Elected officials and their staff, bureaucrats, civil servants, regulators, attorneys, and government affairs professionals.
-
System in a vehicle that generates power and delivers it to the wheels. It typically includes an engine and/or motor, transmission, driveshaft, and differential.
-
Purchase Power Agreement.
-
Purchase Power Agreements
-
People who most directly interface with a solution and/or determine whether the solution is used and/or available.
-
A chemical reaction that creates a solid from a solution.
-
A substance that is the starting material for a chemical reaction that forms a different substance.
-
Extraction of naturally occurring resources from the Earth, including mining, logging, and oil and gas refining. These resources can be used in raw or minimally processed forms to produce materials.
-
The process of converting inorganic matter, including carbon dioxide, into organic matter (biomass), primarily by photosynthetic organisms such as plants and algae.
-
Packaging waste recovery note
-
A device that controls indoor temperature according to user-defined schedules or conditions.
-
Defined by the International Union for the Conservation of Nature as "A clearly defined geographical space, recognised, dedicated and managed, through legal or other effective means, to achieve the long-term conservation of nature with associated ecosystem services and cultural values". References to PAs here also include other effective area-based conservation measures defined by the IUCN.
-
A process that separates and breaks down wood and other raw materials into fibers that form pulp, the base ingredient for making paper products.
-
polyurethane
-
Long-term contract between a company (the buyer) and a renewable energy producer (the seller).
-
Long-term contracts between a company (the buyer) and a renewable energy producer (the seller).
-
photovoltaic
-
Petawatt-hour, equal to 1 billion MWh
-
research and development
-
An atom, molecule, or ion that contains at least one unpaired valence electron, making it highly reactive and often short-lived.
-
A situation in which improvements in efficiency or savings lead to consumers increasing consumption, partially or fully offsetting or exceeding the emissions or cost benefits.
-
renewable energy certificate
-
Chemical or mixture used for cooling and heating in refrigeration, air conditioning, and heat pump equipment. Refrigerants absorb and release heat as they move between states under changing pressure.
-
The amount of refrigerant needed for a particular refrigeration, air conditioning, or heat pump system.
-
A group of approaches to farming and ranching that emphasizes enhancing the health of soil by restoring its carbon content and providing other benefits to the farm and surrounding ecosystem.
-
A solution that can increase the beneficial impact of another solution through increased effectiveness, lower costs, improved adoption, enhanced global climate impact, and/or other benefits to people and nature.
-
A material or energy source that relies on naturally occuring and replenishing resources such as plant matter, wind, or sunlight.
-
A market-based instrument that tracks ownership of renewable energy generation.
-
The moldable form of raw plastic material, created by melting down waste or virgin plastics and serving as the building block for creating new plastic goods.
-
The process of moving items from end users (e.g., consumers) back to the sellers or manufacturers to reuse, recycle, or dispose of. This can include transportation, cleaning, sorting, and more.
-
Hiring a vehicle to take a passenger or passengers to a particular destination.
-
U.N. treaties to combat climate change, biodiversity loss, and desertification. They include the U.N. Framework Convention on Climate Change (UNFCCC), the Convention on Biological Diversity (CBD), and the U.N. Convention to Combat Desertification (UNCCD).
-
A class of animals with complex stomachs that can digest grass. Most grazing livestock are ruminants including cows, sheep, and goats along with several other species.
-
sustainable aviation fuel
-
A wetland ecosystem regularly flooded by tides and containing salt-tolerant plants, such as grasses and herbs.
-
Intertidal coastal wetlands with salt-tolerant plants.
-
An ecosystem characterized by low-density tree cover that allows for a grass subcanopy.
-
Very large or small numbers are formatted in scientific notation. A positive exponent multiplies the number by powers of ten; a negative exponent divides the number by powers of ten.
-
Seasonal coefficient of performance
-
Sustainable Development Goals
-
Average units of heat energy released for every unit of electrical energy consumed, used to measure heat pump efficiency.
-
A single pane window (glass and frame) added to an existing single-glazed window, converting the unit into double glazing, with each pane independently operable.
-
A practice in which multiple utility companies own and operate high-voltage power lines, sharing both costs and benefits.
-
A window consisting of one glass pane without any additional insulating layers.
-
Small-scale family farmers and other food producers, often with limited resources, usually in the tropics. The average size of a smallholder farm is two hectares (about five acres).
-
soil organic carbon
-
The process of using direct, real-world observations to verify, validate, and/or improve data and models about social systems, often using in-person observations in the field.
-
Carbon stored in soils, including both organic (from decomposing plants and microbes) and inorganic (from carbonate-containing minerals).
-
Carbon stored in soils in organic forms (from decomposing plants and microbes). Soil organic carbon makes up roughly half of soil organic matter by weight.
-
Biologically derived matter in soils, including living, dead, and decayed plant and microbial tissues. Soil organic matter is roughly half carbon on a dry-weight basis.
-
A measure of the intensity of solar radiant energy on a surface, measured in watts per square meter (W/m2) or power per unit area.
-
Reducing global warming by increasing how much of the sun's radiation is reflected back to space and/or decreasing how much of the Earth's radiative heat is trapped in the atmosphere.
-
A material's ability to reflect solar radiation incident on its surface, often reported as a fraction or percentage.
-
soil organic matter
-
A substance that takes up another liquid or gas substance, either by absorbtion or adsorption.
-
sulfur oxides
-
sulfur dioxide
-
The rate at which a climate solution physically affects the atmosphere after being deployed. At Project Drawdown, we use three categories: emergency brake (fastest impact), gradual, or delayed (slowest impact).
-
Climate regions between latitudes 23.4° to 35° above and below the equator characterized by warm summers and mild winters.
-
A polluting gas produced primarily from burning fossil fuels and industrial processes that directly harms the environment and human health.
-
A group of gases containing sulfur and oxygen that predominantly come from burning fossil fuels. They contribute to air pollution, acid rain, and respiratory health issues.
-
Processes, people, and resources involved in producing and delivering a product from supplier to end customer, including material acquisition.
-
Sport utility vehicle
-
A mixture of hydrogen, carbon monoxide, and other gases, used to produce chemicals like ammonia and methanol, or as a synthetic fuel made from non-fossil feedstocks, including biomass and waste.
-
metric ton
-
metric tons
-
Technology developers, including founders, designers, inventors, R&D staff, and creators seeking to overcome technical or practical challenges.
-
Climate regions between 35° to 50° above and below the equator characterized by moderate mean annual temperatures and distinct seasons, with warm summers and cold winters.
-
A measure of energy equivalent to the energy delivered by one trillion watts of power over one hour.
-
trifluoroacetic acid
-
trifluoroacetic acid
-
A measurement indicating the ability of a material to release heat after it has been absorbed.
-
A measure of how well a material prevents heat flow, often called R-value or RSI-value for insulation. A higher R-value means better thermal performance.
-
A measure of the rate of heat flow or heat transfer through a material or building component. A lower U-value means better thermal performance.
-
Individuals with an established audience for their work, including public figures, experts, journalists, and educators.
-
Charges for disposal of materials paid to facility operators. Fees can be charged per ton of waste disposed or based on economic indicators such as the Consumer Price Index.
-
A solar PV systems with panels that move automatically to follow the sun’s path, maximizing energy capture and improving efficiency over fixed systems.
-
A window consisting of three panes of glass separated by two insulating inert gas-filled layers, providing more heat flow resistance than single or double glazing.
-
Low-latitude (23.4°S to 23.4°N) climate regions near the Equator characterized by year-round high temperatures and distinct wet and dry seasons.
-
Terawatt, equal to 1,000 gigawatts
-
terawatt-hour
-
United Nations
-
United Nations Environment Programme
-
U.S. Composting Council
-
Self-propelled machine for transporting passengers or freight on roads.
-
A measure of one vehicle traveling a distance of one kilometer.
-
Aerobic decomposition of organic waste by earthworms and microorganisms.
-
vehicle kilometer
-
volatile organic compound
-
Gases made of organic, carbon-based molecules that are readily released into the air from other solid or liquid materials. Some VOCs are greenhouse gases or can harm human health.
-
watt (a measure of power or energy transfer.)
-
Watts per square meter Kelvin
-
A thin, flat slice of silicon cut from an ingot and processed to create individual solar cells that convert sunlight into electricity.
-
Landscape waste, storm debris, wood processing residues, and recovered post-consumer wood.
-
A framework for waste management that ranks options by their sustainability: 1) prevent (do not purchase unnecessary waste), 2) reduce, 3) reuse, 4) recycle, 5) recover, 6) dispose.
-
A measure of power equal to one joule per second.
-
World Conservation Monitoring Centre
-
Using strategies such as insulation, air sealing, ventilation, and moisture control to upgrade a building’s exterior structure, making indoors more comfortable and energy efficient.
-
Aerobic decomposition of organic waste in long, narrow rows called windrows. Windrows are generally twice as long as they are wide.
-
A subset of forest ecosystems that may have sparser canopy cover, smaller-stature trees, and/or trees characterized by basal branching rather than a single main stem.
-
extruded polystyrene
-
The rotation of the nacelle (the enclosed housing at the top of a wind turbine tower that contains the main mechanical and electrical components of the turbine) so that the rotor blades are always facing directly into the wind.
-
year-over-year
-
year