The amount of pollutants, sediments, and microorganisms in fresh and marine water systems that affects the health of humans, wildlife, and ecosystems.

Icon

Produce Biochar

Image
Image
Biochar
Coming Soon
On

Key Takeaways

  • By transforming carbon absorbed by plants and animals into a highly stable form, large-scale biochar production and application to soils could potentially remove 0.13–0.47 Gt CO₂‑eq/yr.
  • The carbon permanence of biochar can range from hundreds to thousands of years when applied to soil, but more research is needed to understand durability in response to real-world soil and environmental factors.
  • Biochar increases soil health and nutrient availability. This can increase yields of a variety of staple crops, but benefits vary across soil types.
Summary

Producing biochar is the process of taking organic matter such as crop residues, animal manure, and forest residues and converting it into a charcoal-like substance known as biochar. Producing biochar removes carbon from the atmosphere by transforming carbon absorbed by plants and animals and into a highly stable form, preventing it from quickly returning to the atmosphere (Belmont & Sanchez, 2025). Biochar can be used as a soil amendment, a replacement for certain construction materials, or for filtration or pollution remediation. This solution focuses on large-scale production of biochar for soil application.

Description for Social and Search
Producing biochar takes the carbon from organic wastes (agricultural and forestry wastes) and converts it into a stable form that will sequester the carbon for hundreds of years. Biochar is mainly used as a soil amendment where it can improve soil fertility.
Overview

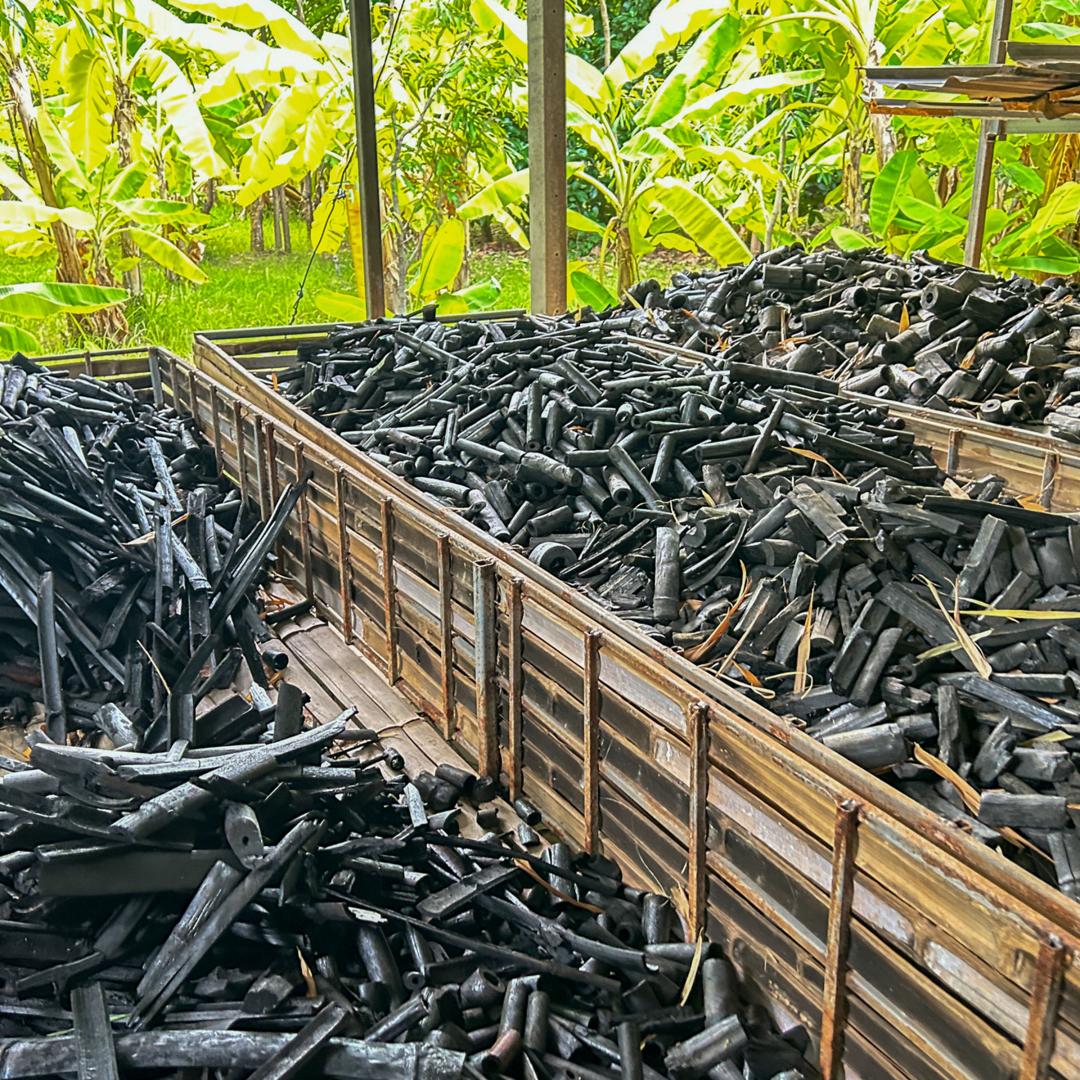
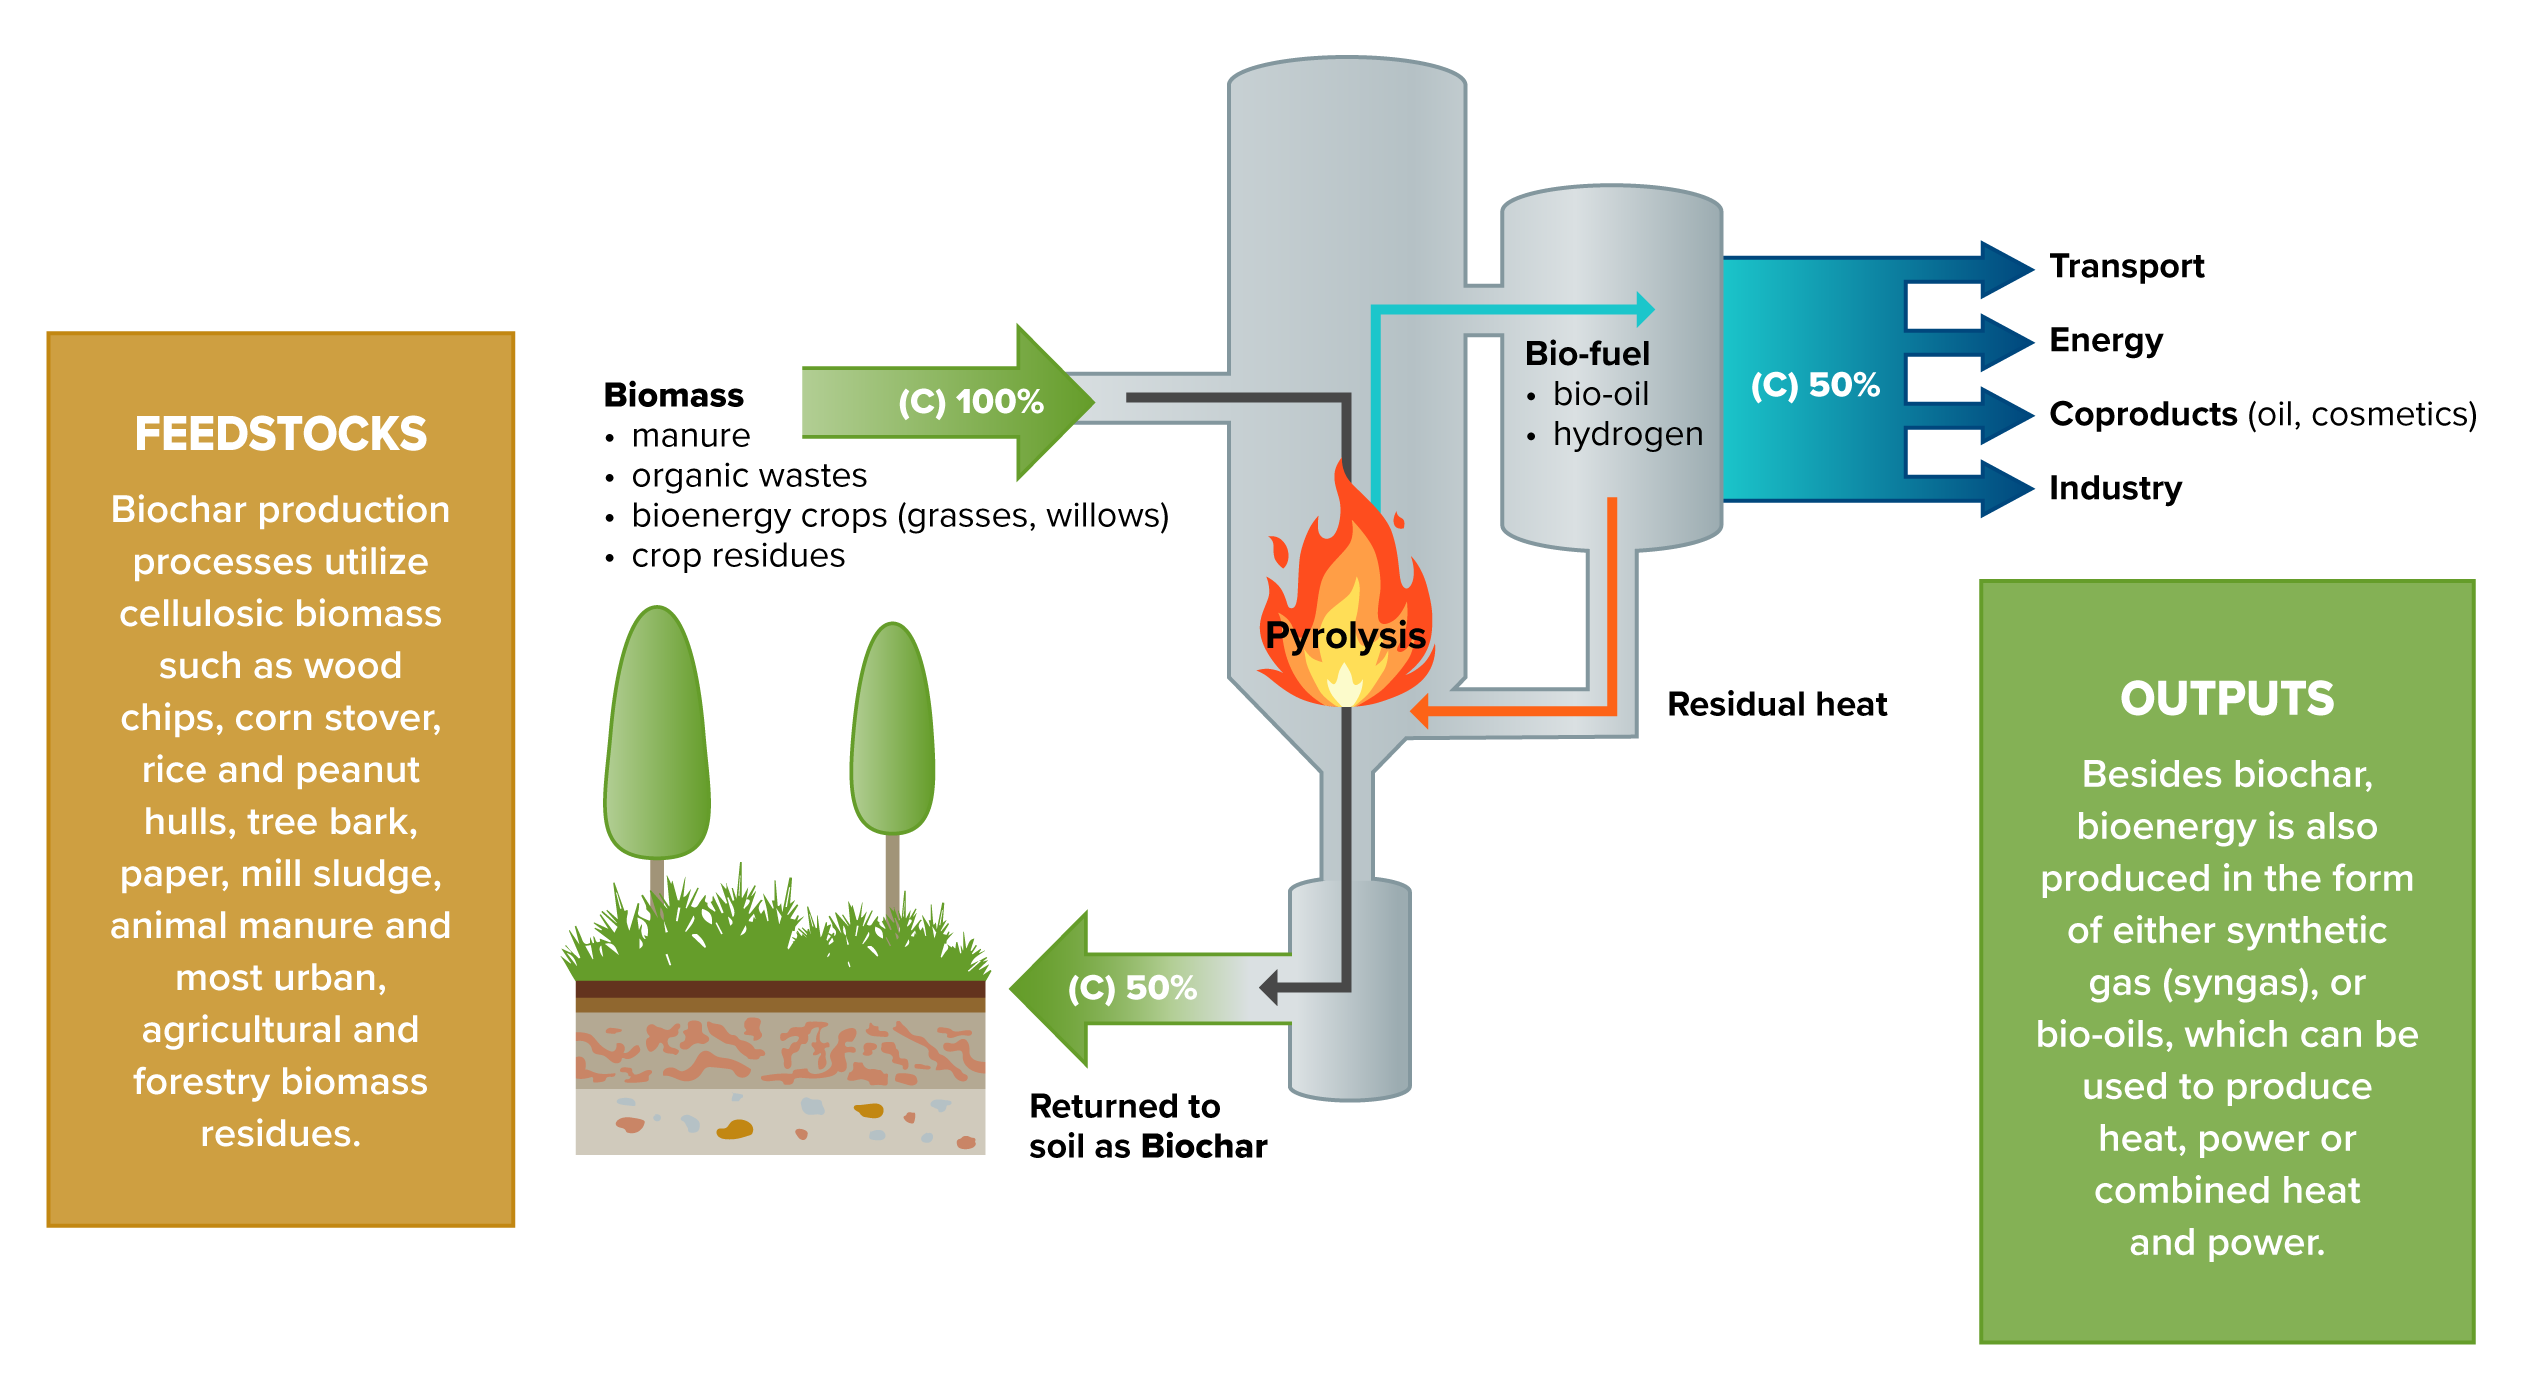
Biochar is a charcoal-like substance that is mainly produced by burning organic matter in an oxygen-deficient environment, a process called pyrolysis (Spears, 2018; Figure 1). Biochar production converts the carbon in the organic matter into a stable form that is not readily released into the atmosphere. 

This solution considers producing biochar from agricultural (crop residue, manure) or industrial (forest residue) waste feedstocks. It does not include using purpose-grown plants, edible portions of food or feed crops, or other non-waste feedstocks, which could compete for land use and reduce the climate benefits. We focused on biochar facilities that process 1,000 or more metric tons of waste per year (Amonette et al., 2021). We included both pyrolysis and gasification in our analysis; however, the proportion of carbon that is turned into biochar can differ between processes (NorthX, 2025). We excluded hydrothermal processing of wet biomass that produces hydrochar from our analysis because the carbon storage properties differ from those of typical biochar (Lehmann & Joseph, 2015).

Co-products such as bio-oil or syngas can be produced during biochar production and used as energy or sold. Using biochar can have climate benefits in addition to storing carbon, such as avoiding the production of methane from waste (Afshar & Mofatteh, 2024) and enhancing soil carbon sequestration in certain soil types (Yang et al., 2025). This solution focuses only on the carbon sequestered in biochar. We do not quantify potential avoided waste emissions, reduced energy use from co-products, or any enhanced sequestration after soil application. 

Figure 1. Example of a biochar production process. The conversion of 100% of biomass carbon to 50% biochar is specific to the pyrolysis process and can vary with different temperatures and methods used.

Image
Diagram of biochar process.

Source: International Biochar Initiative. (n.d.). Why Biochar. Retrieved 6 March 2026.

This solution focuses on biochar use as a soil additive in soils where it can improve soil organic matter as well as help retain water and nutrients. The carbon permanence of biochar can range from hundreds to thousands of years when applied to soil (Belmont & Sanchez, 2025). Biochar also can be used in filtration or remediation applications or as a filler material in building materials such as asphalt or concrete (Amonette et al., 2022).

References

Afshar, M., & Mofatteh, S. (2024). Biochar for a sustainable future: Environmentally friendly production and diverse applications. Results in Engineering, 23, Article 102433. Link to source: https://doi.org/10.1016/j.rineng.2024.102433

Agegnehu, G., Bass, A. M., Nelson, P. N., & Bird, M. I. (2016). Benefits of biochar, compost and biochar–compost for soil quality, maize yield and greenhouse gas emissions in a tropical agricultural soil. Science of The Total Environment, 543, 295–306. Link to source: https://doi.org/10.1016/j.scitotenv.2015.11.054

Alayaki, F. M., Hajikarimi, P., Meky, N., Rashid, S., & Fini, E. H. (2025). Global applications of biochar in sustainable cities of the future: A perspective. Biochar X, 1(1), Article e010. Link to source: https://doi.org/10.48130/bchax-0025-0009

Aman, A. M. N., Selvarajoo, A., Lau, T. L., & Chen, W.-H. (2022). Biochar as cement replacement to enhance concrete composite properties: A review. Energies, 15(20), Article 7662. Link to source: https://doi.org/10.3390/en15207662 

Amonette, James. E., Archuleta, J. G., Fuchs, M. R., Hills, K. M., Yorgey, G. G., Flora, G., Hunt, J., Han, H.-S., Jobson, B. T., Miles, T. R., Page-Dumroese, D. S., Thompson, S., Trippe, K. M., Wilson, K., Baltar, R., Carloni, K., Christoforou, C., Collins, D. P., Dooley, J., … Wheeler, E. (2021). Biomass to biochar: Maximizing the carbon value. Center for Sustaining Agriculture and Natural Resources, Washington State University, Pullman WA. Link to source: https://csanr.wsu.edu/biomass2biochar/

Baek, N., Lee, S.-I., Pia, H. I., Park, S.-W., Shin, E.-S., Lee, J., Kim, H.-Y., & Choi, W-.J. (2025). Biochar effects on methane emission from rice paddy differ with nitrogen fertilization, organic inputs, and water management. Korean Journal of Soil Science and Fertilizer, 58(1), 133-143. Link to source: https://doi.org/10.7745/KJSSF.2025.58.1.133 

Belmont, E. L., & Sanchez, D. L. (2025, July 8). Biochar’s long game: Unraveling the science of carbon permanence. Carbon Direct. Link to source: https://www.carbon-direct.com/research-and-reports/biochars-long-game-unraveling-the-science-of-carbon-permanence

Bhuvaneshwari, S., Hettiarachchi, H., & Meegoda, J. N. (2019). Crop residue burning in India: Policy challenges and potential solutions. International Journal of Environmental Research and Public Health, 16(5), Article 832. Link to source: https://doi.org/10.3390/ijerph16050832

Bijay-Singh, & Craswell, E. (2021). Fertilizers and nitrate pollution of surface and ground water: An increasingly pervasive global problem. SN Applied Sciences, 3(4), Article 518. Link to source: https://doi.org/10.1007/s42452-021-04521-8

British Columbia Centre for Innovation & Clean Energy & Deloitte. (2023). Carbon management blueprint report: Attracting investments in British Columbia. Link to source: https://northx.ca/intelligence/bc-carbon-management-blueprint-report

British Columbia Centre for Innovation & Clean Energy & Innovative Breakthrough Energy Technologies. (2024). Catalyzing carbon dioxide removal at scale. Link to source: https://northx.ca/announcements/catalyzing-carbon-dioxide-removal-at-scale-new-report-released

Buss, W., Wurzer, C., Manning, D. A. C., Rohling, E. J., Borevitz, J., & Mašek, O. (2022). Mineral-enriched biochar delivers enhanced nutrient recovery and carbon dioxide removal. Communications Earth & Environment, 3(67). Link to source: https://doi.org/10.1038/s43247-022-00394-w

Energy Transitions Commission. (2022). Mind the gap: How carbon dioxide removals must complement deep decarbonisation to keep 1.5°C alive. Link to source: https://www.energy-transitions.org/publications/mind-the-gap-cdr/

Fuss, S., Lamb, W. F., Callaghan, M. W., Hilaire, J., Creutzig, F., Amann, T., Beringer, T., de Oliveira Garcia, W., Hartmann, J., Khanna, T., Luderer, G., Nemet, G. F., Rogelj, J., Smith, P., Vicente, J. L. V., Wilcox, J., del Mar Zamora Dominguez, M., & Minx, J. C. (2018). Negative emissions—part 2: Costs, potentials and side effects. Environmental Research Letters, 13(6). Link to source: https://doi.org/10.1088/1748-9326/aabf9f

Genesio, L., Vaccari, F. P., & Miglietta, F. (2016). Black carbon aerosol from biochar threats its negative emission potential. Global Change Biology, 22(7), 2313–2314. Link to source: https://doi.org/10.1111/gcb.13254

Griscom, B. W., Adams, J., Ellis, P. W., Houghton, R. A., Lomax, G., Miteva, D. A., Schlesinger, W. H., Shoch, D., Siikamäki, J. V., Smith, P., Woodbury, P., Zganjar, C., Blackman, A., Campari, J., Conant, R. T., Delgado, C., Elias, P., Gopalakrishna, T., Hamsik, M. R., … Fargione, J. (2017). Natural climate solutions. Proceedings of the National Academy of Sciences, 114(44), 11645–11650. Link to source: https://doi.org/10.1073/pnas.1710465114

Grossi, G., Goglio, P., Vitali, A., & Williams, A. G. (2019). Livestock and climate change: Impact of livestock on climate and mitigation strategies. Animal Frontiers, 9(1), 69–76. Link to source: https://doi.org/10.1093/af/vfy034

Gupta, S. (2019). Agriculture crop residue burning and its consequences on respiration health of school-going children. Global Pediatric Health, 6, Article 333794X19874679. Link to source: https://doi.org/10.1177/2333794X19874679

Huang, T., Ma, J., Song, S., Ling, Z., Macdonald, R. W., Gao, H., Tao, S., Shen, H., Zhao, Y., Liu, X., Tian, C., Li, Y., Jia, H., Lian, L., & Mao, X. (2022). Health and environmental consequences of crop residue burning correlated with increasing crop yields midst India’s green revolution. Npj Climate and Atmospheric Science, 5(1). Link to source: https://doi.org/10.1038/s41612-022-00306-x

Intergovernmental Panel on Climate Change. (2018). Strengthening and implementing the global response (Special Report: Global Warming of 1.5 oC). Link to source: https://www.ipcc.ch/sr15/chapter/chapter-4/

Intergovernmental Panel on Climate Change. (2022). Chapter 7: Agriculture, forestry and other land uses (AFOLU). Link to source: https://www.ipcc.ch/report/ar6/wg1/chapter/chapter-7/

International Biochar Initiative. (n.d.). Why Biochar. Retrieved 6 March 2026, from  https://biochar-international.org/why-biochar/

International Biochar Initiative. (2014). State of the biochar industry 2013. Link to source: https://biochar-international.org/state-of-the-biochar-industry-2013/

International Biochar Initiative. (2015). State of the biochar industry 2014. Link to source: https://biochar-international.org/state-of-the-biochar-industry-2014/

International Biochar Initiative. (2016). State of the biochar industry 2015. Link to source: https://biochar-international.org/state-of-the-biochar-industry-2015/

International Biochar Initiative. (2024). 2023 Global biochar market report. Link to source: http://145249425.hs-sites-eu1.com/2023-global-biochar-market-report

International Biochar Initiative & HAMERKOP. (2025). Announcing the updated manual for biochar carbon removal. Link to source: https://biochar-international.org/news/announcing-the-updated-manual-for-biochar-carbon-removal/

International Renewable Energy Agency. (2018). Biogas for road vehicles technology brief. Link to source: https://www.irena.org/publications/2017/Mar/Biogas-for-road-vehicles-Technology-brief

Joseph, S., Cowie, A. L., Van Zwieten, L., Bolan, N., Budai, A., Buss, W., Cayuela, M. L., Graber, E. R., Ippolito, J. A., Kuzyakov, Y., Luo, Y., Ok, Y. S., Palansooriya, K. N., Shepherd, J., Stephens, S., Weng, Z. (Han), & Lehmann, J. (2021). How biochar works, and when it doesn’t: A review of mechanisms controlling soil and plant responses to biochar. GCB Bioenergy, 13(11), 1731–1764. Link to source: https://doi.org/10.1111/gcbb.12885

Kabir, E., Kim, K.-H., & Kwon, E. E. (2023). Biochar as a tool for the improvement of soil and environment. Frontiers in Environmental Science, 11. Link to source: https://doi.org/10.3389/fenvs.2023.1324533

Krause, M., Kenny, S., Stephenson, J., & Singleton, A. (2023). Quantifying methane emissions from landfilled food waste. U.S. Environmental Protection Agency. Link to source: https://www.epa.gov/land-research/quantifying-methane-emissions-landfilled-food-waste

Kumar, P., Kumar, S., & Joshi, L. (2015). The extent and management of crop stubble. In P. Kumar, S. Kumar, & L. Joshi (Eds), Socioeconomic and Environmental Implications of Agricultural Residue Burning: A Case Study of Punjab, India (pp. 13–34). Springer India. Link to source: https://doi.org/10.1007/978-81-322-2014-5_2

Lan, R., Eastham, S. D., Liu, T., Norford, L. K., & Barrett, S. R. H. (2022). Air quality impacts of crop residue burning in India and mitigation alternatives. Nature Communications, 13(1), Article 6537. Link to source: https://doi.org/10.1038/s41467-022-34093-z

Lefebvre, D., Fawzy, S., Aquije, C. A., Osman, A. I., Draper, K. T., & Trabold, T. A. (2023). Biomass residue to carbon dioxide removal: Quantifying the global impact of biochar. Biochar, 5(1). Link to source: https://doi.org/10.1007/s42773-023-00258-2

Lehmann, J., Cowie, A., Masiello, C. A., Kammann, C., Woolf, D., Amonette, J. E., Cayuela, M. L., Camps-Arbestain, M., & Whitman, T. (2021). Biochar in climate change mitigation. Nature Geoscience, 14, 883–892. Link to source: https://doi.org/10.1038/s41561-021-00852-8

Lenton, T. M. (2010). The potential for land-based biological CO2 removal to lower future atmospheric CO2 concentration. Carbon Management, 1(1), 145–160. Link to source: https://doi.org/10.4155/cmt.10.12

Liang, P.-C., & Chen, W.-H. (2025). Present and future prospects of biochar. ACS Sustainable Resource Management, 2(5), 684–686. Link to source: https://doi.org/10.1021/acssusresmgt.5c00139

NorthX. (2025). Biocarbon rising: From concept to commercialization. Link to source: https://northx.ca/intelligence/biocarbon-rising

Petersen, S. O., Blanchard, M., Chadwick, D., Del Prado, A., Edouard, N., Mosquera, J., & Sommer, S. G. (2013). Manure management for greenhouse gas mitigation. Animal, 7, 266–282. Link to source: https://doi.org/10.1017/S1751731113000736

Porter, E. M., Bowman, W. D., Clark, C. M., Compton, J. E., Pardo, L. H., & Soong, J. L. (2013). Interactive effects of anthropogenic nitrogen enrichment and climate change on terrestrial and aquatic biodiversity. Biogeochemistry, 114(1), 93–120. Link to source: https://doi.org/10.1007/s10533-012-9803-3

Porter, S. (2020). Manure overload: Manure plus fertilizer overwhelms Minnesota’s land and water. Environmental Working Group. Link to source: http://www.ewg.org/interactive-maps/2020-manure-overload/

Prateep Na Talang, R., Na Sorn, W., Polruang, S., & Sirivithayapakorn, S. (2024). Alternative crop residue management practices to mitigate the environmental and economic impacts of open burning of agricultural residues. Scientific Reports, 14(1), Article 14372. Link to source: https://doi.org/10.1038/s41598-024-65389-3

Ravi, S., Sharratt, B. S., Li, J., Olshevski, S., Meng, Z., & Zhang, J. (2016). Particulate matter emissions from biochar-amended soils as a potential tradeoff to the negative emission potential. Scientific Reports, 6(1), Article 35984. Link to source: https://doi.org/10.1038/srep35984

Raza, M. H., Abid, M., Faisal, M., Yan, T., Akhtar, S., & Adnan, K. M. M. (2022). Environmental and health impacts of crop residue burning: Scope of sustainable crop residue management practices. International Journal of Environmental Research and Public Health, 19(8). Link to source: https://doi.org/10.3390/ijerph19084753

Russell, P. (2025, September 1). Locating the sweet spot for biochar carbon removal. Counteract. Link to source: https://counteract.vc/perspectives/locating-the-sweet-spot-for-biochar-carbon-removal

Sanchez, D., & Belmont, E. (2025, July 2). What is biochar? A carbon removal solution gaining ground. Carbon Direct. Link to source: https://www.carbon-direct.com/insights/what-is-biochar-a-carbon-removal-solution-gaining-ground

Sayara, T., & Sánchez, A. (2021). Gaseous emissions from the composting process: Controlling parameters and strategies of mitigation. Processes, 9(10), Article 1844. Link to source: https://doi.org/10.3390/pr9101844

Searchinger, T., Peng, L., Zionts, J., & Waite, R. (2023). The global land squeeze: Managing the growing competition for land. Link to source: https://www.wri.org/research/global-land-squeeze-managing-growing-competition-land

Simon, M. (2024, August 22). This simple farming technique can capture carbon for thousands of years. Grist. Link to source: https://grist.org/climate/biochar-farming-capture-carbon-thousands-of-years/

Singh, G., Gupta, M. K., Chaurasiya, S., Sharma, V. S., & Pimenov, D. Y. (2021). Rice straw burning: A review on its global prevalence and the sustainable alternatives for its effective mitigation. Environmental Science and Pollution Research, 28(25), 32125–32155. Link to source: https://doi.org/10.1007/s11356-021-14163-3

Smith, P., Calvin, K., Nkem, J., Campbell, D., Cherubini, F., Grassi, G., Korotkov, V., Le Hoang, A., Lwasa, S., McElwee, P., Nkonya, E., Saigusa, N., Soussana, J.-F., Taboada, M. A., Manning, F. C., Nampanzira, D., Arias-Navarro, C., Vizzarri, M., House, J., … Arneth, A. (2019). Which practices co-deliver food security, climate change mitigation and adaptation, and combat land degradation and desertification? Global Change Biology, 26(3), 1532–1575. Link to source: https://doi.org/10.1111/gcb.14878

Spears, S. (2018, May 16). What is biochar? Regeneration International. Link to source: https://regenerationinternational.org/2018/05/16/what-is-biochar/

Steinfeld, H., Gerber, P., Wassenaar, T., Castel, V., Rosales, M., & de Haan, C. (2006). Livestock’s long shadow: Environmental issues and options. Food and Agriculture Organization of the United Nations. Link to source: https://www.fao.org/4/a0701e/a0701e00.htm

The Institute for Carbon Removal Law and Policy. (2020). Fact sheet: Biochar. American University. Link to source: https://www.american.edu/sis/centers/carbon-removal/fact-sheet-biochar.cfm

Viger, M., Hancock, R. D., Miglietta, F., & Taylor, G. (2014). More plant growth but less plant defence? First global gene expression data for plants grown in soil amended with biochar. GCB Bioenergy, 7(4), 658–672. Link to source: https://doi.org/10.1111/gcbb.12182

Weng, Z. H., & Cowie, A. L. (2025). Estimates vary but credible evidence points to gigaton-scale climate change mitigation potential of biochar. Communications Earth & Environment, 6(259). Link to source: https://doi.org/10.1038/s43247-025-02228-x

Woolf, D., Amonette, J. E., Street-Perrott, F. A., Lehmann, J., & Joseph, S. (2010). Sustainable biochar to mitigate global climate change. Nature Communications, 1(56). Link to source: https://doi.org/10.1038/ncomms1053

Woolf, D., Lehmann, J., Ogle, S., Kishimoto-Mo, A. W., McConkey, B., & Baldock, J. (2021). Greenhouse Gas Inventory Model for Biochar Additions to Soil. Environmental Science & Technology, 55(21), 14795–14805. Link to source: https://doi.org/10.1021/acs.est.1c02425

Woolley, S., & Hallowell, B. (2018). Biochar: An overview. Biomass Controls. Link to source: https://biomasscontrols.com/biochar-overview/

Xiao, L., Feng, L., Yuan, G., & Wei, J. (2020). Low-cost field production of biochars and their properties. Environmental Geochemistry and Health, 42(6), 1569–1578. Link to source: https://doi.org/10.1007/s10653-019-00458-5

Yang, J., Xia, L., van Groenigen, K. J., Zhao, X., Ti, C., Wang, W., Du, Z., Fan, M., Zhuang, M., Smith, P., Lal, R., Butterbach-Bahl, K., Han, X., Meng, J., Liu, J., Cai, H., Cheng, Y., Liu, X., Shu, X., … Yan, X. (2025). Sustained benefits of long-term biochar application for food security and climate change mitigation. Proceedings of the National Academy of Sciences, 122(33), Article e2509237122. Link to source: https://doi.org/10.1073/pnas.2509237122

Credits

Lead Fellow

  • Jason Lam

Contributors

  • Ruthie Burrows, Ph.D.

  • James Gerber, Ph.D.

  • Daniel Jasper

  • Megan Matthews, Ph.D.

  • Alex Sweeney

Internal Reviewers

  • Amanda D. Smith, Ph.D.

  • Emily Cassidy

Effectiveness

We estimated that 1 metric ton of biochar produced and incorporated into soil will remove 0.84 t CO₂‑eq (0.82 t CO₂‑eq , 20-yr), after subtracting production emissions (Table 1). This assumes the primary feedstock is agricultural waste and forestry residue. Due to very limited direct production emissions data, we estimated that any carbon not stabilized in biochar is emitted as CO₂ or methane.

Producing and using biochar may have various additional benefits after application in different soil types (Yang et al., 2025). Afshar & Mofatteh (2024) found biochar applied to soils can reduce the production of methane from rice paddies, and Kabir et al. (2023) observed decreased nitrous oxide emissions from some soils treated with biochar. Because these additional benefits of biochar are context specific, our analysis of effectiveness in reducing GHGs focused only on the amount of carbon sequestered with biochar.

Biochar's carbon sequestration potential depends in part on the feedstock used, because carbon content varies with type of organic waste. Woolf et al. (2021) examined several globally abundant feedstocks and found that the carbon content of biochar can also vary depending on how the biochar is produced, ranging from 10–81% of the carbon found in the dry mass feedstocks. 

Table 1. Effectiveness at sequestering carbon.

Unit: t CO₂‑eq /t biochar, 100-yr basis

25th percentile 0.81
Mean 0.63
Median (50th percentile) 0.84
75th percentile 1.30
Left Text Column Width
Cost

To sequester 1 t CO₂‑eq with biochar, a biochar production facility will have an initial cost of around US$200/t biochar, an operating cost of roughly US$510/t biochar, and revenue of US$120/t biochar. However, these values do not include potential costs for applying biochar to soils. Globally, the net cost of producing and using biochar is roughly US$190/t biochar, based on literature estimates of abatement costs. Table 2 shows the cost per unit climate impact, based on net cost.

Our cost data only include revenue from the sale of biochar for soil amendment and do not include revenue from increased crop yield, carbon credit systems, or other by-products such as the thermal energy, syngas or bio-oils, which can be used to reduce energy costs or sold as fuel (Amonette et al., 2021). We found limited capital cost and revenue data; many sources (Buss et al., 2022; British Columbia Centre for Innovation & Clean Energy [CICE] & Deloitte, 2023; Fuss et al., 2018; IPCC, 2018; Liang & Chen, 2025; Russel et al., 2025) focused on the overall costs of biochar production. Operating costs include labor, feedstocks, transportation, and application of biochar, and can vary significantly (Liang & Chen, 2025; Shackley et al., 2014; Xiao et al, 2019). Xiao et al. (2019) found that it is possible to achieve low-cost biochar production at small scales. Some facilities may have a feedstock cost near zero with local organic waste, while others may have a high cost due to transportation and processing (International Renewable Energy Agency [IRENA], 2018).

We considered the baseline scenario where biomass is left to naturally decompose or is collected and processed for conventional disposal. We assumed baseline initial costs, operational costs, and revenue to be 0.

Table 2. Cost per unit climate impact.

Unit: 2023 US$/t CO₂‑eq , 100-yr basis

Median 230
Left Text Column Width

Methods and Supporting Data

Learning Curve

The processes and technologies for producing biochar are mature, and we were unable to find literature suggesting the costs to implement these solutions will fall in the future (The Institute for Carbon Removal, 2020). Even if technology costs drop over time, competition for feedstocks with bioenergy producers or composters could also increase production costs.

Speed of Action

Speed of action refers to how quickly a climate solution physically affects the atmosphere after it is deployed. This is different from speed of deployment, which is the pace at which solutions are adopted.

At Project Drawdown, we define the speed of action for each climate solution as emergency brake, gradual, or delayed.

Producing biochar is a GRADUAL climate solution. It has a steady, linear impact on the atmosphere. 

Caveats

Biochar properties may vary depending on the feedstock and production process. The carbon content of biochar can range from 10–81% of the carbon found in the feedstock (Woolf et al., 2021). Production processes also affect what co-products are produced: Slow pyrolysis generates more biochar, while fast pyrolysis boosts bio-oil production, and producing biochar with gasification will have syngas as the largest output (Afshar & Mofatteh, 2024). 

While strong evidence suggests that biochar sequesters carbon for hundreds to thousands of years, some uncertainties about permanence remain. Short-duration experiments have shown carbon loss over years or decades due to exposure to oxygen, water, and ultraviolet light, but these might not reflect real-world soil and environmental factors (Belmont & Sanchez, 2025). There is also evidence that co-application of biochar with nitrogen fertilizer can mitigate methane emissions in rice paddies (Baek et al., 2025). 

Current Adoption

We estimated that 380,000 t of biochar were produced in 2023 (Table 3).

We found only one source for current global annual production of biochar (International Biochar Initiative, 2024). These data were based on voluntary surveys of biochar producers with more than 1,000 respondents in 2023; we assumed it is an underestimate because it likely doesn’t include all biochar production facilities. 

Table 3. Current adoption level (2023).

Unit: t biochar produced and added to soil/yr

25th percentile 370,000
Mean 380,000
Median (50th percentile) 380,000
75th percentile 400,000
Left Text Column Width
Adoption Trend

We were only able to find adoption trend data for 2013, 2014, 2015, 2021, and 2023, all from the International Biochar Initiative (2014, 2015, 2016, 2024). These data rely on voluntary surveys; the source noted that some companies did not respond to the survey every year and that some biochar producers did not respond to the survey.

These adoption data show that biochar production has increased over time; however, it’s not clear whether this is due to increasing biochar production or increasing response rates from producers. 

Adoption Ceiling

Producing biochar has an estimated adoption ceiling of 1.3 billion t/yr (Table 4) based on reports from Energy Transition Commission (2022), Fuss et al. (2018), International Biochar Initiative (2024), IPCC (2022), Lehmann et al. (2021), Lenton (2010), NorthX, (2025), Smith et al. (2019), and Woolf et al. (2010). 

The adoption ceiling for biochar is often stated in terms of CO₂‑eq/yr removed. To convert this into metric tons of biochar we used the value of 1.9 t CO₂‑eq removed per mewtric ton of biochar produced given by the International Biochar Initiative (2024). In practice, the amount of carbon sequestered will depend on the feedstock used as well as the method used for producing biochar.

We based our analysis on the current level of organic waste produced by agriculture and industry. Many projections (Energy Transition Commission, 2022; Fuss et al., 2018; International Biochar Initiative, 2024; IPCC 2022; Lehmann et al., 2021; Lenton, 2010; NorthX, 2025; Smith et al., 2019; Woolf et al., 2010) show the technical potential of biochar production using all available waste biomass from agriculture or industry feedstocks. If biochar production is increased, we would expect to see more waste feedstocks used for biochar and less available for other climate solutions that use organic waste feedstocks.

Table 4. Adoption ceiling.

Unit: t biochar produced and added to soil/yr

25th percentile 530,000,000
Mean 1,100,000,000
Median (50th percentile) 1,300,000,000
75th percentile 1,600,000,000
Left Text Column Width
Achievable Adoption

Biochar production depends on the source and volume of feedstock. We estimate an achievable adoption of 160–570 Mt of biochar (Table 5). The low value was based on the projected biochar ceiling from Griscom et al. (2017), which excludes avoided emissions and partially accounts for restrictions in biomass availability. The high value aligns with IPCC (2022)’s estimate for the mitigation potential of biochar based on a US$100/t CO₂‑eq carbon price. The US$100/t CO₂‑eq carbon price is an indicator that biochar production will require economic support for widespread adoption and assumes that achievable biochar production is constrained more by economics than by biomass availability.

Large-scale biochar production will likely be limited by biomass competition with other climate solutions. Many sources do not specify how they calculated the amount of biomass available for biochar production, making it difficult to determine where achievable adoption would fall between the current adoption and the full technical adoption ceiling. We have chosen to be conservative for the high achievable adoption to reduce the chance of biochar production being restricted by feedstock constraints.

Table 5. Range of achievable adoption levels.

Unit: t biochar produced and added to soil/yr

Current adoption 380,000
Achievable – low 160,000,000
Achievable – high 570,000,000
Adoption ceiling 1,300,000,000
Left Text Column Width

Producing and using biochar has the potential to sequester a large amount of carbon emissions. While biochar currently sequesters 0 Gt CO₂‑eq/yr, we estimated 0.13–0.47 Gt CO₂‑eq/yr on a 100-yr basis (0.13–0.46 Gt CO₂‑eq/yr, 20-yr) could be sequestered (Table 6). The economics of building, operating, and maintaining biochar production facilities, along with biomass feedstock availability, will greatly affect how biochar production and use grows in the future. 

Producing biochar requires the use of biomass as a feedstock. Multiple climate solutions require biomass, and projected demand across solutions greatly exceeds supply. The deforestation that would be required to meet demand would produce emissions far greater than any mitigation gains from full deployment of these solutions (Searchinger, 2024). In addition to deforestation, there would also be costs and emissions incurred to transport biomass from where it is produced to where it can be processed and used. Thus, the estimated climate impacts presented here are only possible if feedstocks are prioritized for this solution. If feedstocks are instead prioritized for other climate solutions (see Interactions for examples), adoption and impact will be lower for this solution. It is not possible to set all biomass-dependent solutions to high adoption levels, add up their impacts, and determine an accurate combined emissions impact.

Table 6. Climate impact at different levels of adoption.

Unit: Gt CO₂‑eq/yr, 100-yr basis

Current adoption 0.00
Achievable – low 0.13
Achievable – high 0.47
Adoption ceiling 1.10
Left Text Column Width
Additional Benefits

Food Security

When used as a soil amendment, biochar has been found to increase soil health and yields of a variety of staple crops (Agegnehu et al., 2016; Kabir et al., 2023; Yang et al., 2025).

Health

Producing biochar can benefit health by mitigating the impacts of crop residue burning. Poor air quality from crop residue burning is harmful to health and can lead to premature mortality, especially in Southeast Asia, where residue burning is more common (Lan et al. 2022). Air pollution from burning crop residue has been linked to eye irritation, headaches, nausea, skin irritation, allergies, respiratory infections, increased risk of lung cancer, and reduced lung function (Gupta, 2019; Huang et al., 2022; Raza et al., 2022). 

Nature Protection

Using biochar can reduce nutrient-rich runoff from manure that can lead to eutrophication and hypoxic zones in aquatic ecosystems (Bijay-Singh & Craswell, 2021). Nitrogen pollution also harms terrestrial biodiversity through soil acidification and increases the productivity of fast-growing species, including invasives, which can outcompete native species (Porter et al., 2013).

Land Resources

By using crop residues instead of burning them, producing biochar can improve soils that would otherwise be degraded from crop residue burning (Bhuvaneshwari et al., 2019). 

When used as a soil amendment, biochar has been found to increase soil quality (Agegnehu et al., 2016). Biochar can aid in nutrient retention, including nitrogen, phosphorus, and soil organic carbon, and can improve soil water content (Agegnehu et al., 2016; Kabir et al., 2023; Yang et al., 2025). Some benefits depend on soil type; for example, amending biochar to mineral soils can increase soil pH, organic matter, and nutrient availability, especially in sandy and acidic soils, but soils with high pH could see a reduction in micronutrient availability (Yang et al., 2025).

Water Resources

Amending soil with biochar can increase soil water content, which can improve plant growth (Agegnehu et al., 2016; Kabir et al., 2013). 

Water Quality

Producing biochar can mitigate the use of manure on agriculture fields, which can improve water quality. Manure contains nutrients such as nitrogen and phosphorus as well as drug residues, heavy metals, and pathogens (Steinfeld et al., 2006). Manure can also leach into water sources when used as a fertilizer on croplands (Porter & Cox, 2020).

Air Quality

Producing biochar can benefit air quality by mitigating crop residue burning and the use of manure as fertilizer. Reducing the amount of manure applied as a fertilizer on croplands can improve air quality by reducing nitrogen and ammonia emissions associated with manure application (Grossi et al., 2019; Peterson et al., 2013; Steinfeld et al., 2006).

Crop residue burning is a major source of air pollution, including fine particulate matter, CO₂, and carbon monoxide, in South and Southeast Asia (Lan et al., 2022; Na Talang et al., 2024; Singh et al., 2021). Because fine particulate matter and black carbon make up a large part of the pollution, crop residue burning can lead to poor air quality far from agricultural fields (Kaskaoutis et al., 2014). Poor air quality associated with burning crop residues could be improved by instead producing biochar. 

Risks

The environmental impact of high adoption of biochar application in soils is unknown. Feasibility, long-term mitigation potential, side effects, and trade-offs are uncertain. Resolving these uncertainties will require biochar application on different soil types, environments, and management conditions in real-world settings for long periods (Fuss et al., 2018; Belmont & Sanchez, 2025).

The application of biochar could potentially change the microbial composition of the soils or lower the ability of plants to defend against insects, pathogens, and environmental stresses (Viger et al., 2014). It also could darken the soil surface, altering the land surface radiation balance. Fine biochar particles could get released into the atmosphere during production, transportation, or handling, leading to poor air quality, disrupted local hydrological cycles, and potential health concerns (Genesio et al., 2016; Ravi et al., 2016). GHG emissions from producing biochar differ across scales and technologies. Strategies to minimize the potentially negative impacts of biochar will need to be developed in order to guarantee that biochar has an overall positive impact on global climate change.

Interactions with Other Solutions

Reinforcing

Sayara & Sánchez (2021) observed reduced nitrogen emissions when biochar was added to compost.

Competing

Biochar production can compete with solutions that use biomass, specifically wood and crop residues, in other processes. Because the total projected demand for biomass for climate solutions exceeds the supply, not all of these solutions will be able to achieve their potential adoption. This solution competes with the following solutions for raw material:

Dashboard

Solution Basics

t biochar produced and added to soil

t CO₂-eq (100-yr)/unit/yr
00.810.84median
units/yr
Current 380,000 01.6×10⁸5.7×10⁸
Achievable (Low to High)

Climate Impact

Gt CO₂-eq (100-yr)/yr
Current 0 0.130.47
US$ per t CO₂-eq
230
Gradual

CO₂

Trade-offs

To preserve soil health and nutrient recovery, some agricultural and industrial forestry waste must be left on the land. If revenues from biochar production are very high, producers may be incentivized to convert additional land to grow crops for biochar. This could affect food security and soil health (CICE & Innovative Breakthrough Energy Technologies [IBET], 2023). 

Pyrolytic production of biochar can generate heat and power. However, different processes produce different outputs, and it is important to understand the economic considerations for biochar production (Afshar & Mofatteh, 2024). 

Biochar can be used to replace a small amount of cement in concrete production or incorporated into other building materials (Aman et al., 2022), but this limits its usage as a soil amendment and potential for enhanced soil carbon sequestration. However, using biochar in durable building materials stores carbon for multiple decades, while some agricultural applications could involve further combustion or decomposition of biochar and so release stored carbon back into the atmosphere within a few years. 

Action Word
Produce
Solution Title
Biochar
Classification
Highly Recommended

Lawmakers and Policymakers

  • Create strong regulatory frameworks and streamline permitting processes; if necessary, revise classification schemes for biochar production systems from “incinerators” to “carbon stabilizers”; fund necessary scientific assessments and convenings to develop robust regulatory framework.
  • Provide financial incentives such as payment for ecosystem services (PES), tax breaks, subsidies, or tax exemptions to support production, infrastructure, and biomass collection and delivery; offer subsidies for equipment purchases, equipment rentals, and biochar products such as soil amendments, construction materials, and other local uses.
  • Limit incentives for eligible feedstocks and biochar production to avoid unintended consequences such as land grabbing, deforestation, and land conversion.
  • Institute a carbon tax to incentivize the production of biochar while also discouraging burning crop residue and biomass.
  • Create or improve robust certification schemes for biochar – include clear governance models, standards for testing, systems and timelines for evaluation, and enforcement and verification mechanisms. 
  • Work with industry to develop products, supply chains, and markets; use public procurement when possible to help stabilize biochar markets.
  • Offer or subsidize biomass collection services; seek to establish local production and supply chains, aiming to minimize transportation of biomass and biochar products.
  • Co-design biochar projects with the local community; ensure community engagement starts early and is transparent, inclusive, and ongoing; solicit feedback from the local community – including from opposition groups – on location, design, finance, and mitigation; ensure finalized projects address sociological, agriculture, and ecological considerations.
  • Ensure projects operating in or with Indigenous communities only do so under Free, prior, and informed consent (FPIC); codify FPIC into legal systems.
  • Invest in R&D to optimize feedstock collection, biochar production, and biochar application to meet needs of local soils and/or rice paddies.
  • Invest in R&D for other uses of biochar beyond soil amendments, such as building materials and water treatment; research other land use applications, such as flood mitigation in upstream soils.
  • Establish one-stop-shop educational programs that use online and in-person methods to educate the industry and public on regulations, benefits of biochar, best practices, and other relevant information; ensure the material is sufficient and appropriate for local contexts, paying close attention to language barriers. 
  • Offer demonstration projects at relevant events and venues; expand agricultural extension services and ensure farmers are aware of biochar options, benefits, and incentives.
  • Work with industry to create high-integrity carbon markets that do not allow for deforestation and/or incentivize growing trees or crops solely for the production of biochar.
  • Join, create, or participate in public-private partnerships dedicated to de-risking markets, deployment, technology transfers, education, and other relevant areas.

Further information:

Practitioners

  • Fuel pyrolysis with by-products such as syngas and bio-oils and low-emission fuels.
  • Work to achieve consistent product quality; experiment with different equipment designs, feedstocks, applications, and products to identify locally optimal processes. 
  • Produce and/or invest in R&D to develop a variety of products beyond soil amendments, such as building materials and water filtration systems.
  • Invest in short- and long-term market analyses on entry points and possible products to meet local needs; help coordinate long-term research between public and private stakeholder groups. 
  • Secure written contracts for biomass feedstocks from suppliers to ensure consistent delivery.
  • Create and promote technical workforce and professional development programs; develop the full range of capacity to address every step of the value chain, including engineering, collection, biochemical sciences, product design, and business development.
  • Foster consumer awareness of biochar’s use and benefits through advertising and professional relationships.
  • Rent equipment for onsite production; offer a range of products that can accommodate different budgets and needs; offer services or rent equipment for post-production treatment processes and application.
  • Co-design biochar projects with the local community; ensure community engagement starts early and is transparent, inclusive, and ongoing; solicit feedback from the local community – including from opposition groups – on location, design, finance, and mitigation; ensure finalized projects address sociological, agriculture, and ecological considerations.
  • Ensure projects operating in or with Indigenous communities only do so under FPIC; codify FPIC into legal systems.
  • Create or improve robust certification schemes for biochar – include clear governance models, standards for testing, systems and timelines for evaluation, and enforcement and verification mechanisms. 
  • Advocate for favorable regulatory frameworks and incentives such as PES, tax breaks, subsidies, or exemptions to support production, infrastructure, and biomass collection and delivery; advocate for subsidies for equipment purchases, equipment rentals, and biochar products such as soil amendments, construction materials, and other local uses.
  • Establish one-stop-shop educational programs that use online and in-person methods to educate the industry and public on regulations, the benefits of biochar, best practices, and other relevant information; ensure the material is sufficient and appropriate for local contexts, paying close attention to language barriers. 
  • Offer demonstration projects at relevant events and venues; work with or advocate to expand agricultural extension services to ensure stakeholders are aware of biochar options, benefits, and incentives.
  • Work with policymakers and other stakeholders to create high-integrity carbon markets that do not allow for deforestation and/or incentivize growing trees or crops solely for the production of biochar.
  • Seek to establish local production and supply chains, aiming to minimize transportation of biomass and biochar products.
  • Join, create, or participate in public-private partnerships dedicated to de-risking markets, deployment, technology transfers, education, and other relevant areas.

Further information:

Business Leaders

  • If relevant, establish long-term procurement contracts with biochar producers; work with local producers to develop products and services.
  • Take advantage of government incentives such as tax credits, if possible; seek to gradually reduce reliance on these incentives to create long-term market stability.
  • Participate in community engagement processes; help co-design biochar projects with the local community; ensure community engagement starts early and is transparent, inclusive, and ongoing; solicit feedback from the local community – including from opposition groups – on location, design, finance, and mitigation; ensure finalized projects address sociological, agriculture, and ecological considerations.
  • Offer financial services, including low-interest loans, microfinancing, and grants, to support biochar initiatives.
  • Only purchase carbon credits from high-integrity, verifiable carbon markets, and do not use them as replacements for reducing emissions.
  • Support workforce development programs, offer employee scholarships, and/or sponsor training for careers in biochar.
  • Offer pro bono business advice or general support for community biochar projects using structures such as cooperative business models.
  • Join, create, or participate in public-private partnerships dedicated to de-risking markets, deployment, technology transfers, education, and other relevant areas.

Further information:

Nonprofit Leaders

  • Help operate or establish biochar collection, distribution, production, and/or processing facilities; advocate for government support in these areas when necessary; help ensure production and supply chains remain local, aiming to minimize transportation of biomass and biochar products.
  • If relevant, establish long-term procurement contracts with biochar producers; work with local producers to develop products and services.
  • Advocate for and help develop strong regulatory frameworks and streamlined permitting processes; if necessary, suggest revising classification of biochar production systems from incinerators to carbon stabilizers; advocate for funding necessary scientific assessments and convenings to develop a robust regulatory framework.
  • Advocate for favorable regulatory frameworks and incentives, such as PES, tax breaks, subsidies, or exemptions to support production, infrastructure, and biomass collection and delivery; advocate for subsidies for equipment purchases, equipment rentals, and biochar products, such as soil amendments, construction materials, and other local uses.
  • Advocate for carbon taxes and for restrictions, taxes, or bans on burning crop residue and biomass.
  • Help create or improve robust certification schemes for biochar; include clear governance models, standards for testing, systems and timelines for evaluation, and enforcement and verification mechanisms. 
  • Work with industry to develop products, supply chains, and markets; help coordinate public procurement when possible to help stabilize biochar markets.
  • Participate in community engagement processes; help co-design biochar projects with the local community; ensure community engagement starts early and is transparent, inclusive, and ongoing; solicit feedback from the local community – including from opposition groups – on location, design, finance, and mitigation; ensure finalized projects address sociological, agriculture, and ecological considerations.
  • Ensure projects operating in or with Indigenous communities only do so under FPICt; advocate to codify FPIC into legal systems.
  • Conduct R&D to match biochar production and post-treatment processes that can produce the type of biochar that meet the needs of local soils and/or rice paddies; help collect and share optimal feedstock, production, methods, and application combinations for various soil types.
  • Research other uses for biochar, such as building materials and water treatment; research other land use applications such as flood mitigation in upstream soils.
  • Establish one-stop-shop educational programs that use online and in-person methods to educate the industry and public on regulations, the benefits of biochar, best practices, and other relevant information; ensure the material is sufficient and appropriate for local contexts, paying close attention to language barriers. 
  • Offer demonstration projects at relevant events and venues; work with or advocate to expand agricultural extension services to ensure stakeholders are aware of biochar options, benefits, and incentives.
  • Work with industry to create high-integrity carbon markets that do not allow for deforestation and/or incentivize growing trees or crops solely for the production of biochar.
  • Join, create, or participate in public-private partnerships dedicated to de-risking markets, deployment, technology transfers, education, and other relevant areas.

Further information:

Investors

  • Invest in companies involved in the production biochar; ensure projects include thorough community engagement. 
  • Offer low-interest loans and concessional financing for companies developing biochar production facilities.
  • Invest in green bonds and/or explore blended finance structures to mobilize capital for companies involved in the production of biochar.
  • Align investments with existing public-private partnerships, voluntary agreements, or voluntary guidance that may apply in the location of the investment (including those that apply to biodiversity).

Further information:

Philanthropists and International Aid Agencies

  • Award grants directly to companies involved in biochar production; ensure projects include thorough community engagement. 
  • Offer low-interest loans and concessional financing for companies developing biochar production facilities.
  • Invest in or offer green bonds and/or explore blended finance structures to mobilize capital for companies involved in biochar production.
  • Help operate or establish biochar collection, distribution, production, and/or processing facilities; advocate for government support in these areas when necessary; help ensure production and supply chains remain local to minimize transportation of biomass and biochar products.
  • If relevant, establish long-term procurement contracts with biochar producers; work with local producers to develop products and services.
  • Advocate for and help develop strong regulatory frameworks and streamlined permitting processes; if necessary, suggest revising classification of biochar production systems from incinerators to carbon stabilizers; advocate for funding scientific assessments and convenings needed to develop a robust regulatory framework.
  • Advocate for favorable regulatory frameworks and incentives, such as PES, tax breaks, subsidies, or exemptions to support production, infrastructure, and biomass collection and delivery; advocate for subsidies for equipment purchases, equipment rentals, and biochar products, such as soil amendments, construction materials, and other local uses.
  • Advocate for carbon taxes and for restrictions, taxes, or bans on burning crop residue and biomass.
  • Help create or improve robust certification schemes for biochar – include clear governance models, standards for testing, systems and timelines for evaluation, and enforcement and verification mechanisms. 
  • Work with industry to develop products, supply chains, and markets; help coordinate public procurement when possible to help stabilize biochar markets.
  • Participate in community engagement processes; help co-design biochar projects with the local community; ensure community engagement starts early and is transparent, inclusive, and ongoing; solicit feedback from the local community – including from opposition groups – on location, design, finance, and mitigation; ensure finalized projects address sociological, agriculture, and ecological considerations.
  • Ensure projects operating in or with Indigenous communities only do so under FPIC; advocate to codify FPIC into legal systems.
  • Conduct R&D to match biochar production and post-treatment processes that can produce the type of biochar that meet the needs of local soils and/or rice paddies; help collect and share optimal feedstock, production, methods, and application combinations for various soil types.
  • Research other uses for biochar, such as building materials and water treatment; research other land use applications, such as flood mitigation in upstream soils.
  • Establish one-stop-shop educational programs that use online and in-person methods to educate the industry and public on regulations, the benefits of biochar, best practices, and other relevant information; ensure the material is sufficient and appropriate for local contexts, paying close attention to language barriers. 
  • Offer demonstration projects at relevant events and venues; work with or advocate to expand agricultural extension services to ensure stakeholders are aware of biochar options, benefits, and incentives.
  • Work with industry to create high-integrity carbon markets that do not allow for deforestation and/or incentivize growing trees or crops solely for the production of biochar.
  • Join, create, or participate in public-private partnerships dedicated to de-risking markets, deployment, technology transfers, education, and other relevant areas.

Further information:

Thought Leaders

  • Help operate or establish biochar collection, distribution, production, and/or processing facilities; advocate for government support in these areas when necessary; help ensure production and supply chains remain local to minimize transportation of biomass and biochar products.
  • Advocate for and help develop strong regulatory frameworks and streamlined permitting processes; if necessary, suggest revising classification of biochar production systems from incinerators to carbon stabilizers; advocate for funding necessary scientific assessments and convenings to develop a robust regulatory framework.
  • Advocate for favorable regulatory frameworks and incentives such as PES, tax breaks, subsidies, or exemptions to support production, infrastructure, and biomass collection and delivery; advocate for subsidies for equipment purchases, equipment rentals, and biochar products such as soil amendments, construction materials, and other local uses.
  • Advocate for carbon taxes and for restrictions, taxes, or bans on burning crop residue and biomass.
  • Help create or improve robust certification schemes for biochar – include clear governance models, standards for testing, systems and timelines for evaluation, and enforcement and verification mechanisms. 
  • Work with industry to develop products, supply chains, and markets; help coordinate public procurement when possible to help stabilize biochar markets.
  • Participate in community engagement processes; help co-design biochar projects with the local community; ensure community engagement starts early and is transparent, inclusive, and ongoing; solicit feedback from the local community – including from opposition groups – on location, design, finance, and mitigation; ensure finalized projects address sociological, agriculture, and ecological considerations.
  • Ensure projects operating in or with Indigenous communities only do so under FPIC; advocate to codify FPIC into legal systems.
  • Conduct R&D to match biochar production and post-treatment processes that can produce the type of biochar that meet the needs of local soils and/or rice paddies; help collect and share optimal feedstock, production, methods, and application combinations for various soil types.
  • Research other uses for biochar, such as building materials and water treatment; research other land use applications, such as flood mitigation in upstream soils.
  • Establish one-stop-shop educational programs that use online and in-person methods to educate the industry and public on regulations, the benefits of biochar, best practices, and other relevant information; ensure the material is sufficient and appropriate for local contexts, paying close attention to language barriers. 
  • Offer demonstration projects at relevant events and venues; work with or advocate to expand agricultural extension services to ensure stakeholders are aware of biochar options, benefits, and incentives.
  • Work with industry to create high-integrity carbon markets that do not allow for deforestation and/or incentivize growing trees or crops solely for the production of biochar.
  • Join, create, or participate in public-private partnerships dedicated to de-risking markets, deployment, technology transfers, education, and other relevant areas.

Further information:

Technologists and Researchers

  • Help standardize production and post-treatment processes; identify feedstocks and processes that align with needs such as soil additives, construction material, and water filtration. 
  • Help measure pollutants and GHGs from the biochar production process, including black carbon, methane, and nitrous oxide.
  • Create publicly accessible databases of biochar production processes and products; help model production methods to identify optimal engineering. 
  • Collect and catalog data on biophysical processes, biochar properties, feedstock formulas, application procedures, and biochar supply chains and markets.
  • Investigate potential impacts of biochar use on crops yields and biomass production; impacts on soil carbon stocks; GHG emissions reductions and fluxes; competition for biomass availability; carbon permanence; effects on nature, air quality, and biodiversity; and changes in application of other agricultural inputs such as fertilizers and herbicides.
  • Improve understanding of the role biochar can play in regenerating soils and microbial life.
  • Research and seek to improve the ability of biochar to remove heavy metals, plastics, PFAS, and other contaminants from soils.
  • Run long-term field investigations on the performance of biochar in asphalt and concrete; examine impacts on the urban heat island effect.

Further information:

Communities, Households, and Individuals

  • Explore uses for biochar in your garden or lawn; use biochar building materials or other biochar products.
  • Advocate for and help develop strong regulatory frameworks and streamlined permitting processes; if necessary, suggest revising classification of biochar production systems from incinerators to carbon stabilizers; advocate for funding necessary scientific assessments and convenings to develop a robust regulatory framework.
  • Advocate for favorable regulatory frameworks and incentives such as PES, tax breaks, subsidies, or exemptions to support production, infrastructure, and biomass collection and delivery; advocate for subsidies for equipment purchases, equipment rentals, and biochar products such as soil amendments, construction materials, and other local uses.
  • Advocate for carbon taxes and for restrictions, taxes, or bans on burning crop residue and biomass.
  • Help ensure projects operating in or with Indigenous communities only do so under FPIC; advocate to codify FPIC into legal systems.
  • Participate in community engagement processes; help co-design biochar projects with the local community; ensure community engagement starts early and is transparent, inclusive, and ongoing; solicit feedback from the local community – including from opposition groups – on location, design, finance, and mitigation; ensure finalized projects address sociological, agriculture, and ecological considerations.

Further information:

Evidence Base

Consensus of effectiveness in sequestering carbon: High

A wide variety of organic feedstocks can be used to produce biochar, mainly from the agricultural and industrial forestry sectors. Converting biomass into biochar using pyrolysis converts a portion of the carbon into a stable form, thereby slowing its release into the atmosphere. When biochar is used as a soil amendmen,t it improves soil fertility by retaining water and nutrients (Woolley & Hallowell, 2018).

The process used to create biochar can have varying efficiencies because the conversion of organic carbon in the feedstock to biochar can range from 30–55% with slow pyrolysis or be as low as 3% with regular combustion (Amonette et al., 2021). In addition, different biomass feedstocks contain different amounts of carbon, which will affect the carbon content of the biochar (Joseph et al., 2021).

Using biochar can also have additional benefits. Biochar can be used as filter material for remediation of soil or water pollution, an additive for composting or anaerobic digestion (Alayaki et al., 2025), or a supplement to concrete and other building materials, packaging, and bio-oils (Russell, 2025).

The results presented in this document summarize findings from 21 reviews and meta-analyses and 17 original studies reflecting current evidence from two countries (the United States and Canada) and from sources examining global biochar production. We recognize this limited geographic scope creates bias, and we hope this work inspires research and data sharing on this topic in underrepresented regions.

Updated Date
Coming Soon Label
Coming Soon

Deploy Silvopasture

Image
Image
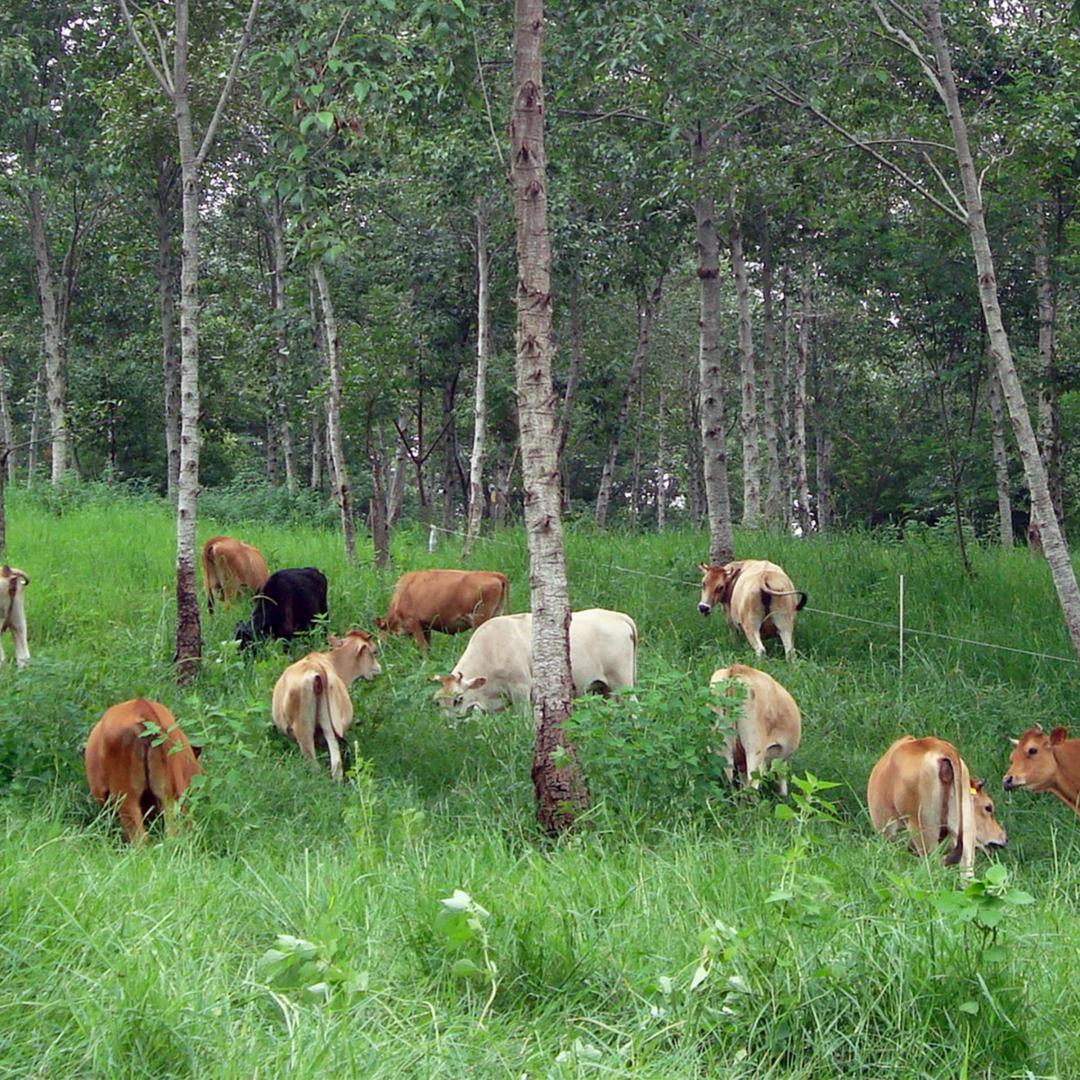
Cows grazing among trees
Coming Soon
Off
Summary

We define the Deploy Silvopasture solution as the adoption of agroforestry practices that add trees to grazing land, including planted pastures and natural rangelands. (Note that this solution does NOT include creating forested grazing land by thinning existing forest; this is a form of deforestation and not desirable in terms of climate.) Some silvopastures are open savannas, while others are dense, mature tree plantations. The trees may be planted or managed to naturally regenerate. Some silvopasture systems have been practiced for thousands of years, while others have been recently developed. All provide shade to livestock; in some systems, the trees feed livestock, produce timber or crops for human consumption, or provide other benefits. New adoption is estimated from the 2025 level as a baseline which is therefore set to zero.

Description for Social and Search
Deploy Silvopasture is a Highly Recommended climate solution. It enhances carbon storage by adding trees to grazing land, including planted pastures and natural rangelands.
Overview

In silvopasture systems, trees are planted or allowed to naturally regenerate on existing pasture or rangeland. Tree density is generally less than forest, allowing sunlight through for good forage growth.

Silvopasture has multiple climate impacts, though carbon sequestration is the only one which has been thoroughly studied across all climates and sub-practices.

Silvopasture sequesters carbon in both soil and woody biomass. Carbon sequestration rates are among the highest of any farming system (Toensmeier, 2017). The lifetime accumulation of carbon in both soils and biomass is higher than for managed grazing alone (Montagnini et al., 2019; Nair et al., 2012).

Silvopasture can also reduce GHG emissions, though not in every case. We do not include emissions reductions in this analysis.

Conversion from pasture to silvopasture slightly increases capture and storage of methane in soils (Bentrup and Shi, in press). In addition, in fodder subtypes of silvopasture systems, ruminant livestock consume tree leaves or pods. Many, but not all, of the tree species used in these systems have tannin content that reduces emissions of methane from enteric fermentation (Jacobsen et al., 2019). 

Some subtypes of silvopasture reduce nitrous oxide emissions from manure and urine, as grasses and trees capture nitrogen that microbes would otherwise convert to nitrous oxide. There are also reductions to nitrous oxide emissions from soils: 76–95% in temperate silvopastures and 16–89% in tropical-intensive silvopastures (Ansari et al., 2023; Murguietio et al., 2016).

Many silvopasture systems increase productivity of milk and meat. Yield increases can reduce emissions from deforestation by growing more food on existing farmland, but in some cases can actually worsen emissions if farmers clear forests to adopt the profitable practice (Intergovernmental Panel on Climate Change [IPCC], 2019). The yield impact of silvopasture varies with tree density, climate, system type, and whether the yields of other products (e.g., timber) are counted as well (Rojas et al., 2022). 

References

Ansari, J., Udawatta, R. P., & Anderson, S. H. (2022). Soil nitrous oxide emission from agroforestry, rowcrop, grassland and forests in North America: a review. Agroforestry Systems, 97(8), 1465–1479. Link to source: https://doi.org/10.1007/s10457-023-00870-y

Basche, A., Tully, K., Álvarez-Berríos, N. L., Reyes, J., Lengnick, L., Brown, T., Moore, J. M., Schattman, R. E., Johnson, L. K., & Roesch-McNally, G. (2020). Evaluating the untapped potential of US conservation investments to improve soil and environmental health. Frontiers in Sustainable Food Systems, 4, 547876. Link to source: https://doi.org/10.3389/fsufs.2020.547876 

Batcheler, M., Smith, M. M., Swanson, M. E., Ostrom, M., & Carpenter-Boggs, L. (2024). Assessing silvopasture management as a strategy to reduce fuel loads and mitigate wildfire risk. Scientific Reports, 14(1), 5954. Link to source: https://doi.org/10.1038/s41598-024-56104-3

Bentrup, G. & Shi, X. (in press). Multifunctional buffers: Design guidelines for buffers, corridors and greenways. USDA Forest Service. 

Bostedt, G., Hörnell, A., & Nyberg, G. (2016). Agroforestry extension and dietary diversity–an analysis of the importance of fruit and vegetable consumption in West Pokot, Kenya. Food Security, 8, 271–284. Link to source: https://doi.org/10.1007/s12571-015-0542-x

Briske, D. D., Vetter, S., Coetsee, C., & Turner, M. D. (2024). Rangeland afforestation is not a natural climate solution. Frontiers in Ecology and the Environment. Link to source: https://doi.org/10.1002/fee.2727

Cadavid, Z., & BE, S. T. (2020). Sistemas silvopastoriles: aspectos teóricos y prácticos. CIPAV. Link to source: https://cipav.org.co/sdm_downloads/sistemas-silvopastoriles-aspectos-teoricos-y-practicos/

Cardinael, R., Umulisa, V., Toudert, A., Olivier, A., Bockel, L., & Bernoux, M. (2019). Revisiting IPCC Tier 1 coefficients for soil organic and biomass carbon storage in agroforestry systems. Environmental Research Letters, 13(12), 124020. Link to source: https://doi.org/10.1088/1748-9326/aaeb5f

Chapman, M., Walker, W.S., Cook-Patton, S.C., Ellis, P.W., Farina, M., Griscom, B.W., & Baccani, A. (2019). Large climate mitigation potential from adding trees to agricultural lands Global Change Biology, 26(80), 4357–4365. Link to source: https://doi.org/10.1111/gcb.15121

Chatterjee, N., Nair, P. R., Chakraborty, S., & Nair, V. D. (2018). Changes in soil carbon stocks across the forest-agroforest-agriculture/pasture continuum in various agroecological regions: A meta-analysis. Agriculture, ecosystems & environment, 266, 55–67. Link to source: https://doi.org/10.1016/j.agee.2018.07.014

Damania, Richard; Polasky, Stephen; Ruckelshaus, Mary; Russ, Jason; Amann, Markus; Chaplin-Kramer, Rebecca; Gerber, James; Hawthorne, Peter; Heger, Martin Philipp; Mamun, Saleh; Ruta, Giovanni; Schmitt, Rafael; Smith, Jeffrey; Vogl, Adrian; Wagner, Fabian; Zaveri, Esha. (2023). Nature's Frontiers: Achieving Sustainability, Efficiency, and Prosperity with Natural Capital. Environment and Sustainable Development series. Washington, DC: World Bank Link to source: https://hdl.handle.net/10986/39453

de Sherbinin, A., VanWey, L. K., McSweeney, K., Aggarwal, R., Barbieri, A., Henry, S., Hunter, L. M., Twine, W., & Walker, R. (2008). Rural household demographics, livelihoods and the environment. Global Environmental Change, 18(1), 38–53. Link to source: https://doi.org/10.1016/j.gloenvcha.2007.05.005

Den Herder, M., Moreno, G., Mosquera-Losada, R. M., Palma, J. H., Sidiropoulou, A., Freijanes, J. J. S., & Burgess, P. J. (2017). Current extent and stratification of agroforestry in the European Union. Agriculture, Ecosystems & Environment, 241, 121–132. Link to source: https://doi.org/10.1016/j.agee.2017.03.005

Di Prima, S., Wright, E. P., Sharma, I. K., Syurina, E., & Broerse, J. E. W. (2022). Implementation and scale-up of nutrition-sensitive agriculture in low- and middle-income countries: A systematic review of what works, what doesn’t work and why. Global Food Security, 32, 100595. Link to source: https://doi.org/10.1016/j.gfs.2021.100595

deStefano, A, & Jacobson, M.G. (2018). Soil carbon sequestration in agroforestry systems: A review. Agroforestry Systems, 92, 285–299. Link to source: https://doi.org/10.1007/s13593-014-0212-y

Dudley, N., Eufemia, L., Fleckenstein, M., Periago, M. E., Petersen, I., & Timmers, J. F. (2020). Grasslands and savannahs in the UN Decade on Ecosystem Restoration. Restoration Ecology, 28(6), 1313–1317. Link to source: https://doi.org/10.1111/rec.13272

Dupraz, C, and Liagre, F.(2011). Agroforesterie: Des Arbres et des Cultures. Editions France Agricole. Link to source: https://agroboutique.com/agroecologie-catalogue/12-agroforesterie-des-arbres-et-des-cultures.html

FAO Statistical Service (2024). FAOStat. Link to source: https://www.fao.org/faostat/en/

Feliciano, D., Ledo, A., Hillier, J., & Nayak, D. R. (2018). Which agroforestry options give the greatest soil and above ground carbon benefits in different world regions?. Agriculture, ecosystems & environment, 254, 117–129. Link to source: https://doi.org/10.1016/j.agee.2017.11.032

Frelat, R., Lopez-Ridaura, S., Giller, K. E., Herrero, M., Douxchamps, S., Djurfeldt, A. A., Erenstein, O., Henderson, B., Kassie, M., Paul, B. K., Rigolot, C., Ritzema, R. S., Rodriguez, D., Van Asten, P. J. A., & Van Wijk, M. T. (2016). Drivers of household food availability in sub-Saharan Africa based on big data from small farms. Proceedings of the National Academy of Sciences of the United States of America, 113(2), 458–463. Link to source: https://doi.org/10.1073/pnas.1518384112

Garrett, H. E., Kerley, M. S., Ladyman, K. P., Walter, W. D., Godsey, L. D., Van Sambeek, J. W., & Brauer, D. K. (2004). Hardwood silvopasture management in North America. In New Vistas in Agroforestry: A Compendium for 1st World Congress of Agroforestry, 2004 (pp. 21–33). Springer Netherlands. Link to source: https://doi.org/10.1007/978-94-017-2424-1_2

Goracci, J., & Camilli, F. (2024). Agroforestry and animal husbandry. IntechOpen. Link to source: https://doi.org/10.5772/intechopen.1006711

Government of Colombia (2020). Actualización de la Contribución Determinada a Nivel Nacional de Colombia. Government of Colombia. Link to source: https://unfccc.int/sites/default/files/NDC/2022-06/NDC%20actualizada%20de%20Colombia.pdf

Greene, H., Kazanski, C. E., Kaufman, J., Steinberg, E., Johnson, K., Cook-Patton, S. C., & Fargione, J. (2023). Silvopasture offers climate change mitigation and profit potential for farmers in the eastern United States. Frontiers in Sustainable Food Systems, 7, 1158459. Link to source: https://doi.org/10.3389/fsufs.2023.1158459

Hart, D.R.T, Yeo, S, Almaraz, M, Beillouin, D, Cardinael, R, Garcia, E, Kay, S, Lovell, S.T., Rosenstock, T.S., Sprenkle-Hyppolite, S, Stolle, F, Suber, M, Thapa, B, Wood, S & Cook-Patton, S.C (2023). “Priority science can accelerate agroforestry as a natural climate solution”. Nature Climate Change. Link to source: https://doi.org/10.5281/zenodo.8209212

Husak, A. L., & Grado, S. C. (2002). Monetary benefits in a southern silvopastoral system. Southern Journal of Applied Forestry, 26(3), 159–164. Link to source: https://doi.org/10.1093/sjaf/26.3.159

IPCC (2019). Climate Change and Land: an IPCC special report on climate change, desertification, land degradation, sustainable land management, food security, and greenhouse gas fluxes in terrestrial ecosystems [P.R. Shukla, J. Skea, E. Calvo Buendia, V. Masson-Delmotte, H.-O. Pörtner, D. C. Roberts, P. Zhai, R. Slade, S. Connors, R. van Diemen, M. Ferrat, E. Haughey, S. Luz, S. Neogi, M. Pathak, J. Petzold, J. Portugal Pereira, P. Vyas, E. Huntley, K. Kissick, M. Belkacemi, J. Malley, (eds.)]. Link to source: https://www.ipcc.ch/srccl/

IPCC AR6 WG3 (2022). Climate Change 2022: Mitigation of Climate Change. Contribution of Working Group III to the Sixth Assessment Report of the Intergovernmental Panel on Climate Change [P.R. Shukla, J. Skea, R. Slade, A. Al Khourdajie, R. van Diemen, D. McCollum, M. Pathak, S. Some, P. Vyas, R. Fradera, M. Belkacemi, A. Hasija, G. Lisboa, S. Luz, J. Malley, (eds.)]. Cambridge University Press, Cambridge, UK and New York, NY, USA. Link to source: https://doi.org/10.1017/9781009157926

Jacobsen (2019). Secondary metabolites in leaf hay as a mitigation option for enteric methane production in ruminants. Aarhus University. Link to source: https://pure.au.dk/ws/portalfiles/portal/197235590/Secondary_Metabolites_in_Leaf_Hay_as_a_Mitigation_Option_for_Enteric_Methane_Production_in_Ruminants.pdf

Jose, S., & Dollinger, J. (2019). Silvopasture: a sustainable livestock production system. Agroforestry systems, 93, 1-9. Link to source: https://doi.org/10.1007/s10457-019-00366-8

Lal, R., Smith, P., Jungkunst, H. F., Mitsch, W. J., Lehmann, J., Nair, P. R., & Ravindranath, N. H. (2018). The carbon sequestration potential of terrestrial ecosystems. Journal of soil and water conservation, 73(6), 145A–152A. Link to source: https://doi.org/10.2489/jswc.73.6.145A

Lee, S., Bonatti, M, Löhe, K, Palacios, V., Lana, M.A., and Sieber, S (2020). Adoption potentials and barriers of silvopastoral systems in Colombia: Case of Cundinamarca region. Cogent Environmental Science 6(1). Link to source: https://doi.org/10.1080/23311843.2020.1823632

Lemes, A. P., Garcia, A. R., Pezzopane, J. R. M., Brandão, F. Z., Watanabe, Y. F., Cooke, R. F., Sponchiado, M., Paz, C. C. P., Camplesi, A. C., Binelli, M., & Gimenes, L. U. (2021). Silvopastoral system is an alternative to improve animal welfare and productive performance in meat production systems. Scientific Reports, 11(1), 14092. Link to source: https://doi.org/10.1038/s41598-021-93609-7

Lorenz, K., & Lal, R. (2018). Carbon sequestration in agricultural ecosystems. Springer, Cham. Link to source: https://link.springer.com/book/10.1007/978-3-319-92318-5

Mehrabi, Z., Tong, K., Fortin, J., Stanimirova, R., Friedl, M., & Ramankutty, N. (2024). Global agricultural lands in the year 2015. Earth System Science Data Discussions, 2024, 1–44. Link to source: https://doi.org/10.5194/essd-2024-279

Montagnini, F (2019). Función de los sistemas agroforestales en la adaptación y mitigación del cambio climático. Sistemas agroforestales: Funciones productivas, socioeconómicas y ambientales, 269-299. Link to source: https://cipav.org.co/wp-content/uploads/2020/08/sistemas-agroforestales-funciones-productivas-socioeconomicas-y-ambientales.pdf

Morena, G., & Rolo, V. (2019). Agroforestry practices: Silvopastoralism. In Agroforestry for sustainable agricultura (1st ed.). Burleigh Dodds Science Publishing. Link to source: https://doi.org/10.1201/9780429275500

Murgueitio, E., Uribe, F., Molina, C., Molina, E., Galindo, W., Chará, J., & González, J. (2016). Establecimiento y manejo de sistemas silvopastoriles intensivos con Leucaena. Editorial CIPAV, Cali, Colombia. Link to source: https://www.researchgate.net/profile/Juan-Naranjo-R/publication/310460876_Establecimiento_y_manejo_de_sistemas_silvopastoriles_intensivos_con_leucaena/links/582e30cb08ae138f1c01d8b9/Establecimiento-y-manejo-de-sistemas-silvopastoriles-intensivos-con-leucaena.pdf

Nair, P.K. R. (2012). Climate change mitigation: A low-hanging fruit of agroforestry. Agroforestry: The future of global land use, 31–69. Link to source: https://doi.org/10.1007/978-94-007-4676-3_7

Ortiz, J., Neira, P., Panichini, M., Curaqueo, G., Stolpe, N. B., Zagal, E., & Gupta, S. R. (2023). Silvopastoral systems on degraded lands for soil carbon sequestration and climate change mitigation. Agroforestry for Sustainable Intensification of Agriculture in Asia and Africa, 207–242. Link to source: https://doi.org/10.1007/978-981-19-4602-8_7

Pent, G. J. (2020). Over-yielding in temperate silvopastures: a meta-analysis. Agroforestry Systems, 94(5), 1741–1758. Link to source: https://doi.org/10.1007/s10457-020-00494-6

Pezo, D., Ríos, N., Ibrahim, M., & Gómez, M. (2018). Silvopastoral systems for intensifying cattle production and enhancing forest cover: the case of Costa Rica. Washington, DC: World Bank. Link to source: https://www.profor.info/sites/default/files/Silvopastoral%2520systems_Case%2520Study_LEAVES_2018.pdf

Poudel, S., Pent, G., & Fike, J. (2024). Silvopastures: Benefits, past efforts, challenges, and future prospects in the United States. Agronomy, 14(7), 1369. Link to source: https://doi.org/10.3390/agronomy14071369

Quandt, A, Neufeldt, G, & Gorman, K (2023). Climate change adaptation through agroforestry: Opportunities and gaps. Current Opinion in Environmental Sustainability. 60, 101244. Link to source: https://doi.org/10.1016/j.cosust.2022.101244

Rivera, J. E., Serna, L., Arango, J., Barahona, R., Murgueitio, E., Torres, C. F., & Chará, J. (2023). Silvopastoral systems and their role in climate change mitigation and Nationally Determined Contributions in Latin America. In Silvopastoral systems of Meso America and Northern South America (pp. 25–53). Cham: Springer International Publishing. Link to source: https://doi.org/10.1007/978-3-031-43063-3_2

Rojas, D, & Rodriguez Anido, N. (2022) Potential of silvopastoral systems for the mitigation of greenhouse gasses generated in the production of bovine meat. In Sistemas silvopastoriles: Hacia una diversificación sostenible. CIPAV. Link to source: https://cipav.org.co/sistemas-silvopastoriles-hacia-una-diversificacion-sostenible/

Riset, J.Å., Tømmervik, H. & Forbes, B.C. (2019). Sustainable and resilient reindeer herding. Reindeer Caribou Health Dis, (23–43). Link to source: https://www.researchgate.net/publication/344787755_Ch13_Sustainable_and_resilient_reindeer_herding

Shelton, M., Dalzell, S., Tomkins, N. and Buck, S. R. (2021). Leucaena: The productive and sustainable forage legume. University of Queensland. Link to source: https://era.dpi.qld.gov.au/id/eprint/9425/

Shi, L., Feng, W., Xu, J., & Kuzyakov, Y. (2018). Agroforestry systems: Meta‐analysis of soil carbon stocks, sequestration processes, and future potentials. Land Degradation & Development, 29(11), 3886–3897. Link to source: https://doi.org/10.1002/ldr.3136

Smith, M. M., Bentrup, G., Kellerman, T., MacFarland, K., Straight, R., Ameyaw, L., & Stein, S. (2022). Silvopasture in the USA: A systematic review of natural resource professional and producer-reported benefits, challenges, and management activities. Agriculture, Ecosystems & Environment, 326, 107818. Link to source: https://doi.org/10.1016/j.agee.2021.107818

Sprenkle-Hyppolite, S. Griscom, B., Griffey, V., Munshi, E., Chapman, M. (2024). Maximizing tree carbon in cropland and grazing lands while sustaining yields. Carbon Balance and Management 19:23. Link to source: https://doi.org/10.1186/s13021-024-00268-y

Toensmeier, E. (2017). Perennial staple crops and agroforestry for climate change mitigation. Integrating landscapes: Agroforestry for biodiversity conservation and food sovereignty, 439-451. Link to source: https://doi.org/10.1007/978-3-319-69371-2_18

U.S. Department of Agriculture Natural Resources Conservation Service [USDA NRCS]. (2025). Conservation Practice Physical Effects [Dataset]. Link to source: https://www.nrcs.usda.gov/resources/guides-and-instructions/conservation-practice-physical-effects

Udawatta, R. P., Walter, D., & Jose, S. (2022). Carbon sequestration by forests and agroforests: A reality check for the United States. Carbon footprints, 1(8). Link to source: https://doi.org/10.20517/cf.2022.06 

Zeppetello, L. R. V., Cook-Patton, S. C., Parsons, L. A., Wolff, N. H., Kroeger, T., Battisti, D. S., Bettles, J., Spector, J. T., Balakumar, A., & Masuda, Y. J. (2022). Consistent cooling benefits of silvopasture in the tropics. Nature communications, 13(1), 708. Link to source: https://doi.org/10.1038/s41467-022-28388-4

Zhu, X., Liu, W., Chen, J., Bruijnzeel, L. A., Mao, Z., Yang, X., Cardinael, R., Meng, F.-R., Sidle, R. C., Seitz, S., Nair, V. D., Nanko, K., Zou, X., Chen, C., & Jiang, X. J. (2020). Reductions in water, soil and nutrient losses and pesticide pollution in agroforestry practices: A review of evidence and processes. Plant and Soil, 453(1–2), 45–86. Link to source: https://doi.org/10.1007/s11104-019-04377-3

Credits

Lead Fellow

  • Eric Toensmeier

Contributors

  • Ruthie Burrows, Ph.D.

  • Yusuf Jameel, Ph.D.

  • Daniel Jasper

Internal Reviewers

  • Aiyana Bodi

  • Hannah Henkin

  • Ted Otte

  • Paul C. West, Ph.D.

Effectiveness

We found a median carbon sequestration rate of 9.81 t CO₂‑eq /ha/yr (Table 1). This is based on an above-ground biomass (tree trunks and branches) accumulation rate of 6.43 t CO₂‑eq /ha/yr and a below-ground biomass (roots) accumulation rate of 1.61 t CO₂‑eq /ha/yr using a root-to-shoot ratio of 0.25 (Cardinael et al., 2019). These are added to the soil organic carbon sequestration rate of 1.76 t CO₂‑eq /ha/yr to create the combined total.

Table 1. Effectiveness at carbon sequestration.

Unit: t CO₂-eq/ha/yr, 100-yr basis

25th percentile 4.91
Mean 14.70
Median (50th percentile) 9.81
75th percentile 20.45

100-yr basis

Left Text Column Width

Reductions in nitrous oxide and methane and sustainable intensification impacts are not yet quantifiable to the degree that they can be used in climate mitigation projections.

Cost

Because baseline grazing systems are already extensive and well established, we assumed there is no cost to establish new baseline grazing land. In the absence of global data sets on costs and revenues of grazing systems, we used a global average profit per hectare of grazing land of US$6.28 from Damania et al. (2023).

Establishment costs of silvopasture vary widely. We found the cost to establish one hectare of silvopasture to be US$1.06–4,825 (Dupraz & Liagre, 2011; Lee et al., 2011). Reasons for this wide range include the low cost of natural regeneration and the broad range in tree density depending on the type of system. We collected costs by region and used a weighted average to obtain a global net net cost value of US$424.20.

Cost and revenue data for silvopasture were insufficient. However, data on the impact on revenues per hectare are abundant. Our analysis found a median 8.7% increase in per-hectare profits from silvopasture compared with conventional grazing, which we applied to the average grazing value to obtain a net profit of US$6.82/ha. This does not reflect the very high revenues of silvopasture systems in some countries.

We calculated cost per t CO₂‑eq sequestered by dividing net net cost/ha by total CO₂‑eq sequestered/ha.

Table 2. Cost per unit of climate impact.

Unit: 2023 US$/t CO₂-eq

Median $43.25

100-yr basis & 20-yr basis are the same.

Left Text Column Width

Methods and Supporting Data

Learning Curve

There is not enough information available to determine a learning curve for silvopasture. However, anecdotal evidence showed establishment costs decreasing as techniques for broadscale mechanized establishment were developed in Australia and Colombia (Murguietio et al., 2016; Shelton et al., 2021).

Speed of Action

Speed of action refers to how quickly a climate solution physically affects the atmosphere after it is deployed. This is different from speed of deployment, which is the pace at which solutions are adopted.

At Project Drawdown, we define the speed of action for each climate solution as emergency brake, gradual, or delayed.

Deploy Silvopasture is a DELAYED climate solution. It works more slowly than gradual or emergency brake solutions. Delayed solutions can be robust climate solutions, but it’s important to recognize that they may not realize their full potential for some time.

Caveats

Permanence

Living biomass and soil organic matter only temporarily hold carbon (decades to centuries for soil organic matter, and for the life of the tree or any long-lived products made from its wood in the case of woody biomass). Sequestered carbon in both soils and biomass is vulnerable to fire, drought, long-term shifts to a drier precipitation regime, and other climate change impacts, as well as to a return to the previous farming or grazing practices. Such disturbances can cause carbon to be re-emitted to the atmosphere (Lorenz & Lal, 2018). 

Saturation

Like all upland, terrestrial agricultural systems, over the course of decades, silvopastures reach saturation and net sequestration slows to nearly nothing (Lorenz & Lal, 2018). 

Current Adoption

Lack of data on the current adoption of silvopasture is a major gap in our understanding of the potential of this solution. One satellite imaging study found 156 million ha of grazing land with more than 10 t C/ha in above-ground biomass, which is the amount that indicates more than grass alone (Chapman et al., 2019). However, this area includes natural savannas, which are not necessarily silvopastures, and undercounts the existing 15.1 million ha of silvopasture known to be present in Europe (den Herder et al., 2017).

Sprenkle-Hippolite et al. (2024) estimated a current adoption of 141.4 Mha, or 6.0% of grazing land (Table 3). We have chosen this more recent figure as the best available estimate of current adoption. Note that in Solution Basics in the dashboard above we set current adoption at zero. This is a conservative assumption to avoid counting carbon sequestration from land that has already ceased to sequester net carbon due to saturation, which takes place after 20–50 years (Lal et al., 2018).

Table 3. Current (2023) adoption level.

Unit: million ha

Mean 141.4
Left Text Column Width
Adoption Trend

There is little quantifiable information reported about silvopasture adoption trends.

Adoption Ceiling

Grazing is the world’s largest land use at 2,986 Mha (Mehrabi et al., 2024). Much grazing land is too dry for trees, while other grasslands that were not historically forest or savanna should not be planted with trees in order to minimize water use and protect grassland habitat (Dudley et al., 2020). Three studies estimated the total potential area suitable for silvopasture (including current adoption). 

Lal et al. (2018) estimated the technical potential for silvopasture adoption at 550 Mha.

Chapman et al. (2019) estimated the suitable area for increased woody biomass on grazing land as 1,890 Mha. 

Sprenkle-Hippolite (2024) assessed the maximum area of grazing land to which trees could be added without reducing livestock productivity. They calculated a total of 1,589 Mha, or 67% of global grazing land (Table 4). To our knowledge, this is the most accurate estimate available. 

Table 4. Adoption ceiling.

Unit: ha converted

25th percentile 1069000000
Mean 1343000000
Median (50th percentile) 1588000000
75th percentile 1739000000

Unit: % of grazing land

25th percentile 45
Mean 36
Median (50th percentile) 53
75th percentile 58
Left Text Column Width
Achievable Adoption

In our Achievable – High scenario, global silvopasture starts at 141.4 Mha and grows at the Colombian Nationally Determined Contribution growth rate of 6.5%/yr. This would provide the high end of the achievable potential at 206.3 Mha by 2030, of which 64.9 million ha are newly adopted (Table 5). For the Achievable – Low scenario, we chose 1/10 of Colombia’s projected growth rate. This would provide 147.0 Mha of adoption by 2030, of which 5.6 Mha are new.

Few estimates of the global adoption potential of silvopasture are available, and even those for the broader category of agroforestry are rare due to the lack of solid data on current adoption and growth rates (Shi et al., 2018; Hart et al., 2023). The IPCC estimates that, for agroforestry overall, 19.5% of the technical potential is economically achievable (IPCC AR6 WG3, 2022). Applying this rate to Sprenkle-Hippolite’s estimated 1,588 Mha technical potential yields an achievable potential of 310 Mha of convertible grazing land.

Our high adoption rate reaches 13% of the adoption ceiling by 2030. This suggests that silvopasture represents a large but relatively untapped potential that will require aggressive policy action and other incentives to spur scaling.

Table 5. Range of achievable adoption levels.

Unit: Mha

Current adoption 141.4
Achievable – low 147.0
Achievable – high 206.3
Adoption ceiling 1,588.0

Unit: Mha

Current adoption 0.00
Achievable – low 5.6
Achievable – high 64.9
Adoption ceiling 1,447.4
Left Text Column Width

Carbon sequestration continues only for a period of decades; because silvopasture is an ancient practice with some plantings centuries old, we could not assume that previously adopted hectares continue to sequester carbon indefinitely. Much of the current adoption of silvopasture has been in place for centuries and sequestration there has presumably already slowed down to almost zero. We apply an adoption adjustment factor of 0.25 to current adoption (see Methodology) to reflect that most current adoption is no longer sequestering significant carbon, yet there is substantial new adoption within the past 20–50 years.

For new adoption the calculation is effectiveness * new adoption = climate impact.

For current adoption the calculation is effectiveness * 0.25 * current adoption = climate impact

Climate impacts shown in Table 6 are the sum of current and new adoption impacts. Carbon sequestration impact is 0.35 Gt CO₂‑eq/yr for current adoption, 0.40 Gt CO₂‑eq/yr for Achievable – Low, 0.98 Gt CO₂‑eq/yr for Achievable – High, and 14.54 Gt CO₂‑eq/yr for our Adoption Ceiling. 

Table 6. Climate impact at different levels of adoption.

Unit: Gt CO₂‑eq/yr

Current adoption 0.35
Achievable – low 0.40
Achievable – high 0.98
Adoption ceiling 14.54

100-yr basis, New adoption only 

Left Text Column Width

Lal et al. (2018) estimated a technical global carbon sequestration potential of 0.3–1.0 Gt CO₂‑eq/yr. Sprenkle-Hyppolite et al. (2024) estimated a silvopasture technical potential of 1.4 Gt CO₂‑eq/yr ; this assumes a tree density of 2–6 trees/ha, which is substantially lower than typical silvopasture. For agroforestry overall (including silvopasture and other practices), the IPCC (2022) estimates an achievable potential of 0.8 Gt CO₂‑eq/yr and a technical potential of 4.0 Gt CO₂‑eq/yr.

Additional Benefits

Income and Work 

Silvopasture can also increase and diversify farmer income. Tree fruit and timber often provide income for ranchers. A study in the southern United States showed that silvopasture systems generated 10% more income than standalone cattle production (Husak & Grado, 2002). A more comprehensive analysis across the eastern United States (Greene et al., 2023) found that virtually all silvopasture systems assessed had a positive 20- and 30-yr internal rate of return (IRR). For some systems, the 30-yr IRR can be >15% (Greene et al., 2023).

Food Security

While evidence on the impact of silvopasture on yields is mixed, this practice can improve food security by diversifying food production and income sources (Bostedt et al., 2016; Smith et al., 2022). In pastoralists in Kenya, Bostedt et al. (2016) found that agroforestry practices were associated with increased dietary diversity, an important aspect of food and nutrition security. Diverse income streams can mediate household food security during adverse conditions, such as droughts or floods, especially in low- and middle-income countries (de Sherbinin et al., 2008; Di Prima et al., 2022; Frelat et al., 2016). 

Nature Protection

Trees boost habitat availability, enhance landscape connectivity, and aid in forest regeneration and restoration. In most climates they provide a major boost to biodiversity compared with pasture alone (Smith et al., 2022; Pezo et al., 2018). 

Animal Well-being

By providing shade, silvopasture systems reduce heat stress experienced by livestock. Heat stress for cattle begins at 30 °C or even lower in some circumstances (Garrett et al., 2004). In the tropics, the cooling effect of integrating trees into a pastoral system is 0.32–2.4 °C/t of woody carbon added/ha (Zeppetello et al., 2022). Heifers raised in silvopasture systems had higher body mass and more optimal body temperature than those raised in intensive rotational grazing systems (Lemes et al., 2021). Improvement in livestock physiological conditions probably results from access to additional forage, increased livestock comfort, and reduced heat stress in silvopastoral systems. Silvopasture is highly desirable for its improvements to animal welfare (Goracci & Camilli, 2024).

Land Resources

Silvopasture and agroforestry are important for ensuring soil health (Basche et al., 2020). These practices improve soil health by reducing erosion and may also contribute to soil organic matter retention (U.S. Department of Agriculture Natural Resource Conservation Service ([USDA NRCS], 2025). There is evidence that silvopasture may improve soil biodiversity by preventing soil organism habitat loss and degradation (USDA NRCS, 2025).

Water Quality

Perennials in silvopasture systems could reduce runoff and increase water infiltration rates relative to open rangelands (Smith et al., 2022; Pezo et al., 2018). This increases the resilience of the system during drought and high heat. Silvopasture can improve water quality by retaining soil sediments and filtering pollutants found in runoff (USDA NRCS, 2025). On average, silvopasture and agroforestry practices can reduce runoff of sediments and excess nutrients into water 42–47% (Zhu et al., 2020). The filtering benefits of silvopasture can also mitigate pollution of antibiotics from livestock operations from entering waterways (Moreno & Rolo, 2019). 

Risks

Some of the tree and forage species used in silvopastures are invasive in certain contexts. For example, river tamarind (Leucaena leucocephala) is a centerpiece in intensive silvopasture in Latin America, where it is native, but also in Australia, where it is not. Australian producers have developed practices to limit or prevent its spread (Shelton et al., 2021).

Livestock can damage or kill young trees during establishment. Protecting trees or excluding grazing animals during this period increases costs (Smith et al., 2022).

Poorly designed tree layout can make herding, haying, fencing, and other management activities more difficult. Tree densities that are too high can reduce livestock productivity (Cadavid et al., 2020).

Interactions with Other Solutions

Reinforcing

Silvopasture represents a way to produce some ruminant meat and dairy in a more climate-friendly way. This impact can contribute to addressing emissions from ruminant production, but only as part of a program that strongly emphasizes diet change and food waste reduction.

Forms of silvopasture that increase milk and meat yields can reduce pressure to convert undeveloped land to agriculture.

Silvopasture is a technique for restoring farmland.

Silvopasture is a form of savanna restoration.

Competing

Expanding silvopasture could restrict land availability for renewable energy or raw material and food production, since many technologies and practices could be sited on grazing lands. Silvopasture and forest restoration can also compete for the same land.

Silvopasture is a kind of agroforestry, though in this iteration of Project Drawdown “Deploy Agroforestry” refers to crop production systems only. With that said, some agroforestry systems integrate both crops and livestock with the trees, such as the widespread parkland systems of the African Sahel.

Dashboard

Solution Basics

ha converted from grazing land to silvopasture

t CO₂-eq (100-yr)/unit/yr
04.919.81median
units
Current 1.414×10⁸ 01.47×10⁸2.063×10⁸
Achievable (Low to High)

Climate Impact

Gt CO₂-eq (100-yr)/yr
Current 0.35 0.40.98
US$ per t CO₂-eq
43
Delayed

CO₂

Trade-offs

Solutions that improve ruminant production could undermine the argument for reducing ruminant protein consumption in wealthy countries. 

Certain silvopasture systems reduce per-hectare productivity of meat and milk, even if overall productivity increases when the yields of timber or food from the tree component are included. For example, silvopasture systems that are primarily focused on timber production, with high tree densities, will have lower livestock yields than pasture alone - though they will have high timber yields.

The costs of establishment are much higher than those of managed grazing. There is also a longer payback period (Smith et al., 2022). These limitations mean that secure land tenure is even more important than usual, to make adoption worthwhile (Poudel et al., 2024).

Maps Introduction

Silvopasture is primarily appropriate for grazing land that receives sufficient rainfall to support tree growth. While it can be implemented on both cropland and grassland, if adopted on cropland, it will reduce food yield because livestock produce much less food per hectare than crops. In the humid tropics, a particularly productive and high-carbon variation called intensive silvopasture is an option. Ideally, graziers will have secure land tenure, though pastoralist commons have been used successfully.

Areas too dry to establish trees (<450 mm annual precipitation) are not suitable for silvopasture by tree planting, but regions that can support natural savanna may be suitable for managed natural regeneration.

Most silvopasture today appears in sub-Saharan Africa (Chapman et al., 2019), though this may reflect grazed natural savannas rather than intentional silvopasture. This finding neglects well-known systems in Latin America and Southern Europe. 

Chapman et al. (2019) listed world grasslands by their potential to add woody biomass. According to their analysis, the countries with the greatest potential to increase woody biomass carbon in grazing land are, in order: Australia, Kazakhstan, China, the United States, Mongolia, Iran, Argentina, South Africa, Sudan, Afghanistan, Russia, and Mexico. Tropical grazing land accounts for 73% of the potential in one study. Brazil, China, and Australia have the highest areas, collectively accounting for 37% of the potential area (Sprenkle-Hippolite 2024).

We do not present any maps for the silvopasture solution due to the uncertainties in identifying current areas where silvopasture is practiced, and in identifying current grasslands that were historically forest or savanna. 

Action Word
Deploy
Solution Title
Silvopasture
Classification
Highly Recommended

Lawmakers and Policymakers

  • Lower the risk for farmers transitioning from other pastoral systems.
  • Increase understanding of silvopasture.
  • Reduce technical and bureaucratic complexity.
  • Establish or expand technical assistance programs.
  • Simplify incentive programs.
  • Ensure an appropriate and adequate selection of tree species are eligible for incentives.
  • Establish a silvopasture certification program.
  • Create demonstration farms.
  • Strengthen land tenure laws.
  • Incentivize lease structures to facilitate silvopasture transitions on rented land.

Practitioners

  • Seek support from technical assistance programs and extension services.
  • Seek out networks of adopters to share information, resources, best practices, and collective marketing.
  • If available, leverage incentive programs such as subsidies, tax rebates, grants, and carbon credits.
  • Negotiate new lease agreements to accommodate silvopasture techniques or advocate for public incentives to reform lease structures.

Business Leaders

  • Prioritize suppliers and source from farmers who use silvopasture.
  • Provide innovative financial mechanisms to encourage adoption.
  • Participate in and help create high-quality carbon credit programs.
  • Incentivize silvopasture transitions in lease agreements.
  • Support the creation of a certification system to increase the marketability of silvopasture products.
  • Join coalitions with other purchasers to grow demand.
  • Collaborate with public and private agricultural organizations on education and training programs. 

Nonprofit Leaders

  • Educate farmers and those who work in the food industry about the benefits of silvopasture.
  • Communicate any government incentives for farmers to transition to silvopasture.
  • Explain how to take advantage of incentives.
  • Provide training material and/or work with extension services to support farmers transitioning to silvopasture, such as administering certification programs.
  • Advocate to policymakers for improved incentives for farmers, stronger land tenure laws, and flexible lease agreements.

Investors

  • Use capital like low-interest or favorable loans to support farmers and farmer cooperatives exploring silvopasture projects.
  • Invest in credible, high-quality carbon reduction silvopasture projects.
  • Invest in silvopasture products (e.g., fruits, berries, and other tree products)
  • Encourage favorable lease agreements between landowners or offer favorable costs and benefit-sharing structures.
  • Consider banking through community development financial institutions or other institutions that support farmers. 

Philanthropists and International Aid Agencies

  • Provide grants and loans for establishing silvopasture and support farmland restoration projects that include silvopasture.
  • Support capacity-building, market access, education, and training opportunities for smallholder farmers – especially those historically underserved – through activities like farmer cooperatives, demonstration farms, and communal tree nurseries.
  • Consider banking through Community Development Financial Institutions or other institutions that support farmers. 

Thought Leaders

  • Use your platform to build awareness of silvopasture and its benefits, incentive programs, and regulatory standards.
  • Provide technical information to practitioners.
  • Host community dialogues such as Edible Connections to engage the public about silvopasture and other climate-friendly farming practices.

Technologists and Researchers

  • Improve the affordability and equipment needed to plant and manage trees.
  • Refine satellite tools to improve silvopasture detection.
  • Develop ways to monitor changes in soil and biomass.
  • Standardize data collection protocols.
  • Create a framework for transparent reporting and reliable verification.
  • Fill gaps in data, such as quantifying the global adoption potential of silvopasture and regional analysis of revenue and operating costs/hectare. 

Communities, Households, and Individuals

  • Purchase silvopasture products and support farmers who use the practice.
  • Request silvopasture products at local markets.
  • Encourage policymakers to help farmers transition.
  • Encourage livestock farmers to adopt the practice.
  • Host community dialogues such as Edible Connections to engage the public about silvopasture and other climate-friendly farming practices.
Evidence Base

Consensus of effectiveness in sequestering carbon: Mixed to High 

There is a high level of consensus about the carbon biosequestration impacts of silvopasture, including for the higher per-hectare sequestration rates relative to improved grazing systems alone. A handful of reviews, expert estimations, and meta-analyses have been published on the subject. These include:

Cardinael et al. (2018) assembled data by climate and region for use in the national calculations and reporting. 

Chatterjee et al. (2018) found that converting from pasture to silvopasture increases carbon stocks. 

Lal et al. ( 2018) estimated the technical adoption and mitigation potential of silvopasture and other practices.

Udawatta et al. (2022) provided an up-to-date meta-analysis for temperate North America. 

The results presented in this document summarize findings from two reviews, two meta-analyses, one expert opinion and three original studies reflecting current evidence from a global scale. We recognize this limited geographic scope creates bias, and hope this work inspires research and data sharing on this topic in underrepresented regions.

Consensus regarding other climate impacts: Low

There is low consensus on the reduction of methane from enteric emissions, nitrous oxide from manure, and CO₂ from avoided deforestation due to increased productivity. We do not include these climate impacts in our calculations.

Consensus regarding adoption potential: Low

Until recently there was little understanding of the current adoption of silvopasture. Sprenkle-Hyppolite et al. (2024) used Delphi expert estimation to determine current adoption and technical potential. Rates of adoption and achievable potential are still largely unreported or uninvestigated. See the Adoption section for details.

Updated Date
Coming Soon Label
Coming Soon

Protect Seaweed Ecosystems

Image
Image
Seaweed
Coming Soon
Off
Summary

Seaweed ecosystem protection is the long-term protection from degradation of wild subtidal brown and red seaweed ecosystems. Seaweeds, also called macroalgae, are photosynthetic marine organisms that absorb CO₂ from the water and convert it into biomass. This can lower surface-water CO₂ concentrations, allowing additional CO₂ from the atmosphere to be dissolved in the ocean. Some of the fixed carbon can be sequestered through export to the deep sea or burial in the seafloor, while a portion may persist in forms that resist degradation even at the ocean surface. 

Protecting seaweed ecosystems can reduce a range of human impacts (wild harvesting, coastal development, overgrazing, and poor water quality) and improve resilience to other stressors (warming), which helps preserve carbon removal by the seaweed and avoid CO₂ emissions from biomass losses. 

This solution focuses on legal mechanisms of protection through the establishment of Marine Protected Areas (MPAs), which are managed with the primary goal of conserving nature. This solution does not include cultivated seaweed (see Deploy Seaweed Farming for Food).

Description for Social and Search
Protecting seaweed ecosystems is a Highly Recommended climate solution. It can likely deliver globally relevant levels of climate impact while providing additional benefits for humans and ecosystems.
Overview

Seaweeds are diverse marine photosynthetic organisms composed of three groups: brown (Phaeophyceae), green (Chlorophyta), and red algae (Rhodophyta). They can form ecosystems, such as kelp forests, and contribute to other marine ecosystems by providing habitat and food. Seaweeds are distinguished from other algae, such as phytoplankton, based on their larger size and because most are attached to substrate rather than free-floating. Seaweeds cover an estimated 600 Mha of the ocean (Duarte et al., 2022), an area that is an order of magnitude greater than the area associated with coastal wetlands (~55 Mha, see Protect Coastal Wetlands). 

This solution focuses on wild subtidal (always submerged) brown and red seaweed ecosystems, which together account for over 75% of global seaweed extent (Duarte et al., 2022) (Figure 1). We do not include green seaweeds due to their smaller extent and data limitations. We also do not include seaweeds that occur in intertidal zones, as free-floating colonies (e.g., some species of Sargassum) or are cultivated due to data limitations or coverage in other Explorer solutions (e.g., Deploy Seaweed Farming for Food).

Figure 1. Seaweed ecosystem types considered in this solution (left to right): subtidal brown (central California, USA) and subtidal red (Atlantic coast of Spain)

Image
Two photos demonstrating seaweed ecosystem types. Left: subtidal brown. Right: subtidal red.

fdastudillo | iStock; Damocean | iStock

Seaweed ecosystems exhibit high net primary productivity (NPP) rates, comparable to those of terrestrial forests (Filbee-Dexter, 2020). Unlike many terrestrial ecosystems, however, nearly all carbon storage in seaweed ecosystems occurs as above-ground biomass, since seaweeds lack below-ground roots. A smaller amount can be buried on site in sediment (Krause-Jensen & Duarte, 2016). Most long-term carbon storage attributable to seaweeds occurs largely outside of seaweed ecosystems, through the export of carbon in dissolved and suspended forms (Figure 2). Some of this carbon reaches the deep sea, where it can persist for more than 100 years (Krause-Jensen & Duarte, 2016; Krause-Jensen et al., 2018; Ortega et al., 2019). Roughly 11.4% (25th quartile, 6.0%; 75th quartile, 13.7%) of NPP from global seaweed ecosystems is estimated to contribute to long-term carbon storage in the deep sea, equivalent to as much as 0.62 Gt CO₂‑eq/yr (173 Tg C/yr, Krause-Jensen & Duarte, 2016). While uncertain and requiring more research, recent modeling efforts support these estimates, suggesting that more than 12.5% of NPP may be removed on 100-yr timescales (Filbee-Dexter et al., 2024b).

Figure 2. Overview of a seaweed ecosystem showing carbon fluxes into and out of the ecosystem (g=gaseous, aq=aqueous) that can result in carbon removal. Some carbon is exported to the shallow sea, where it may be recycled or persist for longer periods depending on its form, some is exported to the deep sea (~1000 m), and some is buried in seafloor sediments. 

Image
diagram illustration of seaweed ecosystem, showing carbon fluxes into and out of the ecosystem

Adapted from: Hurd, C. L., Gattuso, J.-P., & Boyd, P. W. (2024). Air-sea carbon dioxide equilibrium: Will it be possible to use seaweeds for carbon removal offsets? Journal of Phycology, 60(1), 4–14. 

Seaweed ecosystems face growing threats from a range of climate change impacts (Harley et al., 2012), such as increasing sea surface temperatures, marine heat waves, ocean acidification, and extreme storm events, as well as local drivers, such as overfishing, overgrazing, pollution, disease outbreaks, invasive species, and bottom fishing (Corrigan et al., 2025; Filbee-Dexter et al., 2024a; Hanley et al., 2024). For instance, overfishing can deplete top predators in ecosystems, leading to increases in herbivores, such as sea urchins, that overgraze seaweed (Steneck et al., 2002). 

In this solution, we calculate how legal protection of seaweed ecosystems via MPAs can reduce CO₂ emissions and preserve carbon removal through avoided ecosystem loss. In addition to preventing direct losses from impacts such as wild harvest, MPAs can help restore predator populations that keep herbivores in balance. For instance, many MPAs include no-take zones that allow predatory fish populations to recover, thereby lessening overgrazing impacts over time. MPAs can also increase the resilience of seaweed ecosystems against climate change stressors, such as marine heat waves (Kumagai et al., 2024; Ortiz-Villa et al., 2025). While some seaweed can release methane, offsetting CO₂ removal (Roth et al., 2023), we exclude this process from our analysis due to existing data limitations. We also do not consider nitrous oxide, though protection might provide additional climate benefits because enhanced nitrous oxide production has been tied to nutrient-polluted seaweed systems (Wong et al., 2021). 

We present estimates of climate impact as likely upper bounds under several key assumptions (see Appendix and Caveats), which can be improved upon as more research unfolds. We consider subtidal brown and red seaweed to be protected if they are within designated MPAs based on global datasets from the United Nations Environment Programme World Conservation Monitoring Centre (UNEP-WCMC) and the International Union for Conservation of Nature and Natural Resources (IUCN) (2024). Importantly, protection can help reduce – but will not eliminate – ecosystem loss in MPAs relative to unprotected areas (see Effectiveness). 

References

Akaike, S., & Mizuta, H. (2024). Optimizing the biomass balance of macroalgae and sea urchins in kelp beds by removing the urchins. European Journal of Phycology, 59(2), 218–231. Link to source: https://doi.org/10.1080/09670262.2024.2306397

Balmford, A., Gravestock, P., Hockley, N., McClean, C. J. and Roberts, C. M. (2004). The worldwide costs of marine protected areas. Proceedings of the National Academy of Sciences, 101(26), 9694–9697. Link to source: https://doi.org/10.1073/pnas.0403239101

Bauer, J., Beas-Luna, R., Malpica-Cruz, L., Abadía-Cardoso, A., Filz, P., Bonilla, J. C., & Lorda, J. (2025). Community-led management maintains higher predator biomass supporting kelp forests persistence in Baja California. Scientific Reports, 15(1), Article 23253. Link to source: https://doi.org/10.1038/s41598-025-86140-6

Best, R. J., Chaudoin, A. L., Bracken, M. E. S., Graham, M. H., & Stachowicz, J. J. (2014). Plant–animal diversity relationships in a rocky intertidal system depend on invertebrate body size and algal cover. Ecology, 95(5), 1308–1322. Link to source: https://doi.org/10.1890/13-1480.1

Corrigan, S., Cottier-Cook, E. J., Lim, P. E., & Brodie, J. (2025). The state of the world’s seaweeds 2025 [Data set]. Natural History Museum. Link to source: https://doi.org/10.5519/4ln9oqk7

Cotas, J., Gomes, L., Pacheco, D., & Pereira, L. (2023). Ecosystem services provided by seaweeds. Hydrobiology, 2(1), 75–96. Link to source: https://doi.org/10.3390/hydrobiology2010006

Cottier-Cook, E. J., Lim, P. E., Mallinson, S., Yahya, N., Poong, S. W., Wilbraham, J., Nagabhatla, N., & Brodie, J. (2023). Striking a balance: Wild stock protection and the future of our seaweed industries [Policy brief]. United Nations University Institute on Comparative Regional Integration Studies. Link to source: https://cris.unu.edu/sites/cris.unu.edu/files/UNU-CRIS_Policy-Brief_CottierCook_Et.al_23.06.pdf

Cuba, D., Guardia-Luzon, K., Cevallos, B., Ramos-Larico, S., Neira, E., Pons, A., & Avila-Peltroche, J. (2022). Ecosystem services provided by kelp forests of the Humboldt current system: A comprehensive review. Coasts, 2(4), 259–277. Link to source: https://doi.org/10.3390/coasts2040013

Duarte, C. M., Gattuso, J. P., Hancke, K., Gundersen, H., Filbee-Dexter, K., Pedersen, M. F., Middelburg, J. J., Burrows, M. T., Krumhansl, K. A., Wernberg, T., Moore P., Pessarrodona, A., Ørberg, S. B., Pinto, I. S., Assis, J., Queirós, A. M., Smale, D. A., Bekkby, T., Serrão, E. A., & Krause-Jensen, D. (2022). Global estimates of the extent and production of macroalgal forests. Global Ecology and Biogeography, 31(7), 1422–1439. Link to source: https://doi.org/10.1111/geb.13515

Earp, H. S., Smale, D. A., Almond, P. M., Catherall, H. J. N., Gouraguine, A., Wilding, C., & Moore, P. J. (2024). Temporal variation in the structure, abundance, and composition of Laminaria hyperborea forests and their associated understorey assemblages over an intense storm season. Marine Environmental Research, 200, Article 106652. Link to source: https://doi.org/10.1016/j.marenvres.2024.106652

Eger, A. M., Eddy, N., McHugh, T. A., Arafeh-Dalmau, N., Wernberg, T., Krumhansl, K., Verbeek, J., Branigan, S., Kuwae, T., Caselle, J. E., Ospina, A. G., & Vergés, A. (2024). State of the world’s kelp forests. One Earth, 7(11), 1927–1931. Link to source: https://doi.org/10.1016/j.oneear.2024.10.008

Eger, A. M., Marzinelli, E. M., Christie, H., Fagerli, C. W., Fujita, D., Gonzalez, A. P., Hong, S. W., Kim, J. H., Lee, L. C., McHugh, T. A., Nishihara, G. N., Tatsumi, M., Steinberg, P. D., & Vergés, A. (2022). Global kelp forest restoration: Past lessons, present status, and future directions. Biological Reviews, 97(4), 1449–1475. Link to source: https://doi.org/10.1111/brv.12850

Eger, A. M., Marzinelli, E. M., Beas-Luna, R., Blain, C. O., Blamey, L. K., Byrnes, J. E. K., Carnell, P. E., Choi, C. G., Hessing-Lewis, M., Kim, K. Y., Kumagai, N. H., Lorda, J., Moore, P., Nakamura, Y., Pérez-Matus, A., Pontier, O., Smale, D., Steinberg, P. D., & Vergés, A. (2023). The value of ecosystem services in global marine kelp forests. Nature Communications, 14(1), Article 1894. Link to source: https://doi.org/10.1038/s41467-023-37385-0

Elsmore, K., Nickols, K. J., Miller, L. P., Ford, T., Denny, M. W., & Gaylord, B. (2024). Wave damping by giant kelp, Macrocystis pyrifera. Annals of Botany, 133(1), 29–40. Link to source: https://doi.org/10.1093/aob/mcad094

Food and Agriculture Organization of the United Nations. (2024). The state of world fisheries and aquaculture 2024: Blue transformation in action [Report]. Link to source: https://doi.org/10.4060/cd0683en

Filbee-Dexter, K. (2020). Ocean forests hold unique solutions to our current environmental crisis. One Earth, 2(5), 398–401. Link to source: https://doi.org/10.1016/j.oneear.2020.05.004

Filbee-Dexter, K., & Wernberg, T. (2020). Substantial blue carbon in overlooked Australian kelp forests. Scientific Reports, 10, Article 12341. Link to source: https://doi.org/10.1038/s41598-020-69258-7

Filbee-Dexter, K., Feehan, C. J., Smale, D. A., Krumhansl, K. A., Augustine, S., de Bettignies, F., Burrows, M. T., Byrnes, J. E. K., Campbell, J., Davoult, D., Dunton, K. H., Franco, J. N., Garrido, I., Grace, S. P., Hancke, K., Johnson, L. E., Konar, B., Moore, P. J., Norderhaug, K. M., … Wernberg, T. (2022). Kelp carbon sink potential decreases with warming due to accelerating decomposition. PLOS Biology, 20(8), Article e3001702. Link to source: https://doi.org/10.1371/journal.pbio.3001702

Filbee‐Dexter, K., Starko, S., Pessarrodona, A., Wood, G., Norderhaug, K. M., Piñeiro‐Corbeira, C., & Wernberg, T. (2024a). Marine protected areas can be useful but are not a silver bullet for kelp conservation. Journal of Phycology, 60(2), 203–213. Link to source: https://doi.org/10.1111/jpy.13446

Filbee-Dexter, K., Pessarrodona, A., Pedersen, M. F., Wernberg, T., Duarte, C. M., Assis, J., Bekkby, T., Burrows, M. T., Carlson, D. F., Gattuso, J.-P., Gundersen, H., Hancke, K., Krumhansl, K. A., Kuwae, T., Middelburg, J. J., Moore, P. J., Queirós, A. M., Smale, D. A., Sousa-Pinto, I., … Krause-Jensen, D. (2024b). Carbon export from seaweed forests to deep ocean sinks. Nature Geoscience, 17(6), 552–559. Link to source: https://doi.org/10.1038/s41561-024-01449-7

Gao, G., Gao, L., Jiang, M., Jian, A., & He, L. (2022). The potential of seaweed cultivation to achieve carbon neutrality and mitigate deoxygenation and eutrophication. Environmental Research Letters, 17(1), Article 014018. Link to source: https://doi.org/10.1088/1748-9326/ac3fd9

Gibbons, E. G., & Quijón, P. A. (2023). Macroalgal features and their influence on associated biodiversity: Implications for conservation and restoration. Frontiers in Marine Science, 10, Article 1304000. Link to source: https://doi.org/10.3389/fmars.2023.1304000

González-Roca, F., Gelcich, S., Pérez-Ruzafa, Á., Vega, J. M. A., & Vásquez, J. A. (2021). Exploring the role of access regimes over an economically important intertidal kelp species. Ocean & Coastal Management, 212, Article 105811. Link to source: https://doi.org/10.1016/j.ocecoaman.2021.105811

Hanley, M. E., Firth, L. B., & Foggo, A. (2024). Victim of changes? Marine macroalgae in a changing world. Annals of Botany, 133(1), 1–16. Link to source: https://doi.org/10.1093/aob/mcad185

Harley, C. D. G., Anderson, K. M., Demes, K. W., Jorve, J. P., Kordas, R. L., Coyle, T. A., & Graham, M. H. (2012). Effects of climate change on global seaweed communities. Journal of Phycology, 48(5), 1064–1078. Link to source: https://doi.org/10.1111/j.1529-8817.2012.01224.x

Heckwolf, M. J., Peterson, A., Jänes, H., Horne, P., Künne, J., Liversage, K., Sajeva, M., Reusch, T. B. H., & Kotta, J. (2021). From ecosystems to socio-economic benefits: A systematic review of coastal ecosystem services in the Baltic Sea. Science of the Total Environment, 755, Article 142565. Link to source: https://doi.org/10.1016/j.scitotenv.2020.142565

Hurd, C. L., Gattuso, J.-P., & Boyd, P. W. (2024). Air-sea carbon dioxide equilibrium: Will it be possible to use seaweeds for carbon removal offsets? Journal of Phycology, 60(1), 4–14. Link to source: https://doi.org/10.1111/jpy.13405

Kelp Forest Alliance. (2024). State of the world’s kelp report [Report]. Link to source: https://kelpforestalliance.com/state-of-the-worlds-kelp-report/

Krause-Jensen, D., & Duarte, C. M. (2016). Substantial role of macroalgae in marine carbon sequestration. Nature Geoscience, 9(10), 737–742. Link to source: https://doi.org/10.1038/ngeo2790

Krause-Jensen, D., Lavery, P., Serrano, O., Marbà, N., Masque, P., & Duarte, C. M. (2018). Sequestration of macroalgal carbon: The elephant in the blue carbon room. Biology Letters, 14(6), Article 20180236. Link to source: https://doi.org/10.1098/rsbl.2018.0236

Krumhansl, K. A., Okamoto, D. K., Rassweiler, A., Novak, M., Bolton, J. J., Cavanaugh, K. C., Connell, S. D., Johnson, C. R., Konar, B., Ling, S. D., Micheli, F., Norderhaug, K. M., Pérez-Matus, A., Sousa-Pinto, I., Reed, D. C., Salomon, A. K., Shears, N. T., Wernberg, T., Anderson, R. J., … Byrnes, J. E. K. (2016). Global patterns of kelp forest change over the past half-century. Proceedings of the National Academy of Sciences, 113(48), 13785–13790. Link to source: https://doi.org/10.1073/pnas.1606102113

Kumagai, J. A., Goodman, M. C., Villaseñor-Derbez, J. C., Schoeman, D. S., Cavanuagh, K. C., Bell, T. W., Micheli, F., De Leo, G., & Arafeh-Dalmau, N. (2024). Marine protected areas that preserve trophic cascades promote resilience of kelp forests to marine heatwaves. Global Change Biology, 30(12), Article e17620. Link to source: https://doi.org/10.1111/gcb.17620

Lindhart, M., Daly, M. A., Walker, H., Arzeno-Soltero, I. B., Yin, J. Z., Bell, T. W., Monismith, S. G., Pawlak, G., & Leichter, J. J. (2024). Short wave attenuation by a kelp forest canopy. Limnology and Oceanography Letters, 9(4), 478–486. Link to source: https://doi.org/10.1002/lol2.10401

McCrea-Strub, A., Zeller, D., Rashid Sumaila, U., Nelson, J., Balmford, A., & Pauly, D. (2011). Understanding the cost of establishing marine protected areas. Marine Policy, 35(1), 1–9. Link to source: https://doi.org/10.1016/j.marpol.2010.07.001

Ortega, A., Geraldi, N. R., Alam, I., Kamau, A. A., Acinas, S. G., Logares, R., Gasol, J. M., Massana, R., Krause-Jensen, D., & Duarte, C. M. (2019). Important contribution of macroalgae to oceanic carbon sequestration. Nature Geoscience, 12(9), 748–754. Link to source: https://doi.org/10.1038/s41561-019-0421-8

Ortiz‐Villa, E. M., Rassweiler, A., Caselle, J. E., Cavanaugh, K. C., Arafeh‐Dalmau, N., Bell, T. W., & Cavanaugh, K. C. (2025). Marine protected areas enhance climate resilience to severe marine heatwaves for kelp forests. Journal of Applied Ecology, 62(9), 2439–2453. Link to source: https://doi.org/10.1111/1365-2664.70112

Pessarrodona, A., Franco-Santos, R. M., Wright, L. S., Vanderklift, M. A., Howard, J., Pidgeon, E., Wernberg, T., & Filbee-Dexter, K. (2023). Carbon sequestration and climate change mitigation using macroalgae: A state of knowledge review. Biological Reviews, 98(6), 1945–1971.  Link to source: https://doi.org/10.1111/brv.12990

Rodríguez-Rodríguez, D., & Martínez-Vega, J. (2022). Chapter three—Ecological effectiveness of marine protected areas across the globe in the scientific literature. In C. Sheppard (Ed.), Advances in marine biology (Vol. 92, pp. 129–153). Academic Press. Link to source: https://doi.org/10.1016/bs.amb.2022.07.002

Roth, F., Broman, E., Sun, X., Bonaglia, S., Nascimento, F., Prytherch, J., Brüchert, V., Lundevall Zara, M., Brunberg, M., Geibel, M. C., Humborg, C., & Norkko, A. (2023). Methane emissions offset atmospheric carbon dioxide uptake in coastal macroalgae, mixed vegetation and sediment ecosystems. Nature Communications, 14(1), Article 42. Link to source: https://doi.org/10.1038/s41467-022-35673-9

Steen, H., Moy, F. E., Bodvin, T., & Husa, V. (2016). Regrowth after kelp harvesting in Nord-Trøndelag, Norway. ICES Journal of Marine Science, 73(10), 2708–2720. Link to source: https://doi.org/10.1093/icesjms/fsw130

Steneck, R. S., Graham, M. H., Bourque, B. J., Corbett, D., Erlandson, J. M., Estes, J. A., & Tegner, M. J. (2002). Kelp forest ecosystems: Biodiversity, stability, resilience and future. Environmental Conservation, 29(4), 436–459. Link to source: https://doi.org/10.1017/S0376892902000322

Tano, S., Eggertsen, M., Wikström, S. A., Berkström, C., Buriyo, A. S., & Halling, C. (2016). Tropical seaweed beds are important habitats for mobile invertebrate epifauna. Estuarine, Coastal and Shelf Science, 183, 1–12. Link to source: https://doi.org/10.1016/j.ecss.2016.10.010

Thurstan, R. H., Brittain, Z., Jones, D. S., Cameron, E., Dearnaley, J., & Bellgrove, A. (2018). Aboriginal uses of seaweeds in temperate Australia: An archival assessment. Journal of Applied Phycology, 30(3), 1821–1832. Link to source: https://doi.org/10.1007/s10811-017-1384-z

United Nations Environment Programme World Conservation Monitoring Centre, & International Union for Conservation of Nature. (2024). Protected planet: The world database on protected areas (WDPA) and world database on other effective area-based conservation measures (WD-OECM) [Data set]. Retrieved April 2024, from Link to source: https://www.protectedplanet.net

United Nations Environment Programme. (2023). Into the blue: Securing a sustainable future for kelp forests [Report]. Link to source: https://wedocs.unep.org/handle/20.500.11822/42331

Waldron, A., Adams, V., Allan, J., Arnell, A., Asner, G., Atkinson, S., Baccini, A., Baillie, J. E. M., Balmford, A., Beau, J. A., Brander, L., Brondizio, E., Bruner, A., Burgess, N., Burkart, K., Butchart, S., Button, R., Carraso, R., Cheung, W., … Zhang, Y. P. (2020). Protecting 30% of the planet for nature: Costs, benefits and economic implications [Report]. Campaign for Nature. Link to source: https://www.conservation.cam.ac.uk/files/waldron_report_30_by_30_publish.pdf

Wong, W. W., Greening, C., Shelley, G., Lappan, R., Leung, P. M., Kessler, A., Winfrey, B., Poh, S. C., & Cook, P. (2021). Effects of drift algae accumulation and nitrate loading on nitrogen cycling in a eutrophic coastal sediment. Science of The Total Environment, 790, Article 147749. Link to source: https://doi.org/10.1016/j.scitotenv.2021.147749

Credits

Lead Fellow

  • Christina Richardson, Ph.D.

Contributors

  • Ruthie Burrows, Ph.D.

  • Avery Driscoll, Ph.D.

  • James Gerber, Ph.D.

  • Daniel Jasper

  • Alex Sweeney

Internal Reviewers

  • Aiyana Bodi

  • Avery Driscoll, Ph.D.

  • Christina Swanson, Ph.D.

  • Paul C. West, Ph.D.

Effectiveness

The globally weighted average effectiveness of seaweed ecosystem protection is 0.32 tCO₂‑eq /ha/yr. Protecting 1 ha of seaweed ecosystem avoids emissions of 0.043–0.13 tCO₂‑eq /ha/yr while also sequestering an additional 0.083–0.43 tCO₂‑eq /ha/yr, with effectiveness higher in subtidal brown than subtidal red seaweed ecosystems (100-yr GWP; Table 1; Appendix).

We estimated effectiveness as the avoided emissions and retained carbon sequestration capacity attributable to the reduction in seaweed ecosystem loss conferred by protection, as detailed in Equation 1. First, we calculated the difference between the rate of seaweed ecosystem loss outside and inside MPAs (Seaweed lossbaseline). We assumed a reduction in loss of 53% (Reduction in loss), which is based on estimates for a range of ecosystems in MPAs (Rodríguez-Rodríguez & Martínez-Vega, 2022). Importantly, this number is highly uncertain and likely to be highly variable, too. 

Next, we multiplied this product by the sum of the avoided CO₂ emissions associated with the one-time loss of all above ground biomass carbon in 1 ha of seaweed ecosystem each year over 30 years (Carbonavoided emissions) and the amount of carbon sequestered via long-term storage (on-site or off-site) in 1 ha of protected seaweed ecosystem each year over 30 years (Carbonsequestration). 

We based these rates on original analysis of a subset of studies conducted over, at least, 20 years, collated from Krumhansl et al. (2016), that show a median loss rate of 1.2% per year for kelp forests. Due to data limitations, we applied this loss rate to subtidal red seaweed ecosystems as well, but recognize that loss rates are likely to be highly variable. We did this calculation separately for red and brown seaweed ecosystems due to their distinct biomass densities and sequestration capacities, and then averaged the results with accommodations for their relative global areas.

Equation 1.

\[ \text{Effectiveness} = \left( \text{Seaweed loss}_{\text{baseline}} \times \text{Reduction in loss} \right) \times \left( \text{Carbon}_{\text{avoided emissions}} + \text{Carbon}_{\text{sequestration}} \right) \]

Table 1. Effectiveness of seaweed ecosystem protection in avoiding emissions and sequestering carbon.

Unit: tCO₂‑eq /ha/yr, 100-year basis

Avoided emissions, estimate 0.13
Sequestration 0.43
Total effectiveness, estimate 0.56
Total effectiveness, 25th percentile 0.21
Total effectiveness, 75th percentile 0.91

Unit: tCO₂‑eq /ha/yr, 100-year basis

Avoided emissions, estimate 0.043
Sequestration 0.083
Total effectiveness, estimate 0.13
Total effectiveness, 25th percentile 0.034
Total effectiveness, 75th percentile 0.22

Unit: tCO₂‑eq /ha/yr, 100-year basis

Avoided emissions, estimate 0.080
Sequestration 0.24
Total effectiveness, estimate 0.32
Total effectiveness, 25th percentile 0.11
Total effectiveness, 75th percentile 0.52
Left Text Column Width
Cost

We estimate that seaweed ecosystem protection might save approximately US$72/tCO₂‑eq , but emphasize that these estimates are highly uncertain due to existing data limitations. This is based on protection costs of roughly US$14/ha/yr and revenue of US$43/ha/yr compared with the baseline (Table 2). The costs of seaweed ecosystem protection also include up-front one-time expenditures of US$208 (surveys, administrative setup, legal fees, etc.), estimated from McCrea-Strub et al. (2011). However, data related to the costs of seaweed ecosystem protection are limited, and these estimates are uncertain. For consistency across solutions, we did not include revenue associated with other ecosystem services. 

We estimated costs of MPA maintenance at US$14/ha/yr based on data from existing MPAs, though only 16% of MPAs surveyed reported their current funding was sufficient (Balmford et al., 2004). Maintenance is critical for seaweed ecosystems, especially those prone to overgrazing. Tourism revenues directly attributable to protection were estimated to be $43/ha/yr (Waldron et al., 2020) based on estimates for all MPAs (and PAs) and not including downstream revenues. However, estimates of tourism revenues are highly uncertain for seaweed ecosystems. In some seaweed ecosystems, such as kelp forests, tourism is likely a real revenue generator through diving or other recreational activities, but the financial contribution is generally unclear and poorly documented across all seaweed ecosystems. 

Table 2. Cost per unit of climate impact. Negative values indicate cost savings.

Unit: 2023 US$/tCO₂‑eq , 100-yr basis

Estimate -72
Left Text Column Width

Methods and Supporting Data

Learning Curve

A learning curve is defined here as falling costs with increased adoption. The costs of seaweed ecosystem protection do not fall with increasing adoption, so there is no learning curve for this solution.

Speed of Action

Speed of action refers to how quickly a climate solution physically affects the atmosphere after it is deployed. This is different from speed of deployment, which is the pace at which solutions are adopted.

At Project Drawdown, we define the speed of action for each climate solution as emergency brake, gradual, or delayed.

Protect Seaweed Ecosystems is an EMERGENCY BRAKE climate solution. It has the potential to deliver a more rapid impact than gradual and delayed solutions. Because emergency brake solutions can deliver their climate benefits quickly, they can help accelerate our efforts to address dangerous levels of climate change. For this reason, they are a high priority.

Caveats

Additionality is an important caveat for ecosystem protection. In our analysis, we used baseline rates of seaweed ecosystem loss to calculate the effectiveness of protection, which are highly uncertain and understudied. This assumes that seaweed ecosystems would continue to be lost at these rates in the absence of protection and thus that protection provides additional carbon benefits from the ecosystems whose loss is avoided. 

Importantly, effective protection depends on adequate funding and management. Poorly managed MPAs can fail to prevent key stressors, such as urchin overgrazing, from increasing and undermine the viability of seaweed ecosystems. Similar dynamics have been documented in kelp restoration efforts, where inadequate management has led to overgrazing and project failure (Eger et al., 2022).

The permanence of ecosystem carbon benefits is another key caveat. While seaweed ecosystems are expanding or expected to expand with climate change, in some regions many will contract (Corrigan et al., 2025). Protection may increase resilience to some climate change stressors, but it will not fully prevent ecosystem loss in many regions. Additionally, because seaweed ecosystems sequester carbon both on-site and off-site, the effectiveness of protection partly depends on downstream activities. For instance, carbon at the seafloor is threatened by disturbances such as bottom fishing and mining (see Protect Seafloors). Protection of seaweed ecosystems does not prevent loss of downstream stored carbon, some of which is contributed by seaweed ecosystems (Ortega et al., 2019). Additionally, seaweed biomass extent can change dramatically from year to year, which could result in substantial variability in carbon removal rates despite protection.

Another caveat in this solution lies in our assumptions about carbon dynamics at the ocean surface. We assume that seaweed NPP results in an equivalent removal of CO₂ from the atmosphere. In reality, this influx may not be fully efficient (Hurd et al., 2024). In some regions of the ocean, water carrying a CO₂ deficit from seaweed photosynthesis might be subducted before it reaches equilibrium with the atmosphere, which would reduce the atmospheric removal attributed to seaweed productivity in our calculations.

In our analysis, avoided emissions are calculated under the assumption that destruction of a seaweed ecosystem results in the loss of all biomass carbon. This likely overestimates near-term emissions, as some carbon may remain in the ocean for long periods. However, this fraction is expected to be small given that an estimated 6.0–13.7% (average: 11.4%) of NPP is thought to be stored long term (Krause-Jensen & Duarte, 2016). 

Finally, the relative fraction of NPP removed and durably stored (>100 years) is also uncertain (Pessarrodona et al., 2023). Despite this uncertainty, our use of 11.4% is supported by recent modeling of particulate carbon fluxes that suggest ~12.5% of NPP could be sequestered on a 100-year timescale (based on 44 Tg C of particulate organic carbon export to 1,000 m, where carbon is less likely to return to the atmosphere within a century, and ~353 Tg C as NPP; Filbee-Dexter et al., 2024b), but requires more research.

Current Adoption

A total of 78.80 Mha of seaweed ecosystems are currently within MPAs (Table 3). Cumulatively, roughly 18% of seaweed ecosystems are under some form of protection, with 4% located in strictly protected MPAs, 6% in nonstrict MPAs, and 8% in other IUCN protection categories. Subtidal brown and red seaweed ecosystems have similar rates of existing protection in all protection categories (Figure 3).

Table 3. Current (circa 2024) extent of seaweed ecosystems under legal protection. “Strict protection” includes land within IUCN categories I–II Marine Protected Areas (MPAs). “Nonstrict protection” includes land within IUCN Categories III–VI MPAs. “Other” includes land within all remaining IUCN MPA categories. Values may not sum to global totals due to rounding.

Unit: Mha protected

Strict protection 8.43
Nonstrict protection 11.4
Other 15.5
Total 35.3

Unit: Mha protected

Strict protection 9.28
Nonstrict protection 16.3
Other 18.0
Total 43.5

Unit: Mha protected

Strict protection 17.7
Nonstrict protection 27.6
Other 33.4
Total 78.8
Left Text Column Width
Adoption Trend

We calculated the rate of MPA expansion in seaweed ecosystems based on recorded year of establishment (UNEP-WCMC & IUCN, 2024). Protection expanded by a median of 0.74 Mha/yr in subtidal brown seaweed ecosystems and 0.97 Mha/yr in subtidal red seaweed ecosystems (Table 4; Figure 3a). The global average rate of expansion was roughly 2.13 Mha/yr, with a median of 1.71 Mha/yr. The adoption trend for subtidal brown and red seaweed was relatively similar, with both expanding 0.46–0.55%/yr, on average (median of 0.39–0.40%/yr) (Figure 3b).

Table 4. 2000–2024 adoption trend. Global totals reflect independent statistics, not sums of subtidal brown and red values.

Unit: Mha/yr

25th percentile 0.40
Median (50th percentile) 0.74
Mean 1.01
75th percentile 1.31

Unit: Mha/yr

25th percentile 0.62
Median (50th percentile) 0.97
Mean 1.12
75th percentile 1.45

Unit: Mha/yr

25th percentile 1.02
Median (50th percentile) 1.71
Mean 2.13
75th percentile 2.76
Left Text Column Width

Figure 3. Trend in seaweed ecosystem protection (2000–2024) in terms of (A) total hectares protected and (B) the percent of the current adoption ceiling that is currently protected. These values reflect only the area located within Marine Protected Areas. Units: million hectares protected and percent protected relative to the adoption ceiling.

Enable Download
On
Adoption Ceiling

We estimated that approximately 430 Mha of wild seaweed ecosystems are available for protection (Table 5). Subtidal red seaweeds compose ~240 Mha, with subtidal brown seaweeds occupying the remaining ~190 Mha. These adoption areas do not include other types of seaweed habitats/ecosystems, such as those found in the intertidal zone, rhodolith beds, Halimeda bioherms, coral reefs, and pelagic, free-floating seaweed, which could account for an additional ~150 Mha (Duarte et al., 2022). These adoption areas are highly uncertain due to data limitations and are also likely to shift with climate change.

Table 5. Adoption ceiling: upper limit for the adoption of legal protection of seaweed ecosystems.

Unit: Mha

Estimate 189.6

Unit: Mha

Estimate 243.0

Unit: Mha

Estimate 432.6
Left Text Column Width
Achievable Adoption

We defined the lower end of the achievable range for seaweed ecosystem protection (across all IUCN categories) as 50% of the adoption ceiling and the upper end of the achievable range as 70% of the adoption ceiling (Table 6). These adoption levels are ambitious relative to existing levels of protection (~18%), but align with targets to protect 30% of ecosystems by 2030 (Eger et al., 2024) and serve as an optimistic benchmark for the 30-year time horizon considered in our analysis. Several countries already protect more than 30% of subtidal brown seaweed ecosystems, such as kelp forests (Kelp Forest Alliance, 2024). For example, the United Kingdom, Japan, China, and France protect over 41%, 68%, 68%, and 47% of their kelp beds, respectively. 
 

Table 6: Range of achievable adoption levels for seaweed ecosystems.

Unit: Mha

Current adoption 78.8
Achievable – low 216.3
Achievable – high 302.9
Adoption ceiling 432.6
Left Text Column Width

We estimated that MPAs currently avoid emissions of 0.03 GtCO₂‑eq/yr in seaweed ecosystems, with potential impacts of 0.14 GtCO₂‑eq/yr at the adoption ceiling (Table 7). Achievable levels of seaweed ecosystem protection could safeguard 0.07 to 0.10 GtCO₂‑eq/yr by reducing emissions from biomass loss and retaining sequestration fluxes (Table 7). However, these estimates are highly uncertain and will benefit from more research (see Caveats).

Limited data exist on the potential climate impacts of seaweed ecosystem protection for comparison. However, a rough estimate of the benefits of conservation, restoration, and afforestation interventions of seaweeds suggests carbon benefits of at least 0.04 GtCO₂‑eq/yr (Pessarrodona et al., 2023). Other estimates suggest that total carbon sequestration in seaweed ecosystems could be on the order of 0.22–0.98 GtCO₂‑eq/yr (Krause-Jensen & Duarte, 2016). This is higher than our estimates because we account only for the carbon benefits of protection in seaweed ecosystems at risk of loss.

Table 7. Climate impact at different levels of adoption. Values may not sum to global totals due to rounding.

Unit: GtCO₂‑eq/yr, 100-year basis

Current adoption 0.02
Achievable – low 0.05
Achievable – high 0.07
Adoption ceiling 0.11

Unit: GtCO₂‑eq/yr, 100-year basis

Current adoption 0.01
Achievable – low 0.02
Achievable – high 0.02
Adoption ceiling 0.03

Unit: GtCO₂‑eq/yr, 100-year basis

Current adoption 0.03
Achievable – low 0.07
Achievable – high 0.10
Adoption ceiling 0.14
Left Text Column Width
Additional Benefits

Extreme Weather Events

Seaweeds can provide coastal resilience to the impacts of storms by lowering wave heights before they reach shorelines (Corrigan et al., 2025; Cotas et al., 2023). The magnitude of this benefit can vary based on the species and location of seaweed, and some evidence suggests that severe storms can harm seaweed habitats (Earp et al., 2024). Evidence suggests that kelp forests can attenuate wave heights locally, especially in the summer at peak kelp growth, but protection varies at larger spatial scales (Elsmore et al., 2024; Lindhart et al., 2024). Emerging research has found that protected seaweed ecosystems show more resilience to marine heat waves than unprotected areas (Kumagai et al., 2024). During heat waves, protected ecosystems maintain a habitat for species such as sea urchins that consume species that might degrade kelp ecosystems (Bauer et al., 2025; Kumagai et al., 2024).

Income and Work

Seaweeds support species that are important for tourism and fishing (Cuba et al., 2022; Eger et al., 2023). Many species that are supported by seaweeds have high economic value for fishing, such as crabs, lobsters, and abalones (Corrigan et al., 2025). For example, Eger et al. (2023) estimated that 1 ha of kelp forest where about 900 kg of fish biomass is harvested could yield about US$29,900 a year. The same study estimated that the global value of kelp forests that support fisheries is about US$465–562 billion (Eger et al., 2023). Seaweed habitats can also be tourist destinations for snorkeling and diving (UNEP, 2023), providing income-earning opportunities for nearby communities.

Food Security

The contribution of seaweeds to fisheries production can play a role in global food security (Cottier-Cook et al., 2023; Eger et al., 2023). Additionally, seaweeds are an essential part of many diets, especially in East Asia (FAO, 2024). Because seaweeds are a culturally important food in many geographies, protecting seaweeds can play an important role in equitably improving global food security (FAO, 2024).

Equality

For some cultures, seaweeds and their habitats shape shared identities and livelihoods (Cotas et al., 2023). For example, seaweeds are a source of traditional foods, medicines, art, and knowledge for many coastal communities and Indigenous peoples (Thurstan et al., 2018). Protecting seaweeds can preserve the cultural identities, practices, and knowledge of Indigenous communities that are often vulnerable (Corrigan et al., 2025).

Nature Protection

Seaweeds support biodiversity by providing habitat for a variety of marine species (Best et al., 2014; Cuba et al., 2022; Gibbons & Quijón, 2023; Tano et al., 2016). Literature reviews of the ecosystem services of seaweeds find that they contribute to increases in biodiversity (Gibbons & Quijón, 2023). Seaweeds can provide habitat and refuge from large predators (Best et al., 2014; Gibbons & Quijón, 2023). Invertebrates, detritivores, and other small species found in seaweed forests are essential food sources for other marine species (Cuba et al., 2022; Tano et al., 2016). 

Water Quality

Seaweeds improve water quality by supporting nutrient cycling and reducing pollutants (Cotas et al., 2023; Heckwolf et al., 2021). Evidence suggests that seaweeds can reduce eutrophication by filtering excess nutrients from the water (Corrigan et al., 2025; Gao et al., 2022; Heckwolf et al., 2021). 

Risks

Leakage, in which protecting one ecosystem results in the degradation of another, could offset the climate impact of seaweed ecosystem protection. For instance, restricting wild harvesting through the establishment of an MPA could shift pressure to other unprotected areas. Another key risk is weakly enforced or poorly managed MPAs. This is a real concern with existing MPAs due to a lack of funding, and can result in low protection effectiveness. Finally, climate change stressors, such as ocean warming and marine heat waves, are a major risk to permanence because they could lead to widespread mortality, even in protected areas.

Interactions with Other Solutions

Reinforcing

Intact and healthy seaweed ecosystems can enhance fish stocks, biodiversity, and habitat quality, which benefits all connected coastal and marine ecosystems.

Protecting seaweed ecosystems can help ensure the underlying areas of the seafloor remain intact.

Competing

Protection of seaweed ecosystems could potentially reduce the adoption of offshore wind in some regions.

Dashboard

Solution Basics

ha of seaweed ecosystem protected

t CO₂-eq (100-yr)/unit/yr
00.110.32estimate
units
Current 7.88×10⁷ 02.163×10⁸3.029×10⁸
Achievable (Low to High)

Climate Impact

Gt CO₂-eq (100-yr)/yr
Current 0.03 0.070.1
US$ per t CO₂-eq
-72
Emergency Brake

CO₂

Trade-offs

Seaweed ecosystems can release methane, which could reduce the climate benefits of protection estimated in this solution. While data are scarce, a recent study suggests that methane emissions could offset 28–35% of the carbon sink capacity in some seaweed ecosystems (Roth et al., 2023) if they escape to the atmosphere, which may be unlikely if methane production occurs at depth in sediments (Pessarrodona et al., 2023). 

Subtidal brown
Subtidal red
Both

Global subtidal seaweed ecosystem distribution

Seaweed ecosystems cover approximately 600 Mha of the ocean, an area twice the size of Argentina (Duarte et al., 2022). Here we show the estimated global distribution of subtidal red and brown seaweeds, though large uncertainty exists in their spatial distribution and extent.

Duarte, C. M., Gattuso, J. P., Hancke, K., Gundersen, H., Filbee-Dexter, K., Pedersen, M. F., Middelburg, J. J., Burrows, M. T., Krumhansl, K. A., Wernberg, T., Moore P., Pessarrodona, A., Ørberg, S. B., Pinto, I. S., Assis, J., Queirós, A. M., Smale, D. A., Bekkby, T., Serrão, E. A., & Krause-Jensen, D. (2022). Global estimates of the extent and production of macroalgal forests. Global Ecology and Biogeography, 31(7), 1422–1439. Link to source: https://doi.org/10.1111/geb.13515

Subtidal brown
Subtidal red
Both

Global subtidal seaweed ecosystem distribution

Seaweed ecosystems cover approximately 600 Mha of the ocean, an area twice the size of Argentina (Duarte et al., 2022). Here we show the estimated global distribution of subtidal red and brown seaweeds, though large uncertainty exists in their spatial distribution and extent.

Duarte, C. M., Gattuso, J. P., Hancke, K., Gundersen, H., Filbee-Dexter, K., Pedersen, M. F., Middelburg, J. J., Burrows, M. T., Krumhansl, K. A., Wernberg, T., Moore P., Pessarrodona, A., Ørberg, S. B., Pinto, I. S., Assis, J., Queirós, A. M., Smale, D. A., Bekkby, T., Serrão, E. A., & Krause-Jensen, D. (2022). Global estimates of the extent and production of macroalgal forests. Global Ecology and Biogeography, 31(7), 1422–1439. Link to source: https://doi.org/10.1111/geb.13515

Maps Introduction

While seaweed ecosystems are widely distributed across the global ocean, substantial uncertainty exists surrounding their distribution and extent (Kelp Forest Alliance, 2024; Duarte et al., 2022). The effectiveness of protection varies geographically and is likely to be highest in regions where the resource demands of management and enforcement are relatively low and chronic ecological threats are minimal or easy to address. However, because datasets needed to identify such priority regions are limited, we focus here on broad geographic patterns in seaweed extent and distribution.

Based on the most recent estimates of global extent, subtidal red and brown seaweeds cover nearly an order of magnitude greater area (~430 Mha) of the world’s oceans than do coastal wetlands (~55 Mha, see Protect Coastal Wetlands). Areas with subtidal brown seaweeds, such as kelp forests, are more effective per hectare than those with subtidal red seaweeds at mitigating climate change due to their generally higher biomass densities. Kelp forests are common in 25 countries. Canada, the United States, Russia, the United Kingdom, and Denmark contain more than 60% of the world’s kelp forests (~106.8 Mha), particularly in their high polar regions (Kelp Forest Alliance, 2024). In the Southern Hemisphere, Australia, New Zealand, Chile, and Argentina contain the greatest area of kelp forests (~27.8 Mha). Kelp forests in other countries are also critically important for sequestering carbon. Sixteen of the 25 countries with kelp forests have less than 5 Mha, and the median country-level extent is 4.2 Mha, highlighting the need for protection in these areas to achieve globally relevant levels of adoption. No country-level analyses exist for subtidal red seaweed ecosystems, and more research is needed to understand potential priority regions for subtidal red seaweed ecosystem protection.

Action Word
Protect
Solution Title
Seaweed Ecosystems
Classification
Highly Recommended

Lawmakers and Policymakers

  • Set achievable targets and pledges for seaweed protection with clear effectiveness goals; regularly measure and report on protection status, seaweed ecosystems, challenges, and related data points.
  • Help develop definitions, standards, strategies, and commitments at the international level for seaweed protection along with frameworks for measurement and monitoring; design indicators to capture long-term impacts, including metrics to capture social and biodiversity impacts.
  • Establish MPAs specifically for seaweeds and their habitats; target subtidal brown seaweeds for maximum climate benefits while not neglecting others such as red seaweeds; incorporate statutory protections for seaweeds in existing MPAs; expand MPA designations to meet international goals.
  • Create strong regulatory frameworks with clear goals and definitions for activities related to seaweed protection such as sustainable harvesting, protection, management, and restoration; ensure the framework is gender responsive and seeks to include women throughout the protection process.
  • Seek to identify local drivers of seaweed decline, address drivers of decline through stringent legal protections, ensure strict enforcement of regulations, and allow for restoration activities.
  • When designating new MPAs, prioritize strategies such as no-take-fishing regulations and strong enforcement measures with high penalties for noncompliance; target large (>100 km2) areas that can be protected over the long term (>10 years) and are ecologically isolated by natural barriers such as deep water and/or sand.
  • Consider placing MPAs near protected or undisturbed terrestrial areas to help avoid nutrient and other land pollution.
  • Codesign seaweed protection projects with the local community; ensure the community engagement process starts early and is transparent, inclusive, and ongoing; solicit feedback from the local community – including from opposition groups – on location, design, finance, and management; ensure finalized protections address sociological, economic, and ecological considerations.
  • Coordinate seaweed protection and restoration policies horizontally (e.g., across agencies) and vertically (e.g., across subnational, national, and international efforts); seek to align social and environmental safeguards with seaweed protection policies and goals.
  • Develop regional and transboundary coordination mechanisms for seaweed protection, especially when working across international borders; consider using proven methods from adjacent issue areas such as freshwater management or combining MPA management with existing coordinating bodies.
  • Review MPA management plans, regulations, designs, and implementation strategies frequently to adjust for changing conditions; update as needed and ensure protections allow for changes to respond to climatic conditions.
  • Ensure projects operating in or with Indigenous communities only do so under Free, Prior, and Informed Consent (FPIC); codify FPIC into legal systems.
  • Strengthen land tenure rights; grant Indigenous communities full property rights and autonomy to protect coastal areas and watersheds.
  • Center Indigenous communities and knowledge in MPA management strategies; help document and amplify Indigenous wisdom and practices.
  • Create programs to monitor for activity and market leakage from protected sites; adjust enforcement and policies to reduce leakage, if necessary.
  • Maintain up-to-date records of seaweed harvesting and populations; monitor impacts; adjust regulations and enforcement to ensure harvesting is sustainable.
  • Remove harmful agriculture subsidies, particularly those that incentivize livestock and overuse of fertilizers that can impact seaweed habitats and MPAs.
  • Put into place locally relevant laws and regulations that help indirectly protect seaweed ecosystems, such as bans on sea otter trapping or bottom trawling.
  • Create “climate-smart” MPAs that connect seaweed ecosystems, allow for gene exchanges, and adjust boundaries to address changing oceanic conditions; target protection of taxa such as brown seaweedss that maximize climate benefits while not neglecting others such as red seaweeds; incorporate climate refugia into MPAs; create strategies for MPAs to address both climate mitigation and adaptation.
  • Invest in research on seaweed biodiversity seeking to document new species, sample from underrepresented regions, and use the most up-to-date techniques to assess taxonomies; support efforts to update key databases such as the IUCN Red List; support research to improve confidence in estimates of global seaweed ecosystem extent, biomass, composition, productivity, and loss rates; monitor related long-term trends.
  • Create educational and volunteer programs that work with schools, universities, NGOs, and the general public to inform communities how to participate in seaweed protection efforts, benefits, and opportunities; expand extension services to develop local capacity in seaweed protection, especially in community-led monitoring and evaluation; establish knowledge-sharing initiatives with Indigenous peoples.
  • Join, create, or participate in public-private partnerships dedicated to mobilizing financing, protection activities, knowledge transfers, general education, and other relevant areas.
  • Join, support, or create certification schemes that verify protected areas and sustainable use of seaweed products.

Practitioners

  • Set achievable targets and pledges for seaweed protection with clear effectiveness goals; regularly measure and report on protection status, seaweed ecosystems, challenges, and related data points.
  • Help develop definitions, standards, strategies, and commitments at the international level for seaweed protection along with frameworks for measurement and monitoring; design indicators to capture long term impacts, including metrics to capture social and biodiversity impacts.
  • Establish MPAs specifically for seaweeds and their habitats; target subtidal brown seaweeds for maximum climate benefits while not neglecting others such as red seaweeds; incorporate statutory protections for seaweeds in existing MPAs; expand MPA designations to meet international goals.
  • Help create strong regulatory frameworks with clear goals and definitions for activities related to seaweed protection such as sustainable harvesting, protection, management, and restoration; ensure the framework is gender responsive and seeks to include women throughout the protection process.
  • Seek to identify local drivers of seaweed decline, address drivers of decline through stringent legal protections, ensure strict enforcement of regulations, and allow for restoration activities.
  • When designating new MPAs, prioritize strategies such as no-take-fishing regulations and strong enforcement measures with high penalties for noncompliance; target large (>100 km2) areas that can be protected over the long term (>10 years) and are ecologically isolated by natural barriers such as deep water and/or sand.
  • Create “climate-smart” MPAs that connect seaweed ecosystems, allow for gene exchanges, and adjust boundaries to address changing oceanic conditions, target protection of taxa such as brown seaweeds that maximize climate benefits while not neglecting others such as red seaweeds; incorporate climate refugia into MPAs; create specific strategies for MPAs to address both climate mitigation and adaptation.
  • Consider placing MPAs near protected or undisturbed terrestrial areas to help avoid nutrient and other land pollution.
  • Codesign seaweed protection projects with the local community; ensure the community engagement process starts early and is transparent, inclusive, and ongoing; solicit feedback from the local community – including from opposition groups – on location, design, finance, and management; ensure finalized protections address sociological, economic, and ecological considerations.
  • Develop regional and transboundary coordination mechanisms for seaweed protection - especially, when working across international borders; consider using proven methods from adjacent issue areas such as fresh-water management or combining MPA management with existing coordinating bodies.
  • Review MPA management plans, regulations, designs, and implementation strategies frequently to adjust for changing conditions; update as needed and ensure protections allow for changes to respond to climatic conditions.
  • Maintain detailed financial records of activities related to MPA designation and management; share costs publicly and provide recommendations for best practices.
  • Ensure projects operating in or with Indigenous communities only do so under FPIC; help codify FPIC into legal systems.
  • Center Indigenous communities and knowledge in MPA management strategies; help document and amplify Indigenous wisdom and practices.
  • Work with businesses to develop markets for native species products and other sustainable uses of seaweed and MPAs.
  • Develop or support opportunities for ecotourism industries in local MPAs with particular emphasis on educating tourists of the importance of seaweed.
  • Create programs to monitor for activity and market leakage from protected sites; adjust enforcement and strategies to reduce leakage, if necessary.
  • Maintain up-to-date records of seaweed harvesting and existing populations; monitor impacts; adjust regulations and enforcement to ensure harvesting is sustainable.
  • Invest in research on seaweed biodiversity seeking to document new species, sample from underrepresented regions, and use the most up-to-date techniques to assess taxonomies; support efforts to update key databases such as the IUCN Red List; support research to improve confidence in estimates of global seaweed ecosystem extent, biomass, composition, productivity, and loss rates; monitor related long-term trends.
  • Create educational and volunteer programs that work with schools, universities, NGOs, and the general public to inform communities of how to participate in seaweed protection efforts, benefits, and opportunities; expand extension services to develop local capacity in seaweed protection, especially in community-led monitoring and evaluation; establish knowledge-sharing initiatives with Indigenous peoples.
  • Join, create, or participate in public-private partnerships dedicated to mobilizing financing, protection activities, knowledge transfers, general education, and other relevant areas.
  • Join, support, or create certification schemes that verify protected areas and sustainable use of seaweed products.

Business Leaders

  • Ensure operations, development, and supply chains are not degrading seaweed communities or interfering with MPA management.
  • Develop markets for native species products and other sustainable uses of seaweed and MPAs.
  • Develop or support opportunities for ecotourism industries in local MPAs with particular emphasis on educating tourists of the importance of seaweed.
  • Consider offering company grants to suppliers or other partners to improve resource management within your supply chain.
  • Offer incubator services for those working on seaweed protection; offer pro bono business advice or general support for community protection efforts.
  • Enter into outgrower schemes to support sustainable harvesters; make long-term commitments to help stabilize projects.
  • Consider donating or contributing to local seaweed protection efforts; consider using an internal carbon fee or setting aside a percentage of revenue to fund protection projects.
  • Amplify the voices of local communities and civil society to promote robust media coverage.
  • Invest in and support Indigenous and local communities' capacity for management, legal protection, and public relations.
  • Leverage political influence to advocate for stronger seaweed protection policies at national and international levels.
  • Offer employee professional development funds to be used for certification in seaweed protection or related fields such as curricular economies.
  • Join, create, or participate in public-private partnerships dedicated to mobilizing financing, protection activities, knowledge transfers, general education, and other relevant areas.
  • Join, support, or create certification schemes that verify protected areas and sustainable use of seaweed products.

Nonprofit Leaders

  • Ensure operations, development, and supply chains are not degrading seaweed communities or interfering with MPA management, if relevant.
  • Assist in managing restoration projects; consider using alternative business structures such as cooperatives.
  • Develop seaweed protection tool kits specific for nations or regions; include best practices, management strategies, typical interventions, recommendations for regulations, and strategies for civil society to impact legal classifications and MPA designations.
  • Advocate for achievable targets and pledges for seaweed protection with clear effectiveness goals; help regularly measure and report on protection status, seaweed ecosystems, challenges, and related data points.
  • Help develop definitions, standards, strategies, and commitments at the international level for seaweed protection along with frameworks for measurement and monitoring; design indicators to capture long-term impacts, including metrics to capture social and biodiversity impacts.
  • Establish or advocate for the establishment of MPAs specifically for seaweeds and their habitats; target subtidal brown seaweeds for maximum climate benefits while not neglecting others such as red seaweeds; advocate for statutory protections for seaweeds in existing MPAs; help expand MPA designations to meet international goals.
  • Help create strong regulatory frameworks with clear goals and definitions for activities related to seaweed protection such as sustainable harvesting, protection, management, and restoration; ensure the framework is gender responsive and seeks to include women throughout the protection process.
  • Seek to identify local drivers of seaweed decline, help address causes when possible, and advocate for stringent legal protections with strict enforcement.
  • Help develop or advocate for regional and transboundary coordination mechanisms for protecting seaweeds, especially when working across international borders; consider using proven methods from adjacent issue areas such as freshwater management or combining MPA management with existing coordinating bodies.
  • Help review MPA management plans, regulations, designs, and implementation strategies frequently to adjust for changing conditions; update as needed and ensure protections allow for changes to respond to climatic conditions.
  • Codesign seaweed protection projects with the local community; ensure the community engagement process starts early and is transparent, inclusive, and ongoing; solicit feedback from the local community – including from opposition groups–- on location, design, finance, and management strategies; ensure finalized protections address relevant sociological, economic, and ecological considerations.
  • Help maintain and/or audit detailed financial records of activities related to MPA designation and management; share costs publicly and provide recommendations for best practices.
  • Ensure projects operating in or with Indigenous communities only do so under FPIC; advocate to codify FPIC into legal systems.
  • Center Indigenous communities and knowledge in MPA management strategies; help document and amplify Indigenous wisdom and practices.
  • Work with businesses to develop markets for native species products and other sustainable uses of seaweed and MPAs.
  • Develop or support opportunities for ecotourism industries in local MPAs with particular emphasis on educating tourists of the importance of seaweed.
  • Create programs to monitor for activity and market leakage from protected sites; advocate for adjustments to enforcement and policies to reduce leakage, if necessary.
  • Help establish outgrower schemes and negotiate contracts to support sustainable harvesters to ensure they receive the most favorable terms possible.
  • Assist in maintaining up-to-date records of seaweed harvesting and existing ecosystems; monitor impacts; advocate for adjustments to regulations and enforcement to ensure harvesting is sustainable.
  • Help create educational and volunteer programs that work with schools, universities, other NGOs, and the general public to inform communities of how to participate in seaweed protection efforts, benefits, and opportunities; develop local capacity in seaweed protection, especially in community-led monitoring and evaluation; establish knowledge-sharing initiatives with Indigenous peoples.
  • Join, create, or participate in public-private partnerships dedicated to mobilizing financing, protection activities, knowledge transfers, general education, and other relevant areas.
  • Join, support, or create certification schemes that verify protected areas and sustainable use of seaweed products.

Investors

  • Create investment portfolios that support seaweed protection and sustainable use; use current data and the latest technology to guide sustainable investments.
  • Apply environmental and social standards to existing investments; divest from destructive industries and/or work with portfolio companies to improve practices.
  • Offer specific credit lines for seaweed protection projects with long-term timelines; offer low-interest loans, microfinancing, and specific financial products for small and medium-sized projects.
  • Own equity in sustainable projects that manage or support seaweed protection, especially during the early and middle phases.
  • Offer incubator services for those working on seaweed protection; offer pro bono business advice or general support for community protection projects.
  • Provide catalytic financing for businesses developing sustainable products made from native species, local ecotourism, or other sustainable uses of seaweed and MPAs.
  • Invest in blue bonds or high-integrity carbon credits for seaweed protection or supportive efforts.
  • Support seaweed protection, other investors, and NGOs by sharing data, information, and investment frameworks that successfully avoid investments that drive declines in seaweeds and damage their habitats.
  • Join, create, or participate in public-private partnerships dedicated to mobilizing financing, protection activities, knowledge transfers, general education, and other relevant areas.
  • Join, support, or create certification schemes that verify protected areas and sustainable use of seaweed products.

Philanthropists and International Aid Agencies

  • Ensure operations, development, and supply chains are not degrading seaweed communities or interfering with MPA management, if relevant.
  • Help manage restoration projects; consider using alternative business structures such as cooperatives.
  • Offer grants or specific credit lines for seaweed protection projects with long-term timelines; offer low-interest loans, microfinancing options, and favorable financial products for small and medium-sized projects.
  • Own equity in sustainable projects that manage or support seaweed protection, especially during the early and middle phases.
  • Offer incubator services for those working on seaweed protection; offer free business advice or general support for community protection projects.
  • Provide catalytic financing for business developing sustainable products made from native species, local ecotourism, or other sustainable uses of reforested lands.
  • Develop seaweed protection tool kits specific for nations or regions; include best practices, management strategies, typical interventions, recommendations for regulations, and strategies for civil society to impact legal classifications and MPA designations.
  • Advocate for achievable targets and pledges for seaweed protection with clear effectiveness goals; help regularly measure and report on protection status, seaweed ecosystems, challenges, and related data points.
  • Help develop definitions, standards, strategies, and commitments at the international level for seaweed protection along with frameworks for measurement and monitoring; design indicators to capture long-term impacts, including metrics to capture social and biodiversity impacts.
  • Establish or advocate for the establishment of MPAs specifically for seaweeds and their habitats; target subtidal brown seaweeds for maximum climate benefits while not neglecting other taxa such as red seaweeds; advocate for statutory protections for seaweeds in existing MPAs; help expand MPA designations to meet international goals.
  • Help create strong regulatory frameworks with clear goals and definitions for activities related to seaweed protection such as sustainable harvesting, protection, management, and restoration; ensure the framework is gender responsive and seeks to include women throughout the protection process.
  • Help develop or advocate for regional and transboundary coordination mechanisms for protecting seaweeds, especially when working across international borders; consider using proven methods from adjacent issue areas such as freshwater management or combining MPA management with existing coordinating bodies.
  • Help review MPA management plans, regulations, designs, and implementation strategies frequently to adjust for changing conditions; update as needed and ensure protections allow for changes to respond to climatic conditions.
  • Help maintain and/or audit detailed financial records of activities related to MPA designation and management; share costs publicly and provide recommendations for best practices.
  • Ensure projects operating in or with Indigenous communities only do so under FPIC; advocate to codify FPIC into legal systems.
  • Center Indigenous communities and knowledge in MPA management strategies; help document and amplify Indigenous wisdom and practices.
  • Work with businesses to develop markets for native species products and other sustainable uses of seaweeds and MPAs.
  • Develop or support opportunities for ecotourism industries in local MPAs with particular emphasis on educating tourists of the importance of seaweed.
  • Create programs to monitor for activity and market leakage from protected sites; advocate for adjustments to enforcement and policies to reduce leakage, if necessary.
  • Help establish outgrower schemes and negotiate contracts to support sustainable harvesters to ensure they receive the most favorable terms possible.
  • Join, create, or participate in public-private partnerships dedicated to mobilizing financing, protection activities, knowledge transfers, general education, and other relevant areas.
  • Join, support, or create certification schemes that verify protected areas and sustainable use of seaweed products.

Thought Leaders

  • If possible, initiate seaweed protection projects in your area; work with local experts, share your experience, and document your progress.
  • Advocate for achievable targets and pledges for seaweed protection with clear effectiveness goals; help regularly measure and report on protection status, seaweed ecosystems, challenges, and related data points.
  • Help develop definitions, standards, strategies, and commitments at the international level for seaweed protection along with frameworks for measurement and monitoring; design indicators to capture long-term impacts, including metrics to capture social and biodiversity impacts.
  • Establish or advocate for the establishment of MPAs specifically for seaweeds and their habitats; target subtidal brown seaweeds for maximum climate benefits while not neglecting others such as red seaweeds; advocate for statutory protections for seaweeds in existing MPAs; help expand MPA designations to meet international goals.
  • Help create strong regulatory frameworks with clear goals and definitions for activities related to seaweed protection such as sustainable harvesting, protection, management, and restoration; ensure the framework is gender responsive and seeks to include women throughout the protection process.
  • Help develop or advocate for regional and transboundary coordination mechanisms for protecting seaweeds, especially, when working across international borders; consider using proven methods from adjacent issue areas such as freshwater management or combining MPA management with existing coordinating bodies.
  • Help review MPA management plans, regulations, designs, and implementation strategies frequently to adjust for changing conditions; update as needed and ensure protections allow for changes to respond to climatic conditions.
  • Ensure projects operating in or with Indigenous communities only do so under FPIC; advocate to codify FPIC into legal systems.
  • Center Indigenous communities and knowledge in MPA management strategies; help document and amplify Indigenous wisdom and practices.
  • Work with businesses to develop markets for native species products and other sustainable uses of seaweeds and MPAs.
  • Develop or support opportunities for ecotourism industries in local MPAs with particular emphasis on educating tourists of the importance of seaweed.
  • Create programs to monitor for activity and market leakage from protected sites; advocate for adjustments to enforcement and policies to reduce leakage, if necessary.
  • Help establish outgrower schemes and negotiate contracts to support sustainable harvesters to ensure they receive the most favorable terms possible.
  • Join, create, or participate in public-private partnerships dedicated to mobilizing financing, protection activities, knowledge transfers, general education, and other relevant areas.
  • Join, support, or create certification schemes that verify protected areas and sustainable use of seaweed products.

Technologists and Researchers

  • Help develop spatial distribution models of seaweed ecosystems combining field surveys, satellite data, and machine learning to help identify likely locations of seaweed and vulnerable ecosystems; conduct field observations to validate and/or improve models; update existing or create new databases with the information.
  • Help improve confidence in estimates of global seaweed ecosystems and monitor related long-term trends, including impacts of harvesting and adaptive capacity of seaweeds.
  • Conduct research on seaweed biodiversity seeking to document new species, sample from underrepresented regions, and use the most up-to-date techniques to assess taxonomies; help update key databases such as the IUCN Red List.
  • Help develop national seedstocks and biosecure nurseries for local and vulnerable seaweed.
  • Research the interactions of disturbances such as overfishing, eutrophication, coastal darkening, invasive species, climate change, and other related variables on seaweed ecosystems; identify loss rates and protection strategies to mitigate impacts from these events.
  • Examine and document ecosystem functions of various seaweed varieties, including their productivity and potential contributions to carbon removal; research the benefits of seaweed protection for human well-being.
  • Help classify existing MPAs according to IUCN categories; monitor ongoing efforts; use learnings to inform management.
  • Help gather accurate financial data on MPAs; assess average and global costs; provide cost projections for potential MPA sites; assess financial gains provided by MPAs, such as increased tourism and economic activity.
  • Work with Indigenous communities under FPIC to help document, examine, and apply traditional practices; help amplify relevant Indigenous knowledge.

Communities, Households, and Individuals

  • If possible, initiate seaweed protection projects in your area; work with local experts, share your experience, and document your progress.
  • Help establish and participate in local protection efforts; consider volunteering with a local nonprofit or establishing one if none exists.
  • Conduct citizen science research to map and monitor local seaweed communities; share your findings with policymakers, local experts, and the public.
  • If seaweed communities are being damaged in your area and no action is being taken, conduct individual advocacy by speaking to local officials, handing out fliers, and other relevant methods.
  • Help identify local sources of degradation and distribute findings to policymakers and the public; help address causes when possible and advocate for stringent legal protections with strict enforcement.
  • Call on governments and administrators to use transparent, inclusive, and ongoing community engagement processes to codesign seaweed protection projects; help solicit community feedback on area designations, finance, monitoring, and distribution of benefits; help ensure finalized projects address relevant sociological, economic, and ecological considerations.
  • Reduce and/or eliminate use of chemicals on your lawn and/or property to reduce pollution runoff, especially if your property contains or is located on a coastally connected watershed; set up a sign that indicates your lawn is chemical-free.
  • Have community conversations about local seaweed habitats, MPAs, and local drivers of damage; seek to reduce harmful practices such as overuse of fertilizers and pesticides; educate friends and neighbors about local degraded seaweed habitats and potential solutions.
  • Consider donating or contributing to local protection efforts.
  • Try to purchase sustainable seaweed products that support local protection efforts.
  • When traveling, look for opportunities to support seaweed protection projects and ecotourism.
  • Advocate for strong land tenure rights; support Indigenous property rights and autonomy to protect watersheds and adjacent terrestrial systems to seaweed habitats.
  • Ensure projects operating in or with Indigenous communities only do so under FPIC; help codify FPIC into legal systems.
  • Help document and develop knowledge-sharing opportunities for Indigenous and local knowledge.
  • Help create educational and volunteer programs that work with schools, universities, NGOs, and the general public to inform communities of how to participate in seaweed protection efforts, benefits, and opportunities; develop local capacity in seaweed protection, especially in community-led monitoring and evaluation; establish knowledge-sharing initiatives with Indigenous peoples.
  • Join, create, or participate in public-private partnerships dedicated to mobilizing financing, protection activities, knowledge transfers, general education, and other relevant areas.
  • Join, support, or create certification schemes that verify protected areas and sustainable use of seaweed products.
Evidence Base

Consensus of effectiveness at reducing emissions and maintaining carbon removal: Mixed

There is mixed scientific consensus that protection prevents the degradation of seaweed ecosystems, but high consensus that degradation leads to losses in biomass carbon stocks and sequestration capacity. Seaweed ecosystems can be degraded by diverse stressors that directly or indirectly affect biomass stocks. Management actions, such as establishment of MPAs, can help prevent both direct and indirect habitat loss and thereby maintain the carbon removal capacity of seaweed ecosystems with relatively high certainty against stressors such as wild harvesting, coastal development, overgrazing, and poor water quality (Pessarrodona et al., 2023). However, some stressors, such as marine heat waves and ocean warming, are less effectively addressed by protection alone (Filbee-Dexter et al., 2024a). Benefits are still expected in some systems because MPAs can enhance resilience and recovery by reducing co-occurring stressors common that contribute to seaweed ecosystem degradation (Krumhansl et al., 2016; Ortiz-Villa et al., 2025). Moreover, MPAs, even when established in areas with addressable stressors, are typically not fully effective. Here, we applied a protection effectiveness of 53%, based on aggregated estimates from MPAs beyond seaweed ecosystems (Rodríguez-Rodríguez & Martínez-Vega, 2022). If the effectiveness of protection is lower (higher), climate impacts could likewise be lower (higher).

There is high scientific consensus that degradation of seaweed ecosystems leads to losses in biomass carbon stocks and sequestration capacity. While direct estimates of CO₂ emissions from biomass are limited, degradation has been shown to remove biomass carbon and reduce sequestration. For instance, drivers of habitat loss and degradation, such as overharvesting (González-Roca et al., 2021; Steen et al., 2016), overgrazing (Akaike & Mizuta, 2024), and poor water quality (Filbee-Dexter & Wernberg, 2020), reduce standing biomass and therefore associated carbon export from seaweed ecosystems (Pessarrodona et al., 2023). 

The carbon sink capacity of seaweed ecosystems, such as kelp forests, is also expected to decline with climate change stressors such as warming, which can increase rates of decomposition by 9–42% (Filbee-Dexter et al., 2022) and drive habitat loss, both of which reduce the likelihood that carbon makes its way to the deep sea for long-term storage. Off the coast of Australia, over 140,000 ha of subtidal brown seaweed forests have already been lost to warming over two decades, representing a decline of 2–4% of regional seaweed biomass carbon stocks and sequestration capacity (Filbee-Dexter & Wernberg, 2020).

The results presented in this assessment synthesize findings from 5 global datasets. We recognize that geographic bias in the information underlying global data products creates bias, and hope this work inspires research and data sharing on this topic in underrepresented regions and on understudied aspects of these ecosystems.

Appendix

This analysis quantifies emissions that can be avoided by protecting seaweed ecosystems via the establishment of Marine Protected Areas (MPAs). We leveraged two global seaweed distribution maps alongside a shapefile of MPAs, available data on rates of avoided ecosystem loss attributable to MPA establishment, and global data on biomass carbon stores and carbon sequestration rates to calculate climate impacts. This appendix describes the source data products and how they were integrated.

Seaweed Ecosystem Extent

We relied on the global maps of seaweed extent developed by Duarte et al. (2022), which classify subtidal brown and red seaweeds (among others). We used the “LT2 Brown Algae Benthic” raster to calculate subtidal brown seaweed extent and the “LT2 Red Algae Benthic” raster to calculate subtidal red seaweed extent. We did not consider red seaweed in subtidal brown-dominant environments, such as kelp forests, due to existing limitations with the global maps. 

Protected Seaweed Ecosystem Areas

We identified protected seaweed ecosystem areas using the World Database on Protected Areas (UNEP-WCMC & IUCN, 2024), which contains boundaries for each MPA and additional information, including the establishment year and IUCN management category (Ia to VI, not applicable, not reported, or not assigned). In this analysis, we considered all categories. While some MPA categories likely allow for wild harvest, which can be unsustainably conducted, wild seaweed harvest is currently estimated at 1.3 Mt/yr (wet weight) (FAO, 2024), which represents a relatively small portion of the global loss rate used (<0.2%/yr). We converted the MPA boundary data to a raster and used them to calculate the seaweed area within MPA boundaries for each seaweed type analyzed (subtidal brown and red) and each MPA category. To evaluate trends in adoption over time, we also aggregated protected areas by establishment year as reported in the WDPA. 

Calculation of Effectiveness

The following equations show a detailed breakdown of the stepwise set of calculations used to implement Equation 1, including estimation of avoided seaweed loss and of emissions and retained sequestration across the 30-year time horizon considered.

Avoided Seaweed Ecosystem Conversion

We compiled baseline estimates of seaweed ecosystem loss (%/yr) from existing literature and used them in conjunction with an estimate of reductions in loss associated with protection of 53% (derived from Rodríguez-Rodríguez & Martínez-Vega, 2022) to calculate the rate of avoidable macroalgae loss (Seaweed lossavoided). Seaweed ecosystem loss rates were based on the original analysis of data aggregated from Krumhansl et al. (2016) for studies over 20 years long (Seaweed lossbaseline; median loss rate of 1.2%/yr). 

Equation A1.

\[ Seaweed\ loss_{avoided}=Seaweed\ loss_{baseline} \times Reduction\ in\ loss\]

We then used the avoidable seaweed loss rates to calculate avoided CO₂ emissions and additional carbon sequestration for each adoption unit. Specifically, we estimated the carbon benefits of avoided seaweed ecosystem loss by multiplying avoided seaweed ecosystem loss by avoided CO₂ emissions (Equation A2) and by applying carbon sequestration rates over 30 years (Equation A3) for each seaweed type. 

We estimated avoided CO₂ emissions by assuming a one-time release of all aboveground biomass carbon upon loss. We derived our estimates of retained carbon sequestration from global databases on NPP for each seaweed type from Duarte et al. (2022) and a global estimate of NPP-derived sequestration (11.4%) from NPP based on Krause-Jensen and Duarte (2016). 

Equation A2.

\[Avoided\ emissions= Seaweed\ loss_{avoided} \times \sum_{t=1}^{30}(Emissions)\]

Equation A3.

\[Sequestration= Seaweed\ loss_{avoided} \times \sum_{t=1}^{30}(Sequestration)\]

We then estimated effectiveness (Equation A4) as the avoided CO₂ emissions and retained carbon sequestration capacity attributable to the reduction in seaweed ecosystem loss conferred by protection estimated in Equations A1–3.

Equation A4.

\[Effectiveness = (Carbon_{avoided\ emissions}+ Carbon_{sequestration})\]
Updated Date
Coming Soon Label
Coming Soon

Restore Peatlands

Image
Image
Boreal peatland restoration
Coming Soon
On

Key Takeaways

  • Restoring peatlands reduces GHG emissions from drained peatlands, with an overall effectiveness of 20.7–60.9 t CO₂‑eq /ha/yr. 
  • Peatland restoration has many benefits, including boosting biodiversity through habitat provisioning, enhancing water quality through natural storage and filtration, improving human health by reducing fire risk and associated air pollution, and providing local cooling. 
  • Peatland restoration has some caveats and trade-offs, including relocation of production activities to other ecosystems, loss of revenue, and high restoration costs. 
  • Protecting intact peatlands is a higher priority than peatland restoration.
Summary

Peatland restoration is the process of returning peat-forming vegetation and natural hydrologic conditions to degraded peatlands. Restoration of peatlands stops GHG emissions from peat degradation and removes carbon through sequestration in biomass and peat.

This solution focuses on non-coastal peatlands that have been drained, cleared of vegetation, harvested for peat, or otherwise degraded. Coastal peatlands are addressed in the Restore Mangrove Ecosystems and Restore Salt Marsh Ecosystems solutions.

Description for Social and Search
Restore Peatlands is a Highly Recommended climate solution. Drained peatlands emit GHGs as the peat degrades, but rewetting and revegetating stops emissions and can return their ability to act as carbon sinks.
Overview

Peatlands are diverse ecosystems characterized by waterlogged, carbon-rich soils consisting of partially decomposed dead plant material (Figure 1). Because decomposition occurs very slowly under low oxygen, waterlogged conditions, large amounts of partially decomposed plant material accumulated over millennia in peatlands. These carbon-rich ecosystems occupy only 3–4% of land area (Xu et al., 2018; United Nations Environment Programme [UNEP], 2022), but store an estimated 600 Gt carbon (~2,200 Gt CO₂‑eq), roughly twice as much carbon as is stored in forest biomass globally (UNEP, 2022; Yu et al., 2010; Pan et al., 2024). Approximately 12% of global peatlands (~57 Mha) have been drained or otherwise degraded for agriculture, forestry, peat extraction, or other uses. Restoration of degraded peatlands through revegetation and rewetting (returning to a waterlogged state; Evans et al., 2021) reduces ongoing emissions and can restore the ability of the ecosystem to sequester carbon.

Figure 1. These photos show the diversity of peatlands that occur in different places, including a fen peatland and meadow complex in California (top left), a peat swamp in Indonesia (top right), a peat fen and forest in Canada (bottom left), and a peat bog in New Hampshire (bottom right). 

Image
Examples of peatland types

Photo credits: Catie and Jim Bishop | U.S. Department of Agriculture; Rhett A. Butler; Garth Lenz; Linnea Hanson | U.S. Department of Agriculture

Draining and/or clearing peatlands increases CO₂ emissions, nitrous oxide emissions, and losses of dissolved carbon through waterways while also reducing carbon sequestration and methane emissions. CO₂ from peat decomposition is the largest source of GHG emissions from degraded peatlands (Intergovernmental Panel on Climate Change [IPCC] Task Force on National Greenhouse Gas Inventories, 2014; UNEP, 2022). When accumulated organic matter in the peat layer is exposed to air, it begins decomposing more rapidly, emitting CO₂ (Figure 2). Removal of overlying vegetation produces additional GHG emissions while also slowing or stopping carbon uptake and continued peat formation. Whereas emissions from vegetation removal occur rapidly following disturbance, peat decomposition and associated emissions can continue for centuries depending on environmental conditions and peat thickness (Leifield & Menichetti, 2018). Peatland restoration halts these emissions and, eventually, can restore the ecosystem's ability to take up carbon (Doelman et al., 2023; Humpenöder et al., 2020; Mander et al., 2024; Mander et al., 2025; Strack et al., 2022). 

Peatland disturbance and restoration also have complex impacts on nitrous oxide emissions, methane emissions, and carbon loss through waterways (Figure 2; IPCC Task Force on National Greenhouse Gas Inventories, 2014; UNEP, 2022). Intact peatlands are a methane source because methane-producing microbes thrive under waterlogged conditions, so restoring peatlands typically increases methane emissions (Evans et al., 2021; Günther et al., 2020; Huang et al., 2021; Mander et al., 2024). However, restoration typically reduces nitrous oxide emissions from oxidation of the peat layer. 

Figure 2. Intact peatlands (left) are a net greenhouse gas sink, sequestering carbon in peat through photosynthesis but also emitting methane due to waterlogged soils. Drained peatlands (right) are a GHG source, producing emissions from peat decomposition and drainage canals. Modified from IUCN UK Peatland Programme (2024).

Image
Diagram comparing healthy and degraded peatland

Source:  IUCN UK Peatland Programme. (2024, July 10). New briefing addresses the peatlands and methane debate.

Peatlands can be restored to native vegetation or used for paludiculture, the practice of growing crops or trees in saturated conditions (Tan et al., 2021; Temmink et al., 2026). We assume that effective restoration involves both rewetting and re-establishment of perennial vegetation, and in this assessment we did not differentiate between carbon dynamics on peatlands restored to native vegetation and those on peatlands used for paludiculture. Because peatland emissions dynamics, total peatland areas, and the degraded peatland area all vary geographically, we evaluated tropical, subtropical, temperate, and boreal regions separately in this analysis. Most peatlands occur in boreal regions (~310 Mha, or 64% of the total), with another 25% (~121 Mha) in tropical regions (UNEP, 2022; Protect Peatlands). These regions also contain the largest areas of degraded peatlands that can be restored (26 Mha and 19 Mha, respectively; UNEP, 2022).

Halting the ongoing drainage and degradation of peatlands through effective protection, which is covered in Protect Peatlands, is an essential complement to restoration (Austin et al., 2025).

References

Andersen, R., Farrell, C., Graf, M., Muller, F., Calvar, E., Frankard, P., Caporn, S., & Anderson, P. (2017). An overview of the progress and challenges of peatland restoration in Western Europe. Restoration Ecology, 25(2), 271–282. Link to source: https://doi.org/10.1111/rec.12415

Austin, K. G., Elsen, P. R., Coronado, E. N. H., DeGemmis, A., Gallego-Sala, A. V., Harris, L., Kretser, H. E., Melton, J. R., Murdiyarso, D., Sasmito, S. D., Swails, E., Wijaya, A., Winton, R. S., & Zarin, D. (2025). Mismatch between global importance of peatlands and the extent of their protection. Conservation Letters, 18(1), Article e13080. Link to source: https://doi.org/10.1111/conl.13080

Bonn, A., Reed, M. S., Evans, C. D., Joosten, H., Bain, C., Farmer, J., Emmer, I., Couwenberg, J., Moxey, A., Artz, R., Tanneberger, F., von Unger, M., Smyth, M.-A., & Birnie, D. (2014). Investing in nature: Developing ecosystem service markets for peatland restoration. Ecosystem Services, 9, 54–65. Link to source: https://doi.org/10.1016/j.ecoser.2014.06.011

Breznikar, A., Pönisch, D. L., Lorenz, M., Jurasinski, G., Rehder, G., & Voss, M. (2024). Rewetting effects on nitrogen cycling and nutrient export from coastal peatlands to the Baltic Sea. Biogeochemistry, 167(7), 967–987. Link to source: https://doi.org/10.1007/s10533-024-01149-9

Burney, J. A., Davis, S. J., & Lobell, D. B. (2010). Greenhouse gas mitigation by agricultural intensification. Proceedings of the National Academy of Sciences, 107(26), 12052–12057. Link to source: https://doi.org/10.1073/pnas.0914216107 

Busch, J., Bukoski, J. J., Cook-Patton, S. C., Griscom, B., Kaczan, D., Potts, M. D., Yi, Y., & Vincent, J. R. (2024). Cost-effectiveness of natural forest regeneration and plantations for climate mitigation. Nature Climate Change, 14(9), 996–1002. Link to source: https://doi.org/10.1038/s41558-024-02068-1

Dietrich, O., & Behrendt, A. (2022). Wet grassland sites with shallow groundwater conditions: effects on local meteorological characteristics. Water, 14(21), Article 21. Link to source: https://doi.org/10.3390/w14213560

Doelman, J. C., Verhagen, W., Stehfest, E., & Vuuren, D. P. van. (2023). The role of peatland degradation, protection and restoration for climate change mitigation in the SSP scenarios. Environmental Research: Climate, 2(3), Article 035002. Link to source: https://doi.org/10.1088/2752-5295/acd5f4

Evans, C. D., Peacock, M., Baird, A. J., Artz, R. R. E., Burden, A., Callaghan, N., Chapman, P. J., Cooper, H. M., Coyle, M., Craig, E., Cumming, A., Dixon, S., Gauci, V., Grayson, R. P., Helfter, C., Heppell, C. M., Holden, J., Jones, D. L., Kaduk, J., … Morrison, R. (2021). Overriding water table control on managed peatland greenhouse gas emissions. Nature, 593(7860), 548–552. Link to source: https://doi.org/10.1038/s41586-021-03523-1

Global Peatlands Initiative. (2025). Info brief: The peatland breakthrough science-based framework for global peatland targets & guiding principles. Link to source: https://globalpeatlands.org/resource-library/info-brief-peatland-breakthrough-science-based-framework-global-peatland-targets

Goib, B. K., Fitriani, N., Wicaksono, S., & Chitra, J. (2018). Restoring peat, improving welfare, and empowering women: Can we have it all? Link to source: https://wri-indonesia.org/en/insights/restoring-peat-improving-welfare-and-empowering-women-can-we-have-it-all

Granath, G., Moore, P. A., Lukenbach, M. C., & Waddington, J. M. (2016). Mitigating wildfire carbon loss in managed northern peatlands through restoration. Scientific Reports, 6(1), Article 28498. Link to source: https://doi.org/10.1038/srep28498

Günther, A., Barthelmes, A., Huth, V., Joosten, H., Jurasinski, G., Koebsch, F., & Couwenberg, J. (2020). Prompt rewetting of drained peatlands reduces climate warming despite methane emissions. Nature Communications, 11(1), Article 1644. Link to source: https://doi.org/10.1038/s41467-020-15499-z

Harrison, M. E., Ottay, J. B., D’Arcy, L. J., Cheyne, S. M., Anggodo, Belcher, C., Cole, L., Dohong, A., Ermiasi, Y., Feldpausch, T., Gallego-Sala, A., Gunawan, A., Höing, A., Husson, S. J., Kulu, I. P., Soebagio, S. M., Mang, S., Mercado, L., Morrogh-Bernard, H. C., … van Veen, F. J. F. (2020). Tropical forest and peatland conservation in Indonesia: Challenges and directions. People and Nature, 2(1), 4–28. Link to source: https://doi.org/10.1002/pan3.10060

Hein, L., Spadaro, J. V., Ostro, B., Hammer, M., Sumarga, E., Salmayenti, R., Boer, R., Tata, H., Atmoko, D., & Castañeda, J.-P. (2022). The health impacts of Indonesian peatland fires. Environmental Health, 21(1), Article 62. Link to source: https://doi.org/10.1186/s12940-022-00872-w

Helbig, M., Waddington, J. M., Alekseychik, P., Amiro, B., Aurela, M., Barr, A. G., Black, T. A., Carey, S. K., Chen, J., Chi, J., Desai, A. R., Dunn, A., Euskirchen, E. S., Flanagan, L. B., Friborg, T., Garneau, M., Grelle, A., Harder, S., Heliasz, M., … Schulze, C. (2020). The biophysical climate mitigation potential of boreal peatlands during the growing season. Environmental Research Letters, 15(10), Article 104004. Link to source: https://doi.org/10.1088/1748-9326/abab34

Heuts, T. S., Van Der Scheer, O. E., Harpenslager, S. F., Van Diggelen, J. M. H., Smolders, A. J. P., & Fritz, C. (2026). Phosphorus saturation ratio predicts phosphorus mobilization in peat and mineral soils after rewetting. Ecological Engineering, 230, 108019. Link to source: https://doi.org/10.1016/j.ecoleng.2026.108019

Hoffmann, C. C., Petersen, R. J., Genieys, A., Ovesen, N. B., Kjeldgaard, A., Egemose, S., & Zak, D. (2026). Reduced phosphorus loss in a pump‐drained wetland after harvesting and rewetting. Journal of Environmental Quality, 55(2), e70163. Link to source: https://doi.org/10.1002/jeq2.70163

Huang, Y., Ciais, P., Luo, Y., Zhu, D., Wang, Y., Qiu, C., Goll, D. S., Guenet, B., Makowski, D., De Graaf, I., Leifeld, J., Kwon, M. J., Hu, J., & Qu, L. (2021). Tradeoff of CO2 and CH4 emissions from global peatlands under water-table drawdown. Nature Climate Change, 11(7), 618–622. Link to source: https://doi.org/10.1038/s41558-021-01059-w

Humpenöder, F., Karstens, K., Lotze-Campen, H., Leifeld, J., Menichetti, L., Barthelmes, A., & Popp, A. (2020). Peatland protection and restoration are key for climate change mitigation. Environmental Research Letters, 15(10), Article 104093. https://doi.org/10.1088/1748-9326/abae2a

IPCC Task Force on National Greenhouse Gas Inventories. (2014). 2013 supplement to the 2006 IPCC guidelines for national greenhouse gas inventories: Wetlands (T. Hiraishi, T. Krug, K. Tanabe, N. Srivastava, J. Baasansuren, M. Fukuda, & T. G. Troxler, Eds.). Intergovernmental Panel on Climate Change. Link to source: https://www.ipcc.ch/site/assets/uploads/2018/03/Wetlands_Supplement_Entire_Report.pdf

IUCN. Peatlands and Climate Change (IUCN Issues Briefs). (2021). Link to source: https://iucn.org/sites/default/files/2022-04/iucn_issues_brief_peatlands_and_climate_change_final_nov21.pdf

Jong, H. N. (2023). Indonesia's peatland restoration claims in question as fires flare up. Mongabay. Link to source: https://news.mongabay.com/2023/10/indonesias-peatland-restoration-claims-in-question-as-fires-flare-up/

Kiely, L., Spracklen, D. V., Arnold, S. R., Papargyropoulou, E., Conibear, L., Wiedinmyer, C., Knote, C., & Adrianto, H. A. (2021). Assessing costs of Indonesian fires and the benefits of restoring peatland. Nature Communications, 12(1), Article 7044. Link to source: https://doi.org/10.1038/s41467-021-27353-x

Kreyling, J., Tanneberger, F., Jansen, F., van der Linden, S., Aggenbach, C., Blüml, V., Couwenberg, J., Emsens, W.-J., Joosten, H., Klimkowska, A., Kotowski, W., Kozub, L., Lennartz, B., Liczner, Y., Liu, H., Michaelis, D., Oehmke, C., Parakenings, K., Pleyl, E., … Jurasinski, G. (2021). Rewetting does not return drained fen peatlands to their old selves. Nature Communications, 12(1), Article 5693. Link to source: https://doi.org/10.1038/s41467-021-25619-y

Leifeld, J., & Menichetti, L. (2018). The underappreciated potential of peatlands in global climate change mitigation strategies. Nature Communications, 9(1), Article 1071. Link to source: https://doi.org/10.1038/s41467-018-03406-6

Leifeld, J., Wüst-Galley, C., & Page, S. (2019). Intact and managed peatland soils as a source and sink of GHGs from 1850 to 2100. Nature Climate Change, 9(12), 945–947. Link to source: https://doi.org/10.1038/s41558-019-0615-5

Lestari, N. S., Rochmayanto, Y., Salminah, M., Novita, N., Asyhari, A., Gangga, A., Ritonga, R., Yeo, S., & Albar, I. (2024). Opportunities and risk management of peat restoration in Indonesia: Lessons learned from peat restoration actors. Restoration Ecology, 32(1), Article e14054. Link to source: https://doi.org/10.1111/rec.14054

Lloyd, I. L., Thomas, V., Ofoegbu, C., Bradley, A. V., Bullard, P., D’Acunha, B., Delaney, B., Driver, H., Evans, C. D., Faulkner, K. J., Fonvielle, J. A., Francksen, R. M., Friday, L. E., Hose, G., Kaduk, J., Manning, F. R., Morrison, R., Novo, P., Page, S. E., … Balzter, H. (2023). State of Knowledge on UK Agricultural Peatlands for Food Production and the Net Zero Transition. Sustainability, 15(23), Article 16347. Link to source: https://doi.org/10.3390/su152316347

Lobell, D. B., & Villoria, N. B. (2023). Reduced benefits of climate-smart agricultural policies from land-use spillovers. Nature Sustainability, 6, 941–948. Link to source: https://doi.org/10.1038/s41893-023-01112-w

Loisel, J., & Gallego-Sala, A. (2022). Ecological resilience of restored peatlands to climate change. Communications Earth & Environment, 3(1), Article 208. Link to source: https://doi.org/10.1038/s43247-022-00547-x

Mander, Ü., Espenberg, M., Melling, L., & Kull, A. (2024). Peatland restoration pathways to mitigate greenhouse gas emissions and retain peat carbon. Biogeochemistry, 167(4), 523–543. Link to source: https://doi.org/10.1007/s10533-023-01103-1

Mander, Ü., Öpik, M., & Espenberg, M. (2025). Global peatland greenhouse gas dynamics: State of the art, processes, and perspectives. New Phytologist, 246(1), 94–102. Link to source: https://doi.org/10.1111/nph.20436

Marlier, M. E., Liu, T., Yu, K., Buonocore, J. J., Koplitz, S. N., DeFries, R. S., Mickley, L. J., Jacob, D. J., Schwartz, J., Wardhana, B. S., & Myers, S. S. (2019). Fires, smoke exposure, and public health: An integrative framework to maximize health benefits from peatland restoration. GeoHealth, 3(7), 178–189. Link to source: https://doi.org/10.1029/2019GH000191

Melton, J. R., Chan, E., Millard, K., Fortier, M., Winton, R. S., Martín-López, J. M., Cadillo-Quiroz, H., Kidd, D., & Verchot, L. V. (2022). A map of global peatland extent created using machine learning (Peat-ML). Geoscientific Model Development, 15(12), 4709–4738. Link to source: https://doi.org/10.5194/gmd-15-4709-2022

Merten, J., Nielsen, J. Ø., Rosyani, & Faust, H. (2021). Climate change mitigation on tropical peatlands: A triple burden for smallholder farmers in Indonesia. Global Environmental Change, 71, Article 102388. Link to source: https://doi.org/10.1016/j.gloenvcha.2021.102388

Minasny, B., Adetsu, D. V., Aitkenhead, M., Artz, R. R. E., Baggaley, N., Barthelmes, A., Beucher, A., Caron, J., Conchedda, G., Connolly, J., Deragon, R., Evans, C., Fadnes, K., Fiantis, D., Gagkas, Z., Gilet, L., Gimona, A., Glatzel, S., Greve, M. H., … Zak, D. (2024). Mapping and monitoring peatland conditions from global to field scale. Biogeochemistry, 167(4), 383–425. Link to source: https://doi.org/10.1007/s10533-023-01084-1

Minayeva, T. Yu., Bragg, O. M., & Sirin, A. A. (2017). Towards ecosystem-based restoration of peatland biodiversity. Mires and Peat, 19, 1–36. Link to source: https://doi.org/10.19189/MaP.2013.OMB.150

Murdiyarso, D., Lilleskov, E., & Kolka, R. (2019). Tropical peatlands under siege: The need for evidence-based policies and strategies. Mitigation and Adaptation Strategies for Global Change, 24(4), 493–505. Link to source: https://doi.org/10.1007/s11027-019-9844-1

Oestmann, J., Dettmann, U., Düvel, D., & Tiemeyer, B. (2022). Experimental warming increased greenhouse gas emissions of a near-natural peatland and Sphagnum farming sites. Plant and Soil, 480(1), 85–104. Link to source: https://doi.org/10.1007/s11104-022-05561-8

Olson, D. M., Dinerstein, E., Wikramanayake, E. D., Burgess, N. D., Powell, G. V. N., Underwood, E. C., D’amico, J. A., Itoua, I., Strand, H. E., Morrison, J. C., Loucks, C. J., Allnutt, T. F., Ricketts, T. H., Kura, Y., Lamoreux, J. F., Wettengel, W. W., Hedao, P., & Kassem, K. R. (2001). Terrestrial ecoregions of the world: A new map of life on Earth: A new global map of terrestrial ecoregions provides an innovative tool for conserving biodiversity. BioScience, 51(11), 933–938. Link to source: https://doi.org/10.1641/0006-3568(2001)051[0933:TEOTWA]2.0.CO;2

Pan, Y., Birdsey, R. A., Phillips, O. L., Houghton, R. A., Fang, J., Kauppi, P. E., Keith, H., Kurz, W. A., Ito, A., Lewis, S. L., Nabuurs, G.-J., Shvidenko, A., Hashimoto, S., Lerink, B., Schepaschenko, D., Castanho, A., & Murdiyarso, D. (2024). The enduring world forest carbon sink. Nature, 631(8021), 563–569. Link to source: https://doi.org/10.1038/s41586-024-07602-x

Peacock, M., Audet, J., Bastviken, D., Futter, M. N., Gauci, V., Grinham, A., Harrison, J. A., Kent, M. S., Kosten, S., Lovelock, C. E., Veraart, A. J., & Evans, C. D. (2021). Global importance of methane emissions from drainage ditches and canals. Environmental Research Letters, 16(4), Article 044010. Link to source: https://doi.org/10.1088/1748-9326/abeb36

Posa, M. R. C., Wijedasa, L. S., & Corlett, R. T. (2011). Biodiversity and conservation of tropical peat swamp forests. BioScience, 61(1), 49–57. Link to source: https://doi.org/10.1525/bio.2011.61.1.10

Renou-Wilson, F., Moser, G., Fallon, D., Farrell, C. A., Müller, C., & Wilson, D. (2019). Rewetting degraded peatlands for climate and biodiversity benefits: Results from two raised bogs. Ecological Engineering, 127, 547–560. Link to source: https://doi.org/10.1016/j.ecoleng.2018.02.014

Ritson, J. P., Bell, M., Brazier, R. E., Grand-Clement, E., Graham, N. J. D., Freeman, C., Smith, D., Templeton, M. R., & Clark, J. M. (2016). Managing peatland vegetation for drinking water treatment. Scientific Reports, 6(1), Article 36751. Link to source: https://doi.org/10.1038/srep36751

Robinson, N., Drever, C. R., Gibbs, D. A., Lister, K., Esquivel-Muelbert, A., Heinrich, V., Ciais, P., Silva-Junior, C. H. L., Liu, Z., Pugh, T. A. M., Saatchi, S., Xu, Y., & Cook-Patton, S. C. (2025). Protect young secondary forests for optimum carbon removal. Nature Climate Change, 15, 793–800. Link to source: https://doi.org/10.1038/s41558-025-02355-5

Salmayenti, R., Holden, J., Baird, A. J., Rigby, R., & Spracklen, D. V. (2026). Tropical peatland restoration reduces fire occurrence. Geophysical Research Letters, 53(11), e2025GL121564. Link to source: https://doi.org/10.1029/2025GL121564

Schulz, C., Martín Brañas, M., Núñez Pérez, C., Del Aguila Villacorta, M., Laurie, N., Lawson, I. T., & Roucoux, K. H. (2019). Uses, cultural significance, and management of peatlands in the Peruvian Amazon: Implications for conservation. Biological Conservation, 235, 189–198. Link to source: https://doi.org/10.1016/j.biocon.2019.04.005

Silverthorn, T., Aberg, D., Baker, F., Bell, C., Evans, C. D., Gurd, C., Holman, I., Howell, G., McEwen, A., Morrison, R., Oakley, J., Southon, F., & Peacock, M. (2026). Land‐use effects on surface water quality in temperate lowland peatlands. Global Change Biology, 32(7), e70988. Link to source: https://doi.org/10.1111/gcb.70988

Spitzer, K., & Danks, H. V. (2006). Insect biodiversity of boreal peat bogs. Annual Review of Entomology, 51, 137–161. Link to source: https://doi.org/10.1146/annurev.ento.51.110104.151036

Strack, M., Davidson, S. J., Hirano, T., & Dunn, C. (2022). The Potential of Peatlands as Nature-Based Climate Solutions. Current Climate Change Reports, 8(3), 71–82. Link to source: https://doi.org/10.1007/s40641-022-00183-9

Strack, M., Keith, A. M., & Xu, B. (2014). Growing season carbon dioxide and methane exchange at a restored peatland on the Western Boreal Plain. Ecological Engineering, 64, 231–239. Link to source: https://doi.org/10.1016/j.ecoleng.2013.12.013

Strack, M., & Zuback, Y. C. A. (2013). Annual carbon balance of a peatland 10 yr following restoration. Biogeosciences, 10(5), 2885–2896. Link to source: https://doi.org/10.5194/bg-10-2885-2013

Tan, Z. D., Lupascu, M., & Wijedasa, L. S. (2021). Paludiculture as a sustainable land use alternative for tropical peatlands: A review. Science of The Total Environment, 753, Article 142111. Link to source: https://doi.org/10.1016/j.scitotenv.2020.142111

Temmink, R. J. M., Lång, K., Vroom, R. J. E., Leifeld, J., Fritz, C., Zeug, W., Thrän, D., Kleinspehn, C., Gaudig, G., Neubert, J., Kreyling, J., Rhymes, J. M., Evans, C. D., Kotowski, W., Nordt, A., & Tanneberger, F. (2026). Agriculture on wet peatlands: The sustainability potential of paludiculture. Agricultural Systems, 231, Article 104561. Link to source: https://doi.org/10.1016/j.agsy.2025.104561

Terzano, D., Attorre, F., Parish, F., Moss, P., Bresciani, F., Cooke, R., & Dargusch, P. (2022). Community-led peatland restoration in Southeast Asia: 5Rs approach. Restoration Ecology, 30(8), Article e13642. Link to source: https://doi.org/10.1111/rec.13642

The Gecko Project. (2023). Success of Indonesian peatland restoration in doubt as fire season sets in. Link to source: https://thegeckoproject.org/articles/success-of-indonesian-peatland-restoration-in-doubt-as-fire-season-sets-in/

Thornton, S. A., Setiana, E., Yoyo, K., Dudin, Yulintine, Harrison, M. E., Page, S. E., & Upton, C. (2020). Towards biocultural approaches to peatland conservation: The case for fish and livelihoods in Indonesia. Environmental Science & Policy, 114, 341–351. Link to source: https://doi.org/10.1016/j.envsci.2020.08.018

Toumbourou, T. D., Lestari, S., Yuwati, T. W., Treby, S., Winarno, B., Rachmanadi, D., Idrus, N. I., Sakuntaladewi, N., Budiningsih, K., Grover, S. P. P., & Rawluk, A. (2024). Principles for equitable and resilient tropical peatland restoration in Central Kalimantan, Indonesia. Restoration Ecology, 32(7), Article e14221. Link to source: https://doi.org/10.1111/rec.14221

Tubiello, F. N., Conchedda, G., Casse, L., Hao, P., De Santis, G., & Chen, Z. (2023). A new cropland area database by country circa 2020. Earth System Science Data, 15(11), 4997–5015. Link to source: https://doi.org/10.5194/essd-15-4997-2023

Uda, S. K., Hein, L., & Atmoko, D. (2019). Assessing the health impacts of peatland fires: A case study for Central Kalimantan, Indonesia. Environmental Science and Pollution Research, 26(30), 31315–31327. Link to source: https://doi.org/10.1007/s11356-019-06264-x

Uda, S. K., Hein, L., & Adventa, A. (2020). Towards better use of Indonesian peatlands with paludiculture and low-drainage food crops. Wetlands Ecology and Management, 28(3), 509–526. Link to source: https://doi.org/10.1007/s11273-020-09728-x

UNEP. (2022). Global peatlands assessment: The state of the world’s peatlands: Evidence for action toward the conservation, restoration, and sustainable management of peatlands. Link to source: https://www.unep.org/resources/global-peatlands-assessment-2022

van der Laan, A., van Dijk, J., Rebel, K. T., & Wassen, M. J. (2024). Rewet without regret? Nutrient dynamics in fen peat exposed to different rewetting degrees. Biogeochemistry, 167(5), 705–721. Link to source: https://doi.org/10.1007/s10533-024-01139-x

Vanselow-Algan, M., Schmidt, S. R., Greven, M., Fiencke, C., Kutzbach, L., & Pfeiffer, E.-M. (2015). High methane emissions dominated annual greenhouse gas balances 30 years after bog rewetting. Biogeosciences, 12(14), 4361–4371. Link to source: https://doi.org/10.5194/bg-12-4361-2015

Ward, C., Stringer, L. C., Warren-Thomas, E., Agus, F., Crowson, M., Hamer, K., Hariyadi, B., Kartika, W. D., Lucey, J., McClean, C., Nurida, N. L., Petorelli, N., Pratiwi, E., Saad, A., Andriyani, R., Ariani, T., Sriwahyuni, H., & Hill, J. K. (2020). Smallholder perceptions of land restoration activities: Rewetting tropical peatland oil palm areas in Sumatra, Indonesia. Regional Environmental Change, 21(1), Article 1. Link to source: https://doi.org/10.1007/s10113-020-01737-z

Wetlands International. (2025). The Peatland Breakthrough: Science-Based Framework for Global Peatland Targets and Guiding Principles. Link to source: https://www.wetlands.org/the-peatland-breakthrough/

Wilson, D., Farrell, C. A., Fallon, D., Moser, G., Müller, C., & Renou-Wilson, F. (2016). Multiyear greenhouse gas balances at a rewetted temperate peatland. Global Change Biology, 22(12), 4080–4095. Link to source: https://doi.org/10.1111/gcb.13325

Worrall, F., Howden, N. J. K., Burt, T. P., Rico-Ramirez, M. A., & Kohler, T. (2022). Local climate impacts from ongoing restoration of a peatland. Hydrological Processes, 36(3), Article e14496. Link to source: https://doi.org/10.1002/hyp.14496

Xu, J., Morris, P. J., Liu, J., & Holden, J. (2018a). Hotspots of peatland-derived potable water use identified by global analysis. Nature Sustainability, 1(5), 246–253. Link to source: https://doi.org/10.1038/s41893-018-0064-6

Xu, J., Morris, P. J., Liu, J., & Holden, J. (2018b). PEATMAP: Refining estimates of global peatland distribution based on a meta-analysis. CATENA, 160, 134–140. Link to source: https://doi.org/10.1016/j.catena.2017.09.010

Yu, Z., Loisel, J., Brosseau, D. P., Beilman, D. W., & Hunt, S. J. (2010). Global peatland dynamics since the Last Glacial Maximum. Geophysical Research Letters, 37(13). Link to source: https://doi.org/10.1029/2010GL043584

Yuwati, T. W., & Pratiwi, D. (2022). Paludiculture: Peatland utilization for food security. IOP Conference Series: Earth and Environmental Science, 1107(1), Article 012075. Link to source: https://doi.org/10.1088/1755-1315/1107/1/012075

Zeng, Y., Sarira, T. V., Carrasco, L. R., Chong, K. Y., Friess, D. A., Lee, J. S. H., Taillardat, P., Worthington, T. A., Zhang, Y., & Koh, L. P. (2020). Economic and social constraints on reforestation for climate mitigation in Southeast Asia. Nature Climate Change, 10(9), 842–844. Link to source: https://doi.org/10.1038/s41558-020-0856-3

Ziegler, R., Wichtmann, W., Abel, S., Kemp, R., Simard, M., & Joosten, H. (2021). Wet peatland utilisation for climate protection – An international survey of paludiculture innovation. Cleaner Engineering and Technology, 5, Article 100305. Link to source: https://doi.org/10.1016/j.clet.2021.100305

Credits

Lead Fellow

  • Avery W. Driscoll, Ph.D.

Contributors

  • Ruthie Burrows, Ph.D.

  • James Gerber, Ph.D.

  • Daniel Jasper

  • Alex Sweeney

Internal Reviewers

  • Christina Richardson, Ph.D.

  • Christina Swanson, Ph.D. 

  • Paul C. West, Ph.D.

Effectiveness

Using the IPCC’s Tier 1 methodology (IPCC Task Force on National Greenhouse Gas Inventories, 2014), we estimated the net effectiveness of peatland restoration at 19.0–56.0 t CO₂‑eq /ha/yr (100-yr basis), depending on the climate zone (Table 1a–d). 

The primary pathway by which peatland restoration reduces emissions is by slowing or stopping CO₂ emissions associated with loss of peat through oxidation. Because peat oxidation occurs more rapidly in warmer climates, the effectiveness of restoration is higher in tropical and subtropical regions than in temperate and boreal regions (IPCC Task Force on National Greenhouse Gas Inventories, 2014). We estimated that drained peatlands emit 15.1–49.7 t CO₂‑eq /ha/yr, while restored peatlands can range from carbon sinks (–1.6 t CO₂‑eq /ha/yr on average in the boreal) to small sources (0.5 t CO₂‑eq /ha/yr on average in temperate areas). However, site-level variability is high, with a recent review reporting values ranging from a sink of –42 t CO₂‑eq /ha/yr (in a restored Canadian sphagnum bog) to a source of 8 t CO₂‑eq /ha/yr (at a restored German sphagnum paludiculture site) (Mander et al., 2024; Oestmann et al., 2022; Strack et al., 2014).

Peatland restoration influences GHG emissions from several other pathways as well:

  • Revegetation can increase carbon sequestration in biomass. Here, we included carbon uptake in vegetation only for degraded peatlands that were originally forested (Olson et al., 2001) and are currently used for agriculture (UNEP, 2022), using reforestation carbon uptake rates from Robinson et al. (2025) and Busch et al. (2024) (see Restore Forests). Carbon uptake from reforestation on peatlands contributes 3.2–8.3 CO₂‑eq /ha/yr (100-yr basis) on average within each climate zone, with larger emissions benefits in warmer climates. 
  • Nitrous oxide emissions associated with peat oxidation are reduced (IPCC Task Force on National Greenhouse Gas Inventories, 2014). 
  • Off-site CO₂ emissions from losses of dissolved organic carbon through drainage canals and surface waterways are reduced (IPCC Task Force on National Greenhouse Gas Inventories, 2014). 
  • Methane emissions arising from drainage canals are eliminated when canals are filled (IPCC Task Force on National Greenhouse Gas Inventories, 2014). However, methane emissions from canals can persist if they are simply blocked or partially filled (Peacock et al., 2021). These emissions remain uncertain, and our effectiveness estimates rely on the optimistic assumption that canals are fully filled, eliminating canal methane emissions.
  • Methane emissions from the peat itself typically increase as the peat returns to an anoxic state. Methane emissions from the surface of restored peatlands are estimated at 1.5–5.7 t CO₂‑eq /ha/yr (100-yr basis), compared to 0.1–0.2 t CO₂‑eq /ha/yr (100-yr basis) for drained peatlands (IPCC Task Force on National Greenhouse Gas Inventories, 2014). This increase in methane emissions is included in the effectiveness estimates. 
  • Restoring peatlands currently used for crop production can displace that production and expansion of agricultural land use elsewhere, producing emissions from land use change (Burney et al., 2010; Lobell & Villoria, 2023). We used a very simple approach to estimate emissions from this indirect land use change, assuming that the production lost from peatland restoration is replaced on non-peat ecosystems within the same climate zone at the average yield (see Methodology for additional details). These indirect land use change emissions, ranging from 1.7–4.9 t CO₂‑eq /ha/yr across ecosystems, slightly reduce the effectiveness of restoring peatlands. 

Table 1. Effectiveness at reducing emissions and, in some cases, removing carbon.

Unit: t CO₂‑eq /ha/yr, 100-yr basis

Estimate 19.0

Unit: t CO₂‑eq /ha/yr, 100-yr basis

Estimate 29.7

Unit: t CO₂‑eq /ha/yr, 100-yr basis

Estimate 47.8

Unit: t CO₂‑eq /ha/yr, 100-yr basis

Estimate 56.0
Left Text Column Width
Cost

The costs of peatland restoration are highly uncertain and variable. We estimated that the median cost of peatland restoration is approximately US$55/t CO₂‑eq (2023 US$), or US$1,884/ha restored (Table 2). These estimates are based on data from only three countries. In Scotland, peatland restoration costs are submitted as part of the Peatland Action Programme, which provides grants for peat restoration (Glenk et al., 2022). Based on data from 300 sites, they report a median cost of US$1,884/ha (equal to US$55/t CO₂‑eq , 100-year basis). In the United States, the U.S. Department of Agriculture developed models of restoration costs based on contracts with agricultural landowners for wetland restoration through the Wetlands Reserve Program, with costs ranging from US$170/ha to US$6,100/ha depending on the region. All other cost data used in our calculations are from Indonesia, with estimates ranging from US$237/ha to more than US$25,000/ha (Hansson & Dargusch 2018; Tan et al., 2022). Peatland restoration costs include the costs of restoring the natural hydrologic condition and of revegetation, and depend largely on the size of canals that must be dammed or filled (Hansson & Dargusch 2018). These estimates do not include forgone revenues from economic uses of drained peatlands, nor do they include potential new revenues from paludiculture, tourism, or ecosystem service payments.

Table 2. Cost per unit of climate impact.

Unit: 2023 US$/t CO₂‑eq , 100-yr basis

Median 55
Left Text Column Width

Methods and Supporting Data

Learning Curve

We define a learning curve as falling costs with increased adoption. There is no evidence that the costs of peatland rewetting and revegetation will fall with increasing adoption. Therefore, there is no learning curve for this solution.

Speed of Action

Speed of action refers to how quickly a climate solution physically affects the atmosphere after it is deployed. This is different from speed of deployment, which is the pace at which solutions are adopted.

At Project Drawdown, we define the speed of action for each climate solution as emergency brake, gradual, or delayed. Restore Peatlands is a GRADUAL climate solution, because the primary mode of action is a reduction in emissions that would otherwise occur on an annual basis over a long time. It has a steady, linear impact on the atmosphere. 

Caveats

GHG emissions dynamics of rewetted peatlands remain uncertain because they can be highly variable depending on site level factors, such as land use history, type of restoration interventions, and environmental conditions (Mander et al., 2024). 

Effective peatland restoration faces many barriers, including cost of restoration, disruption to economic use, willingness of local community and landowners to support restoration, and technical challenges, particularly on severely subsided sites (Andersen et al., 2017; Harrison et al., 2020; Lestari et al., 2024; Zeng et al., 2020).

Peatland restoration, like other nature-based climate solutions, faces concerns related to the permanence of emissions reductions and carbon sequestration (Loisel & Gallego-Sala, 2022; Turetsky et al., 2015). Restored peatlands are vulnerable to drainage or clearing, which can be mitigated by coupling restoration with durable, long-term protections. Restored peatlands are also vulnerable to natural disturbances, such as fires and droughts, though they tend to be more resilient than drained peatlands (Granath et al., 2016). 

Current Adoption

Data on the current adoption of peatland restoration are very sparse, noncentralized, and largely not validated. Therefore, we do not provide a global estimate of the currently restored area. We found two countries for which there are national-scale estimates of restored area. The United Kingdom’s Peatland Programme reports that restoration activities were undertaken on 254,254 ha of peatland between the 1990s and 2024 (IUCN UK Peatland Programme, 2024). In Indonesia, the Ministry of Environment and Forestry reported 3.7 Mha of peatland restoration in a 2022 report based on estimates of the area with a water table depth of 40 cm or less as of December, 2021. However, only 6,000 of these ha were reported to have undergone some form of vegetation restoration, and water table depth is a limited proxy for peatland restoration status because it fluctuates substantially over time due to natural variability in water supplies. For instance, the area meeting the water table threshold had fallen to just 0.5 Mha by June 2022 (Jong, 2023; The Gecko Project, 2022). Based on published estimates, it seems likely that the peatland area that has been successfully restored is in the range of 0.5–5Mha.

Adoption Trend

Peatland restoration data are very limited and rarely temporally resolved. The available data are insufficient to calculate an adoption trend for this solution.

Adoption Ceiling

We estimated the adoption ceiling for peatland restoration to be 56.9 Mha (Table 3). This is the area of peatland that has been drained or converted to other land uses (UNEP, 2022) and represents ~12% of the total global peatland area. Approximately 37.8 Mha of drained peatlands are currently used for agriculture (croplands or grazing), 18.1 Mha are used for forestry, and 1.0 Mha are used for peat extraction (UNEP, 2022). Although restoring peatlands will involve displacing some of these activities to other lands. Though drained peatlands can be particularly high-yielding (Lloyd et al., 2023), these are relatively small areas in the context of global land use. For example, agricultural peatlands (including both croplands and grazing lands) represent less than 3% of total global croplands, which were estimated to cover ~1,500 Mha circa 2020 (Tubiello et al., 2023). Indirect land use change emissions arising from relocation of croplands are accounted for in our effectiveness estimates.

Drained peatlands are concentrated in boreal (26.3 Mha) and tropical regions (18.5 Mha), with smaller areas in temperate (9.9 Mha) and subtropical (2.1 Mha) regions (UNEP, 2022). The proportion of peatlands that have been drained is largest in temperate regions (28%), followed by the tropics (15%), subtropics (14%), and then the boreal (8%).

These values reflect best estimates of drained peatland area from the Global Peatland Assessment (UNEP, 2022). However, there is substantial uncertainty in the distribution of intact and drained peatlands, and efforts to map global peatlands are ongoing (Melton et al., 2022; Minasny et al., 2024). 

Table 3. Adoption ceiling.

Unit: ha available for restoration

Estimate 26,300,000

Unit: ha available for restoration

Estimate 9,930,000

Unit: ha available for restoration

Estimate 2,140,000

Unit: ha available for restoration

Estimate 18,500,000

Unit: ha available for restoration

Estimate 56,900,00
Left Text Column Width
Achievable Adoption

We assumed an achievable range of 25–50% of the adoption ceiling, equal to 14.2 – 28.4 Mha of peatland restoration (Table 4a–e). 

The momentum behind peatland restoration has been growing rapidly over the past several decades, including major international efforts such as the U.N. Decade on Ecosystem Restoration (2021–2030), the Global Peatlands Initiative, and the Peatland Breakthrough (Global Peatlands Initiative, 2025; UNEP, 2022; Wetlands International, 2025). Our estimate of the high achievable level of peatland restoration roughly aligns with the 30 Mha target of the Peatland Breakthrough, a global initiative to guide peatland restoration through unified targets and restoration principles that was launched at COP30 (Global Peatlands Initiative, 2025). Given that the current area successfully restored is likely in the range of 0.5–5 Mha, both the low and high achievable estimates will require an ambitious expansion of peatland restoration. 

Peatland restoration will very likely need to be directly incentivized through payments for ecosystem services such as emissions reductions, water quality, flood management, and/or biodiversity to achieve this level of adoption (Bonn et al., 2014). Paludiculture, or using restored peatlands for production of commodities that tolerate saturated conditions, may also boost restoration (Mander et al., 2024; Tan et al., 2021; Ziegler et al., 2021). In temperate and lower boreal regions, paludiculture is typically characterized by herbaceous vegetation, including cattails, reeds, canary grass, sedges, and alder, used for grazing or biomass and by cultivation of sphagnum for horticultural use (Temmink et al., 2026). Additional research is needed to develop suitable paludiculture systems for restored tropical peatlands (Uda et al., 2020), which are typically characterized by tree cover rather than herbaceous plants. Sustainable gathering and hunting of native peatland species is a form of paludiculture that has been practiced by indigenous communities for centuries, and tree crops such as sago and jelutong show some potential for economically viable paludiculture (Tan et al., 2021; Ziegler et al, 2021).

Table 4. Range of achievable adoption levels.

Unit: ha

Current adoption NA
Achievable – low 6,560,000
Achievable – high 13,100,000
Adoption ceiling 26,300,000

Unit: ha

Current adoption NA
Achievable – low 2,480,000
Achievable – high 4,960,000
Adoption ceiling 9,930,000

Unit: ha

Current adoption NA
Achievable – low 535,000
Achievable – high 1,070,000
Adoption ceiling 2,140,000

Unit: ha

Current adoption NA
Achievable – low 4,630,000
Achievable – high 9,260,000
Adoption ceiling 18,500,000

Unit: ha

Current adoption NA
Achievable – low 14,200,000
Achievable – high 28,400,000
Adoption ceiling 56,900,000
Left Text Column Width

We estimated that peatland restoration could sequester 0.48 Gt CO₂‑eq/yr at the low-achievable adoption scenario, 0.97 Gt CO₂‑eq/yr at the high-achievable adoption scenario, and 1.93 Gt CO₂‑eq/yr at the adoption ceiling (Table 5a–e). Our estimate of the climate impact at the adoption ceiling is approximately in line with literature estimates of annual emissions from drained peatlands (e.g., 1.98 Gt CO₂‑eq/yr from Leifield & Menichetti [2018]). 

Although the total area available for restoration is largest in the boreal biome, more than half of the adoption ceiling climate impact occurs in the tropics due to larger per-hectare emissions reductions from peatland restoration in warmer climates. Restoration in boreal regions is estimated to provide 26% of the climate impact at the adoption ceiling, with an additional 15% and 5% of the climate impact available through temperate and subtropical peatland restoration, respectively. 

Table 5. Climate impact at different levels of adoption.

Unit: Gt CO₂‑eq/yr, 100-year basis

Current adoption NA
Achievable – low 0.125
Achievable – high 0.249
Adoption ceiling 0.498

Unit: Gt CO₂‑eq/yr, 100-year basis

Current adoption NA
Achievable – low 0.074
Achievable – high 0.148
Adoption ceiling 0.295

Unit: Gt CO₂‑eq/yr, 100-year basis

Current adoption NA
Achievable – low 0.026
Achievable – high 0.051
Adoption ceiling 0.102

Unit: Gt CO₂‑eq/yr, 100-year basis

Current adoption NA
Achievable – low 0.259
Achievable – high 0.518
Adoption ceiling 1.037

Unit: Gt CO₂‑eq/yr, 100-year basis

Current adoption NA
Achievable – low 0.483
Achievable – high 0.966
Adoption ceiling 1.932
Left Text Column Width
Additional Benefits

Extreme Weather Events

Peatlands protection can help communities adapt to extreme weather, though restored peatlands may be more sensitive than undisturbed peatlands to extreme weather (Loisel & Gallego-Sala, 2022). Because peatlands regulate water flows, they can reduce the risk of droughts and floods (IUCN, 2021; Ritson et al., 2016). Evidence suggests that peatlands can cool the immediate environment, lowering daytime temperatures and reducing daily temperature extremes (Dietrich & Behrendt, 2022; Helbig et al., 2020; Worrall et al., 2022).

Income and Work

Peatlands support the livelihoods of nearby communities, especially those in low- and middle-income countries. In the peatlands of the Amazon and Congo basins, fishing livelihoods depend on aquatic wildlife (Thornton et al., 2020). Peatlands in the Peruvian Amazon provide important goods for trade, such as palm fruit and timber and are used for hunting (Schulz et al., 2019). Peatlands can also support the livelihoods of women, allowing them to access more economic opportunities and contributing to gender equality. For example, in Indonesia women use raw materials from peatlands to create mats sold for use in significant events such as births, weddings, and burials (Goib et al., 2018). Selling commodities made from peatland materials increases household income and can increase the position of women to make decisions in a household (Goib et al., 2018).   

Restoring peatlands may come with some trade-offs to livelihoods if it prevents other productive uses. Paludiculture may help local communities to maintain their livelihoods on restored peatlands (Temmink et al., 2026; Yuwati & Pratiwi, 2022). Case studies in Southeast Asia have found that community-led restoration projects that consider local context and livelihoods are more successful than conventional restoration projects (Terzano et al., 2022).

Peatlands mitigate exposure to air pollution and can save money from reduced health-care expenditures (Kiely et al., 2021).

Health

When peatlands are drained, they are susceptible to fire, and rewetting reduces fire risk (Salmayenti et al., 2026). Peatland fires can contribute to air pollution because of the way these fires smolder (Uda et al., 2019). Smoke and pollutants, particularly PM2.5, from peatland fires can harm respiratory health and lead to premature mortality (Marlier et al., 2019). A study in Indonesia estimated peatland fires contribute to the premature mortality of about 33,100 adults and about 2,900 infants annually (Hein et al., 2022). Researchers have linked exposure to PM2.5 from peatland fires to increased hospitalizations, asthma, and lost workdays (Hein et al., 2022). 

Nature Protection

Peatlands support diverse flora and wildlife (UNEP, 2022; Minayeva et al., 2017; Posa et al., 2011), including many rare and threatened species (Posa et al., 2011). A study of Indonesian peat swamps found that the IUCN Red List classified approximately 45% of mammals and 33% of birds living in these ecosystems as threatened, vulnerable, or endangered (Posa et al., 2011). Peatlands also support a variety of insect species (Spitzer & Danks, 2006). Because of their sensitivity to environmental changes, some peatland insects can act as indicators of peatland health and play a role in conservation (Spitzer & Danks, 2006).

While restored peatlands are more biodiverse than degraded ecosystems, restored peatlands are often less biodiverse than intact peatlands (Renou-Wilson et al., 2019). For example, a large study of peatlands in Europe found that rewetting increased biodiversity of peatlands, but plant composition was different from natural, intact peatlands (Kreyling et al., 2021). Biodiversity benefits have also been identified in European paludiculture systems, though more research on the biodiversity impacts of paludiculture is needed (Martens et al., 2023).

Water Resources

Peatlands can filter water pollutants and improve water quality and are important sources of potable water (Minayeva et al., 2017). Xu et al. (2018a) estimated that peatlands store about 10% of freshwater globally, not including glacial water. Peatlands provide potable water for about 71.4 million people in the United Kingdom and Ireland (Xu et al., 2018a). 

Water Quality

For a description of water quality benefits, please refer to the “water resources” subsection above. 

Risks

Where peatland restoration involves removing agricultural or forestry land from economic use, it risks compromising the livelihoods of local communities (Lestari et al., 2024; Merten et al., 2021; Ward et al., 2020). Close collaboration with local communities can facilitate procedural equity and enable positive, durable outcomes for both the ecosystem and the community (e.g., Toumbourou et al., 2024). Additionally, restoring peatlands can trigger displacement of production activities onto other lands, resulting in land clearing elsewhere (i.e., leakage). We account for the emissions impacts of leakage in our effectiveness calculations. While restoration can reduce emissions associated with agriculture locally, these emissions can occur elsewhere if the production area shifts. Paludiculture can reduce the risk of negative economic impacts and leakage (Mander et al., 2024; Tan et al., 2021; Ziegler et al., 2021). 

Though healthy peatlands provide water quality benefits, peatland rewetting can mobilize nutrients and other contaminants into surface waters (Breznikar et al., 2024; Heuts et al., 2026; Silverthorn et al., 2026; van der Laan). Studies have found increases in phosphorus, nitrogen, and heavy metal loads from peatland rewetting, though effects are mixed. Water quality monitoring and appropriate mitigation near restoration sites can help manage water quality risks (e.g. Hoffman et al., 2026).

Interactions with Other Solutions

Reinforcing

Peatland restoration can improve the health and function of adjacent ecosystems that are being protected or restored.

Competing

These solutions are all suitable to implement on degraded peatland, and thus are in competition with restoration.

Dashboard

Solution Basics

ha under restoration

t CO₂-eq (100-yr)/unit/yr
19
units
Current Not Determined 06.56×10⁶1.31×10⁷
Achievable (Low to High)

Climate Impact

Gt CO₂-eq (100-yr)/yr
Current Not Determined 0.1250.249
US$ per t CO₂-eq
55
Delayed

CO₂ , N₂O

Solution Basics

ha under restoration

t CO₂-eq (100-yr)/unit/yr
29.7
units
Current Not Determined 02.48×10⁶4.96×10⁶
Achievable (Low to High)

Climate Impact

Gt CO₂-eq (100-yr)/yr
Current Not Determined 0.0740.148
US$ per t CO₂-eq
55
Delayed

CO₂ , N₂O

Solution Basics

ha under restoration

t CO₂-eq (100-yr)/unit/yr
47.8
units
Current 0535,0001.07×10⁶
Achievable (Low to High)

Climate Impact

Gt CO₂-eq (100-yr)/yr
Current Not Determined 0.0260.051
US$ per t CO₂-eq
55
Delayed

CO₂ , N₂O

Solution Basics

ha under restoration

t CO₂-eq (100-yr)/unit/yr
56
units
Current 04.63×10⁶9.26×10⁶
Achievable (Low to High)

Climate Impact

Gt CO₂-eq (100-yr)/yr
Current Not Determined 0.2590.518
US$ per t CO₂-eq
55
Delayed

CO₂ , N₂O

Trade-offs

Peatland restoration can divert resources from other climate solutions, including protecting intact peatlands. Preventing peatland drainage is typically more cost effective and offers larger emissions benefits than does peatland restoration (see Protect Peatlands). Restoration should therefore complement, rather than compete with, efforts to reduce further disturbance of intact peatlands.

Action Word
Restore
Solution Title
Peatlands
Classification
Highly Recommended

Lawmakers and Policymakers

  • Conduct comprehensive surveys and scientific assessments of national peatlands; work with scientists to identify which peatlands are most at risk of irreversible damage, which are likely to remain intact, and which are suitable candidates for restoration using combined techniques from fields such as paleoecology, ecology, and climate science.
  • Set clear, evidence-based guidelines, definitions, and goals for restoration; incorporate peatland restoration goals into national climate plans; set comprehensive definitions of restoration that address rewetting, revegetation, revitalization, and reducing fires.
  • Coordinate peatland restoration horizontally (e.g., across agencies) and vertically (e.g., across subnational, national, and international levels), ensuring an inclusive process for local and Indigenous communities.
  • Ensure public procurement uses peat-free products and supply chains.
  • Ban or regulate intact peatland draining; require or incentivize filling or blocking existing canals while compensating farmers for income losses; use sustainable, environmentally friendly, and durable materials to block canals.
  • Grant protected status to peatlands in the process of being restored to help mitigate future land conversions; seek to connect restoration projects with existing protected areas; ensure robust enforcement mechanisms; streamline process for granting legal protections for peatlands.
  • Strengthen land tenure laws; grant Indigenous communities full property rights and autonomy; support Indigenous communities in monitoring and managing peatland restoration projects; encourage or require the demarcation of property, communal boundaries, and protected areas to help solidify and clarify land tenure rights.
  • Ensure projects operating in or with Indigenous communities only do so under free, prior, and informed consent (FPIC); codify FPIC into legal systems.
  • Create financial incentives for peatland restoration and paludiculture, such as direct payments, payment for ecosystem services (PES), tax breaks, and/or cash prizes for meeting restoration metrics; use an array of indicators for payments and incentives, such as emissions reductions, water levels, water quality, flood management, biodiversity, and impacts on livelihoods; ensure incentives allow for long timelines and outweigh the opportunity costs of land conversion; earmark financial incentives and assistance for low- and middle-income communities; offer similar incentives for improving land management in buffer zones (e.g., agroforestry or silvopasture).
  • Co-design peatland restoration projects with the local community; ensure community engagement starts early and is transparent, inclusive, and ongoing; solicit feedback – including from opposition groups – on regulations, legal definitions, financing, monitoring, and enforcement; incorporate gender-responsive frameworks; build consensus on contentious but necessary elements of restoration such as canal filling and blocking; ensure finalized projects address relevant sociological, agriculture, and ecological considerations.
  • Co-manage peatland restoration with local communities; offer proven pathways to improve livelihoods; provide opportunities for technical training and ongoing support for farmers and land owners using paludiculture or restoring peatlands; tailor restoration to each site, taking into account sociological, hydrological, and ecological dynamics.
  • Create regulations that eliminate harmful land use (e.g., growing oil palm and mining) on peatlands and the use of peat for electricity generation and horticulture; ensure suitable climate-friendly alternatives for crop production and peat use are in place before implementing bans.
  • Create strong, enforceable regulations to ensure carbon markets cannot exploit Indigenous or peatland communities; require strong transparency mechanisms for carbon market agreements; work with industry to create high-integrity carbon markets; facilitate co-designing carbon markets agreements with Indigenous- and/or community-led processes.
  • Establish or help local communities develop processes for legal grievances, dispute resolution, and restitution.
  • Conduct proactive land use planning with the local community to help protect restoration into the future; avoid placing structures such as wind turbines on peatlands.
  • Work with insurance institutions to provide products for farmers transitioning their land for peatland restoration or for those who are improving land management in buffer zones (e.g., agroforestry or silvopasture). 
  • Ensure regulations allow and encourage a variety of legal models for peatland restoration, such as cooperatives.
  • Create educational programs that work with schools, universities, NGOs, and the general public to inform communities how to participate in peatland restoration; expand extension services and offer one-stop shops to improve technical capacity for peatland restoration and paludiculture; maintain demonstration projects and ongoing knowledge-sharing platforms with local and Indigenous communities; create a national database for restoration projects to monitor, evaluate, document, and share best practices.
  • Join, support, or create certification schemes that advance peatland restoration and fire management; offer financial support for these programs and for smallholder farmers and low- and middle-income communities to participate.
  • Join, create, or participate in public-private partnerships dedicated to peatland restoration, mobilizing financing, knowledge transfers, general education, and other relevant areas.

Practitioners

  • Conduct and/or work with policymakers to create comprehensive surveys and scientific assessments of national peatlands; work with scientists to identify which peatlands are most at risk of irreversible damage, which are likely to remain intact, and which are suitable candidates for restoration using combined techniques from fields such as paleoecology, ecology, and climate science.
  • Help policymakers set clear, evidence-based guidelines, definitions, and goals for restoration; urge policymakers to incorporate peatland restoration goals into national climate plans; help set comprehensive definitions of restoration that address rewetting, revegetation, revitalization, and reducing fires.
  • Coordinate peatland restoration with local communities, neighboring jurisdictions, nonprofits, and other stakeholders; ensure coordination is cross-sectoral and includes agricultural, food security, human rights, and educational considerations.
  • Advocate for protected status for peatlands in the process of being restored to help mitigate future land conversions; seek to connect restoration projects with existing protected areas; advocate for curtailments or bans on drainage and concession licenses for damaging activities such as growing oil palm, mining, and logging in and near peatlands.
  • Take advantage of financial incentives for peatland restoration and paludiculture, such as direct payments, PES, tax breaks, and/or cash prizes for meeting restoration metrics.
  • Co-design and co-manage peatland restoration projects with the local community; ensure community engagement starts early and is transparent, inclusive, and ongoing; solicit feedback – including from opposition groups – on regulations, legal definitions, financing, monitoring, and enforcement; incorporate gender-responsive frameworks; build consensus on contentious but necessary elements of restoration, such as canal filling or blocking; ensure finalized projects address relevant sociological, agriculture, and ecological considerations.
  • Restore peatlands using well-rounded, thoroughly integrated approaches that address how to rewet, revegetate, revitalize, and reduce fires in areas under restoration.
  • Manage the water table, fill or block canals, and monitor the hydrology of areas being restored; use sustainable, environmentally friendly, and durable materials to block canals.
  • Prioritize protecting intact areas and biodiversity, avoiding further degradation, planting native species, and restoring forests; help enforce bans on draining peatlands; work with local communities to identify key drivers of degradation and viable solutions. 
  • Develop or support opportunities for ecotourism for restored peatlands.
  • Help develop markets for sustainable products through paludiculture; identify sustainable substitutes for current agricultural products; work with policymakers and industry leaders to solidify supply chains.
  • Monitor and evaluate restoration progress using multiple metrics, including emissions reductions, water levels and quality, flood management, biodiversity, and impacts on livelihoods; ensure baseline measurements andclear goals are part of restoration; use technology such as satellite imagery to monitor water table depth, clearance, and other related variables.
  • Use agroforestry, silvopasture, and other sustainable practices in peatland buffer zones to improve protection and access to income-generating opportunities.
  • Demarcate your property, communal boundaries, and protected areas to help solidify and clarify land tenure rights; encourage other stakeholders to do the same.
  • Ensure projects operating in or with Indigenous communities only do so under FPIC; help codify FPIC into legal systems.
  • Help create fire management regulations; help develop fire-resistance in restored areas through increased forest cover and improved environmental conditions; design methods for land clearance that avoid burning; help resolve land tenure and related disputes; educate the public on how to reduce fire use and risks of wildfires; help detect and extinguish fires.
  • Conduct proactive land use planning with the local community to help protect restoration into the future; avoid placing structures such as wind turbines on peatlands.
  • Work with insurance institutions to provide products for farmers transitioning their land for peatland restoration or for those who are improving land management in buffer zones (e.g., agroforestry or silvopasture). 
  • Create educational programs that work with schools, universities, NGOs, and the general public to inform communities how to participate in peatland restoration; collaborate with extension services and offer one-stop shops to improve technical capacity for peatland restoration and paludiculture; maintain demonstration projects and ongoing knowledge-sharing platforms with local and Indigenous communities; help create a national database for restoration projects to monitor, evaluate, document, and share best practices.
  • Join, support, or create certification schemes that advance peatland restoration and fire management; offer financial support for these programs and for smallholder farmers and low- and middle-income communities to participate.
  • Join, create, or participate in public-private partnerships dedicated to peatland restoration, mobilizing financing, knowledge transfers, general education, and other relevant areas.

Business Leaders

  • Create peat-free supply chains, using data, other information, and the latest technology to inform product sourcing; use sustainable materials from paludiculture and peatland restoration in product lines and/or packaging; develop markets and supply chains for native species products; innovate other sustainable uses for resources from paludiculture.
  • Develop or support ecotourism opportunities for restored peatlands.
  • Integrate peat-free business policies and practices into net-zero strategies.
  • Develop financial instruments to invest in peatland restoration focusing on supporting Indigenous communities and smallholder farmers.
  • Conduct proactive land-use planning to avoid infrastructure or development projects that may interfere with peatland restoration or incentivize drainage.
  • Invest in and support Indigenous and local communities’ capacity for peatland restoration, legal protection, and public relations; amplify the voices of local communities and civil society to promote robust media coverage.
  • Only purchase carbon credits from high-integrity, verifiable carbon markets and do not use them as replacements for decarbonizing operations.
  • Co-design carbon markets with Indigenous- and/or community-led processes; work with practitioners to create high-integrity carbon markets; require strong transparency mechanisms for carbon market agreements; help create strong, enforceable regulations to ensure carbon markets cannot exploit Indigenous communities or smallholder farmers.
  • Support programs that educate the public on relevant regulations and how to use forest resources sustainably.
  • Leverage political influence to advocate for stronger peatland restoration and protection policies at national and international levels, especially policies that reduce incentives to drain intact peatlands. 
  • Offer company grants to suppliers to improve resource management and support peatland restoration within your supply chain.
  • Offer incubator services for smallholder farmers restoring peatlands and practicing paludiculture; offer pro bono business advice or general support for community restoration projects.
  • Enter into outgrower schemes to support smallholder farmers using paludiculture; make long-term commitments to help stabilize projects.
  • Donate to local peatland restoration initiatives; use an internal carbon fee or set aside a percentage of revenue to fund relevant projects.
  • Offer employee professional development funds to be used for certification in peatland restoration or related fields such as circular economies.
  • Join, support, or create certification schemes that advance peatland restoration and fire management; offer financial support for these programs and for smallholder farmers and low- and middle-income communities to participate.
  • Join, create, or participate in public-private partnerships dedicated to peatland restoration, mobilizing financing, knowledge transfers, general education, and other relevant areas.

Nonprofit Leaders

  • Use peat-free products in operations; use, promote, and develop markets for sustainable products from peatlands under restoration; identify sustainable substitutes for agricultural products such as palm oil commonly produced on peatlands; work with policymakers and industry leaders to solidify supply chains.
  • Administer or co-manage peatland restoration projects; help establish or support organizations and community management associations to implement and/or monitor restoration projects; if co-managing, consider using alternatives to corporate business structures such as cooperatives to facilitate management and mitigate risk.
  • Provide or facilitate environmental legal assistance for stakeholders involved in peatland restoration activities; advocate for protected status for peatlands under restoration; urge regulators to strengthen land tenure designations and rights; establish or co-design conflict resolution mechanisms.
  • Conduct and/or work with policymakers to create comprehensive surveys and scientific assessments of peatlands; work with scientists to identify which peatlands are most at risk of irreversible damage, which are likely to remain intact, and which are suitable candidates for restoration using combined techniques from fields such as paleoecology, ecology, and climate science.
  • Help policymakers set clear, evidence-based guidelines, definitions, and goals for restoration; urge policymakers to incorporate peatland restoration goals into national climate plans; help set comprehensive definitions of restoration that address rewetting, revegetation, revitalization, and reducing fires.
  • Coordinate peatland restoration with local communities, neighboring jurisdictions, nonprofits, and other stakeholders; ensure coordination is cross-sectoral and includes agricultural, food security, human rights, and educational considerations.
  • Advocate for protected status for peatlands in the process of being restored to help mitigate future land conversions; seek to connect restoration projects with existing protected areas.
  • Take advantage of financial incentives for peatland restoration and paludiculture, such as direct payments, PES, tax breaks, and/or cash prizes for meeting restoration metrics.
  • Co-design and co-manage peatland restoration projects with the local community; ensure community engagement starts early and is transparent, inclusive, and ongoing; solicit feedback – including from opposition groups – on regulations, legal definitions, financing, monitoring, and enforcement; incorporate gender-responsive frameworks; build consensus on contentious but necessary elements of restoration such as canal filling or blocking; ensure finalized projects address relevant sociological, agriculture, and ecological considerations.
  • Urge regulators to strengthen land tenure laws; advocate for and amplify the voices of Indigenous communities seeking full property rights and autonomy; encourage or assist with the demarcation of property, communal boundaries, and protected areas to help solidify and clarify land tenure rights.
  • Help ensure projects operating in or with Indigenous communities only do so under FPIC; help codify FPIC into legal systems.
  • Advocate for public financial incentives for peatland restoration and paludiculture, such as direct payments, PES, tax breaks, and/or cash prizes for meeting restoration metrics; recommend using an array of indicators for payments and incentives such as emissions reductions, water levels and quality, flood management, biodiversity, and impacts on livelihoods; help ensure incentives allow for long timelines and outweigh the opportunity costs of land conversion; urge policymakers to earmark financial incentives and assistance for low- and middle-income communities; recommend similar incentives for improving land management in buffer zones (e.g., agroforestry or silvopasture).
  • Co-design peatland restoration projects with the local community; ensure community engagement starts early and is transparent, inclusive, and ongoing; solicit feedback – including from opposition groups – on regulations, legal definitions, financing, monitoring, and enforcement; incorporate gender-responsive frameworks; build consensus on contentious but necessary elements of restoration such as canal filling or blocking; ensure finalized projects address relevant sociological, agriculture, and ecological considerations.
  • Call on regulators to reduce and eventually eliminate harmful land use (e.g., planting oilpalm and mining) on peatlands and the use of peat for electricity generation and horticulture; help project administrators identify suitable climate-friendly alternatives for crop production and peat before regulations take effect.
  • Co-design carbon markets with Indigenous- and/or community-led processes; work with practitioners to create high-integrity carbon markets; require strong transparency mechanisms for carbon market agreements; help create strong, enforceable regulations to ensure carbon markets cannot exploit Indigenous or peatland communities.
  • Establish or help local communities develop processes for legal grievances, dispute resolution, and restitution.
  • Conduct proactive land use planning with the local community to help protect restoration into the future; help the community avoid placing structures such as wind turbines on peatlands.
  • Work with policymakers and insurance institutions to provide products for farmers transitioning their land for peatland restoration or for those who are improving land management in buffer zones (e.g., agroforestry or silvopasture). 
  • Monitor and evaluate restoration projects using multiple metrics, including emissions reductions, water levels, water quality, flood management, biodiversity, and impacts on livelihoods; ensure baseline measurements and clear goals are part of restoration; use technology such as satellite imagery to monitor water table depth, clearance, and other related variables.
  • Create educational programs that work with schools, universities, other NGOs, and the general public to inform communities how to participate in peatland restoration; collaborate with extension services and offer one-stop shops to improve technical capacity for peatland restoration and paludiculture; maintain demonstration projects and ongoing knowledge-sharing platforms with local and Indigenous communities; help create a national database for restoration projects to monitor, evaluate, document, and share best practices.
  • Join, support, or create certification schemes that advance peatland restoration and fire management; offer financial support for these programs and for smallholder farmers and low- and middle-income communities to participate.
  • Join, create, or participate in public-private partnerships dedicated to peatland restoration, mobilizing financing, knowledge transfers, general education, and other relevant areas.

Investors

  • Create peat-free investment portfolios using data, information, and the latest technology to inform investments.
  • Invest in peatland restoration and related initiatives such as monitoring, management, and enforcement mechanisms; use long-term time horizons and integrate the full spectrum of benefits generated by restoration (e.g., improved resilience; reduced risk of landslides, flooding, drought, and fires; improvements to local health; and healthier ecosystem services) into investment decisions. 
  • Invest in bioeconomy products derived from paludiculture and supply chains using or supporting sustainable paludiculture products; invest in ecotourism projects supporting peatland restoration.
  • Invest in green bonds or high-integrity carbon credits for peatland restoration; provide financing for sustainable land use; offer concessional loans or favorable financial products to smallholder farmers and Indigenous communities.
  • Co-design carbon markets with Indigenous- and/or community-led processes; work with practitioners to create high-integrity carbon markets; require strong transparency mechanisms for carbon market agreements; help create strong, enforceable regulations to ensure carbon markets cannot exploit Indigenous or peatland communities.
  • Ensure investments operating in or with Indigenous communities only do so under FPIC.
  • Support peatland restoration managers, other investors, and NGOs by sharing data, information, and frameworks that successfully avoid investments that drive peatland drainage and degradation.
  • Require portfolio companies to eliminate peatland drainage and/or harmful practices from their supply chains.
  • Join, support, or create certification schemes that advance peatland restoration and fire management; offer financial support for these programs and for smallholder farmers and low- and middle-income communities to participate.
  • Join, create, or participate in public-private partnerships dedicated to peatland restoration, mobilizing financing, knowledge transfers, general education, and other relevant areas.

Philanthropists and International Aid Agencies

  • Use peat-free products in operations; use and/or promote sustainable products from peatlands under restoration; help develop markets for sustainable products through paludiculture; identify sustainable substitutes for current agricultural products; work with policymakers and industry leaders to solidify supply chains.
  • Provide grants to peatland restoration and related initiatives such as monitoring, management, and enforcement mechanisms; use long-term time horizons and integrate the full spectrum of benefits generated by restoration (e.g., improved resilience; reduced risk of landslides, flooding, drought, and fires; improvements to local health; and healthier ecosystem services) into grantmaking decisions. 
  • Administer or co-manage peatland restoration projects; help establish or support organizations and community management associations to implement and/or monitor restoration projects; if co-managing, consider using alternatives to corporate business structures such as cooperatives to facilitate management and mitigate risk.
  • Provide grants or favorable financing for companies using bioeconomy products derived from paludiculture and supply chains using or supporting sustainable paludiculture products; support ecotourism projects connected to peatland restoration.
  • Offer or purchase green bonds or high-integrity carbon credits for peatland restoration; provide financing for sustainable land use; offer grants, concessional loans, or favorable financial products to smallholder farmers and Indigenous communities.
  • Co-design carbon markets with Indigenous- and/or community-led processes; work with practitioners to create high-integrity carbon markets; require strong transparency mechanisms for carbon market agreements; help create strong, enforceable regulations to ensure carbon markets cannot exploit Indigenous or peatland communities.
  • Ensure restoration in or with Indigenous communities is under FPIC.
  • Support peatland restoration managers, other investors, and NGOs by sharing data, information, and frameworks that successfully avoid investments that drive peatland drainage and degradation.
  • Provide or facilitate environmental legal assistance for stakeholders involved in peatland restoration; advocate for protected status for peatlands under restoration; urge regulators to strengthen land tenure designations and rights; establish or co-design conflict resolution mechanisms.
  • Commission and/or work with policymakers to create comprehensive surveys and scientific assessments of national peatlands; work with scientists to identify which peatlands are most at risk of irreversible damage, which are likely to remain intact, and which are suitable candidates for restoration using combined techniques from fields such as paleoecology, ecology, and climate science.
  • Help policymakers set clear, evidence-based guidelines, definitions, and goals for restoration; urge policymakers to incorporate peatland restoration goals into national climate plans; help set comprehensive definitions of restoration’ that address rewetting, revegetation, revitalization, and reducing fires.
  • Coordinate peatland restoration with local communities, neighboring jurisdictions, nonprofits, and other stakeholders; ensure coordination is cross-sectoral and includes agricultural, food security, human rights, and educational considerations.
  • Advocate for protected status for peatlands in the process of being restored to help mitigate future land conversions; seek to connect restoration projects with existing protected areas.
  • Co-design and co-manage peatland restoration projects with the local community; ensure community engagement starts early and is transparent, inclusive, and ongoing; solicit feedback – including from opposition groups – on regulations, legal definitions, financing, monitoring, and enforcement; incorporate gender-responsive frameworks; build consensus on contentious but necessary elements of restoration such as canal filling or blocking; ensure finalized projects address relevant sociological, agriculture, and ecological considerations.
  • Urge regulators to strengthen land tenure laws; advocate for and amplify the voices of Indigenous communities seeking full property rights and autonomy; encourage or assist with the demarcation of property, communal boundaries, and protected areas to help solidify and clarify land tenure rights.
  • Advocate for public financial incentives for peatland restoration and paludiculture, such as direct payments, PES, tax breaks, and/or cash prizes for meeting restoration metrics; recommend using an array of indicators for payments and incentives such as emissions reductions, water levels, water quality, flood management, biodiversity, and impacts on livelihoods; help ensure incentives allow for long timelines and outweigh the opportunity costs of land conversion; urge policymakers to earmark financial incentives and assistance for low- and middle-income communities; recommend similar incentives for improving land management in buffer zones (e.g., agroforestry or silvopasture).
  • Call on regulators to reduce and eventually eliminate harmful land use (e.g., growing oil palm and mining) on peatlands and the use of peat for electricity generation and horticulture; help project administrators identify suitable climate-friendly alternatives for crop production and peat before regulations take effect.
  • Establish or help local communities develop processes for legal grievances, dispute resolution, and restitution.
  • Conduct proactive land use planning with the local community to help protect restoration into the future; help the community avoid placing structures such as wind turbines on peatlands.
  • Work with policymakers and insurance institutions to provide products for farmers transitioning their land for peatland restoration or for those who are improving land management in buffer zones (e.g., agroforestry or silvopasture). 
  • Monitor and evaluate restoration projects using multiple metrics, including emissions reductions, water levels, water quality, flood management, biodiversity, and impacts on livelihoods; ensure baseline measurements and clear goals are part of restoration; use technology such as satellite imagery to monitor water table depth, clearance, and other related variables.
  • Create educational programs that work with schools, universities, other NGOs, and the general public to inform communities how to participate in peatland restoration; collaborate with extension services and offer one-stop shops to improve technical capacity for peatland restoration and paludiculture; maintain demonstration projects and ongoing knowledge-sharing platforms with local and Indigenous communities; help create a national database for restoration projects to monitor, evaluate, document, and share best practices.
  • Join, support, or create certification schemes that advance peatland restoration and fire management; offer financial support for these programs and for smallholder farmers and low- and middle-income communities to participate.
  • Join, create, or participate in public-private partnerships dedicated to peatland restoration, mobilizing financing, knowledge transfers, general education, and other relevant areas.

Thought Leaders

  • Help lead peatland restoration projects; establish or support organizations and community management associations to implement and/or monitor restoration projects; consider using alternatives to corporate business structures such as cooperatives to facilitate management and mitigate risk.
  • Use and/or promote sustainable products from peatlands under restoration; help develop markets for sustainable products deriving from paludiculture; identify sustainable substitutes for current agricultural products; work with policymakers and industry leaders to solidify supply chains.
  • Take advantage of financial incentives for peatland restoration and paludiculture, such as direct payments, PES, tax breaks, and/or cash prizes for meeting restoration metrics.
  • Provide or facilitate environmental legal assistance for stakeholders involved in peatland restoration; advocate for protected status for peatlands under restoration; urge regulators to strengthen land tenure designations and rights; establish or co-design conflict resolution mechanisms.
  • Conduct and/or work with policymakers to create comprehensive surveys and scientific assessments of national peatlands; work with scientists to identify which peatlands are most at risk of irreversible damage, which are likely to remain intact, and which are suitable candidates for restoration using combined techniques from fields such as paleoecology, ecology, and climate science.
  • Help policymakers set clear, evidence-based guidelines, definitions, and goals for restoration; urge policymakers to incorporate peatland restoration goals into national climate plans; help set comprehensive definitions of restoration that address rewetting, revegetation, revitalization, and reducing fires.
  • Coordinate peatland restoration with local communities, neighboring jurisdictions, nonprofits, and other stakeholders; ensure coordination is cross-sectoral and includes agricultural, food security, human rights, and educational considerations.
  • Co-design and co-manage peatland restoration projects with the local community; ensure community engagement starts early and is transparent, inclusive, and ongoing; solicit feedback – including from opposition groups – on regulations, legal definitions, financing, monitoring, and enforcement; incorporate gender-responsive frameworks; build consensus on contentious but necessary elements of restoration such as canal filling or blocking; ensure finalized projects address relevant sociological, agriculture, and ecological considerations.
  • Urge regulators to strengthen land tenure laws; advocate for and amplify the voices of Indigenous communities seeking full property rights and autonomy; encourage or assist with the demarcation of property, communal boundaries, and protected areas to help solidify and clarify land tenure rights.
  • Help ensure projects operating in or with Indigenous communities only do so under FPIC; help codify FPIC into legal systems.
  • Advocate for public financial incentives for peatland restoration and paludiculture, such as direct payments, PES, tax breaks, and/or cash prizes for meeting restoration metrics; recommend using an array of indicators for payments and incentives such as emissions reductions, water levels, water quality, flood management, biodiversity, and impacts on livelihoods; help ensure incentives allow for long timelines and outweigh the opportunity costs of land conversion; urge policymakers to earmark financial incentives and assistance for low- and middle-income communities; recommend similar incentives for improving land management in buffer zones (e.g., agroforestry or silvopasture).
  • Call on regulators to reduce and eventually eliminate harmful land use (e.g., growing oil palm and mining) on peatlands and the use of peat for electricity generation and horticulture; help project administrators identify suitable climate-friendly alternatives for crop production and peat before regulations take effect.
  • Co-design carbon markets with Indigenous- and/or community-led processes; work with practitioners to create high-integrity carbon markets; require strong transparency mechanisms for carbon market agreements; help create strong, enforceable regulations to ensure carbon markets cannot exploit Indigenous or peatland communities.
  • Establish or help local communities develop processes for legal grievances, dispute resolution, and restitution.
  • Conduct proactive land use planning with the local community to help protect restoration into the future; help the community avoid placing structures such as wind turbines on peatlands.
  • Work with policymakers and insurance institutions to provide products for farmers transitioning their land for peatland restoration or for those who are improving land management in buffer zones (e.g., agroforestry or silvopasture). 
  • Monitor and evaluate restoration projects using multiple metrics, including emissions reductions, water levels and quality, flood management, biodiversity, and impacts on livelihoods; ensure baseline measurements and clear goals are part of restoration; use technology such as satellite imagery to monitor water table depth, clearance, and other related variables.
  • Create educational programs that work with schools, universities, other NGOs, and the general public to inform communities how to participate in peatland restoration; collaborate with extension services and offer one-stop shops to improve technical capacity for peatland restoration and paludiculture; maintain demonstration projects and ongoing knowledge-sharing platforms with local and Indigenous communities; help create a national database for restoration projects to monitor, evaluate, document, and share best practices.
  • Join, support, or create certification schemes that advance peatland restoration and fire management; offer financial support for these programs and for smallholder farmers and low- and middle-income communities to participate.
  • Join, create, or participate in public-private partnerships dedicated to peatland restoration, mobilizing financing, knowledge transfers, general education, and other relevant areas.

Technologists and Researchers

  • Collect, analyze, and publish data on existing restoration projects; distill best practices and lessons learned. 
  • Model and monitor various restoration techniques; conduct baseline assessments and comprehensive monitoring of peatlands over a wide geography and time period; track a variety of indicators for local peatland restoration, such as emissions reductions, water levels and quality, flood management, biodiversity, and impacts on livelihoods; share results with practitioners, policymakers, and the public.
  • Improve regional and global maps of peatlands; identify which are suitable for restoration, which are vulnerable, and which may not be capable of being restored; map these regions over time to show improvements and/or land use changes.
  • Improve systems for returning hydrological function and biodiversity to restored peatlands; examine roles of native vegetation and conditions that enable cultivation; research the sequencing of reintroducing native species to peatlands to understand which species can help stabilize the environment and which are more sensitive to conditions.
  • Research practices related to peatland restoration, such as diversifying genetics for isolated populations.
  • Improve paludiculture systems for restored tropical peatlands; improve profitability, feasibility, and productivity of paludiculture systems, especially, for smallholder farmers; assess trade-offs for using paludiculture; develop and standardize comprehensive methods for monitoring and evaluating paludiculture systems, including social, hydrological, biological, and climate dynamics.
  • Develop uses for paludicultural crops, examining both the roles of vegetation in restoration and potential uses in a circular economy; develop methods of integrating paludiculture with other related climate solutions such as agroforestry and silvopasture. 
  • Help develop machinery to improve cost-efficiency of restoration and paludiculture.
  • Develop methods to control and/or stop the regeneration of nonnative species and trees in peatlands under restoration.
  • Quantify climate, social, environmental, and financial benefits of restored peatlands to inform and encourage long-term investments.
  • Facilitate international cooperation, capacity building, and research for peatland restoration in underserved areas.
  • Research and model the impacts of fire, fire management, and protective measures on peatland restoration.
  • Co-design peatland restoration with local communities, policymakers, and other stakeholders. 

Communities, Households, and Individuals

  • Start a peatland restoration project in your community or create a business that uses projects derived from paludiculture and/or restored peatlands; consider using alternatives to corporate business structures such as cooperatives to facilitate management and mitigate risk.
  • Help monitor local efforts to improve peatland management; volunteer with a local agency or nonprofit to help restore peatlands.
  • Advocate for protected status for peatlands in the process of being restored to help mitigate future land conversions.
  • Urge regulators to strengthen land tenure laws; advocate for and/or support Indigenous communities’ full property rights and autonomy; support work to manage, monitor, and enforce land tenure rights for peatland projects.
  • Help ensure projects operating in or with Indigenous communities only do so under FPIC; advocate to codify FPIC into legal systems.
  • Co-design and co-manage peatland restoration projects with your local community; ensure community engagement starts early and is transparent, inclusive, and ongoing; solicit feedback – including from opposition groups – on regulations, legal definitions, financing, monitoring, and enforcement; incorporate gender-responsive frameworks; build consensus on contentious but necessary elements of restoration, such as canal filling or blocking; ensure finalized projects address relevant sociological, agriculture, and ecological considerations.
  • Call on regulators to reduce and eventually eliminate harmful land use (e.g., growing oil palm and mining) on peatlands and the use of peat for electricity generation and horticulture; help project administrators identify suitable climate-friendly alternatives for crop production and peat before regulations take effect.
  • If relevant, demarcate peatlands on your property; encourage and/or assist others with the demarcation of property, communal boundaries, and areas under restoration to help solidify and clarify land tenure rights.
  • Help educate your community about the process of obtaining land recognition.
  • Work with extension services to develop local capacity in peatland restoration, especially in community-led monitoring and evaluation; establish knowledge-sharing initiatives with Indigenous peoples.
  • Join, support, or create certification schemes that advance peatland restoration and fire management.
  • Join, create, or participate in public-private partnerships dedicated to peatland restoration, mobilizing financing, knowledge transfers, general education, and other relevant areas.
  • Reduce consumption of products commonly produced on degraded peatlands, such as palm oil and peat moss. 

“Take Action” Sources

Evidence Base

Consensus of effectiveness in reducing emissions from disturbed peatlands: High 

Consensus of effectiveness in providing substantial net GHG removal in the near future after accounting for increases in methane emissions: Low

Degraded peatlands currently emit an estimated 1.3–1.9 Gt CO₂ ‑eq/yr (excluding fires), equal to ~2–4% of total global GHG emissions (Leifield and Menichetti., 2018; UNEP, 2022). Leifield et al. (2019) projected that without protection or restoration, drained peatlands could produce enough emissions to consume 12–41% of the remaining emissions budget for keeping warming below 1.5–2.0 °C. Peatland drainage had produced a cumulative 80 Gt CO₂ ‑eq by 2015, equal to nearly 16 months’ worth of total global emissions (60.3 Gt CO₂‑eq/yr as of 2024). 

Peatland rewetting and restoration has been widely shown to stop ongoing CO₂ emissions from oxidation of drained peat and reduce lateral transport of carbon through waterways (Günther et al., 2020; Mander et al., 2024; Wilson et al., 2016). The net emissions reduction in rewetted relative to drained conditions is clear and consistent, despite large variability in the magnitude of carbon uptake and methane and nitrous oxide emissions following rewetting. While many restored peatlands regain their capacity to act as net carbon sinks, some sites remain emissions sources for decades following rewetting (Strack & Zuback 2013; Vanselow-Algan et al., 2015; Wilson et al., 2016).

 The results presented in this document summarize findings from 19 reviews, meta-analyses, and global databases reflecting current evidence for peatland restoration. The majority of the non-global literature is focused on Indonesia, the United Kingdom, and Northern Europe. We recognize this limited geographic scope creates bias, and hope this work inspires research and data sharing on this topic in underrepresented regions.

Updated Date
Coming Soon Label
Coming Soon

Restore Forests

Image
Image
person planting trees
Coming Soon
Off
Summary

Forest restoration is the process of returning previously forested land to a forested state. As forests regrow, they remove carbon from the atmosphere and sequester it in biomass.

Description for Social and Search
Restore Forests is a Highly Recommended climate solution. Diverse, healthy forests sequester carbon as biomass.
Overview

We define forest restoration as planting new trees or allowing trees to naturally regrow on previously forested land that has been cleared. Through photosynthesis, forests take carbon from the atmosphere and store it in biomass. On net, forests currently take up an estimated 11.4–14.7 Gt CO₂‑eq/yr  (Friedlingstein et al., 2023; Gibbs et al., 2025; Pan et al., 2024), equal to approximately 19–25% of total global anthropogenic GHG emissions (Dhakal et al., 2022). Restoring forests increases the size of the forest carbon sink, sequestering additional CO₂.  

As commonly defined, restoration ranges from improving management of existing ecosystems, to re-establishing cleared ecosystems, to maintaining the health of functional ecosystems. Forest restoration includes activities such as exclusion of non-native grazing animals from a regenerating site, weed management, assisted seed dispersal, controlled burning, stand thinning, direct seeding, soil amendment, tree planting, and modification of topography or hydrology and other activities (Chazdon et al., 2024; Gann et al., 2022; Kübler & Günter 2024). While acknowledging that all restoration occurs along a spectrum of intervention intensity, we report effectiveness, cost, and adoption data for “low intensity” and “high intensity” restoration separately, with “low intensity” restoration including all interventions up to, but not including, tree planting, and “high intensity” restoration referring to direct seeding or seedling planting. To account for variability in carbon sequestration rates and area available for forest restoration, this analysis also evaluates forest restoration in boreal, temperate, subtropical, and tropical regions separately where possible.

Our definition of forest restoration is more limited than that used by many other sources. First, we only include reforestation of previously forested land with an element of direct human intervention, and therefore exclude entirely passive tree regrowth on abandoned land (i.e., unassisted natural regeneration) and afforestation of native grasslands and savannas. We also exclude areas currently used for crop production. To avoid double counting, we also do not include activities covered in other Project Drawdown solutions, including increasing carbon stocks in existing forests and establishing timber plantations, agroforestry, or silvopasture (see Improve Forest Management, Deploy Biomass Crops on Degraded Land, Deploy Agroforestry, and Deploy Silvopasture, respectively). Restoration of mangroves and forests on peat soils is also excluded, as this is covered in the Restore Coastal Wetlands and Restore Peatlands solutions. Because the scope of this solution is narrower than that of many other studies, the estimated impacts are correspondingly lower as well. 

Intact and regenerating forests take up carbon, but human clearing of forests for logging, agriculture, and other activities emits carbon. Humans clear an estimated 15.5 Mha of forests annually, emitting ~7.4 Gt CO₂‑eq/yr (2001–2024; Harris et al., 2021; Gibbs et al., 2025; Sims et al., 2025). Protecting existing forests reduces emissions from deforestation (see Protect Forests) and is an essential complement to forest restoration. 

References

Adams, C., Rodrigues, S. T., Calmon, M., & Kumar, C. (2016). Impacts of large-scale forest restoration on socioeconomic status and local livelihoods: What we know and do not know. Biotropica, 48(6), 731–744. Link to source: https://doi.org/10.1111/btp.12385

Ager, A. A., Vogler, K. C., Day, M. A., & Bailey, J. D. (2017). Economic opportunities and trade-offs in collaborative forest landscape restoration. Ecological Economics, 136, 226–239. Link to source: https://doi.org/10.1016/j.ecolecon.2017.01.001

Andres, S. E., Standish, R. J., Lieurance, P. E., Mills, C. H., Harper, R. J., Butler, D. W., Adams, V. M., Lehmann, C., Tetu, S. G., Cuneo, P., Offord, C. A., & Gallagher, R. V. (2023). Defining biodiverse reforestation: Why it matters for climate change mitigation and biodiversity. Plants, People, Planet, 5(1), 27–38. Link to source: https://doi.org/10.1002/ppp3.10329

Austin, K. G., Baker, J. S., Sohngen, B. L., Wade, C. M., Daigneault, A., Ohrel, S. B., Ragnauth, S., & Bean, A. (2020). The economic costs of planting, preserving, and managing the world’s forests to mitigate climate change. Nature Communications, 11(1), Article 5946. Link to source: https://doi.org/10.1038/s41467-020-19578-z

Bastin, J.-F., Finegold, Y., Garcia, C., Mollicone, D., Rezende, M., Routh, D., Zohner, C. M., & Crowther, T. W. (2019). The global tree restoration potential. Science, 365(6448), 76–79. Link to source: https://doi.org/10.1126/science.aax0848

Begliomini, F. N., & Brancalion, P. H. S. (2024). Are state-of-the-art LULC maps able to track ecological restoration efforts in Brazilian Atlantic forest? IGARSS 2024 - 2024 IEEE International Geoscience and Remote Sensing Symposium, 4748–4752. Link to source: https://doi.org/10.1109/IGARSS53475.2024.10641177

Beltrão, M. G., Gonçalves, C. F., Brancalion, P. H. S., Carmignotto, A. P., Silveira, L. F., Galetti, P. M., & Galetti, M. (2024). Priority areas and implementation of ecological corridor through forest restoration to safeguard biodiversity. Scientific Reports, 14(1), Article 30837. Link to source: https://doi.org/10.1038/s41598-024-81483-y

Bernal, B., Murray, L. T., & Pearson, T. R. H. (2018). Global carbon dioxide removal rates from forest landscape restoration activities. Carbon Balance and Management, 13(1), Article 22. Link to source: https://doi.org/10.1186/s13021-018-0110-8

Betts, R. A. (2000). Offset of the potential carbon sink from boreal forestation by decreases in surface albedo. Nature, 408(6809), 187–190. Link to source: https://doi.org/10.1038/35041545

Bialic-Murphy, L., McElderry, R. M., Esquivel-Muelbert, A., van den Hoogen, J., Zuidema, P. A., Phillips, O. L., de Oliveira, E. A., Loayza, P. A., Alvarez-Davila, E., Alves, L. F., Maia, V. A., Vieira, S. A., Arantes da Silva, L. C., Araujo-Murakami, A., Arets, E., Astigarraga, J., Baccaro, F., Baker, T., Banki, O., … Crowther, T. W. (2024). The pace of life for forest trees. Science, 386(6717), 92–98. Link to source: https://doi.org/10.1126/science.adk9616

Bliege Bird, R., & Nimmo, D. (2018). Restore the lost ecological functions of people. Nature Ecology & Evolution, 2(7), 1050–1052. Link to source: https://doi.org/10.1038/s41559-018-0576-5

Brancalion, P. H. S., de Siqueira, L. P., Amazonas, N. T., Rizek, M. B., Mendes, A. F., Santiami, E. L., Rodrigues, R. R., Calmon, M., Benini, R., Tymus, J. R. C., Holl, K. D., & Chaves, R. B. (2022). Ecosystem restoration job creation potential in Brazil. People and Nature, 4(6), 1426–1434. Link to source: https://doi.org/10.1002/pan3.10370

Brancalion, P. H. S., Hua, F., Joyce, F. H., Antonelli, A., & Holl, K. D. (2025). Moving biodiversity from an afterthought to a key outcome of forest restoration. Nature Reviews Biodiversity, 1(4), 248–261.  https://doi.org/10.1038/s44358-025-00032-1

Brumberg, H., Margaret Hegwood, Eichhorst, W., LoPresti, A., Erbaugh, J. T., & Kroeger, T. (2025). Global analysis of constraints to natural climate solution implementation. PNAS Nexus, 4(6), Article pgaf173. Link to source: https://doi.org/10.1093/pnasnexus/pgaf173

Bukoski, J. J., Cook-Patton, S. C., Melikov, C., Ban, H., Chen, J. L., Goldman, E. D., Harris, N. L., & Potts, M. D. (2022). Rates and drivers of aboveground carbon accumulation in global monoculture plantation forests. Nature Communications, 13(1), Article 4206. Link to source: https://doi.org/10.1038/s41467-022-31380-7

Busch, J., Bukoski, J. J., Cook-Patton, S. C., Griscom, B., Kaczan, D., Potts, M. D., Yi, Y., & Vincent, J. R. (2024). Cost-effectiveness of natural forest regeneration and plantations for climate mitigation. Nature Climate Change, 14(9), 996–1002. Link to source: https://doi.org/10.1038/s41558-024-02068-1

Chaplin-Kramer, R., Ramler, I., Sharp, R., Haddad, N. M., Gerber, J. S., West, P. C., Mandle, L., Engstrom, P., Baccini, A., Sim, S., Mueller, C., & King, H. (2015). Degradation in carbon stocks near tropical forest edges. Nature Communications, 6(1), Article 10158. Link to source: https://doi.org/10.1038/ncomms10158

Chazdon, R. L., Falk, D. A., Banin, L. F., Wagner, M., J. Wilson, S., Grabowski, R. C., & Suding, K. N. (2024). The intervention continuum in restoration ecology: Rethinking the active–passive dichotomy. Restoration Ecology, 32(8), Article e13535. Link to source: https://doi.org/10.1111/rec.13535

Chazdon, R. L., & Guariguata, M. R. (2016). Natural regeneration as a tool for large-scale forest restoration in the tropics: Prospects and challenges. Biotropica, 48(6), 716–730. Link to source: https://doi.org/10.1111/btp.12381

Chazdon, R. L., Wilson, S. J., Brondizio, E., Guariguata, M. R., & Herbohn, J. (2021). Key challenges for governing forest and landscape restoration across different contexts. Land Use Policy, 104, Article 104854. Link to source: https://doi.org/10.1016/j.landusepol.2020.104854

Cook-Patton, S. C., Leavitt, S. M., Gibbs, D., Harris, N. L., Lister, K., Anderson-Teixeira, K. J., Briggs, R. D., Chazdon, R. L., Crowther, T. W., Ellis, P. W., Griscom, H. P., Herrmann, V., Holl, K. D., Houghton, R. A., Larrosa, C., Lomax, G., Lucas, R., Madsen, P., Malhi, Y., … Griscom, B. W. (2020). Mapping carbon accumulation potential from global natural forest regrowth. Nature, 585(7826), 545–550. Link to source: https://doi.org/10.1038/s41586-020-2686-x

Crouzeilles, R., Barros, F. S. M., Molin, P. G., Ferreira, M. S., Junqueira, A. B., Chazdon, R. L., Lindenmayer, D. B., Tymus, J. R. C., Strassburg, B. B. N., & Brancalion, P. H. S. (2019). A new approach to map landscape variation in forest restoration success in tropical and temperate forest biomes. Journal of Applied Ecology, 56(12), 2675–2686. Link to source: https://doi.org/10.1111/1365-2664.13501

Crouzeilles, R., Curran, M., Ferreira, M. S., Lindenmayer, D. B., Grelle, C. E. V., & Rey Benayas, J. M. (2016). A global meta-analysis on the ecological drivers of forest restoration success. Nature Communications, 7(1), Article 11666. Link to source: https://doi.org/10.1038/ncomms11666

Curtis, P. G., Slay, C. M., Harris, N. L., Tyukavina, A., & Hansen, M. C. (2018). Classifying drivers of global forest loss. Science, 361(6407), 1108–1111. Link to source: https://doi.org/10.1126/science.aau3445

Dhakal, S., J.C. Minx, F.L. Toth, A. Abdel-Aziz, M.J. Figueroa Meza, K. Hubacek, I.G.C. Jonckheere, Yong-Gun Kim, G.F. Nemet, S. Pachauri, X.C. Tan, T. Wiedmann, 2022: Emissions Trends and Drivers. In IPCC, 2022: Climate Change 2022: Mitigation of Climate Change. Contribution of Working Group III to the Sixth Assessment Report of the Intergovernmental Panel on Climate Change [P.R. Shukla, J. Skea, R. Slade, A. Al Khourdajie, R. van Diemen, D. McCollum, M. Pathak, S. Some, P. Vyas, R. Fradera, M. Belkacemi, A. Hasija, G. Lisboa, S. Luz, J. Malley, (eds.)]. Cambridge University Press, Cambridge, UK and New York, NY, USA. Link to source: https://doi.org/10.1017/9781009157926.004

De Groot, R. S., Blignaut, J., Van Der Ploeg, S., Aronson, J., Elmqvist, T., & Farley, J. (2013). Benefits of investing in ecosystem restoration. Conservation Biology, 27(6), 1286–1293. Link to source: https://doi.org/10.1111/cobi.12158

de Souza, S. E. X. F., Vidal, E., Chagas, G. de F., Elgar, A. T., & Brancalion, P. H. S. (2016). Ecological outcomes and livelihood benefits of community-managed agroforests and second growth forests in Southeast Brazil. Biotropica, 48(6), 868–881. Link to source: https://doi.org/10.1111/btp.12388

Di Sacco, A., Hardwick, K. A., Blakesley, D., Brancalion, P. H. S., Breman, E., Cecilio Rebola, L., Chomba, S., Dixon, K., Elliott, S., Ruyonga, G., Shaw, K., Smith, P., Smith, R. J., & Antonelli, A. (2021). Ten golden rules for reforestation to optimize carbon sequestration, biodiversity recovery and livelihood benefits. Global Change Biology, 27(7), 1328–1348. Link to source: https://doi.org/10.1111/gcb.15498

Dib, V., Brancalion, P. H. S., Chan Chou, S., Cooper, M., Ellison, D., Farjalla, V. F., Filoso, S., Meli, P., Pires, A. P. F., Rodriguez, D. A., Iribarrem, A., Latawiec, A. E., Scarano, F. R., Vogl, A. L., de Viveiros Grelle, C. E., & Strassburg, B. (2023). Shedding light on the complex relationship between forest restoration and water services. Restoration Ecology, 31(5), Article e13890. Link to source: https://doi.org/10.1111/rec.13890

dos Reis Oliveira, P. C., Gualda, G. A. F., Rossi, G. F., Camargo, A. F. M., Filoso, S., Brancalion, P. H., & Ferraz, S. F. de B. (2025). Forest restoration improves habitat and water quality in tropical streams: A multiscale landscape assessment. Science of The Total Environment, 963, Article 178256. Link to source: https://doi.org/10.1016/j.scitotenv.2024.178256

Fargione, J., Haase, D. L., Burney, O. T., Kildisheva, O. A., Edge, G., Cook-Patton, S. C., Chapman, T., Rempel, A., Hurteau, M. D., Davis, K. T., Dobrowski, S., Enebak, S., De La Torre, R., Bhuta, A. A. R., Cubbage, F., Kittler, B., Zhang, D., & Guldin, R. W. (2021). Challenges to the reforestation pipeline in the United States. Frontiers in Forests and Global Change, 4, Article 629198. https://doi.org/10.3389/ffgc.2021.629198

Fesenmyer, K. A., Poor, E. E., Terasaki Hart, D. E., Veldman, J. W., Fleischman, F., Choksi, P., Archibald, S., Armani, M., Fagan, M. E., Fricke, E. C., Terrer, C., Hasler, N., Williams, C. A., Ellis, P. W., & Cook-Patton, S. C. (2025). Addressing critiques refines global estimates of reforestation potential for climate change mitigation. Nature Communications, 16(1), Article 4572. Link to source: https://doi.org/10.1038/s41467-025-59799-8

Fletcher, M.-S., Hamilton, R., Dressler, W., & Palmer, L. (2021). Indigenous knowledge and the shackles of wilderness. Proceedings of the National Academy of Sciences, 118(40), Article e2022218118. Link to source: https://doi.org/10.1073/pnas.2022218118

Friedlingstein, P., O’Sullivan, M., Jones, M. W., Andrew, R. M., Bakker, D. C. E., Hauck, J., Landschützer, P., Le Quéré, C., Luijkx, I. T., Peters, G. P., Peters, W., Pongratz, J., Schwingshackl, C., Sitch, S., Canadell, J. G., Ciais, P., Jackson, R. B., Alin, S. R., Anthoni, P., … Zheng, B. (2023). Global carbon budget 2023. Earth System Science Data, 15(12), 5301–5369. Link to source: https://doi.org/10.5194/essd-15-5301-2023

Gann, G. D., Walder, B., Gladstone, J., Manirajah, S. M., & Roe, S. (2022). Restoration project information sharing framework. Climate Focus and The Society for Ecological Restoration. Link to source: https://globalrestorationobservatory.com/restoration-project-information-sharing-framework/

Gardon, F. R., Toledo, R. M. de, Brentan, B. M., & Santos, R. F. dos. (2020). Rainfall interception and plant community in young forest restorations. Ecological Indicators, 109, Article 105779. Link to source: https://doi.org/10.1016/j.ecolind.2019.105779

Garnett, S. T., Burgess, N. D., Fa, J. E., Fernández-Llamazares, Á., Molnár, Z., Robinson, C. J., Watson, J. E. M., Zander, K. K., Austin, B., Brondizio, E. S., Collier, N. F., Duncan, T., Ellis, E., Geyle, H., Jackson, M. V., Jonas, H., Malmer, P., McGowan, B., Sivongxay, A., & Leiper, I. (2018). A spatial overview of the global importance of Indigenous lands for conservation. Nature Sustainability, 1(7), 369–374. Link to source: https://doi.org/10.1038/s41893-018-0100-6

Gibbs, D. A., Rose, M., Grassi, G., Melo, J., Rossi, S., Heinrich, V., & Harris, N. L. (2024). Revised and updated geospatial monitoring of twenty-first century forest carbon fluxes. Earth System Science Data Discussions, 17(3), 1217-1243. Link to source: https://doi.org/10.5194/essd-2024-397

Griscom, B. W., Adams, J., Ellis, P. W., Houghton, R. A., Lomax, G., Miteva, D. A., Schlesinger, W. H., Shoch, D., Siikamäki, J. V., Smith, P., Woodbury, P., Zganjar, C., Blackman, A., Campari, J., Conant, R. T., Delgado, C., Elias, P., Gopalakrishna, T., Hamsik, M. R., … Fargione, J. (2017). Natural climate solutions. Proceedings of the National Academy of Sciences, 114(44), 11645–11650. Link to source: https://doi.org/10.1073/pnas.1710465114

Hansen, M. C., Potapov, P. V., Moore, R., Hancher, M., Turubanova, S. A., Tyukavina, A., Thau, D., Stehman, S. V., Goetz, S. J., Loveland, T. R., Kommareddy, A., Egorov, A., Chini, L., Justice, C. O., & Townshend, J. R. G. (2013). High-resolution global maps of 21st-century forest cover change. Science, 342(6160), 850–853. Link to source: https://doi.org/10.1126/science.1244693

Harris, N. L., Gibbs, D. A., Baccini, A., Birdsey, R. A., de Bruin, S., Farina, M., Fatoyinbo, L., Hansen, M. C., Herold, M., Houghton, R. A., Potapov, P. V., Suarez, D. R., Roman-Cuesta, R. M., Saatchi, S. S., Slay, C. M., Turubanova, S. A., & Tyukavina, A. (2021). Global maps of twenty-first century forest carbon fluxes. Nature Climate Change, 11(3), 234–240. Link to source: https://doi.org/10.1038/s41558-020-00976-6

Hasler, N., Williams, C. A., Denney, V. C., Ellis, P. W., Shrestha, S., Terasaki Hart, D. E., Wolff, N. H., Yeo, S., Crowther, T. W., Werden, L. K., & Cook-Patton, S. C. (2024). Accounting for albedo change to identify climate-positive tree cover restoration. Nature Communications, 15(1), Article 2275. Link to source: https://doi.org/10.1038/s41467-024-46577-1

Herrera, D., Ellis, A., Fisher, B., Golden, C. D., Johnson, K., Mulligan, M., Pfaff, A., Treuer, T., & Ricketts, T. H. (2017). Upstream watershed condition predicts rural children’s health across 35 developing countries. Nature Communications, 8(1), Article 811. Link to source: https://doi.org/10.1038/s41467-017-00775-2

Hua, F., Bruijnzeel, L. A., Meli, P., Martin, P. A., Zhang, J., Nakagawa, S., Miao, X., Wang, W., McEvoy, C., Peña-Arancibia, J. L., Brancalion, P. H. S., Smith, P., Edwards, D. P., & Balmford, A. (2022). The biodiversity and ecosystem service contributions and trade-offs of forest restoration approaches. Science, 376(6595), 839–844. Link to source: https://doi.org/10.1126/science.abl4649

Kabeja, C., Li, R., Guo, J., Rwatangabo, D. E. R., Manyifika, M., Gao, Z., Wang, Y., & Zhang, Y. (2020). The impact of reforestation induced land cover change (1990–2017) on flood peak discharge using HEC-HMS hydrological model and satellite observations: A study in two mountain basins, China. Water, 12(5), Article 1347. Link to source: https://doi.org/10.3390/w12051347

Keesing, F., & Ostfeld, R. S. (2021). Impacts of biodiversity and biodiversity loss on zoonotic diseases. Proceedings of the National Academy of Sciences, 118(17), Article e2023540118. Link to source: https://doi.org/10.1073/pnas.2023540118

Kroeger, T., Erbaugh, J., Luo, Z., Brumberg, H., Eichhorst, W., Hegwood, M., LoPresti, A., Shyamsundar, P., Ellis, P., Oakes, L., Martin, D., Brancalion, P., Bourne, M., Jagadish, A., Austin, K., Kinzer, A., Sanjuán, M., McCullough, L., & Echavarria, M. (2025). Implementation constraints on natural climate solutions: A global literature review and survey. Research Square. Link to source: https://doi.org/10.21203/rs.3.rs-6890465/v1

Kübler, D., & Günter, S. (2024). Forest restoration for climate change mitigation and adaptation. In P. Katila, C. J. Pierce Colfer, W. de Jong, G. Galloway, P. Pacheco, & G. Winkel (Eds.), Restoring Forests and Trees for Sustainable Development: Policies, Practices, Impacts, and Ways Forward (p. 135-159). Oxford University Press. Link to source: https://doi.org/10.1093/9780197683958.003.0006

Kumar, C., Calmon, M., & Saint-Laurent, C. (Eds.) (with Begeladze, S.). (2015). Enhancing food security through forest landscape restoration: Lessons from Burkina Faso, Brazil, Guatemala, Viet Nam, Ghana, Ethiopia and Philippines. IUCN International Union for Conservation of Nature. Link to source: https://doi.org/10.2305/IUCN.CH.2015.FR.2.en

Lawrence, D., Coe, M., Walker, W., Verchot, L., & Vandecar, K. (2022). The unseen effects of deforestation: Biophysical effects on climate. Frontiers in Forests and Global Change, 5, Article 756115. Link to source: https://doi.org/10.3389/ffgc.2022.756115

Löfqvist, S., Kleinschroth, F., Bey, A., de Bremond, A., DeFries, R., Dong, J., Fleischman, F., Lele, S., Martin, D. A., Messerli, P., Meyfroidt, P., Pfeifer, M., Rakotonarivo, S. O., Ramankutty, N., Ramprasad, V., Rana, P., Rhemtulla, J. M., Ryan, C. M., Vieira, I. C. G., … Garrett, R. D. (2023). How social considerations improve the equity and effectiveness of ecosystem restoration. BioScience, 73(2), 134–148. Link to source: https://doi.org/10.1093/biosci/biac099

Mariappan, M., & Zumbado, A. R. (2024). Global Restoration Commitments and Pledges: 2024 Report. International Union for the Conservation of Nature.

Melo, F. P. L., Parry, L., Brancalion, P. H. S., Pinto, S. R. R., Freitas, J., Manhães, A. P., Meli, P., Ganade, G., & Chazdon, R. L. (2021). Adding forests to the water–energy–food nexus. Nature Sustainability, 4(2), 85–92. Link to source: https://doi.org/10.1038/s41893-020-00608-z

Nabuurs, G.-J., Mrabet, R., Hatab, A. A., Bustamante, M., Clark, H., Havlík, P., House, J. I., Mbow, C., Ninan, K. N., Popp, A., Roe, S., Sohngen, B., & Towprayoon, S. (2022). Agriculture, forestry and other land uses (AFOLU). In P. R. Shukla, J. Skea, R. Slade, A. Al Khourdajie, R. van Diemen, D. McCollum, M. Pathak, S. Some, P. Vyas, R. Fradera, M. Belkacemi, A. Hasija, G. Lisboa, S. Luz, & J. Malley (Eds.), Climate change 2022: Mitigation of climate change. Contribution of working group III to the sixth assessment report of the intergovernmental panel on climate change (pp. 747–860). Cambridge University Press. Link to source: https://doi.org/10.1017/9781009157926.009 

Naidoo, R., Gerkey, D., Hole, D., Pfaff, A., Ellis, A. M., Golden, C. D., Herrera, D., Johnson, K., Mulligan, M., Ricketts, T. H., & Fisher, B. (2019). Evaluating the impacts of protected areas on human well-being across the developing world. Science Advances, 5(4), Article eaav3006. Link to source: https://doi.org/10.1126/sciadv.aav3006

North, M. P., Stevens, J. T., Greene, D. F., Coppoletta, M., Knapp, E. E., Latimer, A. M., Restaino, C. M., Tompkins, R. E., Welch, K. R., York, R. A., Young, D. J. N., Axelson, J. N., Buckley, T. N., Estes, B. L., Hager, R. N., Long, J. W., Meyer, M. D., Ostoja, S. M., Safford, H. D., … Wyrsch, P. (2019). Tamm review: Reforestation for resilience in dry western U.S. forests. Forest Ecology and Management, 432, 209–224. Link to source: https://doi.org/10.1016/j.foreco.2018.09.007

Pan, Y., Birdsey, R. A., Phillips, O. L., Houghton, R. A., Fang, J., Kauppi, P. E., Keith, H., Kurz, W. A., Ito, A., Lewis, S. L., Nabuurs, G.-J., Shvidenko, A., Hashimoto, S., Lerink, B., Schepaschenko, D., Castanho, A., & Murdiyarso, D. (2024). The enduring world forest carbon sink. Nature, 631(8021), 563–569. Link to source: https://doi.org/10.1038/s41586-024-07602-x

Piffer, P. R., Rosa, M. R., Tambosi, L. R., Metzger, J. P., & Uriarte, M. (2022). Turnover rates of regenerated forests challenge restoration efforts in the Brazilian Atlantic forest. Environmental Research Letters, 17(4), Article 045009. Link to source: https://doi.org/10.1088/1748-9326/ac5ae1

Poorter, L., van der Sande, M. T., Thompson, J., Arets, E. J. M. M., Alarcón, A., Álvarez-Sánchez, J., Ascarrunz, N., Balvanera, P., Barajas-Guzmán, G., Boit, A., Bongers, F., Carvalho, F. A., Casanoves, F., Cornejo-Tenorio, G., Costa, F. R. C., de Castilho, C. V., Duivenvoorden, J. F., Dutrieux, L. P., Enquist, B. J., … Peña-Claros, M. (2015). Diversity enhances carbon storage in tropical forests. Global Ecology and Biogeography, 24(11), 1314–1328. Link to source: https://doi.org/10.1111/geb.12364

Reddington, C. L., Butt, E. W., Ridley, D. A., Artaxo, P., Morgan, W. T., Coe, H., & Spracklen, D. V. (2015). Air quality and human health improvements from reductions in deforestation-related fire in Brazil. Nature Geoscience, 8(10), 768–771. Link to source: https://doi.org/10.1038/ngeo2535

Reddington, C. L., Smith, C., Butt, E. W., Baker, J. C. A., Oliveira, B. F. A., Yamba, E. I., & Spracklen, D. V. (2025). Tropical deforestation is associated with considerable heat-related mortality. Nature Climate Change, 15(9), 992–999. Link to source: https://doi.org/10.1038/s41558-025-02411-0

Reytar, K., Ferreira-Ferreira, J., Alves, L., Oliveira Cordeiro, C. L. de, & Calmon, M. (2024, December 19). What can tree cover gain data tell us about restoration? Brazil case studies. Global Forest Watch. Link to source: https://www.globalforestwatch.org/blog/forest-insights/tree-cover-gain-restoration-brazil

Robinson, N., Drever, C. R., Gibbs, D. A., Lister, K., Esquivel-Muelbert, A., Heinrich, V., Ciais, P., Silva-Junior, C. H. L., Liu, Z., Pugh, T. A. M., Saatchi, S., Xu, Y., & Cook-Patton, S. C. (2025). Protect young secondary forests for optimum carbon removal. Nature Climate Change, 15, 793–800. Link to source: https://doi.org/10.1038/s41558-025-02355-5

Roe, S., Streck, C., Beach, R., Busch, J., Chapman, M., Daioglou, V., Deppermann, A., Doelman, J., Emmet-Booth, J., Engelmann, J., Fricko, O., Frischmann, C., Funk, J., Grassi, G., Griscom, B., Havlik, P., Hanssen, S., Humpenöder, F., Landholm, D., … Lawrence, D. (2021). Land-based measures to mitigate climate change: Potential and feasibility by country. Global Change Biology, 27(23), 6025–6058. Link to source: https://doi.org/10.1111/gcb.15873

Sankey, T., Belmonte, A., Massey, R., & Leonard, J. (2021). Regional-scale forest restoration effects on ecosystem resiliency to drought: A synthesis of vegetation and moisture trends on Google Earth Engine. Remote Sensing in Ecology and Conservation, 7(2), 259–274. Link to source: https://doi.org/10.1002/rse2.186

Schimetka, L. R., Ruggiero, P. G. C., Carvalho, R. L., Behagel, J., Metzger, J. P., Nascimento, N., Chaves, R. B., Brancalion, P. H. S., Rodrigues, R. R., & Krainovic, P. M. (2024). Costs and benefits of restoration are still poorly quantified: Evidence from a systematic literature review on the Brazilian Atlantic Forest. Restoration Ecology, 32(5), Article e14161. Link to source: https://doi.org/10.1111/rec.14161

Seymour, F., Wolosin, M., & Gray, E. (2022, October 23). Policies underestimate forests’ full effect on the climate. World Resources Institute. Link to source: https://www.wri.org/insights/how-forests-affect-climate

Sims, M. J., Stanimirova, R., Raichuk, A., Neumann, M., Richter, J., Follett, F., MacCarthy, J., Lister, K., Randle, C., Sloat, L., Esipova, E., Jupiter, J., Stanton, C., Morris, D., Melhart Slay, C., Purves, D., & Harris, N. (2025). Global drivers of forest loss at 1 km resolution. Environmental Research Letters, 20(7), Article 074027. Link to source: https://doi.org/10.1088/1748-9326/add606

Stanturf, J. A., Kleine, M., Mansourian, S., Parrotta, J., Madsen, P., Kant, P., Burns, J., & Bolte, A. (2019). Implementing forest landscape restoration under the Bonn Challenge: A systematic approach. Annals of Forest Science, 76(2), 1–21. Link to source: https://doi.org/10.1007/s13595-019-0833-z

Teo, H. C., Raghavan, S. V., He, X., Zeng, Z., Cheng, Y., Luo, X., Lechner, A. M., Ashfold, M. J., Lamba, A., Sreekar, R., Zheng, Q., Chen, A., & Koh, L. P. (2022). Large-scale reforestation can increase water yield and reduce drought risk for water-insecure regions in the Asia-Pacific. Global Change Biology, 28(21), 6385–6403. Link to source: https://doi.org/10.1111/gcb.16404

van der Sande, M. T., Poorter, L., Kooistra, L., Balvanera, P., Thonicke, K., Thompson, J., Arets, E. J. M. M., Garcia Alaniz, N., Jones, L., Mora, F., Mwampamba, T. H., Parr, T., & Peña-Claros, M. (2017). Biodiversity in species, traits, and structure determines carbon stocks and uptake in tropical forests. Biotropica, 49(5), 593–603. Link to source: https://doi.org/10.1111/btp.12453

Veldman, J. W., Overbeck, G. E., Negreiros, D., Mahy, G., Le Stradic, S., Fernandes, G. W., Durigan, G., Buisson, E., Putz, F. E., & Bond, W. J. (2015a). Tyranny of trees in grassy biomes. Science, 347(6221), 484–485. Link to source: https://doi.org/10.1126/science.347.6221.484-c

Veldman, J. W., Overbeck, G. E., Negreiros, D., Mahy, G., Le Stradic, S., Fernandes, G. W., Durigan, G., Buisson, E., Putz, F. E., & Bond, W. J. (2015b). Where Tree Planting and Forest Expansion are Bad for Biodiversity and Ecosystem Services. BioScience, 65(10), 1011–1018. Link to source: https://doi.org/10.1093/biosci/biv118

Verhoeven, D., Berkhout, E., Sewell, A., & van der Esch, S. (2024). The global cost of international commitments on land restoration. Land Degradation & Development, 35(16), 4864–4874. Link to source: https://doi.org/10.1002/ldr.5263

Walker, W. S., Gorelik, S. R., Cook-Patton, S. C., Baccini, A., Farina, M. K., Solvik, K. K., Ellis, P. W., Sanderman, J., Houghton, R. A., Leavitt, S. M., Schwalm, C. R., & Griscom, B. W. (2022). The global potential for increased storage of carbon on land. Proceedings of the National Academy of Sciences, 119(23), Article e2111312119. Link to source: https://doi.org/10.1073/pnas.2111312119

Walton, Z. L., Poudyal, N. C., Hepinstall-Cymerman, J., Johnson Gaither, C., & Boley, B. B. (2016). Exploring the role of forest resources in reducing community vulnerability to the heat effects of climate change. Forest Policy and Economics, 71, 94–102. Link to source: https://doi.org/10.1016/j.forpol.2015.09.001 

Wang, Y., Zhu, Y., Cook-Patton, S. C., Sun, W., Zhang, W., Ciais, P., Li, T., Smith, P., Yuan, W., Zhu, X., Canadell, J. G., Deng, X., Xu, Y., Xu, H., Yue, C., & Qin, Z. (2025). Land availability and policy commitments limit global climate mitigation from forestation. Science, 389(6763), 931–934. Link to source: https://doi.org/10.1126/science.adj6841

Williams, B. A., Beyer, H. L., Fagan, M. E., Chazdon, R. L., Schmoeller, M., Sprenkle-Hyppolite, S., Griscom, B. W., Watson, J. E. M., Tedesco, A. M., Gonzalez-Roglich, M., Daldegan, G. A., Bodin, B., Celentano, D., Wilson, S. J., Rhodes, J. R., Alexandre, N. S., Kim, D.-H., Bastos, D., & Crouzeilles, R. (2024). Global potential for natural regeneration in deforested tropical regions. Nature, 636(8041), 131–137. Link to source: https://doi.org/10.1038/s41586-024-08106-4

Zhang, Q., Barnes, M., Benson, M., Burakowski, E., Oishi, A. C., Ouimette, A., Sanders-DeMott, R., Stoy, P. C., Wenzel, M., Xiong, L., Yi, K., & Novick, K. A. (2020). Reforestation and surface cooling in temperate zones: Mechanisms and implications. Global Change Biology, 26(6), 3384–3401. Link to source: https://doi.org/10.1111/gcb.15069

Credits

Lead Fellow

  • Avery Driscoll, Ph.D.

Contributors

  • Ruthie Burrows, Ph.D.

  • James Gerber, Ph.D.

  • Daniel Jasper

  • Alex Sweeney

Internal Reviewers

  • James Gerber, Ph.D.

  • Megan Matthews, Ph.D.

  • Paul C. West, Ph.D.

Effectiveness

We estimated that forest restoration can sequester 5.86–18.19 t CO₂‑eq /ha/yr (Table 1), depending on the climate zone and type of intervention, as growing trees take up carbon through photosynthesis and store it in above- and below-ground biomass. Sequestration rates are highly variable globally; much of this variability is driven by climate, soil properties, forest type, and the type of restoration. 

For this solution, we used modeled carbon sequestration rates from natural regeneration to represent low-intensity restoration (Robinson et al., 2025) and modeled carbon sequestration rates from plantation forests to represent high-intensity carbon restoration, which we define as initiatives that include tree planting (Bukoski et al., 2022; Busch et al., 2024). We calculated carbon sequestration rates at the climate zone level (boreal, temperate, subtropical, and tropical) across the potential extent for each reforestation type.

Generally, high-intensity restoration has higher sequestration rates (median values 12.02–18.19 t CO₂‑eq /ha/yr) than low-intensity restoration (median values 5.86–17.06 t CO₂‑eq /ha/yr). Median effectiveness is also higher in tropical areas, where forest growth often continues year-round, than it is in other climate zones. These estimates reflect average sequestration rates over the first 30 years of forest growth. Carbon sequestration rates are also influenced by non-climatic factors. For example, higher tree species diversity is often associated with higher forest carbon storage and uptake (Bialic-Murphy et al., 2024; Poorter et al., 2015; van der Sande et al., 2017).

Table 1. Effectiveness of forest restoration at sequestering carbon.

Unit: t CO₂‑eq /ha/yr, 100-yr basis

Boreal 5.86
Temperate 11.49
Subtropical 11.53
Tropical 17.06

Unit: t CO₂‑eq /ha/yr, 100-yr basis

Boreal 14.57
Temperate 12.74
Subtropical 12.02
Tropical 18.19
Left Text Column Width
Cost

We estimated the median cost of low-intensity forest restoration at US$23/t CO₂‑eq (2023 US$) and the median cost of high-intensity forest restoration at US$83/t CO₂‑eq (Table 2). The value given in the dashboard above is the average of the low- and high-intensity cost estimates (US$53/t CO₂‑eq). 

On a per-hectare basis, the estimated cost of low-intensity restoration ranges from US$213/ha (25th percentile) to US$739/ha (75th percentile), with a median cost of US$304/ha. The estimated cost of high-intensity restoration ranges from US$811/ha (25th percentile) to US$1,914/ha (75th percentile), with a median of US$1,348/ha. We derived these estimates from compilations of global restoration project cost data by Verhoeven et al. (2024) and Busch et al. (2024), supplemented with estimates from five additional publications, representing a total of 50 unique projects.

Estimates of restoration costs remain very uncertain, as data are scarce, costs and revenues are highly variable across geographies and projects, and costs are nonlinear, tending to increase under higher adoption scenarios (Austin et al., 2020; Schimetka et al., 2024). Moreover, the success of a project at establishing new forests drives the cost per metric ton of CO₂‑eq , but such success rates are rarely reported alongside costs. Because of data limitations, we did not separate cost estimates into climate zones. 

Our estimates do not account for any new revenues associated with forest restoration, such as carbon credits or provisioning of timber and non-timber forest products (Adams et al. 2016; Ager et al., 2017; Busch et al., 2024). They also do not account for the economic value of ecosystem services, such as increased biodiversity, improved water quality, local cooling, and reduced soil erosion, which have been estimated to outweigh the costs of forest restoration (De Groot et al., 2013).

Table 2. Cost per unit of climate impact.

Unit: 2023 US$/t CO₂‑eq , 100-yr basis

Median 23

Unit: 2023 US$/t CO₂‑eq , 100-yr basis

Median 83
Left Text Column Width

Methods and Supporting Data

Learning Curve

We define a learning curve as falling costs with increased adoption. Reforestation has been practiced for many decades, and there is no evidence of a decrease in costs associated with increasing adoption. Therefore, there is no learning curve for this solution.

Speed of Action

Speed of action refers to how quickly a climate solution physically affects the atmosphere after it is deployed. This is different from speed of deployment, which is the pace at which solutions are adopted.

At Project Drawdown, we define the speed of action for each climate solution as emergency brake, gradual, or delayed.

Restore Forests is a DELAYED climate solution. It works more slowly than gradual or emergency brake solutions. Delayed solutions can be robust climate solutions, but it’s important to recognize that they may not realize their full potential for some time.

Caveats

Barriers to effective forest restoration include challenges around governance, financing, technical capacity (including seed and seedling supply), labor availability, and site-specific knowledge for initial restoration and long-term management (Brumberg et al., 2024; Chazdon et al., 2016; Chazdon et al., 2021; Fargione et al., 2021; Kroeger et al., 2025). Additional research and monitoring are needed to identify locally relevant restoration strategies, reduce barriers, and evaluate the success of restoration projects (Crouzeilles et al., 2019).

Forest restoration also faces challenges around permanence and additionality. Carbon stored in vegetation and soils through forest restoration can be lost to climatic and environmental stressors like wildfire, drought, heat waves, pests, or disease. Young, regenerating forests can be particularly susceptible to these types of stressors. Restored forests are also at risk of clearing (e.g., Piffer et al., 2022), so forest restoration must be coupled with long-term, effective protections against clearing. Additionality refers to the degree to which carbon uptake associated with forest restoration would have occurred in the absence of a project, policy, or incentive. Evaluating additionality is challenging in the context of natural forest regeneration, some of which simply arises from land abandonment without any intervention.

Current Adoption

Data on current adoption of forest restoration are very limited. While there are extensive compilations of restoration pledges, estimates of the actual area being restored are noncentralized, typically rely on self-reporting without validation, do not have global coverage, use inconsistent definitions, often include establishment of plantations and agroforestry, and rarely separate estimates by ecosystem. Satellite-based data on tree cover gain are occasionally used as a proxy for restoration, but these do not differentiate among restoration, establishment of timber plantations, regeneration in the absence of human intervention, and plantation regrowth after timber harvest (Reytar et al., 2024). Moreover, they can fail to capture actual restoration areas (Begliomini & Brancalion, 2024).

Due to these limitations, we do not provide an estimate of the global area currently under forest restoration. However, we did compile current restoration estimates from three databases: The Mongabay Reforestation Catalog, The Restoration Initiative, and The Restoration Barometer. These databases are subject to the limitations discussed above. Assuming that there is no overlap in projects reported across these databases, including projects with an agroforestry component, and including projects across all ecosystems, we found 40.6 Mha currently being restored. Under more conservative assumptions, including removing projects with an agroforestry component, removing projects from countries that are reported across multiple databases, and discounting estimates to account for restoration in other ecosystems, we estimated that 9.2 Mha are currently being restored. These estimates provide context, but should not be interpreted as representative of the global area under forest restoration.

Adoption Trend

Despite extensive data on restoration pledges, comprehensive data on the actual implementation of restoration efforts are very limited and not often temporally resolved. The available data are insufficient to calculate an adoption trend for this solution.

Adoption Ceiling

We estimated that there are 96.8 Mha available for forest restoration, with 19.4 Mha in boreal regions, 19.0 Mha in temperate regions, 3.5 Mha in the subtropics, and 54.8 Mha in the tropics (Table 3a–e). In this solution, we only included cleared areas that were previously forests in the calculation of the adoption ceiling. To calculate the adoption ceiling, we started with a recent, conservative map of potential forest restoration areas (Fesenmeyer et al., 2025), which we masked to exclude areas classified as other ecosystems in other solutions (peatlands, grasslands and savannahs, and coastal wetlands). We then used a map of the cost-effectiveness of natural regeneration versus plantation establishment (Busch et al., 2024) to remove areas more suitable for plantation establishment from this solution, and assigned them instead to the Deploy Biomass Crops on Degraded Land solution.

Estimates of the area available for forest restoration vary widely due to differing definitions, ranging from 195 Mha (Fesenmeyer et al., 2025) to 900 Mha (Bastin et al., 2019), for example. Using base maps of forest restoration potential from Griscom et al. (2017) and Walker et al. (2022) gave an estimated global adoption ceiling of 426–434 Mha, after applying the same data processing approach to exclude other ecosystems and plantations. 

Because of the constrained scope of this solution, we find a smaller adoption ceiling relative to other studies, which often include plantation establishment, agroforestry, densification of existing forests, afforestation on grasslands, restoration of forests on peat soils, reforestation of croplands, and other activities sometimes classified as forest restoration. We leveraged the map from Fesenmeyer et al. (2025) for the estimates reported in Table 3 because its scope aligns most closely with our relatively narrow definition of forest restoration, is one of the most recent studies, includes a review of 89 other forest restoration maps, and incorporates safeguards against conflicts between restoration and biodiversity loss, water scarcity, albedo effects, and land use. However, we note that this estimate is lower than other published estimates of potential forest restoration area and that differences across studies are driven by subjective judgments on land suitability for restoration.

Table 3. Adoption ceiling.

Unit: ha available for restoration

Estimate 19,400,000

Unit: ha available for restoration

Estimate 19,000,000

Unit: ha available for restoration

Estimate 3,500,000

Unit: ha available for restoration

Estimate 54,800,000

Unit: ha available for restoration

Estimate 96,800,000
Left Text Column Width
Achievable Adoption

We assumed an achievable range of 50–75% of the adoption ceiling, equal to 48.4–72.6 Mha of forest restoration (Table 4a–e). Much of the adoption potential is located in the tropics, which we estimated to contain 27.4 Mha under the Achievable – Low Scenario and 41.1 Mha under the Achievable – High Scenario. We estimated similar achievable ranges of forest restoration area in boreal and temperate regions (9.7–14.6 Mha and 9.5–14.3 Mha, respectively), and an additional 1.7–2.6 Mha in subtropical regions.

Additional research is needed to determine more realistic estimates of the achievable adoption range, particularly differentiated across different restoration activities. National commitments to restoration, as with studies on the potential restoration area, include many activities that are beyond the scope of this solution, such as plantation establishment, agroforestry, and densification. Because of the inconsistency in definitions, we were unable to rely on restoration commitments to quantify the adoption achievable range. For context, the Global Restoration Commitments database (Mariappan & Zumbado, 2024) reports that, under the Rio Conventions, countries have committed to increasing forestland by 122 Mha, with an additional 154 Mha of commitments to restoring or improving forestland. Similarly, 210.1 Mha of land have been pledged for restoration across all ecosystems under the Bonn Challenge (Mariappan & Zumbado, 2024).

Table 4. Range of achievable adoption levels.

Unit: ha

Current adoption NA
Achievable – low 9,700,000
Achievable – high 14,600,000
Adoption ceiling 19,400,000

Unit: ha

Current adoption NA
Achievable – low 9,500,000
Achievable – high 14,300,000
Adoption ceiling 19,000,000

Unit: ha

Current adoption NA
Achievable – low 1,700,000
Achievable – high 2,600,000
Adoption ceiling 3,500,000

Unit: ha

Current adoption NA
Achievable – low 27,400,000
Achievable – high 41,100,000
Adoption ceiling 54,800,000

Unit: ha

Current adoption NA
Achievable – low 48,400,000
Achievable – high 72,600,000
Adoption ceiling 96,800,000
Left Text Column Width

We estimated that forest restoration could sequester 0.718 Gt CO₂‑eq/yr at the low-achievable adoption scenario, 1.077 Gt CO₂‑eq/yr at the high-achievable adoption scenario, and 1.437 Gt CO₂‑eq/yr at the adoption ceiling (Table 5a–e). Nearly 70% of the total climate impacts under these scenarios occur in tropical regions, where much of the current investment in restoration is focused.

Our climate impact estimates are lower than existing literature estimates due to our more constrained definition of this solution. Existing estimates also vary widely. For example, Cook-Patton et al. (2020) estimated that fully implemented national forest restoration commitments as of 2020 would take up 5.9 Gt CO₂‑eq/yr, while the Intergovernmental Panel on Climate Change (IPCC) reported an economically feasible mitigation potential of 1.6 Gt CO₂‑eq/yr (Nabuurs et al., 2022), and Griscom et al. (2017) reported a technical mitigation potential of 10.1 Gt CO₂‑eq/yr. Recently, Wang et al. (2025) estimated an upper-end mitigation potential of 5.85 Gt CO₂‑eq/yr (including afforestation and plantation establishment), with current commitments across all of these activities projected to take up 1.8 Gt CO₂‑eq/yr. Discrepancies between estimates are driven by the area considered suitable for restoration, types of restoration activities considered and their associated carbon uptake rates, and inclusion of cost constraints. Each of these individual estimates is also associated with substantial uncertainty, and further work is needed to standardize definitions of forest restoration and constrain the range of impact estimates.

Table 5. Climate impact at different levels of adoption.

Unit: Gt CO₂‑eq/yr, 100-year basis

Current adoption NA
Achievable – low 0.099
Achievable – high 0.149
Adoption ceiling 0.198

Unit: Gt CO₂‑eq/yr, 100-year basis

Current adoption NA
Achievable – low 0.115
Achievable – high 0.173
Adoption ceiling 0.230

Unit: Gt CO₂‑eq/yr, 100-year basis

Current adoption NA
Achievable – low 0.020
Achievable – high 0.031
Adoption ceiling 0.041

Unit: Gt CO₂‑eq/yr, 100-year basis

Current adoption NA
Achievable – low 0.483
Achievable – high 0.725
Adoption ceiling 0.966

Unit: Gt CO₂‑eq/yr, 100-year basis

Current adoption NA
Achievable – low 0.718
Achievable – high 1.077
Adoption ceiling 1.437
Left Text Column Width
Additional Benefits

Heat Stress

Forests help regulate local climate by reducing temperature extremes (Lawrence et al., 2022; Walton et al., 2016). Zhang et al. (2020) found the land surfaces of restored forests were 1–2 °C cooler than grasslands.

Extreme Weather Events

Forest restoration can improve biodiversity and health of the ecosystem, leading to more ecological resilience (DeGroot et al., 2013; Hua et al., 2022). Restored forests can intercept rainfall and attenuate flood risk during extreme rainfall events (Kabeja et al., 2020; Gardon et al., 2020). In some climates, certain reforestation methods could increase ecosystem resilience to wildfires (North et al., 2019).

Floods

For a description of the flood benefits, please refer to the “Extreme Weather Events” subsection. 

Droughts

Forest restoration may increase or decrease the ecosystem’s resilience to drought, depending on changes in factors such as evapotranspiration, precipitation, and water storage in vegetation (Andres et al., 2022; Sankey et al., 2020; Teo et al., 2022). For example, Teo et al. (2022) found that reforestation of degraded lands reduced the probability of experiencing extremely dry conditions in water-insecure regions of East Asia.

Income and Work

Forest restoration creates both temporary and permanent job opportunities, especially in rural areas (DeGroot et al., 2013). A study in Brazil found that restoration can generate about 0.42 jobs per hectare of forest undergoing restoration (Brancalion et al., 2022). Restoration of forests may also improve livelihoods and income opportunities based on the ecosystem services the forest provides. While these benefits vary substantially with household and community characteristics, in general, they include income diversification and the availability of food and fiber from forests (Adams et al., 2016). For example, in Burkina Faso, smallholders who restored lands through assisted regeneration diversified their income by harvesting resources such as fodder for livestock and small wildlife (Kumar et al., 2015). 

Food Security

Forests provide income and livelihoods for subsistence households and individuals (de Souza et al., 2016; Herrera et al., 2017; Naidoo et al., 2019). Forest restoration may improve food security for some households by improving incomes and livelihoods.

Health

Reforestation may promote the health of nearby communities. Herrera et al. (2017) found that in rural areas of low- and middle-income countries, household members living downstream of higher tree cover had a lower probability of diarrheal disease. Biodiverse forests are linked to a reduced risk of animal-to-human infections because zoonotic hosts tend to be less abundant in less disturbed ecosystems (Keesing & Ostfeld, 2021; Reddington et al., 2015).

Equality

Indigenous peoples have a long history of caring for and shaping landscapes that are rich with biodiversity (Fletcher et al., 2021), and restoring the health and function of forests is essential for protecting indigenous cultural values and practices. Indigenous communities provide vital ecological functions for preserving landscape health, such as seed dispersal and predation (Bliege Bird & Nimmo, 2018). Indigenous peoples also have spiritual and cultural ties to their lands (Garnett et al., 2018). Restoration must be implemented using an equity-centered approach that reduces power imbalances between stakeholders, ensures people are not displaced, and involves local actors (Löfqvist et al., 2023).

Nature Protection

Forests are home to a wide range of species and habitats and are essential for safeguarding biodiversity. Reforestation of native forests increases the biodiversity of an ecosystem relative to its previous cleared state (Brancalion et al., 2025; Hua et al., 2022). While many factors, such as the restoration method, time since restoration, and biophysical conditions, can impact restoration, studies of reforestation report increases in biodiversity and more species abundance after restoration, though the biodiversity typically remains below that of intact forests (Crouzeilles et al., 2016; Hua et al., 2022).

Water Quality

The impacts of reforestation on water quality vary based on factors such as geography and time since undergoing restoration (Dib et al., 2023). In general, forests act as natural water filters, maintaining and improving water quality (Dib et al., 2023; Melo et al., 2021). Restoration of forests is associated with improved water quality in streams compared with their previously degraded state (dos Reis Oliveira et al., 2025).

Risks

Forest restoration initiatives that are not responsive to local socioeconomic conditions risk displacing community land access and compromising local livelihoods. Effective forest restoration activities can be highly diverse, but must be targeted towards local environmental, sociopolitical, and economic conditions (Stanturf et al., 2019). 

If forest restoration encroaches on agricultural lands, it can trigger clearing of forests elsewhere to replace lost agricultural production. 

Planting trees in areas where they do not naturally occur, such as in grasslands and savannas, can alter hydrologic cycles and harm biodiversity (Veldman et al., 2015a; Veldman et al., 2015b). The estimates of potential forest restoration area that we use in this analysis are constrained to minimize these risks by including only land that was once forested and not allowing for forest restoration on croplands or in urban areas.

Interactions with Other Solutions

Reinforcing

Forest restoration can improve the health and function of adjacent ecosystems that are being protected or restored.

Competing

These solutions are all suitable to implement on degraded land, and thus are in competition for the available degraded land.

Dashboard

Solution Basics

ha under restoration

t CO₂-eq (100-yr)/unit/yr
09.4410.21median
units
Current Not Determined 09.7×10⁶1.46×10⁷
Achievable (Low to High)

Climate Impact

Gt CO₂-eq (100-yr)/yr
Current Not Determined 0.0990.149
US$ per t CO₂-eq
53
Delayed

CO₂

Solution Basics

ha under restoration

t CO₂-eq (100-yr)/unit/yr
010.1612.11median
units
Current Not Determined 09.5×10⁶1.43×10⁷
Achievable (Low to High)

Climate Impact

Gt CO₂-eq (100-yr)/yr
Current Not Determined 0.1150.173
US$ per t CO₂-eq
53
Delayed

CO₂

Solution Basics

ha under restoration

t CO₂-eq (100-yr)/unit/yr
09.6811.78median
units
Current Not Determined 01.7×10⁶2.6×10⁶
Achievable (Low to High)

Climate Impact

Gt CO₂-eq (100-yr)/yr
Current Not Determined 0.0210.031
US$ per t CO₂-eq
53
Delayed

CO₂

Solution Basics

ha under restoration

t CO₂-eq (100-yr)/unit/yr
014.6717.63median
units
Current Not Determined 02.74×10⁷4.11×10⁷
Achievable (Low to High)

Climate Impact

Gt CO₂-eq (100-yr)/yr
Current Not Determined 0.4830.725
US$ per t CO₂-eq
53
Delayed

CO₂

Trade-offs

Forest restoration can divert resources from other climate solutions, including protecting intact forests. Humans clear approximately 0.4% of forests annually (Curtis et al., 2018; Hansen et al., 2013; Sims et al., 2025), and halting further deforestation is an urgent priority with huge benefits for the climate, biodiversity, and other ecosystem services (see Protect Forests). While restoration provides carbon sequestration over a period of decades, preventing deforestation reduces emissions immediately and is typically more cost-effective. Restoration should therefore complement, rather than compete with, efforts to reduce deforestation.

Forest restoration can also decrease the albedo, or reflectivity, of Earth’s surface. This can increase temperatures as more of the sun’s energy is absorbed and reradiated as thermal energy. Albedo effects are most pronounced in boreal and dryland regions, where they reduce the net climate benefits of forest restoration (Hasler et al., 2024).

t CO2-eq/ha/yr
025

CO2 sequestration potential from low-intensity forest restoration on suitable lands

Regrowth of deforested areas can sequester carbon in biomass. Here we show potential annual carbon sequestration by natural regrowth in areas where at least 5% of the landscape is deforested and where forest restoration would not adversely impact food production or existing communities. Green shaded areas indicate locations where this solution is effective; zoom in for details.

Fesenmyer, K. A., Poor, E. E., Terasaki Hart, D. E., Veldman, J. W., Fleischman, F., Choksi, P., Archibald, S., Armani, M., Fagan, M. E., Fricke, E. C., Terrer, C., Hasler, N., Williams, C. A., Ellis, P. W., & Cook-Patton, S. C. (2025). Addressing critiques refines global estimates of reforestation potential for climate change mitigation. Nature Communications, 16(1), Article 4572. Link to source: https://doi.org/10.1038/s41467-025-59799-8 

Global Forest Watch (2023). Global peatlands [Data set]. Retrieved December 6, 2024, from Link to source: https://data.globalforestwatch.org/datasets/gfw::global-peatlands/about 

Robinson, N., Drever, C. R., Gibbs, D. A., Lister, K., Esquivel-Muelbert, A., Heinrich, V., Ciais, P., Silva-Junior, C. H. L., Liu, Z., Pugh, T. A. M., Saatchi, S., Xu, Y., & Cook-Patton, S. C. (2025). Protect young secondary forests for optimum carbon removal. Nature Climate Change, 15, 793–800. Link to source: https://doi.org/10.1038/s41558-025-02355-5 

Spawn, S. A., Sullivan, C.C., Lark, T.J., & Gibbs, H.K. (2020). Harmonized global maps of above and belowground biomass carbon density in the year 2010. Scientific Data, 7, 112 Link to source: https://doi.org/10.1038/s41597-020-0444-4 

UNEP-WCMC (2025). Ocean+ habitats (version 1.3) [Data set]. Retrieved November 2024, from habitats.oceanplus.org

t CO2-eq/ha/yr
025

CO2 sequestration potential from low-intensity forest restoration on suitable lands

Regrowth of deforested areas can sequester carbon in biomass. Here we show potential annual carbon sequestration by natural regrowth in areas where at least 5% of the landscape is deforested and where forest restoration would not adversely impact food production or existing communities. Green shaded areas indicate locations where this solution is effective; zoom in for details.

Fesenmyer, K. A., Poor, E. E., Terasaki Hart, D. E., Veldman, J. W., Fleischman, F., Choksi, P., Archibald, S., Armani, M., Fagan, M. E., Fricke, E. C., Terrer, C., Hasler, N., Williams, C. A., Ellis, P. W., & Cook-Patton, S. C. (2025). Addressing critiques refines global estimates of reforestation potential for climate change mitigation. Nature Communications, 16(1), Article 4572. Link to source: https://doi.org/10.1038/s41467-025-59799-8 

Global Forest Watch (2023). Global peatlands [Data set]. Retrieved December 6, 2024, from Link to source: https://data.globalforestwatch.org/datasets/gfw::global-peatlands/about 

Robinson, N., Drever, C. R., Gibbs, D. A., Lister, K., Esquivel-Muelbert, A., Heinrich, V., Ciais, P., Silva-Junior, C. H. L., Liu, Z., Pugh, T. A. M., Saatchi, S., Xu, Y., & Cook-Patton, S. C. (2025). Protect young secondary forests for optimum carbon removal. Nature Climate Change, 15, 793–800. Link to source: https://doi.org/10.1038/s41558-025-02355-5 

Spawn, S. A., Sullivan, C.C., Lark, T.J., & Gibbs, H.K. (2020). Harmonized global maps of above and belowground biomass carbon density in the year 2010. Scientific Data, 7, 112 Link to source: https://doi.org/10.1038/s41597-020-0444-4 

UNEP-WCMC (2025). Ocean+ habitats (version 1.3) [Data set]. Retrieved November 2024, from habitats.oceanplus.org

Maps Introduction

Tropical regions have particularly large potential for forest restoration. Regrowing forests tend to have higher rates of carbon uptake in the tropics, particularly in humid areas, than in regions where shorter growing seasons and water limitations can constrain growth (e.g., Cook-Patton et al., 2020, Bernal et al., 2018). Our estimates of effectiveness suggest that carbon uptake rates in the tropics are almost 20% higher than those in temperate and subtropical regions. 

There are also large areas of recently deforested land in the tropics that are suitable for restoration. Recently deforested lands tend to have larger seed stocks in the soil and may be in proximity to intact forest patches, conditions that can improve the success of low-intensity restoration efforts (Chazon et al., 2016). Using three existing maps of potential forest restoration extent, our estimates suggest that ~43% of the adoption ceiling for forest restoration is located in tropical regions. 

Temperate regions, which have historically experienced widespread and severe deforestation, have the second-most area available for forest restoration. Some deforested areas have already been returned to forest cover, and some have been converted to permanent cropland or urban development, land-cover classes that are excluded from this analysis because they are typically not considered suitable for restoration in large-scale studies (Fesenmeyer et al., 2025). Temperate regions contain an additional ~28% of the area suitable for forest restoration.

Locally, forest restoration efforts that are targeted towards expanding and improving connectivity of existing forests may provide the largest carbon benefits by reducing edge effects (Chaplin-Kramer et al., 2015). Forest connectivity and patch size are also important predictors of the benefits for biodiversity and other ecosystem services (Beltrão et al., 2024; Di Sacco et al., 2020). Additionally, areas close to existing forests are often more suitable for natural regeneration, which can be cheaper and more efficient to implement than tree planting (Busch et al., 2024; Di Sacco et al., 2020; Williams et al., 2024).

In addition to sequestering carbon, forest restoration can influence the climate by changing albedo, or the reflectivity of Earth’s surface. In places where increasing tree cover makes the surface less reflective, the resultant biophysical warming can offset the climate benefits of carbon sequestration (Betts, 2000; Hasler et al., 2024). These effects tend to be particularly large in drylands, which have low native vegetation cover, and boreal regions, which have persistent snow cover. Therefore, some studies omit boreal regions from their estimates of potential forest restoration (Griscom et al., 2017).

Action Word
Restore
Solution Title
Forests
Classification
Highly Recommended

Lawmakers and Policymakers

  • Set achievable targets and pledges for forest restoration with clear effectiveness goals; regularly measure and report on restoration progress, area under restoration, challenges, and related data points.
  • Help develop definitions at the international level for forest restoration and degradation along with frameworks for measurement and monitoring; design indicators to capture long-term impacts, including metrics to capture social and biodiversity impacts.
  • Ensure public procurement uses deforestation-free products and sustainable products from reforested areas.
  • Create strong regulatory frameworks with clear definitions for active and passive restoration and/or related terms such as reforestation, regeneration, improving forest functionality, and increasing forest cover; ensure the framework is gender responsive and seeks to include women throughout the restoration process.
  • Coordinate forest protection and restoration policies horizontally (e.g., across agencies) and vertically (e.g., across subnational, national, and international efforts); seek to align social and environmental safeguards with protection and reforestation policies and goals.
  • Develop regional and transboundary coordination mechanisms for protection and restoring forests, especially, when working across international borders; consider using coordination methods from adjacent issue areas such as water management and/or working closely with existing coordination bodies for relevant watersheds.
  • Prioritize forest protection first and restoring forests second; ensure areas under restoration are classified as protected lands.
  • Create financial incentives for both active and passive restoration techniques, such as direct payments, payment for ecosystem services (PES), property tax breaks, rebates, subsidies, and cash prizes for meeting tree and/or vegetative growth metrics; ensure incentives allow for long timelines; provide similar incentives to reduce fertilizer use; ensure equitable access to incentives for low- and middle-income communities.
  • Provide financial incentives for businesses that support restoration by developing sustainable products.
  • Create disincentives by taxing or fining land clearance, deforestation, poor land management, and agricultural pollution.
  • Remove harmful agriculture and logging subsidies, particularly those that incentivize livestock, biofuels, land encroachment, and overuse of fertilizers.
  • Seek to designate lands for reforestation that are adjacent to or connect with already protected areas, intact lands, and/or watersheds.
  • Delegate the authority to allocate direct payments for fiscal incentives to local governments.
  • Use tax revenues from extractive industries to pay for restoration.
  • Use taxes from beneficiaries of forest services to pay for nearby restoration (e.g., use taxes from downstream users to improve practices upstream); before instituting such a tax regime, consult with stakeholders, clearly define tax arrangements, and put into place strict enforcement measures.
  • Create an ongoing, equity-centered community engagement process; ensure local communities help shape local projects and receive benefits.
  • Strengthen land and tree tenure rights; grant Indigenous communities’ full property rights and autonomy.
  • Ensure projects operating in or with Indigenous communities only do so under free, prior, and informed consent (FPIC); codify FPIC into legal systems.
  • Ensure regulations allow and encourage a variety of legal models for reforestation efforts, such as cooperatives.
  • Prioritize reducing food loss and waste and improving diets.
  • Invest in R&D to identify best practices, where reforestation is viable, and how to improve the local enabling environment(s).
  • When possible, use social science research to determine the best interventions, incentives, and community engagement models before beginning restoration projects.
  • Create programs to monitor for activity and market leakage from reforestation sites; adjust enforcement and policies to reduce leakage, if necessary.
  • Foster national pride for the natural landscape and reforestation efforts through communication campaigns.
  • Work with public universities and other educational institutions to develop degree and certification programs in forest restoration; encourage them to offer subspecialities, such as protected lands governance, management, policy, and finance.
  • Create educational programs that work with schools, universities, NGOs, and the general public to inform communities how to participate in restoration efforts, benefits, and opportunities; expand extension services to develop local capacity in forest restoration, especially in community-led monitoring and evaluation; establish knowledge-sharing initiatives with Indigenous peoples.
  • Join, create, or participate in public-private partnerships dedicated to mobilizing financing, restoration activities, knowledge transfers, general education, and other relevant areas.
  • Join, support, or create certification schemes that verify restoration activity and sustainable use of forest products.

Further information:

Practitioners

  • Set achievable targets and pledges for forest restoration with clear effectiveness goals.
  • Help develop regulatory frameworks with clear definitions for active and passive restoration and/or related terms such as reforestation, regeneration, improving forest functionality, and increasing forest cover; ensure the framework is gender responsive and seeks to include women throughout the restoration process.
  • Help develop definitions at the international level for forest restoration and degradation along with frameworks for measurement and monitoring; design indicators to capture long term impacts, including metrics to capture social and biodiversity impacts.
  • Help develop or advocate for regional and transboundary coordination mechanisms for restoring forests, especially, when working across international borders; consider using coordination methods from adjacent issue areas such as water management and/or working closely with existing coordination bodies for relevant watersheds.
  • Offer or take advantage of financial incentives such as direct payments or PES; if necessary, advocate for public incentives for both active and passive restoration, such as property tax breaks, rebates, subsidies, and cash prizes for meeting tree and/or vegetative growth metrics; help ensure incentives allow for long timelines; help ensure equitable access to incentives for low- and middle-income communities.
  • Seek to designate lands for reforestation that are adjacent to or connect with already protected areas, intact lands, and/or watersheds.
  • Create an ongoing, equity-centered community engagement process; ensure local communities help shape local projects and receive benefits.
  • Advocate for strong land and tree tenure rights; support Indigenous property rights and autonomy.
  • Ensure projects operating in or with Indigenous communities only do so under FPIC; help codify FPICinto legal systems.
  • Help create high-integrity carbon markets with long durations; use dynamic baselines for more accurate additionality assessments.
  • Create programs to monitor for activity and market leakage from reforestation sites; advocate for adjustments to enforcement and policies to reduce leakage, if necessary.
  • Develop markets for native species products and other sustainable uses of reforested lands.
  • Develop or support opportunities for ecotourism industries in locally restored forests.
  • Explore and use alternative legal models for reforestation, such as cooperatives.
  • Invest in R&D to identify best practices, where reforestation is viable, and how to improve the local enabling environment(s).
  • When possible, use social science research to determine the best interventions, incentives, and community engagement models before beginning restoration projects.
  • Help foster pride for natural landscape and reforestation efforts through communication campaigns.
  • Work with educational institutions to develop degree and certification programs in forest restoration; encourage them to offer subspecialities such as protected lands governance, management, policy, and finance.
  • Create educational programs that work with schools, NGOs, and the general public to inform communities how to participate in restoration efforts, benefits, and opportunities; advocate for expanded extension services to develop local capacity in forest restoration, especially in community-led monitoring and evaluation; establish knowledge-sharing initiatives with Indigenous peoples.
  • Join, create, or participate in public-private partnerships dedicated to mobilizing financing, restoration activities, knowledge transfers, general education, and other relevant areas.
  • Join, support, or create certification schemes that verify restoration activity and sustainable use of forest products.

Further information:

Business Leaders

  • Create deforestation-free supply chains, using data, information, and the latest technology to inform product sourcing.
  • Develop markets and supply chains for native species products; innovate other sustainable uses for resources from reforested lands.
  • Integrate deforestation-free business and investment policies and practices into your net-zero strategies.
  • Develop or support opportunities for ecotourism in restored forests.
  • Offer company grants to suppliers or others to improve resource management and support reforestation within your supply chain.
  • Offer incubator services for those restoring forests; offer pro bono business advice or general support for community restoration projects.
  • Enter into outgrower schemes to support smallholder farmers restoring their land; make long-term commitments to help stabilize projects.
  • Contribute to local restoration efforts; use an internal carbon fee or set aside a percentage of revenue to fund reforestation.
  • Only purchase carbon credits from high-integrity, verifiable carbon markets, and do not use them as replacements for reducing emissions.
  • Help create high-integrity carbon markets with long durations; use dynamic baselines for additionality assessments.
  • Help shift the public narrative around carbon markets as integrity increases to boost education, dialogue, and awareness.
  • Develop financial instruments to invest in reforestation, focusing on supporting Indigenous communities.
  • Amplify the voices of local communities and civil society to promote robust media coverage.
  • Offer employee professional development funds to be used for certification in reforestation or related fields such as curricular economies.
  • Create company volunteer opportunities such as annual-tree planting days; consider partnering with a relevant local non-profit.
  • Join, create, or participate in public-private partnerships dedicated to mobilizing financing, restoration activities, knowledge transfers, general education, and other relevant areas.
  • Join, support, or create certification schemes that verify restoration activity and sustainable use of forest products.

Further information:

Nonprofit Leaders

  • Use deforestation-free products and sustainable products from reforested areas.
  • Help manage restoration projects; consider using alternatives to corporate business structures such as cooperatives to facilitate management and legal structures.
  • Advocate for achievable public targets and pledges for forest restoration with clear effectiveness goals.
  • Help develop regulatory frameworks with clear definitions for active and passive restoration and/or related terms such as reforestation, regeneration, improving forest functionality, and increasing forest cover; ensure the framework is gender responsive and seeks to include women throughout the restoration process.
  • Help develop definitions at the international level for forest restoration and degradation along with frameworks for measurement and monitoring; design indicators to capture long-term impacts, including social and biodiversity impacts.
  • Help develop or advocate for regional and transboundary coordination mechanisms for restoring forests, especially, when working across international borders; consider using coordination methods from adjacent issue areas such as water management and/or working closely with existing coordination bodies for relevant watersheds.
  • Offer or take advantage of financial incentives such as direct payments or PES; if necessary, advocate for public incentives such as property tax breaks, rebates, subsidies, and cash prizes for meeting tree and/or vegetative growth metrics; help ensure incentives allow for long timelines; help ensure equitable access to incentives.
  • Seek to designate lands for reforestation that are adjacent to or connect with already protected areas, intact lands, and/or watersheds.
  • Advocate to remove harmful agriculture and logging subsidies, particularly those that incentivize livestock, biofuels, land encroachment, and overuse of fertilizers.
  • Call on governments and administrators of reforestation projects to use transparent, inclusive, and ongoing community engagement processes to co-design restoration projects; help solicit community feedback on area designations, finance, monitoring, and distribution of benefits; help ensure projects address relevant sociological, agricultural, and ecological considerations.
  • Advocate for strong land and tree tenure rights; support Indigenous property rights and autonomy.
  • Ensure projects operating in or with Indigenous communities only do so under FIPC; help codify FIPC into legal systems.
  • Help create high-integrity, long-lasting carbon markets; use dynamic baselines for more accurate additionality assessments.
  • Help monitor reforestation projects for success metrics such as vegetative growth, biodiversity, and water quality using high-resolution data and active remote sensing if possible.
  • Help translate reforestation materials into locally relevant languages.
  • Conduct cost-benefit analyses of potential local interventions to identify optimal strategies.
  • Develop markets and supply chains for native species products; innovate other sustainable uses for resources from reforested lands.
  • Develop or support opportunities for ecotourism in restored forests.
  • Facilitate investment in reforestation; create economic models to help maintain long-term financing; identify priorities for financing and help distribute incentives.
  • Help identify local sources of degradation and distribute findings to policymakers and the public; document and share best practices for reforestation.
  • Help establish outgrower schemes and negotiate favorable contracts for smallholder farmers.
  • Create programs to monitor for activity and market leakage from reforestation sites; advocate for adjustments to enforcement and policies to reduce leakage, if necessary.
  • Support high-integrity carbon markets, institutions, rules, and norms to cultivate demand for high-quality carbon credits.
  • Help shift the public narrative around carbon markets as integrity increases to boost education, dialogue, and awareness.
  • Amplify the voices of local communities and civil society to promote robust media coverage.
  • Invest in and support Indigenous and local communities’ capacity for legal protection, administration, and public relations.
  • When possible, use social science research to determine the best interventions, incentives, and community engagement models before beginning restoration projects.
  • Help foster national pride for the natural landscape and reforestation efforts through communication campaigns.
  • Work with educational institutions to develop degree and certification programs in forest restoration; encourage them to offer subspecialities such as protected lands governance, management, policy, and finance.
  • Create educational programs that work with schools, NGOs, and the general public to inform communities how to participate in restoration efforts, benefits, and opportunities; advocate for expanded extension services to develop local capacity in forest restoration, especially in community-led monitoring and evaluation; establish knowledge-sharing initiatives with Indigenous peoples.
  • Join, create, or participate in public-private partnerships dedicated to mobilizing financing, restoration activities, knowledge transfers, general education, and other relevant areas.
  • Join, support, or create certification schemes that verify restoration activity and sustainable use of forest products.

Further information:

Investors

  • Create deforestation-free investment portfolios.
  • Apply environmental and social standards to existing investments; divest from destructive industries and/or work with portfolio companies to improve practices.
  • Offer specific credit lines for reforestation projects with long-term timelines; offer low-interest loans, microfinancing, and specific financial products for medium-sized projects.
  • Own equity in sustainable projects that manage or support reforestation, especially during the early and middle phases.
  • Offer incubator services for those working on forest restoration projects; offer pro bono business advice or general support for community restoration projects.
  • Offer insurance and risk mitigation products for reforestation projects, especially, to farmers transitioning their lands.
  • Provide catalytic financing for businesses developing sustainable products made from native species, ecotourism, or other sustainable uses of reforested lands.
  • Invest in green bonds or high-integrity carbon credits for reforestation.
  • Support reforestation, other investors, and NGOs by sharing data, information, and investment frameworks that successfully avoid investments that drive deforestation.
  • Join, create, or participate in public-private partnerships dedicated to mobilizing financing, restoration activities, knowledge transfers, general education, and other relevant areas.

Further information:

Philanthropists and International Aid Agencies

  • Use deforestation-free products and sustainable products from reforested areas.
  • Offer grants or credit lines for reforestation projects with long-term timelines; offer low-interest loans, microfinancing options, and favorable financial products for medium-sized projects.
  • Own equity in sustainable projects that manage or support reforestation, especially during the early and middle phases.
  • Offer incubator services for those working on forest restoration; offer pro bono business advice or general support for community restoration projects.
  • Offer insurance and risk mitigation products for reforestation projects, especially, to farmers transitioning their lands.
  • Provide catalytic financing for businesses developing sustainable products made from native species, local ecotourism, or other sustainable uses of reforested lands.
  • Advocate for achievable public targets and pledges for forest restoration with clear effectiveness goals.
  • Help develop regulatory frameworks with clear definitions for active and passive restoration and/or related terms such as reforestation, regeneration, improving forest functionality, and increasing forest cover; ensure the framework is gender responsive and seeks to include women throughout the restoration process.
  • Help develop definitions at the international level for forest restoration and degradation along with frameworks for measurement and monitoring; design indicators to capture long-term impacts, including metrics to capture social and biodiversity impacts.
  • Help develop or advocate for regional and transboundary coordination mechanisms for restoring forests, especially, when working across international borders; consider using coordination methods from adjacent issue areas such as water management and/or working closely with existing coordination bodies for relevant watersheds.
  • Offer or take advantage of financial incentives such as PES; if necessary, advocate for public incentives for both active and passive restoration techniques such as property tax breaks, rebates, subsidies, and cash prizes for meeting tree and/or vegetative growth metrics; help ensure incentives allow for long timelines; help ensure equitable access to incentives.
  • Seek to designate lands for reforestation that are adjacent to or connect with already protected areas, intact lands, and/or watersheds.
  • Advocate to remove harmful agriculture and logging subsidies, particularly those that incentivize livestock, biofuels, land encroachment, and overuse of fertilizers.
  • Call on governments and administrators to use transparent, inclusive, and ongoing community engagement to co-design restoration projects; help solicit community feedback on area designations, finance, monitoring, and distribution of benefits; help ensure projects address relevant sociological, agricultural, and ecological considerations.
  • Advocate for strong land and tree tenure rights; support Indigenous property rights and autonomy.
  • Ensure projects operating in or with Indigenous communities only do so under FPIC; help codify FPIC into legal systems.
  • Help create high-integrity carbon markets with long durations; use dynamic baselines for more accurate additionality assessments.
  • Help monitor reforestation projects using high-resolution data and active remote sensing if possible.
  • Help translate reforestation materials into local relevant languages.
  • Conduct cost-benefit analysis of potential local interventions to identify optimal reforestation strategies.
  • Develop markets and supply chains for native species products; innovate other sustainable uses for resources from reforested lands.
  • Develop or support opportunities for ecotourism industries in locally restored forests.
  • Facilitate investment strategies among stakeholders; create economic models to help maintain long-term financing; identify priorities for financing and help to distribute both financial and nonfinancial incentives to stakeholders.
  • Help identify local sources of degradation and distribute findings to policymakers and the public; document and share best practices for reforestation.
  • Help establish outgrower schemes and negotiate contracts for smallholder farmers to ensure they receive the most favorable terms possible.
  • Create programs to monitor for activity and market leakage from reforestation sites; advocate for adjustments to enforcement and policies to reduce leakage if necessary.
  • Support high-integrity carbon markets, institutions, rules, and norms to cultivate the demand for high-quality carbon credits.
  • Help shift the public narrative around carbon markets as integrity increases to boost education, dialogue, and awareness.
  • Amplify the voices of local communities and civil society to promote robust media coverage.
  • Invest in and support Indigenous and local communities' capacity for legal protection, administration, and public relations.
  • When possible, use social science research to determine the best interventions, incentives, and community engagement models before beginning restoration projects.
  • Work with educational institutions to develop degree and certification programs in forest restoration; encourage them to offer subspecialities such as protected lands governance, management, policy, and finance.
  • Create educational programs that work with schools, NGOs, and the general public to inform communities of how to participate in restoration efforts, benefits, and opportunities; advocate for expanded extension services to develop local capacity in forest restoration, especially in community-led monitoring and evaluation; establish knowledge-sharing initiatives with Indigenous peoples.
  • Join, create, or participate in public-private partnerships dedicated to mobilizing financing, restoration activities, knowledge transfers, general education, and other relevant areas.
  • Join, support, or create certification schemes that verify restoration activity and sustainable use of forest products.

Further information:

Thought Leaders

  • If possible, conduct restoration projects on your property; work with local experts, share your experience, and document your progress.
  • Advocate for achievable public targets and pledges for forest restoration with clear effectiveness goals.
  • Help develop regulatory frameworks with clear definitions for active and passive restoration and/or related terms such as reforestation, regeneration, improving forest functionality, and increasing forest cover; ensure the framework is gender responsive and seeks to include women throughout the restoration process.
  • Help develop definitions at the international level for forest restoration and degradation along with frameworks for measurement and monitoring; design indicators to capture long-term impacts, including metrics to capture social and biodiversity impacts.
  • Help develop or advocate for regional and transboundary coordination mechanisms for restoring forests, especially, when working across international borders; consider using coordination methods from adjacent issue areas such as water management and/or working closely with existing coordination bodies for relevant watersheds.
  • Take advantage of and/or advocate for public incentives for both active and passive restoration techniques such as direct payments, PES, property tax breaks, rebates, subsidies, and cash prizes for meeting tree and/or vegetative growth metrics; help ensure incentives allow for long timelines; help ensure equitable access to incentives.
  • Seek to designate lands for reforestation that are adjacent to or connect with already protected areas, intact lands, and/or watersheds.
  • Advocate to remove harmful agriculture and logging subsidies, particularly those that incentivize livestock, biofuels, land encroachment, and overuse of fertilizers.
  • Call on governments and administrators to use transparent, inclusive, and ongoing community engagement processes to co-design restoration projects; help solicit community feedback on area designations, finance, monitoring, and distribution of benefits; help ensure projects address relevant sociological, agricultural, and ecological considerations.
  • Advocate for strong land and tree tenure rights; support Indigenous property rights and autonomy.
  • Ensure projects operating in or with Indigenous communities only do so under FPIC; help codify FPIC into legal systems.
  • Help create high-integrity carbon markets with long durations; use dynamic baselines for more accurate additionality assessments.
  • Help identify local sources of degradation and distribute findings to policymakers and the public; document and share best practices for reforestation.
  • Support high-integrity carbon markets, institutions, rules, and norms to cultivate the demand for high-quality carbon credits.
  • Help shift the public narrative around carbon markets as integrity increases to boost education, dialogue, and awareness.
  • Amplify the voices of local communities and civil society to promote robust media coverage.
  • Work with educational institutions to develop degree and certification programs in forest restoration; encourage them to offer subspecialities such as protected lands governance, management, policy, and finance.
  • Create educational programs that work with schools, NGOs, and the general public to inform communities of how to participate in restoration efforts, benefits, and opportunities; advocate for expanded extension services to develop local capacity in forest restoration, especially in community-led monitoring and evaluation; establish knowledge-sharing initiatives with Indigenous peoples.
  • Join, create, or participate in public-private partnerships dedicated to mobilizing financing, restoration activities, knowledge transfers, general education, and other relevant areas.
  • Join, support, or create certification schemes that verify restoration activity and sustainable use of forest products.

Further information:

Technologists and Researchers

  • Examine and compare a wide range of interventions, ideally in local sites, to inform reforestation.
  • Help document and examine local knowledge as it relates to reforestation; help integrate Indigenous and local knowledge into restoration science and technology.
  • Help develop local spatial models to identify sites suitable for restoration with low risk of being recleared.
  • Use or improve Artificial Intelligence models and satellite imagery to help develop early warning systems and predictive models for degraded forests and illegal deforestation.
  • Use AI and satellite data to monitor and evaluate restoration activities; map practices and identify locally relevant interventions.
  • Develop web-based platforms and applications to support large-scale forest restoration; include peer-reviewed studies that map risks and amounts of buffer pools available for each disturbance.
  • Research locally viable risk management strategies in restoration; study and identify social risks and related mitigation strategies.
  • Create a database to measure reforestation progress against global commitments.
  • Develop or improve techniques to monitor for activity and market leakage from reforestation sites.
  • Examine and compare a wide range of local incentive structures to identify optimal policies.
  • Conduct long-term documentation of socioeconomic and biodiversity outcomes for restoration projects; identify challenges and opportunities; distill best practices for a global audience.
  • Conduct social ground truthing for local restoration projects to gather data, test models, and develop potential interventions.
  • Conduct research on native species found in restored forests and potential uses for sustainable commercial development.
  • Evaluate the relationships among large-scale forest restoration, food security, and wood demand; develop recommendations for land and resource allocation among these activities.
  • Improve understanding of forest dynamics, including how they relate to cloud feedbacks, volatile organic compounds, aerosol effects, and black carbon.

Further information:

Communities, Households, and Individuals

  • If possible, restore forests on your property; work with local experts, share your experience, and document your progress.
  • Help establish and participate in local restoration efforts; volunteer with a local nonprofit or establish one if none exists.
  • If degraded forests are in your area and no action is being taken, speak to local officials, hand out fliers, or otherwise advocate for restoration.
  • Reduce and/or eliminate use of chemicals on your lawn and/or property; set up a sign that indicates your lawn is chemical-free.
  • Prioritizing reducing your household’s food waste and improving your diet to incorporate more plant-rich meals.
  • Have community conversations about local forests, agriculture, and lawn maintenance practices; seek to reduce harmful practices such as overuse of fertilizers and pesticides and to initiate restoration efforts; educate friends and neighbors about local degraded forests and potential solutions.
  • Contribute to local restoration efforts.
  • When traveling, look for opportunities to support reforestation projects and ecotourism.
  • Help document and develop knowledge-sharing opportunities for Indigenous and local knowledge.
  • Help identify local sources of degradation and distribute findings to policymakers and the public; document and share best practices for reforestation.
  • Try to purchase sustainable forest products that support local reforestation.
  • Take advantage of and/or advocate for public incentives for restoration techniques such as direct payments, PES, property tax breaks, rebates, subsidies, and cash prizes for meeting tree and/or vegetative growth metrics; help ensure incentives allow for long timelines; help ensure equitable access to incentives.
  • Seek to designate lands for reforestation that are adjacent to or connect with already protected areas, intact lands, and/or watersheds.
  • Advocate to remove harmful agriculture and logging subsidies, particularly those that incentivize livestock, biofuels, land encroachment, and overuse of fertilizers.
  • Call on governments and administrators to use transparent, inclusive, and ongoing community engagement processes to co-design restoration projects; help solicit community feedback on area designations, finance, monitoring, and distribution of benefits; help ensure projects address relevant sociological, agricultural, and ecological considerations.
  • Advocate for strong land and tree tenure rights; support Indigenous property rights and autonomy.
  • Ensure projects operating in or with Indigenous communities only do so under FPIC; help codify FPIC into legal systems.
  • Create educational programs that work with schools, NGOs, and the general public to inform communities how to participate in restoration efforts, benefits, and opportunities; advocate for expanded extension services to develop local capacity in forest restoration, especially in community-led monitoring and evaluation; establish knowledge-sharing initiatives with Indigenous peoples.
  • Join, create, or participate in public-private partnerships dedicated to mobilizing financing, restoration activities, knowledge transfers, general education, and other relevant areas.
  • Join, support, or create certification schemes that verify restoration activity and sustainable use of forest products.

Further information:

“Take Action” Sources

Evidence Base

Consensus of effectiveness in enhancing carbon removal: High

Many scientific studies have evaluated the potential for forest restoration, consistently reporting that forest restoration has potential to provide substantial carbon removal. The effectiveness of forest restoration in terms of carbon uptake per hectare is highly spatially variable, with over 100-fold variability in uptake rates globally (Cook-Patton et al., 2020). These uptake rates have been extensively modeled, though estimates vary with respect to restoration activity (e.g., natural regeneration or plantation establishment) and carbon pools included (e.g., above-ground biomass only, above- and below-ground biomass, or total biomass and soil carbon). For forests undergoing natural regeneration, estimates of effectiveness ranged from 1.0 t CO₂‑eq /ha/yr for biomass in boreal forests (Cook-Patton et al., 2020) to 18.8 t CO₂‑eq /ha/yr for biomass and soils in humid tropical forests in South America (Bernal et al., 2018).

Estimates of the potential climate impacts of forest restoration vary widely, with differences driven largely by variability in the estimates of land area available for forest restoration. The IPCC reported a global technical mitigation potential of 3.9 Gt CO₂‑eq/yr with an uncertainty range of 0.5–10.1 Gt CO₂‑eq/yr, and an economically feasible mitigation potential of 1.6 Gt CO₂‑eq/yr with an uncertainty range of 0.5–3.0 Gt CO₂‑eq/yr (Nabuurs et al., 2022). Cook-Patton et al. (2020) estimated a maximum mitigation potential of 8.91 Gt CO₂‑eq/yr and a mitigation potential of 5.87 Gt CO₂‑eq/yr under existing national commitments. Roe et al. (2021) estimated a technical mitigation potential of 8.47 Gt CO₂‑eq/yr and a cost-effective mitigation potential of 1.53 Gt CO₂‑eq/yr. Griscom et al. (2017) reported a technical mitigation potential of 10.1 Gt CO₂‑eq/yr, though the uncertainty estimates spanned 2.7–17.9 Gt CO₂‑eq/yr. Using a more conservative estimate of the area available for forest restoration than previous studies, Fesenmeyer et al. (2025) estimated that sequestration of 2.2 Gt CO₂‑eq/yr is feasible.

The quantitative results presented in this assessment synthesize findings from 16 global datasets supplemented by four national-scale studies. We recognize that geographic bias in the information underlying global data products creates bias and hope this work inspires research and data sharing on this topic in underrepresented regions.

Updated Date
Coming Soon Label
Coming Soon

Improve Annual Cropping

Image
Coming Soon
Off
Summary

Farmers on much of the world’s 1.4 billion ha of cropland grow and harvest annual crops – crops like wheat, rice, and soybeans that live for one year or less. After harvest, croplands are often left bare for the rest of the year and sometimes tilled, exposing the soil to wind and rain. This keeps soil carbon levels low and can lead to soil erosion. There are many ways to improve annual cropping to protect or enhance the health of the soil and increase soil organic matter. Project Drawdown’s Improve Annual Cropping solution is a set of practices that protects soils by minimizing plowing (no-till/reduced tillage) and maintaining continuous soil cover (by retaining crop residues or growing cover crops). This increases soil carbon sequestration and reduces nitrous oxide emissions. These techniques are commonly used in conservation agriculture, regenerative, and agro-ecological cropping systems. Other annual cropping practices with desirable climate impacts – including compost application and crop rotations – are omitted here due to lack of data and much smaller scale of adoption. New adoption is estimated from the 2025 level as a baseline which is therefore set to zero.

Description for Social and Search
Improve Annual Cropping is a highly recommended climate solution. It enhances soil’s ability to store carbon and reduces emissions of nitrous oxide, a potent greenhouse gas.
Overview

The Improve Annual Cropping solution incorporates several practices that minimize soil disturbance and introduce a physical barrier meant to prevent erosion to fragile topsoils. Our definition includes two of the three pillars of conservation agriculture: minimal soil disturbance and permanent soil cover (Kassam et al., 2022).

Minimal Soil Disturbance

Soil organic carbon (SOC) – which originates from decomposed plants – helps soils hold moisture and provides the kinds of chemical bonding that allow nutrients to be stored and exchanged easily with plants. Soil health and productivity depend on microbial decomposition of plant biomass residues, which mobilizes critical nutrients in soil organic matter (SOM) and builds SOC. Conventional tillage inverts soil, buries residues, and breaks down compacted soil aggregates. This process facilitates microbial activity, weed removal, and water infiltration for planting. However, tillage can accelerate CO₂ fluxes as SOC is lost to oxidation and runoff. Mechanical disturbance further exposes deeper soils to the atmosphere, leading to radiative absorption, higher soil temperatures, and catalyzed biological processes – all of which increase oxidation of SOC (Francaviglia et al., 2023).

Reduced tillage limits soil disturbance to support increased microbial activity, moisture retention, and stable temperature at the soil surface. This practice can increase carbon sequestration, at least when combined with cover cropping. These effects are highly contextual, depending on tillage intensity and soil depth as well as the practice type, duration, and timing. Reduced tillage further reduces fossil fuel emissions from on-farm machinery. However, this practice often leads to increased reliance on herbicides for weed control (Francaviglia et al., 2023).

Permanent Soil Cover

Residue retention and cover cropping practices aim to provide permanent plant cover to protect and improve soils. This can improve aggregate stability, water retention, and nutrient cycling. Farmers practicing residue retention leave crop biomass residues on the soil surface to suppress weed growth, improve water infiltration, and reduce evapotranspiration from soils (Francaviglia et al., 2023).

Cover cropping includes growth of spontaneous or seeded plant cover, either during or between established cropping cycles. In addition to SOC, cover cropping can help decrease nitrous oxide emissions and bind nitrogen typically lost via oxidation and leaching. Leguminous cover crops can also fix atmospheric nitrogen, reducing the need for fertilizer. Cover cropping can further be combined with reduced tillage for additive SOC and SOM gains (Blanco-Canqui et al., 2015; Francaviglia et al., 2023).

Improved annual cropping practices can simultaneously reduce GHG emissions and improve SOC stocks. However, there are biological limits to SOC stocks – particularly in mineral soils. Environmental benefits are impermanent and only remain if practices continue long term (Francaviglia et al., 2023).

References

Abdalla, M., Hastings, A., Cheng, K., Yue, Q., Chadwick, D., Espenberg, M., Truu, J., Rees, R. M., & Smith, P. (2019). A critical review of the impacts of cover crops on nitrogen leaching, net greenhouse gas balance and crop productivity. Global Change Biology, 25(8), 2530–2543. Link to source: https://doi.org/10.1111/gcb.14644 

Arslan, A., McCarthy, N., Lipper, L., Asfaw, S., Cattaneo, A., & Kokwe, M. (2015). Climate smart agriculture? Assessing the adaptation implications in Zambia. Journal of Agricultural Economics, 66(3), 753-780. Link to source: https://doi.org/10.1111/1477-9552.12107

Bai, X., Huang, Y., Ren, W., Coyne, M., Jacinthe, P.-A., Tao, B., Hui, D., Yang, J., & Matocha, C. (2019). Responses of soil carbon sequestration to climate-smart agriculture practices: A meta-analysis. Global Change Biology, 25(8), 2591–2606. https://doi.org/10.1111/gcb.14658

Blanco‐Canqui, H., Shaver, T. M., Lindquist, J. L., Shapiro, C. A., Elmore, R. W., Francis, C. A., & Hergert, G. W. (2015). Cover crops and ecosystem services: Insights from studies in temperate soils. Agronomy journal, 107(6), 2449-2474. Link to source: https://doi.org/10.2134/agronj15.0086

Blanco-Canqui, H., & Francis, C. A. (2016). Building resilient soils through agroecosystem redesign under fluctuating climatic regimes. Journal of Soil and Water Conservation, 71(6), 127A-133A. Link to source: https://doi.org/10.2489/jswc.71.6.127A 

Cai, A., Han, T., Ren, T., Sanderman, J., Rui, Y., Wang, B., Smith, P., Xu, M., & Li, Y. (2022). Declines in soil carbon storage under no tillage can be alleviated in the long run. Geoderma, 425, 116028. Link to source: https://doi.org/10.1016/j.geoderma.2022.116028 

Clapp, J. (2021). Explaining growing glyphosate use: The political economy of herbicide-dependent agriculture. Global Environmental Change, 67, 102239. Link to source: https://doi.org/10.1016/j.gloenvcha.2021.102239

Cui, Y., Zhang, W., Zhang, Y., Liu, X., Zhang, Y., Zheng, X., Luo, J., & Zou, J. (2024). Effects of no-till on upland crop yield and soil organic carbon: A global meta-analysis. Plant and Soil, 499(1), 363–377. https://doi.org/10.1007/s11104-022-05854-y

Damania, R., Polasky, S., Ruckelshaus, M., Russ, J., Amann, M., Chaplin-Kramer, R., Gerber, J., Hawthorne, P., Heger, M. P., Mamun, S., Ruta, G., Schmitt, R., Smith, J., Vogl, A., Wagner, F., & Zaveri, E. (2023). Nature's Frontiers: Achieving Sustainability, Efficiency, and Prosperity with Natural Capital. World Bank Publications. Link to source: https://doi.org/10.1596/978-1-4648-1923-0

Francaviglia, R., Almagro, M., & Vicente-Vicente, J. L. (2023). Conservation agriculture and soil organic carbon: Principles, processes, practices and policy options. Soil Systems, 7(1), 17. Link to source: https://doi.org/10.3390/soilsystems7010017 

Griscom, B. W., Adams, J., Ellis, P. W., Houghton, R. A., Lomax, G., Miteva, D. A., Schlesinger, W. H., Shoch, D., Siikamäki, J. V., Smith, P., Woodbury, P., Zganjar, C., Blackman, A., Campari, J., Conant, R. T., Delgado, C., Elias, P., Gopalakrishna, T., Hamsik, M. R., Herrero, M., & Fargione, J. (2017). Natural climate solutions. Proceedings of the National Academy of Sciences, 114(44), 11645-11650. Link to source: https://doi.org/10.1073/pnas.1710465114

Hassan, M. U., Aamer, M., Mahmood, A., Awan, M. I., Barbanti, L., Seleiman, M. F., Bakhsh, G., Alkharabsheh, H. M., Babur, E., Shao, J., Rasheed, A., & Huang, G. (2022). Management strategies to mitigate N2O emissions in agriculture. Life, 12(3), 439. Link to source: https://doi.org/10.3390/life12030439

Hu, Q., Thomas, B. W., Powlson, D., Hu, Y., Zhang, Y., Jun, X., Shi, X., & Zhang, Y. (2023). Soil organic carbon fractions in response to soil, environmental and agronomic factors under cover cropping systems: A global meta-analysis. Agriculture, Ecosystems & Environment, 355, 108591. https://doi.org/10.1016/j.agee.2023.108591

Jat, H. S., Choudhary, K. M., Nandal, D. P., Yadav, A. K., Poonia, T., Singh, Y., Sharma, P. C., & Jat, M. L. (2020). Conservation agriculture-based sustainable intensification of cereal systems leads to energy conservation, higher productivity and farm profitability. Environmental Management, 65(6), 774–786. Link to source: https://doi.org/10.1007/s00267-020-01273-w

Jayaraman, S., Dang, Y. P., Naorem, A., Page, K. L., & Dalal, R. C. (2021). Conservation agriculture as a system to enhance ecosystem services. Agriculture, 11(8), 718. Link to source: https://doi.org/10.3390/agriculture11080718

Kan, Z.-R., Liu, W.-X., Liu, W.-S., Lal, R., Dang, Y. P., Zhao, X., & Zhang, H.-L. (2022). Mechanisms of soil organic carbon stability and its response to no-till: A global synthesis and perspective. Global Change Biology, 28(3), 693–710. https://doi.org/10.1111/gcb.15968

Kassam, A., Friedrich, T., & Derpsch, R. (2022). Successful experiences and lessons from conservation agriculture worldwide. Agronomy, 12(4), 769. https://doi.org/10.3390/agronomy12040769

Lal, R., Smith, P., Jungkunst, H. F., Mitsch, W. J., Lehmann, J., Nair, P. K. R., McBratney, A. B., Sá, J. C. D. M., Schneider, J., Zinn, Y. L., Skorupa, A. L. A., Zhang, H.-L., Minasny, B., Srinivasrao, C., & Ravindranath, N. H. (2018). The carbon sequestration potential of terrestrial ecosystems. Journal of Soil and Water Conservation, 73(6), 145A-152A. Link to source: https://doi.org/10.2489/jswc.73.6.145A

Lessmann, M., Ros, G. H., Young, M. D., & de Vries, W. (2022). Global variation in soil carbon sequestration potential through improved cropland management. Global Change Biology, 28(3), 1162–1177. https://doi.org/10.1111/gcb.15954

Luo, Z., Wang, E., & Sun, O. J. (2010). Can no-tillage stimulate carbon sequestration in agricultural soils? A meta-analysis of paired experiments. Agriculture, Ecosystems & Environment, 139(1), 224–231. https://doi.org/10.1016/j.agee.2010.08.006

Martínez-Mena, M., Carrillo-López, E., Boix-Fayos, C., Almagro, M., García Franco, N., Díaz-Pereira, E., Montoya, I., & De Vente, J. (2020). Long-term effectiveness of sustainable land management practices to control runoff, soil erosion, and nutrient loss and the role of rainfall intensity in Mediterranean rainfed agroecosystems. CATENA, 187, 104352. Link to source: https://doi.org/10.1016/j.catena.2019.104352

Moukanni, N., Brewer, K. M., Gaudin, A. C. M., & O’Geen, A. T. (2022). Optimizing carbon sequestration through cover cropping in Mediterranean agroecosystems: Synthesis of mechanisms and implications for management. Frontiers in Agronomy, 4, 844166. Link to source: https://doi.org/10.3389/fagro.2022.844166 

Mrabet, R., Singh, A., Sharma, T., Kassam, A., Friedrich, T., Basch, G., Moussadek, R., & Gonzalez-Sanchez, E. (2023). Conservation Agriculture: Climate Proof and Nature Positive Approach. In G. Ondrasek & L. Zhang (Eds.), Resource management in agroecosystems. IntechOpen. Link to source: https://doi.org/10.5772/intechopen.108890

Nyagumbo, I., Mupangwa, W., Chipindu, L., Rusinamhodzi, L., & Craufurd, P. (2020). A regional synthesis of seven-year maize yield responses to conservation agriculture technologies in Eastern and Southern Africa. Agriculture, Ecosystems & Environment, 295, 106898. Link to source: https://doi.org/10.1016/j.agee.2020.106898

Ogle, S. M., Alsaker, C., Baldock, J., Bernoux, M., Breidt, F. J., McConkey, B., Regina, K., & Vazquez-Amabile, G. G. (2019). Climate and Soil Characteristics Determine Where No-Till Management Can Store Carbon in Soils and Mitigate Greenhouse Gas Emissions. Scientific Reports, 9(1), 11665. https://doi.org/10.1038/s41598-019-47861-7

Paustian, K., Larson, E., Kent, J., Marx, E., & Swan, A. (2019). Soil C Sequestration as a Biological Negative Emission Strategy. Frontiers in Climate, 1, 8. Link to source: https://doi.org/10.3389/fclim.2019.00008 

Pittelkow, C. M., Liang, X., Linquist, B. A., van Groenigen, K. J., Lee, J., Lundy, M. E., van Gestel, N., Six, J., Venterea, R. T., & van Kessel, C. (2015). Productivity limits and potentials of the principles of conservation agriculture. Nature, 51, 365–368. https://doi.org/10.1038/nature13809

Poeplau, C., & Don, A. (2015). Carbon sequestration in agricultural soils via cultivation of cover crops–A meta-analysis. Agriculture, Ecosystems & Environment, 200, 33–41. Link to source: https://doi.org/10.1016/j.agee.2014.10.024

Powlson, D. S., Stirling, C. M., Jat, M. L., Gerard, B. G., Palm, C. A., Sanchez, P. A., & Cassman, K. G. (2014). Limited potential of no-till agriculture for climate change mitigation. Nature Climate Change, 4(8), 678–683. https://doi.org/10.1038/nclimate2292

Prestele, R., Hirsch, A. L., Davin, E. L., Seneviratne, S. I., & Verburg, P. H. (2018). A spatially explicit representation of conservation agriculture for application in global change studies. Global Change Biology, 24(9), 4038–4053. https://doi.org/10.1111/gcb.14307

Project Drawdown (2020) Farming Our Way Out of the Climate Crisis. Project Drawdown. https://drawdown.org/publications/farming-our-way-out-of-the-climate-crisis

Quintarelli, V., Radicetti, E., Allevato, E., Stazi, S. R., Haider, G., Abideen, Z., Bibi, S., Jamal, A., & Mancinelli, R. (2022). Cover crops for sustainable cropping systems: A review. Agriculture, 12(12), 2076. Link to source: https://doi.org/10.3390/agriculture12122076

Searchinger, T., R. Waite, C. Hanson, and J. Ranganathan. (2019). World Resources Report: Creating a Sustainable Food Future. Washington, DC: World Resources Institute. Link to source: https://research.wri.org/sites/default/files/2019-07/WRR_Food_Full_Report_0.pdf

Stavi, I., Bel, G., & Zaady, E. (2016). Soil functions and ecosystem services in conventional, conservation, and integrated agricultural systems. A review. Agronomy for Sustainable Development, 36(2), 32. Link to source: https://doi.org/10.1007/s13593-016-0368-8

Su, Y., Gabrielle, B., Beillouin, D., & Makowski, D. (2021). High probability of yield gain through conservation agriculture in dry regions for major staple crops. Scientific Reports, 11(1), 3344. Link to source: https://doi.org/10.1038/s41598-021-82375-1

Sun, W., Canadell, J. G., Yu, L., Yu, L., Zhang, W., Smith, P., Fischer, T., & Huang, Y. (2020). Climate drives global soil carbon sequestration and crop yield changes under conservation agriculture. Global Change Biology, 26(6), 3325–3335. Link to source: https://doi.org/10.1111/gcb.15001 

Tambo, J. A., & Mockshell, J. (2018). Differential impacts of conservation agriculture technology options on household income in sub-Saharan Africa. Ecological Economics, 151, 95–105. Link to source: https://doi.org/10.1016/j.ecolecon.2018.05.005

Tiefenbacher, A., Sandén, T., Haslmayr, H.-P., Miloczki, J., Wenzel, W., & Spiegel, H. (2021). Optimizing carbon sequestration in croplands: A synthesis. Agronomy, 11(5), 882. Link to source: https://doi.org/10.3390/agronomy11050882

Toensmeier, E. (2016). The Carbon Farming Solution: A Global Toolkit of Perennial Crops and Regenerative Agriculture Practices for Climate Change Mitigation and Food Security. Green Publishing. Link to source: https://www.chelseagreen.com/product/the-carbon-farming-solution/?srsltid=AfmBOoqsMoY569HfsXOdBsRguOzsDLlRZKOnyM4nyKwZoIALvPoohZlq 

Vendig, I., Guzman, A., De La Cerda, G., Esquivel, K., Mayer, A. C., Ponisio, L., & Bowles, T. M. (2023). Quantifying direct yield benefits of soil carbon increases from cover cropping. Nature Sustainability, 6(9), 1125–1134. https://doi.org/10.1038/s41893-023-01131-7

WCCA (2021). The future of farming: Profitable and sustainable farming with conservation agriculture. 8th World Congress on Conservation Agriculture, Vern Switzerland. Link to source: https://ecaf.org/8wcca

Wooliver, R., & Jagadamma, S. (2023). Response of soil organic carbon fractions to cover cropping: A meta-analysis of agroecosystems. Agriculture, Ecosystems & Environment, 351, 108497. https://doi.org/10.1016/j.agee.2023.108497

Xing, Y., & Wang, X. (2024). Impact of agricultural activities on climate change: a review of greenhouse gas emission patterns in field crop systems. Plants, 13(16), 2285. Link to source: https://doi.org/10.3390/plants13162285

Credits

Lead Fellows

  • Avery Driscoll

  • Erika Luna

  • Megan Matthews, Ph.D.

  • Eric Toensmeier

  • Aishwarya Venkat, Ph.D.

Contributors

  • Ruthie Burrows, Ph.D.

  • James Gerber, Ph.D.

  • Yusuf Jameel, Ph.D.

  • Daniel Jasper

  • Alex Sweeney

Internal Reviewers

  • Aiyana Bodi

  • Emily Cassidy

  • James Gerber, Ph.D.

  • Hannah Henkin

  • Zoltan Nagy, Ph.D.

  • Ted Otte

  • Paul C. West, Ph.D.

Effectiveness

Based on seven reviews and meta-analyses, which collectively analyzed over 500 studies, we estimate that this solution’s SOC sequestration potential is 1.28 t CO₂‑eq/ha/yr. This is limited to the topsoil (>30 cm), with minimal effects at deeper levels (Sun et al., 2020; Tiefenbacher et al., 2021). Moreover, carbon sequestration potential is not constant over time. The first two decades show the highest increase, followed by an equilibrium or SOC saturation (Cai, 2022; Sun et al., 2020).

The effectiveness of the Improve Annual Cropping solution heavily depends on local geographic conditions (e.g., soil properties, climate), crop management practices, cover crop biomass, cover crop types, and the duration of annual cropping production – with effects typically better assessed in the long term (Abdalla et al., 2019; Francaviglia et al., 2023; Moukanni et al., 2022; Paustian et al., 2019).

Based on reviewed literature (three papers, 18 studies), we estimated that improved annual cropping can potentially reduce nitrous oxide emissions by 0.51 t CO₂‑eq/ha/yr (Table 1). Cover crops can increase direct nitrous oxide emissions by stimulating microbial activity, but – compared with conventional cropping – lower indirect emissions allow for reduced net nitrous oxide emissions from cropland (Abdalla et al., 2019). 

Nitrogen fertilizers drive direct nitrous oxide emissions, so genetic optimization of cover crops to increase nitrogen-use efficiencies and decrease nitrogen leaching could further improve mitigation of direct nitrous oxide emissions (Abdalla et al., 2019). 

Table 1. Effectiveness at reducing emissions and removing carbon.

Unit: t CO₂‑eq/ha/yr, 100-yr basis

25th percentile 0.29
Median (50th percentile) 0.51
75th percentile 0.80

Unit: t CO₂‑eq/ha/yr, 100-yr basis

25th percentile 0.58
Median (50th percentile) 1.28
75th percentile 1.72

Unit: t CO₂‑eq/ha/yr, 100-yr basis

25th percentile 0.87
Median (50th percentile) 1.79
75th percentile 2.52
Left Text Column Width
Cost

Because baseline (conventional) annual cropping systems are already extensive and well established, we assume there is no cost to establish new baseline cropland. In the absence of global datasets on costs and revenues of cropping systems, we used data on the global average profit per ha of cropland from Damania et al. (2023) to create a weighted average profit of US$76.86/ha/yr.

Based on 13 data points (of which seven were from the United States), the median establishment cost of the Improve Annual Cropping solution is $329.78/ha. Nine data points (three from the United States) provided a median increase in profitability of US$86.01/ha/yr. 

The net net cost of the Improve Annual Cropping solution is US$86.01. The cost per t CO₂‑eq is US$47.80 (Table 2).

Table 2. Cost per unit climate impact.

Unit: 2023 US$/t CO₂‑eq, 100-yr basis

Median 47.80
Left Text Column Width

Methods and Supporting Data

Learning Curve

We found limited information on this solution’s learning curve. A survey of farmers in Zambia found a reluctance to avoid tilling soils because of the increased need for weeding or herbicides and because crop residues may need to be used for livestock feed (Arslan et al., 2015; Searchinger et al., 2019).

Speed of Action

Speed of action refers to how quickly a climate solution physically affects the atmosphere after it is deployed. This is different from speed of deployment, which is the pace at which solutions are adopted.

At Project Drawdown, we define the speed of action for each climate solution as emergency brake, gradual, or delayed.

Improve Annual Cropping is a DELAYED climate solution. It works more slowly than gradual or emergency brake solutions. Delayed solutions can be robust climate solutions, but it’s important to recognize that they may not realize their full potential for some time.

Caveats

As with other biosequestration solutions, carbon stored in soils via improved annual cropping is not permanent. It can be lost quickly through a return to conventional agriculture practices like plowing, and/or through a regional shift to a drier climate or other human- or climate change–driven disturbances. Carbon sequestration also only continues for a limited time, estimated at 20–50 years (Lal et al., 2018)).

Current Adoption

Kassam et al. (2022) provided regional adoption from 2008–2019. We used a linear forecast to project 2025 adoption. This provided a figure of 267.4 Mha in 2025 (Table 3). Note that in Solution Basics in the dashboard we set current adoption at zero. This is a conservative assumption to avoid counting carbon sequestration from land that has already ceased to sequester net carbon due to saturation, which takes place after 20–50 years (Lal et al., 2018).

Table 3. Current (2025) adoption level.

Unit: Mha of improved annual cropping

Estimate 267.4
Left Text Column Width
Adoption Trend

Between 2008–2009 and 2018–2019 (the most recent data available), the cropland area under improved annual cropping practices nearly doubled globally, increasing from 10.6 Mha to 20.5 Mha at an average rate of 1.0 Mha/yr (Kassam et al., 2022), equivalent to a 9.2% annual increase in area relative to 2008–2009 levels. Adoption slowed slightly in the latter half of the decade, with an average increase of 0.8 Mha/yr between 2015–2016 and 2018–2019, equivalent to 4.6% annual increase in area relative to 2015–2016 levels, as shown in Table 4.

Table 4. 2008–2009 to 2018–2019 adoption trend.

Unit: Mha adopted/yr

Mean 9.99
Left Text Column Width
Adoption Ceiling

Griscom et al. (2017) estimate that 800 Mha of global cropland are suitable – but not yet used for – cover cropping, in addition to 168 Mha already in cover crops (Popelau and Don, 2015). We update the 168 Mha in cover crops to 267 Mha based on Kassam (2022). Griscom et al.’s estimate is based on their analysis that much cropland is unsuitable because it already is used to produce crops during seasons in which cover crops would be grown. Their estimate thus provides a maximum technical potential of 1,067 Mha  by adding 800 Mha of remaining potential to the 267.4 Mha of current adoption (Table 5). 

Table 5. Adoption ceiling.

Unit: Mha

Adoption ceiling 1,067
Left Text Column Width
Achievable Adoption

The 8th World Congress on Conservation Agriculture (8WCCA) set a goal to achieve adoption of improved annual cropping on 50% of available cropland by 2050 (WCCA 2021). That provides an Achievable – High of 700 Mha – though this is not a biophysical limit. 

We used the 2008–2019 data from Kassam (2022) to calculate average annual regional growth rates. From these we selected the 25th percentile as our low achievable level (Table 6).

Table 6. Range of achievable adoption levels.

Unit: Mha

Current adoption 267.4
Achievable – low 331.7
Achievable – high 700.0
Adoption ceiling 1,067

Unit: Mha installed

Current adoption 0.00
Achievable – low 64.2
Achievable – high 432.6
Adoption ceiling 868.6
Left Text Column Width

Carbon sequestration continues only for a period of decades; because adoption of improved annual cropping was already underway in the 1970s (Kassam et al., 2022), we could not assume that previously adopted hectares continue to sequester carbon indefinitely. Much of the current adoption of improved annual cropping has been in place for decades and sequestration in some of this land has presumably already slowed down to almost zero. We apply an adoption adjustment factor of 0.5 to current adoption (see methodology) to reflect that an estimated half of current adoption is no longer sequestering significant carbon, yet there is substantial new adoption within the last 20-50 years.

For new adoption, the calculation is effectiveness * new adoption = climate impact.

For calculating impact of current adoption, the calculation is the sum of a and b where:

a:  for carbon sequestration, the calculation is effectiveness * 0.5 * current adoption = climate impact, and

b: for nitrous oxide reduction, the calculation is effectiveness * current adoption = climate impact.

Climate impacts shown in Table 6 are the sum of current and new adoption impacts. Combined effect is 0.31 Gt CO2-eq/yr for current adoption, 0.43 for Achievable – Low, 1.09 for Achievable – High, and 1.87 for our Adoption Ceiling.

Table 8. Climate impact at different levels of adoption.

Unit: Gt CO₂ ‑eq/yr, 100-yr basis

Current adoption 0.14
Achievable – low 0.17
Achievable – high 0.36
Adoption ceiling 0.58

(from nitrous oxide)

Unit: Gt CO₂ ‑eq/yr, 100-yr basis

Current adoption 0.17
Achievable – low 0.25
Achievable – high 0.73
Adoption ceiling 1.29

(from SOC)

Unit: Gt CO₂ ‑eq/yr, 100-yr basis

Current adoption 0.31
Achievable – low 0.43
Achievable – high 1.09
Adoption ceiling 1.87
Left Text Column Width
Additional Benefits

Extreme Weather Events

The soil and water benefits of this solution can lead to agricultural systems that are more resilient to extreme weather events (Mrabet et al., 2023). These agricultural systems have improved uptake, conservation, and use of water, so they are more likely to successfully cope and adapt to drought, dry conditions, and other adverse weather events (Su et al., 2021). Additionally, more sustained year-round plant cover can increase the capacity of cropping systems to adapt to high temperatures and extreme rainfall (Blanco-Canqui & Francis, 2016; Martínez-Mena et al., 2020).

Droughts

Increased organic matter due to improved annual cropping increases soil water holding capacity. This increases drought resilience (Su et al., 2021). 

Income and Work

Conservation agriculture practices can reduce costs on fuel, fertilizer, and pesticides (Stavi et al., 2016). The highest revenues from improved annual cropping are often found in drier climates. Tambo et al. (2018) found when smallholder farmers in sub-Saharan Africa jointly employed the three aspects of conservation agriculture – reduced tillage, cover crops, and crop rotation – households and individuals saw the largest income gains. Nyagumbo et al. (2020) found that smallholder farms in sub-Saharan Africa using conservation agriculture had the highest returns on crop yields when rainfall was low. 

Food Security

Improved annual cropping can improve food security by increasing the amount and the stability of crop yields. A meta-analysis of studies of South Asian cropping systems found that those following conservation agriculture methods had 5.8% higher mean yield than cropping systems with more conventional agriculture practices (Jat et al., 2020). Evidence supports that conservation agriculture practices especially improve yields in water scarce areas (Su et al., 2021). Nyagumbo et al. (2020) found that smallholder farmers in sub-Saharan Africa experienced reduced yield variability when using conservation agriculture practices.

Nature Protection

Improved annual cropping can increase biodiversity below and above soils (Mrabet et al., 2023). Increased vegetation cover improves habitats for arthropods, which help with pest and pathogen management (Stavi et al., 2016).

Land Resources

Improved annual cropping methods can lead to improved soil health through increased stability of soil structure, increased soil nutrients, and improved soil water storage (Francaviglia et al., 2023). This can reduce soil degradation and erosion (Mrabet et al., 2023). Additionally, more soil organic matter can lead to additional microbial growth and nutrient availability for crops (Blanco-Canqui & Francis, 2016). 

Water Quality

Runoff of soil and other agrochemicals can be minimized through conservation agricultural practices, reducing the amount of nitrate and phosphorus that leach into waterways and contribute to algal blooms and eutrophication (Jayaraman et al., 2021). Abdalla et al. (2019) found that cover crops reduced nitrogen leaching.

Risks

Herbicides – in place of tillage – are used in many but not all no-till cropping systems to kill (terminate) the cover crop. The large-scale use of herbicides in improved annual cropping systems can produce a range of environmental and human health consequences. Agricultural impacts can include development of herbicide-resistant weeds (Clapp, 2021). 

If cover crops are not fully terminated before establishing the main crop, there is a risk that cover crops can compete with the main crop (Quintarelli et al., 2022). 

Interactions with Other Solutions

Improved annual cropping has competing interactions with several other solutions related to shifting annual practices. For each of these other solutions, the Improve Annual Cropping solution can reduce the area on which the solution can be applied or the nutrient excess available for improved management. 

COMPETING

In no-till systems, cover crops are typically terminated with herbicides, often preventing incorporation of trees depending on the type of herbicide used.

Land managed under the Improve Annual Cropping solution is not available for perennial crops.

Improved annual cropping typically reduces fertilizer demand, reducing the scale of climate impact under improved nutrient management. 

Our definition of improved annual cropping requires residue retention, limiting the additional area available for deployment of reduced burning.

Dashboard

Solution Basics

ha cropland

t CO₂-eq (100-yr)/unit/yr
00.881.8median
units
Current 2.674×10⁸ 03.317×10⁸7.0×10⁸
Achievable (Low to High)

Climate Impact

Gt CO₂-eq (100-yr)/yr
Current 0.31 0.431.09
US$ per t CO₂-eq
48
Delayed

CO₂ , N₂O

Trade-offs

Some studies have found that conservation tillage without cover crops can reduce soil carbon stocks in deeper soil layers. They caution against overreliance on no-till as a sequestration solution in the absence of cover cropping. Reduced tillage should be combined with cover crops to ensure carbon sequestration (Luo et al., 2010; Ogle et al., 2019; Powlson et al., 2014).

t CO2-eq/ha
0≥ 400

Thousands of years of agricultural land use have removed nearly 500 Gt CO2-eq from soils

Agriculture has altered the soil carbon balance around the world, resulting in changes (mostly losses) of soil carbon. Much of the nearly 500 Gt CO2-eq lost in the last 12,000 years is now in the atmosphere in the form of CO2.

Sanderman, J. et al. (2017). The soil carbon debt of 12,000 years of human land use [Data set]. PNAS 114(36): 9575–9580. Link to source: https://doi.org/10.1073/pnas.1706103114

t CO2-eq/ha
0≥ 400

Thousands of years of agricultural land use have removed nearly 500 Gt CO2-eq from soils

Agriculture has altered the soil carbon balance around the world, resulting in changes (mostly losses) of soil carbon. Much of the nearly 500 Gt CO2-eq lost in the last 12,000 years is now in the atmosphere in the form of CO2.

Sanderman, J. et al. (2017). The soil carbon debt of 12,000 years of human land use [Data set]. PNAS 114(36): 9575–9580. Link to source: https://doi.org/10.1073/pnas.1706103114

Maps Introduction

Adoption of this solution varies substantially across the globe. Currently, improved annual cropping practices are widely implemented in Australia and New Zealand (74% of annual cropland) and Central and South America (69%), with intermediate adoption in North America (34%) and low adoption in Asia, Europe, and Africa (1–5%) (Kassam et al., 2022), though estimates vary (see also Prestele et al., 2018). Future expansion of this solution is most promising in Asia, Africa, and Europe, where adoption has increased in recent years. Large areas of croplands are still available for implementation in these regions, whereas Australia, New Zealand, and Central and South America may be reaching a saturation point, and these practices may be less suitable for the relatively small area of remaining croplands.

The carbon sequestration effectiveness of this solution also varies across space. Drivers of soil carbon sequestration rates are complex and interactive, with climate, initial soil carbon content, soil texture, soil chemical properties (such as pH), and other land management practices all influencing the effectiveness of adopting this solution. Very broadly, the carbon sequestration potential of improved annual cropping tends to be two to three times higher in warm areas than cool areas (Bai et al., 2019; Cui et al., 2024; Lessmann et al., 2022). Warm and humid conditions enable vigorous cover crop growth, providing additional carbon inputs into soils. Complicating patterns of effectiveness, however, arid regions often experience increased crop yields following adoption of this solution whereas humid regions are more likely to experience yield losses (Pittelkow et al., 2015). Yield losses may reduce adoption in humid areas and can lead to cropland expansion to compensate for lower production. 

Uptake of this solution may be constrained by spatial variation in places where cover cropping is suitable. In areas with double or triple cropping, there may not be an adequate interval for growth of a cover crop between harvests. In areas with an extended dry season, there may be inadequate moisture to grow a cover crop.

Action Word
Improve
Solution Title
Annual Cropping
Classification
Highly Recommended

Lawmakers and Policymakers

  • Provide local and regional institutional guidance for improving annual cropping that adapts to the socio-environmental context.
  • Integrate soil protection into national climate mitigation and adaptation plans.
  • Remove financial incentives, such as subsidies, for unsustainable practices and replace them with financial incentives for carbon sequestration practices.
  • Place taxes or fines on emissions and related farm inputs (such as nitrogen fertilizers).
  • Reform international agricultural trade, remove subsidies for emissions-intensive agriculture, and support climate-friendly practices.
  • Strengthen and support land tenure for smallholder farmers.
  • Mandate insurance schemes that allow farmers to use cover crops and reduce tillage.
  • Support, protect, and promote traditional and Indigenous knowledge of land management practices.
  • Set standards for measuring, monitoring, and verifying impacts on SOC accounting for varying socio-environmental conditions.
  • Develop economic budgets for farmers to adopt these practices.
  • Invest in or expand extension services to educate farmers and other stakeholders on the economic and environmental benefits of improved annual cropping.
  • Create, support, or join education campaigns and/or public-private partnerships that facilitate stakeholder discussions.

Practitioners

  • Implement no-till practices and use cover crops.
  • Utilize or advocate for financial assistance and tax breaks for farmers to use improved annual cropping techniques.
  • Adjust the timing and dates of the planting and termination of the cover crops in order to avoid competition for resources with the primary crop.
  • Find opportunities to reduce initial operation costs of no-tillage and cover crops, such as selling cover crops as forage or grazing.
  • Take advantage of education programs, support groups, and extension services focused on improved annual cropping methods.
  • Create, support, or join stakeholder discussions, especially around standardized monitoring frameworks, ROI, and climate benefits.

Business Leaders

  • Source from producers implementing improved annual cropping practices, create programs that directly engage and educate farmers, and promote inspiring case studies with the industry and wider public.
  • Create sustainability goals and supplier requirements that incorporate this solution and offer pricing incentives for compliant suppliers.
  • Invest in companies that utilize improved annual cropping techniques or produce the necessary inputs.
  • Promote and develop markets for products that employ improved annual cropping techniques and educate consumers about the importance of the practice.
  • Stay abreast of recent scientific findings and use third-party verification to monitor sourcing practices.
  • Offer financial services – including low-interest loans, micro-financing, and grants – to support low-carbon agriculture (e.g., sustainable land management systems).
  • Support high-integrity carbon markets, institutions, rules, and norms to cultivate the demand for high-quality carbon credits.
  • Create, support, or join education campaigns and/or public-private partnerships that facilitate stakeholder discussions, especially around standardized monitoring frameworks, ROI, and climate benefits.

Nonprofit Leaders

  • Start model farms to demonstrate techniques, conduct experiments, and educate local farmers.
  • Conduct and share research on improving annual cropping techniques and local policy options.
  • Advocate to policymakers for improving annual cropping techniques, incentives, and regulations.
  • Educate farmers on sustainable means of agriculture and support implementation.
  • Help integrate improved annual cropping practices as part of the broader climate agenda.
  • Engage with businesses to encourage corporate responsibility and/or monitor soil health.
  • Offer resources and training in financial planning and yield risk management to farmers adopting improved annual cropping approaches.
  • Partner with research institutions and businesses to co-develop and distribute region-specific best practices.
  • Create, support, or join stakeholder discussions, especially around standardized monitoring frameworks, ROI, and climate benefits.

Investors

  • Integrate science-based due diligence on improved annual cropping techniques and soil health measures into all farming and agritech investments.
  • Encourage companies in your investment portfolio to adopt improved annual cropping practices.
  • Offer access to capital, such as low-interest loans, micro-financing, and grants to improve annual cropping.
  • Invest in companies developing technologies that improve annual cropping, such as soil management equipment and related software.
  • Create, support, or join stakeholder discussions, especially around standardized monitoring frameworks, ROI, and climate benefits.

Philanthropists and International Aid Agencies

  • Start model farms to demonstrate techniques, conduct experiments, and educate local farmers.
  • Offer access to capital, such as low-interest loans, micro-financing, and grants to support improving annual cropping, (e.g., traditional land management).
  • Conduct and share research on improved annual cropping techniques and local policy options.
  • Advocate to policymakers for improved annual cropping techniques, incentives, and regulations.
  • Educate farmers on traditional means of agriculture and support implementation.
  • Help integrate improved annual cropping practices as part of the broader climate agenda.
  • Engage with businesses to encourage corporate responsibility and/or monitor soil health.
  • Offer resources and training in financial planning and yield risk management to farmers adopting improved annual cropping approaches.
  • Partner with research institutions and businesses to co-develop and distribute region-specific best practices.
  • Create, support, or join stakeholder discussions, especially around standardized monitoring frameworks, ROI, and climate benefits.
  • Invest in companies developing technologies that improve annual cropping, such as soil management equipment and related software.

Thought Leaders

  • Start model farms to demonstrate techniques, conduct experiments, and educate local farmers.
  • Conduct and share research on improved annual cropping techniques and local policy options.
  • Advocate to policymakers for improved annual cropping techniques, incentives, and regulations.
  • Educate farmers on traditional means of agriculture and support implementation.
  • Engage with businesses to encourage corporate responsibility and/or monitor soil health.
  • Research the regional impacts of cover crops on SOC and SOM and publish the data.
  • Partner with research institutions and businesses to co-develop and distribute region-specific best practices.
  • Create, support, or join stakeholder discussions, especially around standardized monitoring frameworks, ROI, and climate benefits.
  • Work with farmers and other private organizations to improve data collection on uptake of improved annual cropping techniques, effectiveness, and regional best practices.

Technologists and Researchers

  • Help develop standards for measuring, monitoring, and verifying impacts on SOC accounting for varying socio-environmental conditions.
  • Research the regional impacts of cover crops (particularly outside the United States) on SOC and SOM, and publish the data.
  • Create tracking and monitoring software to support farmers' decision-making.
  • Research the application of AI and robotics for crop rotation.
  • Improve data and analytics to monitor soil and water quality, assist farmers, support policymaking, and assess the impacts of policies.
  • Develop education and training applications to improve annual cropping techniques and provide real-time feedback.

Communities, Households, and Individuals

  • Participate in urban agriculture or community gardening programs that implement these practices.
  • Engage with businesses to encourage corporate responsibility and/or monitor soil health.
  • Work with farmers and other private organizations to improve data collection on uptake of improved annual cropping techniques, effectiveness, and regional best practices.
  • Advocate to policymakers for improved annual cropping techniques, incentives, and regulations.
  • Start model farms to demonstrate techniques, conduct experiments, and educate local farmers.
  • Educate farmers on traditional means of agriculture and support implementation.
  • Create, support, or join stakeholder discussions, especially around standardized monitoring frameworks, ROI, and climate benefits.
Evidence Base

Consensus of effectiveness of cover cropping for sequestering carbon: 

The impacts of improved annual cropping practices on soil carbon sequestration have been extensively studied, and there is high consensus that adoption of cover crops can increase carbon sequestration in soils. However, estimates of how much carbon can be sequestered vary substantially, and sequestration rates are strongly influenced by factors such as climate, soil properties, time since adoption, and how the practices are implemented.

The carbon sequestration benefits of cover cropping are well established. They have been documented in reviews and meta-analyses including Hu et al. (2023) and Vendig et al. (2023). 

Consensus of effectiveness of reduced tillage for sequestering carbon: Mixed

Relative to conventional tillage, estimates of soil carbon gains in shallow soils under no-till management include average increases of 5–20% (Bai et al., 2019; Cui et al., 2024; Kan et al., 2022). Lessmann et al. (2022) estimated that use of no-till is associated with an average annual increase in carbon sequestration of 0.88 t CO₂‑eq /ha/yr relative to high-intensity tillage. 

Nitrous oxide reduction: Mixed

Consensus on nitrous oxide reductions from improved annual cropping is mixed. Several reviews have demonstrated a modest reduction in nitrous oxide from cover cropping (Abdalla et al., 2019; Xing & Wang, 2024). Reduced tillage can result in either increased or decreased nitrous oxide emissions (Hassan et al., 2022). 

The results presented in this document summarize findings from 10 reviews and meta-analyses reflecting current evidence at the global scale. Nonetheless, not all countries are represented. We recognize this limited geographic scope creates bias, and hope this work inspires research and data sharing on this topic in underrepresented regions.

Updated Date
Coming Soon Label
Coming Soon

Improve Rice Production

Image
Image
Rice field
Coming Soon
Off
Summary

Rice production is a significant source of methane emissions and a minor source of nitrous oxide emissions. Most rice production occurs in flooded fields called paddies, where anaerobic conditions trigger high levels of methane production. This solution includes two related practices that each reduce emissions from paddy rice production: noncontinuous flooding and nutrient management. Noncontinuous flooding is a water management technique that reduces the amount of time rice paddy soils spend fully saturated, thereby reducing methane. Unfortunately, noncontinuous flooding increases nitrous oxide emissions. Nutrient management helps to address this challenge by controlling the timing, amount, and type of fertilization to maximize plant uptake and minimize nitrous oxide emissions.

Description for Social and Search
Improve Rice Production is a Highly Recommended climate solution. It reduces emissions of methane and nitrous oxide, two potent greenhouse gases, by converting rice paddies from continuous flooding to noncontinuous flooding and improving nutrient management.
Overview

Rice is a staple crop of critical importance, occupying 11% of global cropland (FAOstat 2025). Rice production has higher GHG emissions than most crop production, accounting for 9% of all anthropogenic methane and 10% of cropland nitrous oxide (Wang et al., 2020). Nabuurs et al. (2022) found methane emissions from global rice production to be 0.8–1.0 Gt CO₂‑eq/yr and growing 0.4% annually.

Rice paddy systems are fields with berms and plumbing to permit the flooding of rice for the production periods, which helps with weed and pest control (rice thrives in flooded conditions, though it does not require them). Paddy rice is the main source of methane from rice production. Upland rice is grown outside of paddies and does not produce significant methane emissions, so we excluded it from this analysis. Irrigated paddies are provided with irrigation water, while rain-fed paddies are only filled by rainfall and runoff (Raffa, 2021). For this analysis, we considered both irrigated and rain-fed paddies.

Methane Reduction

Flooded rice paddies encourage the production of methane by microbes. Conventional paddy rice production uses continuous flooding, in which the paddy is flooded for the full rice production period. Several approaches can reduce methane, with the most widespread being noncontinuous flooding. This is a collection of practices (such as alternate wetting and drying) that drain the fields one or more times during the rice production period. As a result, the paddy spends less time in its methane-producing state. This can be done without reducing rice yields in many, but not all, cases, and also significantly reduces irrigation water use (Bo et al., 2022). Impacts on yields depend on soils, climate, and other variables (Cheng et al., 2022). 

Nitrous Oxide Reduction

A major drawback to noncontinuous flooding is that it increases nitrous oxide emissions from fertilizer compared to continuous flooding. High nitrogen levels in flooded paddies encourage the growth of bacteria that produce methane, reduce the natural breakdown of methane, and facilitate emissions of nitrous oxide to the atmosphere (Li et al., 2024). The effect is small compared to the mitigated emissions from methane reduction (Jiang et al., 2019), but remains serious. Use of nutrient management techniques, such as controlling fertilizer amount, type (e.g., controlled-release urea), timing, and application techniques (e.g., deep fertilization), can reduce these emissions. This is in part because nitrogen fertilizers are often overapplied, leaving room to increase efficiency without reducing rice yields (Hergoualc’h et al., 2019; Li et al., 2024). 

Other Promising Practices

Other practices also show potential but were not included in our analysis. These include the application of biochar to rice paddies and the use of rice cultivars that produce fewer emissions (Qian et al., 2023). Other approaches include saturated soil culture, System of Rice Intensification (“SRI”), ground-cover systems, raised beds, and improved irrigation and paddy infrastructure (Surendran et al., 2021). 

Note that some practices, such as incorporating rice straw or the use of compost or manure, can increase nitrous oxide emissions (Li et al., 2024). 

There is also evidence that, under some circumstances, noncontinuous flooding can sequester soil organic carbon by increasing soil organic matter. However, there are not enough data available to quantify this (Qian et al., 2023). Indeed, one meta-analysis found that noncontinuous flooding can actually lead to a decrease in soil organic carbon (Livsey et al., 2019). One complication is that many production areas plant rice two or even three times per year, and data are typically presented on a per-harvest or even per-flooded day basis. To overcome this challenge, we use data on the percentage of global irrigated rice land in single, double, and triple cropping from Carlson et al. (2016) to create weighted average values as appropriate.

References

Adalibieke, W., Cui, X., Cai, H., You, L., & Zhou, F. (2023). Global crop-specific nitrogen fertilization dataset in 1961–2020. Scientific Data, 10(1), Article 617. Link to source: https://doi.org/10.1038/s41597-023-02526-z

Alauddin, M., Rashid Sarker, Md. A., Islam, Z., & Tisdell, C. (2020). Adoption of alternate wetting and drying (AWD) irrigation as a water-saving technology in Bangladesh: Economic and environmental considerations. Land Use Policy, 91, Article 104430. Link to source: https://doi.org/10.1016/j.landusepol.2019.104430

Bijay-Singh, & Craswell, E. (2021). Fertilizers and nitrate pollution of surface and ground water: An increasingly pervasive global problem. SN Applied Sciences, 3(4), Article 518. Link to source: https://doi.org/10.1007/s42452-021-04521-8

Bo, Y., Jägermeyr, J., Yin, Z., Jiang, Y., Xu, J., Liang, H., & Zhou, F. (2022). Global benefits of non‐continuous flooding to reduce greenhouse gases and irrigation water use without rice yield penalty. Global Change Biology, 28(11), 3636–3650. Link to source: https://doi.org/10.1111/gcb.16132

Carlson, K. M., Gerber, J. S., Mueller, N. D., Herrero, M., MacDonald, G. K., Brauman, K. A., Havlik, P., O’Connell, C.S., Johnson, J.A., Saatchi, S., & West, P.C. (2017). Greenhouse gas emissions intensity of global croplands. Nature Climate Change, 7(1), 63–68. Link to source: https://doi.org/10.1038/nclimate3158 

Carrijo, D. R., Lundy, M. E., & Linquist, B. A. (2017). Rice yields and water use under alternate wetting and drying irrigation: A meta-analysis. Field Crops Research, 203, 173–180. Link to source: https://doi.org/10.1016/j.fcr.2016.12.002

Cheng, H., Shu, K., Zhu, T., Wang, L., Liu, X., Cai, W., Qi, Z., & Feng, S. (2022). Effects of alternate wetting and drying irrigation on yield, water and nitrogen use, and greenhouse gas emissions in rice paddy fields. Journal of Cleaner Production, 349, Article 131487. Link to source: https://doi.org/10.1016/j.jclepro.2022.131487

Cui, X., Zhou, F., Ciais, P., Davidson, E. A., Tubiello, F. N., Niu, X., Ju, X., Canadell, J.P., Bouwman, A.F., Jackson, R.B., Mueller, N.D., Zheng, X., Kanter, D.R., Tian, H., Adalibieke, W., Bo, Y., Wang, Q., Zhan, X., & Zhu, D. (2021). Global mapping of crop-specific emission factors highlights hotspots of nitrous oxide mitigation. Nature Food, 2(11), 886–893. Link to source: https://doi.org/10.1038/s43016-021-00384-9 

Damania, R., Polasky, S., Ruckelshaus, M., Russ, J., Chaplin-Kramer, R., Gerber, J., Hawthorne, P., Heger, M.P., Mamun, S., Amann, M., Ruta, G., & Wagner, F. (2023). Nature's Frontiers: Achieving Sustainability, Efficiency, and Prosperity with Natural Capital. World Bank Publications. Link to source: https://openknowledge.worldbank.org/entities/publication/855c2e15-c88b-4c04-a2e5-2d98c25b8eca 

Enriquez, Y., Yadav, S., Evangelista, G. K., Villanueva, D., Burac, M. A., & Pede, V. (2021). Disentangling challenges to scaling alternate wetting and drying technology for rice cultivation: Distilling lessons from 20 years of experience in the Philippines. Frontiers in Sustainable Food Systems, 5, 1-16. Link to source: https://www.frontiersin.org/journals/sustainable-food-systems/articles/10.3389/fsufs.2021.675818/full 

Food and Agriculture Organization of the United Nations. (2025). FAOSTAT Statistical Database, [Rome]: FAO, 1997. Link to source: https://www.fao.org/faostat/en/ 

Gerber, J. S., Ray, D. K., Makowski, D., Butler, E. E., Mueller, N. D., West, P. C., Johnson, J. A., Polasky, S., Samberg, L. H., & Siebert, S. (2024). Global spatially explicit yield gap time trends reveal regions at risk of future crop yield stagnation. Nature Food, 5(2), 125–135. Link to source: https://doi.org/10.1038/s43016-023-00913-8 

Gu, B., Zhang, X., Lam, S. K., Yu, Y., Van Grinsven, H. J., Zhang, S., Wang, X., Bodirsky, B.L., Wang, S., Duan, J., Ren, C., Bouwman, L., de Vries, W., Xu, J., & Chen, D. (2023). Cost-effective mitigation of nitrogen pollution from global croplands. Nature, 613(7942), 77–84. Link to source: https://doi.org/10.1038/s41586-022-05481-8 

Hergoualc’h, K., Akiyama, H., Bernoux, M., Chirinda, N., del Prado, A., Kasimir, A., MacDonald, J.D., Ogle, S.M., Regina, K., van der Weerden, T.J. (2019) 2019 Refinement to the 2006 IPCC Guidelines for National Greenhouse Gas Inventories. Chapter 11: N2O Emissions from Managed Soils, and CO2 Emissions from Lime and Urea Application. Cambridge University Press. Link to source: https://www.ipcc-nggip.iges.or.jp/public/2006gl/pdf/4_Volume4/V4_11_Ch11_N2O%26CO2.pdf 

Ishfaq, M., Farooq, M., Zulfiqar, U., Hussain, S., Akbar, N., Nawaz, A., & Anjum, S. A. (2020). Alternate wetting and drying: A water-saving and ecofriendly rice production system. Agricultural Water Management, 241, Article 106363. Link to source: https://doi.org/10.1016/j.agwat.2020.106363

Jameel, Y., Mozumder, M. R. H., Van Geen, A., & Harvey, C. F. (2021). Well‐Switching to Reduce Arsenic Exposure in Bangladesh: Making the Most of Inaccurate Field Kit Measurements. GeoHealth, 5(12), Article e2021GH000464. Link to source: https://doi.org/10.1029/2021GH000464

Jiang, Y., Carrijo, D., Huang, S., Chen, J., Balaine, N., Zhang, W., Van Groenigen, K.J. & Linquist, B. (2019). Water management to mitigate the global warming potential of rice systems: A global meta-analysis. Field Crops Research, 234, 47–54. Link to source: https://doi.org/10.1016/j.fcr.2019.02.101 

Lampayan, R. M., Rejesus, R. M., Singleton, G. R., & Bouman, B. A. (2015). Adoption and economics of alternate wetting and drying water management for irrigated lowland rice. Field Crops Research, 170, 95–108. Link to source: https://doi.org/10.1016/j.fcr.2014.10.013

Li, L., Huang, Z., Mu, Y., Song, S., Zhang, Y., Tao, Y., & Nie, L. (2024). Alternate wetting and drying maintains rice yield and reduces global warming potential: A global meta-analysis. Field Crops Research, 318, Article 109603. Link to source: https://doi.org/10.1016/j.fcr.2024.109603

Liang, K., Zhong, X., Fu, Y., Hu, X., Li, M., Pan, J., Liu, Y., Hu, R., & Ye, Q. (2023). Mitigation of environmental N pollution and greenhouse gas emission from double rice cropping system with a new alternate wetting and drying irrigation regime coupled with optimized N fertilization in South China. Agricultural Water Management, 282, Article 108282. Link to source: https://doi.org/10.1016/j.agwat.2023.108282

Linquist, B. A., Adviento-Borbe, M. A., Pittelkow, C. M., van Kessel, C., & van Groenigen, K. J. (2012). Fertilizer management practices and greenhouse gas emissions from rice systems: a quantitative review and analysis. Field Crops Research, 135, 10–21. Link to source: https://doi.org/10.1016/j.fcr.2012.06.007

Liang, X. Q., Chen, Y. X., Nie, Z. Y., Ye, Y. S., Liu, J., Tian, G. M., Wang, G. H., & Tuong, T. P. (2013). Mitigation of nutrient losses via surface runoff from rice cropping systems with alternate wetting and drying irrigation and site-specific nutrient management practices. Environmental Science and Pollution Research, 20(10), 6980–6991. Link to source: https://doi.org/10.1007/s11356-012-1391-1

Livsey, J., Kätterer, T., Vico, G., Lyon, S. W., Lindborg, R., Scaini, A., Da, C.T,. & Manzoni, S. (2019). Do alternative irrigation strategies for rice cultivation decrease water footprints at the cost of long-term soil health? Environmental Research Letters, 14(7), 074011. Link to source: https://doi.org/10.1088/1748-9326/ab2108 

Ludemann, C. I., Gruere, A., Heffer, P., & Dobermann, A. (2022). Global data on fertilizer use by crop and by country. Scientific data, 9(1), 1–8. Link to source: https://doi.org/10.1038/s41597-022-01592-z 

Nabuurs, G-J., R. Mrabet, A. Abu Hatab, M. Bustamante, H. Clark, P. Havl.k, J. House, C. Mbow, K.N. Ninan, A. Popp, S. Roe, B. Sohngen, S. Towprayoon, 2022: Agriculture, Forestry and Other Land Uses (AFOLU). In IPCC, 2022: Climate Change 2022: Mitigation of Climate Change. Contribution of Working Group III to the Sixth Assessment Report of the Intergovernmental Panel on Climate Change [P.R. Shukla, J. Skea, R. Slade, A. Al Khourdajie, R. van Diemen, D. McCollum, M. Pathak, S. Some, P. Vyas, R. Fradera, M. Belkacemi, A. Hasija, G. Lisboa, S. Luz, J. Malley, (eds.)]. Cambridge University Press, Cambridge, UK and New York, NY, USA. doi: 10.1017/9781009157926.009

Ogle, S. M., Wakelin, S. J., Buendia, L., McConkey, B., Baldock, J., Akiyama, H., ... & Zheng, X. (2019). 2019 Refinement to the 2006 IPCC Guidelines for National Greenhouse Gas Inventories. Chapter 4: Cropland. Cambridge University Press. Link to source: https://www.ipcc.ch/report/2019-refinement-to-the-2006-ipcc-guidelines-for-national-greenhouse-gas-inventories/ 

Qian, H., Zhu, X., Huang, S., Linquist, B., Kuzyakov, Y., Wassmann, R., ... & Jiang, Y. (2023). Greenhouse gas emissions and mitigation in rice agriculture. Nature Reviews Earth & Environment, 4(10), 716–732. Link to source: https://doi.org/10.1038/s43017-023-00482-1 

Raffa, D.W. & Morales-Abubakar, A. L. (2021) Soil Health for Paddy Rice. Food and Agriculture Organization of the United Nations. Link to source: https://openknowledge.fao.org/server/api/core/bitstreams/fcd04aae-0389-411b-8a47-a622b23d642f/content 

Roe, S., Streck, C., Beach, R., Busch, J., Chapman, M., Daioglou, V., Deppermann, A., Doelman, J., Emmet-Booth, J., Engelmann, J., Fricko, O., Frischmann, C., Funk, J., Grassi, G., Griscom, B., Havlik, P., Hanssen, S., Humpenöder, F., Landholm, D., LOmax, G., Lehmann, J., Mesnildrey, L., Nabuurrs, G., Popp, A., Rivard, C., Sanderman, J., Sohngen, B., Smith, P., Stehfest, E., Woolf, D., & Lawrence, D. (2021). Land‐based measures to mitigate climate change: Potential and feasibility by country. Global Change Biology, 27(23), 6025–6058. Link to source: https://doi.org/10.1111/gcb.15873

Salmon, J. M., Friedl, M. A., Frolking, S., Wisser, D., & Douglas, E. M. (2015). Global rain-fed, irrigated, and paddy croplands: A new high resolution map derived from remote sensing, crop inventories and climate data. International Journal of Applied Earth Observation and Geoinformation, 38, 321–334. Link to source: https://doi.org/10.1016/j.jag.2015.01.014

Surendran, U., Raja, P., Jayakumar, M., & Subramoniam, S. R. (2021). Use of efficient water saving techniques for production of rice in India under climate change scenario: A critical review. Journal of Cleaner Production, 309. Link to source: https://doi.org/10.1016/j.jclepro.2021.127272

Suwanmaneepong, S., Kultawanich, K., Khurnpoon, L., Sabaijai, P. E., Cavite, H. J., Llones, C., Lepcha, N., & Kerdsriserm, C. (2023). Alternate Wetting and Drying as Water-Saving Technology: An Adoption Intention in the Perspective of Good Agricultural Practices (GAP) Suburban Rice Farmers in Thailand. Water, 15(3), Article 402. Link to source: https://doi.org/10.3390/w15030402

Xia, L., Lam, S. K., Chen, D., Wang, J., Tang, Q., & Yan, X. (2017). Can knowledge‐based N management produce more staple grain with lower greenhouse gas emission and reactive nitrogen pollution? A meta‐analysis. Global change biology, 23(5), 1917–1925. Link to source: https://doi.org/10.1111/gcb.13455

Zhang, W., Yu, J., Xu, Y., Wang, Z., Liu, L., Zhang, H., Gu, J., Zhang, J., & Yang, J. (2021). Alternate wetting and drying irrigation combined with the proportion of polymer-coated urea and conventional urea rates increases grain yield, water and nitrogen use efficiencies in rice. Field Crops Research, 268, Article 108165. Link to source: https://doi.org/10.1016/j.fcr.2021.108165

Zhang, Y., Wang, W., Li, S., Zhu, K., Hua, X., Harrison, M.T., Liu, K., Yang, J., Liu, L, & Chan, Y. (2023). Integrated management approaches enabling sustainable rice production under alternate wetting and drying irrigation. Agricultural Water Management, 281. Link to source: https://doi.org/10/1016/j.agwat.2023.108265 

Credits

Lead Fellow

  • Eric Toensmeier

Contributors

  • Ruthie Burrows, Ph.D.

  • James Gerber, Ph.D.

  • Yusuf Jameel, Ph.D.

  • Daniel Jasper

  • Alex Sweeney

Internal Reviewers

  • Aiyana Bodi

  • James Gerber, Ph.D.

  • Hannah Henkin

  • Zoltan Nagy, Ph.D.

  • Ted Otte

  • Paul C. West, Ph.D.

Effectiveness

Methane Reduction

We calculated per-hectare methane emissions using Intergovernmental Panel on Climate Change (IPCC) methodology (Ogle et. al, 2019). To develop regional emissions per rice harvest, we multiplied standard regional daily baseline emissions by standard cultivation period lengths, then multiplied by the mean scaling factor for noncontinuous flooding systems. However, the total number of rice harvests per year ranged from one to three. Carlson et al. (2016) reported a global figure of harvests on rice fields: 42% were harvested once, 50% were harvested twice, and 8% were harvested three times. We used this to develop a weighted average methane emissions figure for each region. National effectiveness ranged from 1.55 to 3.29 t CO₂‑eq /ha/yr (Table 1a).

Nitrous Oxide Reduction

Using data from Adalibieke et al. (2024) and Gerber et al. (2024), we calculated the current country-level rate of nitrogen application per hectare and a target rate reflecting improved efficiency through nutrient management. For a full methodology, see the Appendix. 

In noncontinuously flooded systems, nitrous oxide emissions are 1.66 times higher per t of nitrogen applied (Hergoualc’h et al., 2019). Using the different emissions factors, we calculated total nitrous oxide emissions for 1) flooded rice with current nitrogen application rates, and 2) noncontinuously flooded rice with target nitrogen application rates. 

The effectiveness of nutrient management for each country with over 100,000 ha of rice production ranged from –0.48 to 0.11 t CO₂‑eq /ha/yr (Table 1).

Combined Reduction

Combined effectiveness of methane and nitrous oxide reduction was 1.49–3.39 t CO₂‑eq /ha/yr (Table 1).

Table 1a. Combined effectiveness at reducing emissions, by country, for noncontinuous flooding with nutrient management. 

Unit: t CO₂‑eq /ha/yr

Afghanistan 1.63
Argentina 2.70
Bangladesh 1.63
Benin 2.30
Bolivia (Plurinational State of) 2.70
Brazil 2.70
Burkina Faso 2.30
Cambodia 2.13
Cameroon 2.30
Chad 2.30
China 2.48
Colombia 2.70
Côte d'Ivoire 2.30
Democratic People's Republic of Korea 2.48
Democratic Republic of the Congo 2.30
Dominican Republic 2.70
Ecuador 2.70
Egypt 2.30
Ghana 2.30
Guinea 2.30
Guinea-Bissau 2.30
Guyana 2.70
India 1.63
Indonesia 2.13
Iran (Islamic Republic of) 3.29
Italy 3.29
Japan 2.48
Lao People's Democratic Republic 2.13
Liberia 2.30
Madagascar 2.30
Malaysia 2.13
Mali 2.30
Mozambique 2.30
Myanmar 2.13
Nepal 1.63
Nigeria 2.30
Pakistan 1.63
Paraguay 2.70
Peru 2.70
Philippines 2.13
Republic of Korea 2.48
Russian Federation 3.29
Senegal 2.30
Sierra Leone 2.30
Sri Lanka 1.63
Thailand 2.13
Turkey 3.29
Uganda 2.70
United Republic of Tanzania 2.30
United States of America 1.55
Uruguay 2.70
Venezuela (Bolivarian Republic of) 2.70
Vietnam 2.13

Unit: t CO₂‑eq /ha/yr

Afghanistan 0.03
Argentina 0.07
Bangladesh 0.06
Benin 0.03
Bolivia (Plurinational State of) 0.00
Brazil 0.00
Burkina Faso –0.02
Cambodia 0.01
Cameroon 0.00
Chad 0.01
China 0.01
Colombia –0.07
Côte d'Ivoire 0.02
Democratic People's Republic of Korea 0.02
Democratic Republic of the Congo 0.01
Dominican Republic –0.16
Ecuador –0.08
Egypt –0.15
Ghana 0.05
Guinea 0.01
Guinea-Bissau 0.01
Guyana –0.06
India –0.02
Indonesia 0.11
Iran (Islamic Republic of) –0.05
Italy 0.00
Japan 0.07
Lao People's Democratic Republic 0.02
Liberia 0.02
Madagascar 0.00
Malaysia –0.01
Mali –0.03
Mozambique 0.01
Myanmar 0.04
Nepal 0.04
Nigeria 0.01
Pakistan –0.04
Paraguay 0.01
Peru 0.09
Philippines 0.00
Republic of Korea 0.00
Russian Federation 0.04
Senegal –0.04
Sierra Leone 0.02
Sri Lanka 0.02
Thailand –0.03
Turkey 0.10
Uganda 0.00
United Republic of Tanzania 0.04
United States of America –0.05
Uruguay 0.03
Venezuela (Bolivarian Republic of) –0.48
Vietnam 0.00

Unit: t CO₂‑eq /ha rice paddies/yr

Afghanistan 1.67
Argentina 2.77
Bangladesh 1.69
Benin 2.34
Bolivia (Plurinational State of) 2.70
Brazil 2.70
Burkina Faso 2.28
Cambodia 2.15
Cameroon 2.30
Chad 2.32
China 2.48
Colombia 2.63
Côte d'Ivoire 2.32
Democratic People's Republic of Korea 2.50
Democratic Republic of the Congo 2.31
Dominican Republic 2.54
Ecuador 2.62
Egypt 2.16
Ghana 2.35
Guinea 2.32
Guinea-Bissau 2.32
Guyana 2.63
India 1.61
Indonesia 2.24
Iran (Islamic Republic of) 3.24
Italy 3.29
Japan 2.54
Lao People's Democratic Republic 2.15
Liberia 2.32
Madagascar 2.31
Malaysia 2.13
Mali 2.28
Mozambique 2.32
Myanmar 2.17
Nepal 1.67
Nigeria 2.32
Pakistan 1.59
Paraguay 2.71
Peru 2.79
Philippines 2.14
Republic of Korea 2.47
Russian Federation 3.33
Senegal 2.27
Sierra Leone 2.32
Sri Lanka 1.65
Thailand 2.10
Turkey 3.39
Uganda 2.31
United Republic of Tanzania 2.35
United States of America 1.49
Uruguay 2.72
Venezuela (Bolivarian Republic of) 2.22
Vietnam 2.13
Left Text Column Width

Table 1b. Combined effectiveness at reducing emissions, by country, for noncontinuous flooding with nutrient management. 

Unit: t CO₂‑eq /ha rice paddies/yr

Afghanistan 4.75
Argentina 7.85
Bangladesh 4.75
Benin 6.71
Bolivia (Plurinational State of) 7.85
Brazil 7.85
Burkina Faso 6.71
Cambodia 6.21
Cameroon 6.71
Chad 6.71
China 7.20
Colombia 7.85
Côte d'Ivoire 6.71
Democratic People's Republic of Korea 7.20
Democratic Republic of the Congo 6.71
Dominican Republic 7.85
Ecuador 7.85
Egypt 6.71
Ghana 6.71
Guinea 6.71
Guinea-Bissau 6.71
Guyana 7.85
India 4.75
Indonesia 6.21
Iran (Islamic Republic of) 9.57
Italy 9.57
Japan 7.20
Lao People's Democratic Republic 6.21
Liberia 6.71
Madagascar 6.71
Malaysia 6.21
Mali 6.71
Mozambique 6.71
Myanmar 6.21
Nepal 4.75
Nigeria 6.71
Pakistan 4.75
Paraguay 7.85
Peru 7.85
Philippines 6.21
Republic of Korea 7.20
Russian Federation 9.57
Senegal 6.71
Sierra Leone 6.71
Sri Lanka 4.75
Thailand 6.21
Turkey 9.57
Uganda 6.71
United Republic of Tanzania 6.71
United States of America 4.51
Uruguay 7.85
Venezuela (Bolivarian Republic of) 7.85
Vietnam 6.21

Unit: t CO₂‑eq /ha rice paddies/yr

Afghanistan 0.03
Argentina 0.07
Bangladesh 0.06
Benin 0.03
Bolivia (Plurinational State of) 0.00
Brazil 0.00
Burkina Faso 0.02
Cambodia 0.01
Cameroon 0.00
Chad 0.01
China 0.01
Colombia –0.07
Côte d'Ivoire 0.02
Democratic People's Republic of Korea 0.02
Democratic Republic of the Congo 0.01
Dominican Republic 0.16
Ecuador –0.08
Egypt –0.15
Ghana 0.05
Guinea 0.01
Guinea-Bissau 0.01
Guyana –0.06
India –0.02
Indonesia 0.11
Iran (Islamic Republic of) –0.05
Italy 0.00
Japan 0.07
Lao People's Democratic Republic 0.02
Liberia 0.02
Madagascar 0.00
Malaysia –0.01
Mali –0.03
Mozambique 0.01
Myanmar 0.04
Nepal 0.04
Nigeria 0.01
Pakistan –0.04
Paraguay 0.01
Peru 0.09
Philippines 0.00
Republic of Korea 0.00
Russian Federation 0.04
Senegal –0.04
Sierra Leone 0.02
Sri Lanka 0.02
Thailand –0.03
Turkey 0.10
Uganda 0.00
United Republic of Tanzania 0.04
United States of America –0.05
Uruguay 0.03
Venezuela (Bolivarian Republic of) –0.48
Vietnam 0.00

Unit: t CO₂‑eq /ha rice paddies/yr

Afghanistan 4.78
Argentina 7.93
Bangladesh 4.81
Benin 6.74
Bolivia (Plurinational State of) 7.85
Brazil 7.85
Burkina Faso 6.68
Cambodia 6.22
Cameroon 6.71
Chad 6.72
China 7.21
Colombia 7.21
Côte d'Ivoire 6.73
Democratic People's Republic of Korea 7.23
Democratic Republic of the Congo 6.71
Dominican Republic 7.69
Ecuador 7.77
Egypt 6.56
Ghana 6.76
Guinea 6.72
Guinea-Bissau 6.72
Guyana 7.79
India 4.73
Indonesia 6.31
Iran (Islamic Republic of) 9.52
Italy 9.57
Japan 7.27
Lao People's Democratic Republic 6.23
Liberia 6.72
Madagascar 6.71
Malaysia 6.20
Mali 6.20
Mozambique 6.72
Myanmar 6.25
Nepal 4.79
Nigeria 6.72
Pakistan 4.71
Paraguay 7.86
Peru 7.95
Philippines 6.21
Republic of Korea 7.20
Russian Federation 9.61
Senegal 6.67
Sierra Leone 6.73
Sri Lanka 4.77
Thailand 6.18
Turkey 9.67
Uganda 6.71
United Republic of Tanzania 6.75
United States of America 4.45
Uruguay 7.88
Venezuela (Bolivarian Republic of) 7.38
Vietnam 6.20
Left Text Column Width
Cost

For conventional paddy rice, we assumed an initial cost of US$0 because many millions of hectares of paddies are already in place (Table 2). We used regional per-hectare average profits from Damania et al. (2024) as the source for net profit per year. Because the initial cost per hectare is US$0, the net cost per hectare is the negative of the per-hectare annual profit.

Table 2. Net cost and profit of conventional paddy rice by region in 2023.

Unit: US$/ha rice paddies

Africa 0.00
East Asia 0.00
Europe 0.00
North America 0.00
South America 0.00
South Asia 0.00
Southeast Asia 0.00

Unit: US$/ha rice paddies/yr

Africa 457.34
East Asia 543.67
Europe 585.43
North America 356.27
South America 285.69
South Asia 488.85
Southeast Asia 322.13

Unit: US$/ha rice paddies/yr

Africa -457.34
East Asia -543.67
Europe -585.43
North America -356.27
South America -285.69
South Asia -488.85
Southeast Asia -322.13
Left Text Column Width

For noncontinuous flooding, we assumed an initial cost of US$0 because no new inputs or changes to paddy infrastructure are required in most cases. Median impact on net profit was an increase of 17% based on nine data points from seven sources. National results are shown in Table 3.

We assumed nutrient management has an initial cost of US$0 because in many cases, nutrient management begins with reducing the overapplication of fertilizer. Here we used the mean value from Gu et al. (2023), a savings of US$507.8/t nitrogen. We used our national-level data on overapplication of nitrogen to calculate savings per hectare. National results are shown in Table 3.

Combined Net Profit per Hectare

Net profit per hectare varies by country due to regional and some country-specific variables. Country-by-country results are shown in Table 3.

Net Net Cost Compared to Conventional Paddy Rice

Net net cost varies by country. Country-by-country results are shown in Table 3.

Table 3. Net cost and profit of noncontinuous flooding with nutrient management by region.

Unit: US$/ha rice paddies

Afghanistan 0.00
Argentina 0.00
Bangladesh 0.00
Benin 0.00
Bolivia (Plurinational State of) 0.00
Brazil 0.00
Burkina Faso 0.00
Cambodia 0.00
Cameroon 0.00
Chad 0.00
China 0.00
Colombia 0.00
Cote d'Ivoire 0.00
Democratic People's Republic of Korea 0.00
Democratic Republic of the Congo 0.00
Dominican Republic 0.00
Ecuador 0.00
Egypt 0.00
Ghana 0.00
Guinea 0.00
Guinea–Bissau 0.00
Guyana 0.00
India 0.00
Indonesia 0.00
Iran (Islamic Republic of) 0.00
Italy 0.00
Japan 0.00
Lao People's Democratic Republic 0.00
Liberia 0.00
Madagascar 0.00
Malaysia 0.00
Mali 0.00
Mozambique 0.00
Myanmar 0.00
Nepal 0.00
Nigeria 0.00
Pakistan 0.00
Paraguay 0.00
Peru 0.00
Philippines 0.00
Republic of Korea 0.00
Russian Federation 0.00
Senegal 0.00
Sierra Leone 0.00
Sri Lanka 0.00
Thailand 0.00
Turkey 0.00
Uganda 0.00
United Republic of Tanzania 0.00
United States of America 0.00
Uruguay 0.00
Venezuela (Bolivarian Republic of) 0.00
Vietnam 0.00

Non-continuous flooding and nutrient management.

Unit: US$/ha rice paddies/yr

Afghanistan 573.4
Argentina 354.8
Bangladesh 576.7
Benin 535.1
Bolivia (Plurinational State of) 354.1
Brazil 363.4
Burkina Faso 553.3
Cambodia 377.8
Cameroon 543.7
Chad 535.1
China 675.1
Colombia 397.7
Cote d'Ivoire 535.8
Democratic People's Republic of Korea 654.6
Democratic Republic of the Congo 535.6
Dominican Republic 428.4
Ecuador 390.3
Egypt 802.2
Ghana 535.5
Guinea 538.5
Guinea–Bissau 539.2
Guyana 382.0
India 607.9
Indonesia 382.3
Iran (Islamic Republic of) 726.7
Italy 567.9
Japan 636.0
Lao People's Democratic Republic 377.0
Liberia 535.3
Madagascar 535.0
Malaysia 401.2
Mali 561.0
Mozambique 535.5
Myanmar 380.7
Nepal 575.2
Nigeria 537.1
Pakistan 610.0
Paraguay 385.9
Peru 351.7
Philippines 399.5
Republic of Korea 678.2
Russian Federation 475.2
Senegal 569.9
Sierra Leone 535.1
Sri Lanka 591.1
Thailand 407.7
Turkey 694.5
Uganda 543.3
United Republic of Tanzania 537.4
United States of America 490.4
Uruguay 377.6
Venezuela (Bolivarian Republic of) 546.2
Vietnam 416.6

Non-continuous flooding and nutrient management.

Unit: US$/ha rice paddies/yr

Afghanistan -573.4
Argentina -354.8
Bangladesh -576.7
Benin -535.1
Bolivia (Plurinational State of) -354.1
Brazil -363.4
Burkina Faso -553.3
Cambodia -377.8
Cameroon -543.7
Chad -535.1
China -675.1
Colombia -397.7
Cote d'Ivoire -535.8
Democratic People's Republic of Korea -654.6
Democratic Republic of the Congo -535.6
Dominican Republic -428.4
Ecuador -390.3
Egypt -802.2
Ghana -535.5
Guinea -538.5
Guinea–Bissau -539.2
Guyana -382.0
India -607.9
Indonesia -382.3
Iran (Islamic Republic of) -726.7
Italy -567.9
Japan -636.0
Lao People's Democratic Republic -377.0
Liberia -535.3
Madagascar -535.0
Malaysia -401.2
Mali -561.0
Mozambique -535.5
Myanmar -380.7
Nepal -575.2
Nigeria -537.1
Pakistan -610.0
Paraguay -385.9
Peru -351.7
Philippines -399.5
Republic of Korea -678.2
Russian Federation -475.2
Senegal -569.9
Sierra Leone -535.1
Sri Lanka -591.1
Thailand -407.7
Turkey -694.5
Uganda -543.3
United Republic of Tanzania -537.4
United States of America -490.4
Uruguay -377.6
Venezuela (Bolivarian Republic of) -546.2
Vietnam -416.6

Non-continuous flooding and nutrient management.

Unit: US$/ha rice paddies/yr

Afghanistan -1,062
Argentina -640.5
Bangladesh -1,065
Benin -992.4
Bolivia (Plurinational State of) -639.8
Brazil -649.0
Burkina Faso -1,010
Cambodia -699.9
Cameroon -1,001
Chad -992.5
China -1,219
Colombia -683.4
Cote d'Ivoire -993.2
Democratic People's Republic of Korea -1,198
Democratic Republic of the Congo -992.9
Dominican Republic -714.1
Ecuador -676.0
Egypt -1,387
Ghana -992.8
Guinea -995.8
Guinea–Bissau -996.5
Guyana -667.7
India -1,096
Indonesia -704.5
Iran (Islamic Republic of) -1,312
Italy -1,053
Japan -1,179
Lao People's Democratic Republic -699.1
Liberia -992.6
Madagascar -992.4
Malaysia -723.3
Mali -1,018
Mozambique -992.8
Myanmar -702.8
Nepal -1,064
Nigeria -994.5
Pakistan -1,098
Paraguay -671.6
Peru -637.4
Philippines -721.6
Republic of Korea -1,221
Russian Federation -865.9
Senegal -1,027
Sierra Leone -992.4
Sri Lanka -1,080
Thailand -729.8
Turkey -1,279
Uganda -1,000
United Republic of Tanzania -994.7
United States of America -846.7
Uruguay -663.3
Venezuela (Bolivarian Republic of) -831.9
Vietnam -738.8

Non-continuous flooding and nutrient management.

Unit: US$/t CO₂‑eq  

Afghanistan -222.1
Argentina -80.82
Bangladesh -221.5
Benin -147.2
Bolivia (Plurinational State of) -81.49
Brazil -82.60
Burkina Faso -151.2
Cambodia -112.5
Cameroon -149.3
Chad -147.7
China -168.9
Colombia -87.77
Cote d'Ivoire -147.6
Democratic People's Republic of Korea -165.8
Democratic Republic of the Congo -147.9
Dominican Republic -92.82
Ecuador -86.99
Egypt -211.5
Ghana -146.9
Guinea -148.1
Guinea–Bissau -148.2
Guyana -85.72
India -232.1
Indonesia -111.5
Iran (Islamic Republic of) -137.8
Italy -110.0
Japan -162.2
Lao People's Democratic Republic -112.2
Liberia -147.6
Madagascar -147.9
Malaysia -116.6
Mali -152.2
Mozambique -147.7
Myanmar -112.4
Nepal -222.2
Nigeria -148.0
Pakistan -233.3
Paraguay -85.41
Peru -80.22
Philippines -116.1
Republic of Korea -169.7
Russian Federation -90.08
Senegal -154.0
Sierra Leone -147.5
Sri Lanka -226.3
Thailand -118.1
Turkey -132.3
Uganda -149.1
United Republic of Tanzania -147.3
United States of America -190.1
Uruguay -84.18
Venezuela (Bolivarian Republic of) -112.7
Vietnam -119.1

Non-continuous flooding and nutrient management.

Left Text Column Width

Cost per unit climate impact

The cost per t CO₂‑eq varies by country. Country-by-country results are shown in Table 3. The global weighted average is a savings of US$175.0/t CO₂‑eq (Table 4). Note that this is the same for both 100- and 20-yr results.

Table 4. Weighted average cost per unit climate impact.

Unit: US$/t CO₂‑eq

Weighted average -175.0
Left Text Column Width

Methods and Supporting Data

Learning Curve

Learning curve data are not available for improved rice cultivation.

Speed of Action

Speed of action refers to how quickly a climate solution physically affects the atmosphere after it is deployed. This is different from speed of deployment, which is the pace at which solutions are adopted.

At Project Drawdown, we define the speed of action for each climate solution as gradual, emergency brake, or delayed.

The noncontinuous flooding component of Improve Rice Production is an EMERGENCY BRAKE climate solution. It has a disproportionately fast impact after implementation because it reduces the short-lived climate pollutant methane. 

The nutrient management component is a GRADUAL climate solution. It has a steady, linear impact on the atmosphere. The cumulative effect over time builds as a straight line.

Caveats

Caveats like additionality and permanence do not apply to improve rice production as described here. If its carbon sequestration component were included, those caveats would apply.

Current Adoption

Noncontinuous Flooding

Rigorous, up-to-date country-level data about the extent of noncontinuous flooding in rice production are in short supply. We found five sources reporting adoption in seven major rice-producing countries. We used these to create regional averages and applied them to all countries that produce more than 100,000 ha of rice (paddy and upland). The total estimated current adoption is 48.65 Mha, or 47% of global rice paddy area (Table 5). This should be considered an extremely rough estimate. 

The available sources encompass different forms of noncontinuous flooding, including alternate wetting and drying (Philippines, Vietnam, Bangladesh), mid-season drainage (Japan), or both (China). 

Table 5. Current adoption level (2025).

Unit: Mha

Mean 48.65

Noncontinuous flooding, ha installed.

Left Text Column Width

Nutrient Management

We based nutrient management adoption on our analysis of the overapplication of nitrogen fertilizer on a national basis. Rather than calculate adoption in a parallel way to noncontinuous flooding, this approach provided a national average overapplication rate (the amount of nitrogen fertilizer which is applied that is not needed for crop growth and ends up as nitrous oxide emissions). We assume that every hectare of noncontinuous flooding is also using nutrient management. 

Adoption Trend

We assume the adoption of both noncontinuous flooding and nutrient management for each hectare.

Adoption trend information here takes the form of annual growth rate (%), with a median of 3.76% (Table 6). Adoption rate data are somewhat scarce. 

Table 6. Adoption trend.

Unit: %

25th percentile 3.00
Median (50th percentile) 3.76
75th percentile 4.25

Percent annual growth rate.

Left Text Column Width
Adoption Ceiling

There are barriers to adoption of these techniques and practices. Not all paddy rice is suitable for improved water management, and under certain conditions, undesirable yield reductions are possible (Bo et al., 2022). Other challenges include water access, coordinating water usage between multiple users, and ownership of water pumps (Nabuurs et al., 2022).

There are many challenges in estimating paddy rice land. Food and Agriculture Organization (FAO) statistics can overcount because land that produces more than one crop is double or triple counted. Satellite imagery is often blocked by clouds in the tropical humid areas where rice paddies are concentrated. 

A comprehensive effort to calculate total world rice paddy land reported 66.00 Mha of irrigated paddy and 63.00 Mha of rain-fed paddy (Salmon et al., 2015). Our own calculation of the combined paddy rice area of countries producing over 100,000 ha of rice found 104.1 Mha of paddy rice.

We summed high-resolution maps of paddy rice area appropriate for noncontinuous flooding (Bo et al., 2022) over maps of irrigated and rain-fed rice areas (Salmon et al., 2015) to determine a maximum adoption ceiling for each country. Several countries have already exceeded this threshold, and we included their higher adoption in our calculation. The sum of these, and therefore, the median adoption ceiling, is 77.53 Mha (Table 7).

Table 7. Adoption ceiling: upper limit for adoption level.

Unit: Mha

Median 77.53

Mha of improved rice production installed.

Left Text Column Width
Achievable Adoption

Table 8. Range of achievable adoption levels.

Unit: Mha

Current adoption 48.65
Achievable – low 49.56
Achievable – high 77.53
Adoption ceiling 77.53

Mha of improved rice production installed.

Left Text Column Width

Given that both China and Japan have already attained adoption rates above our adoption ceiling (Bo et al., 2022; Zhang et al., 2019), we selected for our adoption ceiling our Achievable – High adoption level, which is 77.53 Mha (Table 8).

In contrast, the countries with the lowest adoption rates had rates under 3%. In the absence of a modest adoption example, we chose to use current adoption plus 10% as our Achievable – Low adoption level. This provides an adoption of 49.56 Mha.

As described under Adoption Ceiling above, adoption of nutrient management is already weighted based on regional or national adoption and should not be overcounted in the achievable range calculations.

We calculated the potential impact of improved rice, on a 100-yr basis, at 0.10 Gt CO₂‑eq/yr from current adoption, and 0.10, 0.16, and 0.16 from Achievable – Low, Achievable – High, and Adoption Ceiling, respectively (Table 9). On a 20-yr basis, the totals are 0.29, 0.29, 0.46, and 0.46, respectively.

Table 9. Climate impact at different levels of adoption.

Unit: Gt CO₂‑eq/yr

Current adoption 0.10
Achievable – low 0.10
Achievable – high 0.16
Adoption ceiling 0.16

Unit: Gt CO₂‑eq/yr

Current adoption 0.29
Achievable – low 0.29
Achievable – high 0.46
Adoption ceiling 0.46
Left Text Column Width

The IPCC estimated a technical potential at 0.3 Gt CO₂‑eq/yr, with 0.2 Gt CO₂‑eq/yr as economically achievable at US$100/t CO₂ (100-yr basis; Nabuurs et al., 2022). Achieving the adoption ceiling of 76% of global flooded rice production could reduce rice paddy methane by 47% (Bo et al., 2022). Applying this percentage to the IPCC reported total paddy methane emissions of 0.49–0.73 Gt CO₂‑eq/yr yields a reduction of 0.23–0.34 Gt CO₂‑eq/yr (Nabuurs et al., 2022). Roe et al. (2021) calculated 0.19 Gt CO₂‑eq/yr. Note that these benchmarks only calculate methane from paddy rice, while we also addressed nitrous oxide from nutrient management.

Additional Benefits

The additional benefits of improved rice production arise from both practices (noncontinuous flooding and improved nutrient management) that form this solution. 

Health

Noncontinuous flooding can reduce the accumulation of arsenic in rice grains (Ishfaq et al., 2020). Arsenic is a carcinogen that is responsible for thousands of premature deaths in South and Southeast Asia (Jameel et al., 2021). The amount of arsenic reduced can vary by 0–90% depending upon the timing of the wetting and drying periods (Ishfaq et al., 2020).

Land Resources

Better nutrient management improves soil fertility and health, increasing resilience to extreme heat and droughts. Noncontinuous flooding also slows down the rate of soil salinization, protecting soil from degradation (Carrijo et al., 2017). 

Water Resources

Rice irrigation is responsible for 40% of all freshwater use in Asia, and rice requires two to three times more water per metric ton of grain than other cereals (Surendran et al., 2021). Field studies across South and Southeast Asia have shown that noncontinuous flooding can typically reduce irrigation requirements 20–30% compared to conventional flooded systems (Suwanmaneepong et al., 2023; Carrijo et al., 2017) without adversely affecting rice yield or grain quality. This reduction in water usage alleviates pressure on water resources in drought-prone areas (Alauddin et al., 2020).

Adoption of noncontinuous flooding up to the adoption ceiling of 76% would reduce rice irrigation needs by 25%. 

Water Quality

Both noncontinuous flooding and improved nutrient management reduce water pollution. Nitrogen utilization is generally poor using existing growing techniques, with two-thirds of the nitrogen fertilizer being lost through surface runoff and denitrification (Zhang et al., 2021). While noncontinuous flooding is primarily a water-efficiency and methane reduction technique, it can improve nitrogen use efficiency and reduce nitrogen runoff into water bodies (Liang et al., 2017; Liang et al., 2023). Improved nutrient management also reduces the excess fertilizers that could end up in local water bodies. Both mechanisms can mitigate eutrophication and harmful algal blooms, protect aquatic ecosystems, and ensure safer drinking water supplies (Bijay-Sing and Craswell, 2021). 

Risks

Not all paddies are suitable, with variables including soil type, irrigation infrastructure and ownership, community partitioning and scheduling of water resources, field size, and more (Nabuurs et al., 2022; Enriquez et al., 2021).

Many rice farmers in Asia do not directly control irrigation access, but instead use a municipal system, which is not always available when needed for noncontinuous flooding production. In addition, they may not actually experience cost savings, as pricing may be based on area rather than amount of water. An additional change is that multiple plots owned or rented by multiple farmers may be irrigated by a single irrigation gate, meaning that all must agree to an irrigation strategy. Generally speaking, pump-based irrigation areas see the best adoption, with poor adoption in gravity-based irrigation system areas. Improved irrigation infrastructure is necessary to increase adoption of noncontinuous flooding (Enriquez et al., 2021). 

Continuously flooded paddies have lower weed pressure than noncontinuous paddies, so noncontinuous flooding can raise labor costs or increase herbicide use. Not all rice varieties grow well in noncontinuous flooding (Li et al., 2024). In addition, it is difficult for farmers, especially smallholders, to monitor soil moisture level, which makes determining the timing of the next irrigation difficult (Livsey et al., 2019). 

Interactions with Other Solutions

We did not identify any aligned or competing interactions with other solutions.

Dashboard

Solution Basics

ha rice paddies

t CO₂-eq (100-yr)/unit/yr
2.03
units
Current 4.865×10⁷ 04.956×10⁷7.753×10⁷
Achievable (Low to High)

Climate Impact

Gt CO₂-eq (100-yr)/yr
Current 0.1 0.10.16
US$ per t CO₂-eq
-175
Emergency Brake

CH₄ , N₂O

Trade-offs

In some cases, rice yields are reduced (Nabuurs et al., 2022). However, this has been excluded from our calculations because we worked from the adoption ceiling of Bo et al. (2022), which explicitly addresses the question of maximum adoption without reducing yields.

Long-term impacts on soil health of water-saving irrigation strategies have not been widely studied, but a meta-analysis by Livsey et al. (2019) indicates a risk of decreases in soil carbon and fertility.

% of area
0100

Paddy rice area, 2020

Rice is the third most widely grown crop in terms of cultivated area and provides more calories directly to people than any other crop. It also is an important source of methane emissions. Here we show pixels in which at least 1% of the area is devoted to paddy (flooded) rice. Upland (unflooded) rice is included in the Improve Nutrient Management solution.

Cao, P., Bilotto, F., Gonzalez Fischer, C., Mueller, N. D., Carlson, K. M., Gerber, J.S., Smith, P., Tubiello, F. N., West, P. C., You, L., & Herrero, M. (2025). Mapping greenhouse gas emissions from global cropland circa 2020 [Data set, PREPRINT Version 1]. In review at Nature Climate Change. Link to source: https://doi.org/10.21203/rs.3.rs-6622054/v1 

Tang, F. H. M., Nguyen, T. H., Conchedda, G., Casse, L., Tubiello, F. N., & Maggi, F. (2024). CROPGRIDS: A global geo-referenced dataset of 173 crops [Data set]. Scientific Data, 11(1), 413. Link to source: https://doi.org/10.1038/s41597-024-03247-7

% of area
0100

Paddy rice area, 2020

Rice is the third most widely grown crop in terms of cultivated area and provides more calories directly to people than any other crop. It also is an important source of methane emissions. Here we show pixels in which at least 1% of the area is devoted to paddy (flooded) rice. Upland (unflooded) rice is included in the Improve Nutrient Management solution.

Cao, P., Bilotto, F., Gonzalez Fischer, C., Mueller, N. D., Carlson, K. M., Gerber, J.S., Smith, P., Tubiello, F. N., West, P. C., You, L., & Herrero, M. (2025). Mapping greenhouse gas emissions from global cropland circa 2020 [Data set, PREPRINT Version 1]. In review at Nature Climate Change. Link to source: https://doi.org/10.21203/rs.3.rs-6622054/v1 

Tang, F. H. M., Nguyen, T. H., Conchedda, G., Casse, L., Tubiello, F. N., & Maggi, F. (2024). CROPGRIDS: A global geo-referenced dataset of 173 crops [Data set]. Scientific Data, 11(1), 413. Link to source: https://doi.org/10.1038/s41597-024-03247-7

Maps Introduction

Improved rice production has its greatest potential in regions where there is substantial paddy rice production and adequate water availability to allow farmers to implement drain/flood cycles throughout the growing season (noncontinuous flooding). Rice production is dominated by Asia, so the greatest potential for solution uptake is there. Brazil and the United States rank 9th and 11th for rice production, and each has regions where this solution would have multiple benefits. Because improved rice production solution may not decrease yields, not all paddy rice-growing areas are suitable. There are regions of great potential throughout Southeast Asia, particularly in Vietnam and Thailand.

Other factors besides biophysical factors govern the suitability of noncontinuous flooding. For example, farmers are more likely to release water in their fields if they are confident that water will be available for subsequent irrigation, which often depends on community structures. 

There is very scarce information on adoption of noncontinuous flooding, although Bangladesh, China, Japan, and South Korea have relatively high uptake.

Action Word
Improve
Solution Title
Rice Production
Classification
Highly Recommended

Lawmakers and Policymakers

  • Set national targets for improving rice production and incorporate them into planning documents such as Nationally Determined Contributions.
  • If possible and appropriate, encourage rice farmers to adopt noncontinuous flooding.
  • Use policies and regulations to improve nutrient management by focusing on the four principles – right rate, right type of fertilizer, right time, and right place.
  • Invest in research and development to improve rice varieties to require less water, have shorter growth periods, produce higher yields, and tolerate more stress.
  • Invest in research and development to improve water monitoring technology and discover alternative fertilizers.
  • Improve the reliability of water irrigation systems.
  • Work with farmers and private organizations to improve data collection on advanced cultivation uptake and water management.
  • Join, create, or participate in partnerships or certification programs dedicated to improving rice cultivation.

Practitioners

  • Practice noncontinuous flooding.
  • Take advantage of financial incentives such as tax rebates and subsidies for improved rice cultivation.
  • Improve nutrient management by focusing on the four principles – right rate, right type of fertilizer, right time, and right place.
  • Plant improved rice varieties that require less water, have shorter growth periods, produce higher yields, and tolerate more stress.
  • Work with policymakers and private organizations to improve data collection on advanced cultivation uptake and water management.
  • Join, create, or participate in partnerships or certification programs dedicated to improving rice cultivation.

Business Leaders

  • Source food from farms that practice improved rice cultivation.
  • Invest in companies that utilize improved rice cultivation techniques or produce the necessary inputs.
  • Promote products that employ improved rice cultivation techniques and educate consumers about the importance of the practice.
  • Enter into offtake agreements for rice grown with improved techniques.
  • Invest in research and development to improve rice varieties to require less water, have shorter growth periods, produce higher yields, and tolerate more stress.
  • Invest in research and development to improve water monitoring technology and identify alternative fertilizers.
  • Work with farmers and private organizations to improve data collection on advanced cultivation uptake and water management.
  • Advocate to policymakers for improved rice cultivation techniques, incentives, and regulations.
  • Join, create, or participate in partnerships or certification programs dedicated to improving rice cultivation.

Nonprofit Leaders

  • Source food from farms that practice improved rice cultivation.
  • Start model farms to demonstrate techniques, conduct experiments, and educate local farmers.
  • Engage with businesses to encourage corporate responsibility and/or monitor rice production.
  • Help develop rice varieties to require less water, have shorter growth periods, produce higher yields, and tolerate more stress.
  • Help improve water monitoring technology and develop alternative fertilizers.
  • Work with farmers and other private organizations to improve data collection on advanced cultivation uptake and water management.
  • Advocate to policymakers for improved rice cultivation techniques, incentives, and regulations.
  • Join, create, or participate in partnerships or certification programs dedicated to improving rice cultivation.

Investors

  • Ensure portfolio companies and company procurement use improved rice cultivation techniques.
  • Offer financial services, including low-interest loans, micro-financing, and grants to support improving rice cultivation.
  • Invest in electronically-traded funds (ETFs); environmental, social and governance (ESG) funds; and green bonds issued by companies committed to improved rice cultivation.
  • Invest in companies developing technologies that support improved nutrient management, such as precision fertilizer applicators, alternative fertilizers, soil management equipment, and software.
  • Invest in start-ups that aim to improve rice varieties to require less water, have shorter growth periods, produce higher yields, and tolerate more stress.
  • Join, create, or participate in partnerships or certification programs dedicated to improving rice cultivation.

Philanthropists and International Aid Agencies

  • Work with agricultural supply chain sources to ensure partners employ improved rice production methods, if relevant.
  • Start model farms to demonstrate techniques, conduct experiments, and educate local farmers.
  • Offer financial services, including low-interest loans, micro-financing, and grants to support improving rice cultivation.
  • Engage with businesses to encourage corporate responsibility and/or monitor rice production.
  • Help develop rice varieties to require less water, have shorter growth periods, produce higher yields, and tolerate more stress.
  • Help improve water monitoring technology and identify alternative fertilizers.
  • Work with farmers and other private organizations to improve data collection on advanced cultivation uptake and water management.
  • Advocate to policymakers for improved rice cultivation techniques, incentives, and regulations.
  • Join, create, or participate in partnerships or certification programs dedicated to improving rice cultivation.

Thought Leaders

  • Source rice from farms that practice improved rice cultivation.
  • Start model farms to demonstrate techniques, conduct experiments, and educate local farmers.
  • Engage with businesses to encourage corporate responsibility and/or monitor rice production.
  • Help develop rice varieties to require less water, have shorter growth periods, produce higher yields, and tolerate more stress.
  • Help improve water monitoring technology and identify alternative fertilizers.
  • Work with farmers and other private organizations to improve data collection on advanced cultivation uptake and water management.
  • Advocate to policymakers for improved rice cultivation techniques, incentives, and regulations.
  • Join, create, or participate in partnerships or certification programs dedicated to improving rice cultivation.

Technologists and Researchers

  • Improve technology and cost-effectiveness of precision fertilizer application, slow-release fertilizer, alternative organic fertilizers, nutrient recycling, and monitoring equipment.
  • Create tracking and monitoring software to support farmers' decision-making.
  • Research the application of AI and robotics for precise fertilizer application and water management.
  • Improve data and analytics to monitor soil and water quality, assist farmers, support policymaking, and assess the impacts of policies.
  • Improve rice methane emissions modeling and monitoring using all available technologies such as satellites, low-flying instruments, and on-the-ground methods.
  • Develop education and training applications to promote improved rice cultivation techniques and provide real-time feedback.
  • Improve data collection on water management and advanced cultivation uptake.
  • Improve rice varieties to require less water, have shorter growth periods, produce higher yields, and tolerate more stress.

Communities, Households, and Individuals

  • Purchase rice from farms or suppliers that practice improved rice cultivation.
  • Engage with businesses to encourage corporate responsibility and/or monitor rice production.
  • Work with farmers and other private organizations to improve data collection on advanced cultivation uptake and water management.
  • Advocate to policymakers for improved rice cultivation techniques, incentives, and regulations.
  • Join, create, or participate in partnerships or certification programs dedicated to improving rice cultivation.
Evidence Base

There is high consensus on the effectiveness and potential of noncontinuous flooding and nutrient management (Jiang et al., 2019; Zhang et al., 2023; Nabuurs et al., 2022; Qian et al., 2023). 

Hergoualc’h et al. (2019) describe methane reduction and associated nitrous oxide increase from noncontinuous flooding in detail. Bo et al. (2022) calculate that 76% of global rice paddy area is suitable to switch to noncontinuous flooding without reducing yields. Carlson et al. (2016) provide emissions intensities for croplands, including rice production. Ludemann et al. (2024) provide country-by-country and crop-by-crop fertilizer use data. Qian et al. (2023) review methane emissions production and reduction potential.

The results presented in this document summarize findings from 12 reviews and meta-analyses and 26 original studies reflecting current evidence from countries across the Asian rice production region. We recognize this limited geographic scope creates bias, and hope this work inspires research and data sharing on this topic in underrepresented regions.

Appendix

In this analysis, we calculated the potential for reducing crop nitrogen inputs and associated nitrous oxide emissions by integrating spatially explicit, crop-specific data on nitrogen inputs, crop yields, attainable yields, irrigated extent, and climate. Broadly, we calculated a “target” yield-scaled nitrogen input rate based on pixels with low yield gaps and calculated the difference between nitrous oxide emissions under the current rate and under the hypothetical target emissions rate, using nitrous oxide emissions factors disaggregated by fertilizer type and climate. 

Emissions Factors

We used Tier 1 emissions factors from the IPCC 2019 Refinement to the 2006 Guidelines for National Greenhouse Gas Inventories, including direct emissions factors as well as indirect emissions from volatilization and leaching pathways. Direct emissions factors represent the proportion of applied nitrogen emitted as nitrous oxide, while we calculated volatilization and leaching emissions factors by multiplying the proportion of applied nitrogen lost through these pathways by the proportion of volatilized or leached nitrogen ultimately emitted as nitrous oxide. Including both direct and indirect emissions, organic and synthetic fertilizers emit 4.97 kg CO₂‑eq/kg nitrogen and 8.66 kg CO₂‑eq/kg nitrogen, respectively, in wet climates, and 2.59 kg CO₂‑eq/kg nitrogen and 2.38 kg CO₂‑eq/kg nitrogen in dry climates. We included uncertainty bounds (2.5th and 97.5th percentiles) for all emissions factors. 

We classified each pixel as “wet” or “dry” using an aridity index (AI) threshold of 0.65, calculated as the ratio of annual precipitation to potential evapotranspiration (PET) from TerraClimate data (1991–2020), based on a threshold of 0.65. For pixels in dry climates that contained irrigation, we took the weighted average of wet and dry emissions factors based on the fraction of cropland that was irrigated (Mehta et al., 2024). We excluded irrigated rice from this analysis due to large differences in nitrous oxide dynamics in flooded rice systems.

Current, Target, and Avoidable Nitrogen Inputs and Emissions

Using highly disaggregated data on nitrogen inputs from Adalibieke et al. (2024) for 21 crop groups, we calculated total crop-specific inputs of synthetic and organic nitrogen. We then averaged over 2016–2020 to reduce the influence of interannual variability in factors like fertilizer prices. These values are subsequently referred to as “current” nitrogen inputs. We calculated nitrous oxide emissions under current nitrogen inputs as the sum of the products of nitrogen inputs and the climatically relevant emissions factors for each fertilizer type.

Next, we calculated target nitrogen application rates in terms of kg nitrogen per ton of crop yield using data on actual and attainable yields for 17 crops from Gerber et al., 2024. For each crop, we first identified pixels in which the ratio of actual to attainable yields was above the 80th percentile globally. The target nitrogen application rate was then calculated as the 20th percentile of nitrogen application rates across low-yield-gap pixels. Finally, we calculated total target nitrogen inputs as the product of actual yields and target nitrogen input rates. We calculated hypothetical nitrous oxide emissions from target nitrogen inputs as the product of nitrogen inputs and the climatically relevant emissions factor for each fertilizer type.

The difference between current and target nitrogen inputs represents the amount by which nitrogen inputs could hypothetically be reduced without compromising crop productivity (i.e., “avoidable” nitrogen inputs). We calculated avoidable nitrous oxide emissions as the difference between nitrous oxide emissions with current nitrogen inputs and those with target nitrogen inputs. For crops for which no yield or attainable yield data were available, we applied the average percent reduction in nitrogen inputs under the target scenario from available crops to the nitrogen input data for missing crops to calculate the avoidable nitrogen inputs and emissions. 

This simple and empirically driven method aimed to identify realistically low but nutritionally adequate nitrogen application rates by including only pixels with low yield gaps, which are unlikely to be substantially nutrient-constrained. We did not control for other factors affecting nitrogen availability, such as historical nutrient application rates or depletion, rotation with nitrogen fixing crops, or tillage and residue retention practices.

Updated Date
Coming Soon Label
Coming Soon

Protect Coastal Wetlands

Image
Image
Birds flying over wetland
Coming Soon
Off
Summary

Coastal wetland protection is the long-term protection of mangrove, salt marsh, and seagrass ecosystems from degradation by human activities. This solution focuses on legal mechanisms of coastal wetland protection, including the establishment of Protected Areas (PAs) and Marine Protected Areas (MPAs), which are managed with the primary goal of conserving nature. These legal protections reduce a range of human impacts, helping to preserve existing carbon stocks and avoid CO₂ emissions.

Description for Social and Search
Protect Coastal Wetlands is a Highly Recommended climate solution. Legal protection helps these ecosystems store carbon and avoids GHG emissions.
Overview

Coastal wetlands (defined as mangrove, salt marsh, and seagrass ecosystems, see Figure 1) are highly productive ecosystems that sequester carbon via photosynthesis, storing it primarily below ground in sediments where waterlogged, low-oxygen conditions help preserve it (Adame et al., 2024; Lovelock et al., 2017). 

Figure 1. Types of coastal wetlands, from left to right: a salt marsh in Westhampton Beach (United States), a mangrove forest near Staniel Cay (Bahamas), and a seagrass meadow off Notojima Island (Japan).

Image
Types of wetlands

Adobe Stock | istock; Maria T Hoffman | Adobe Stock; James White and Danita Delimont | AdobeStock

These ecosystems are also efficient at trapping carbon suspended in water, which can comprise up to 50% of the carbon sequestered in these settings (McLeod et al., 2011; Temmink et al., 2022). Coastal wetlands operate as large carbon sinks (Figure 2), with long-term carbon accumulation rates averaging 5.1–8.3 t CO₂‑eq /ha/yr (McLeod et al., 2011).

Figure 2. Overview of carbon storage in coastal wetlands. Salt marshes, mangroves, and seagrasses, commonly referred to as blue carbon ecosystems, store carbon in plant biomass and sediment.

Image
Diagram demonstr ating CO2 absorption in salt marsh, mangroves, and seagrass.

Source: Macreadie, P. I., Costa, M. D., Atwood, T. B., Friess, D. A., Kelleway, J. J., Kennedy, H., ... & Duarte, C. M. (2021). Blue carbon as a natural climate solution. Nature Reviews Earth & Environment, 2(12), 826-839. Link to source: https://doi.org/10.1038/s43017-021-00224-1

Protection of coastal wetlands preserves carbon stocks and avoids emissions associated with degradation, which can increase CO₂, methane, and nitrous oxide effluxes. Nearly 50% of the total global area of coastal wetlands has been lost since 1900 and up to 87% since the 18th century (Davidson, 2014). With current loss rates, an additional 30–40% of remaining seagrasses and salt marshes, and nearly all mangroves, could be lost by 2100 without protection (Pendleton et al., 2012). Protection of existing coastal wetlands is especially important because restoration is challenging, costly, and not yet fully optimized. For example, seagrass restoration has generally been unsuccessful (Macreadie et al., 2021), and restored seagrass systems can have higher GHG fluxes than natural systems (Mason et al., 2023).

On land, degradation often arises from aquaculture, reclamation and drainage, deforestation, diking, and urbanization (Mcleod et al., 2011). In the ocean, impacts often occur due to dredging, mooring, pollution, and sediment disturbance (Mcleod et al., 2011). For instance, deforestation of mangroves for agriculture removes biomass and oxidizes sediment carbon stocks, leading to high CO₂ effluxes and, potentially, methane and nitrous oxide emissions (Chauhan et al., 2017, Kauffman et al., 2016, Sasmito et al., 2019). Likewise, high CO₂ or methane effluxes from salt marshes commonly result from drainage, which can oxygenate the subsurface and fuel carbon loss, or from infrastructure such as dikes, which can reduce saltwater exchange and increase methane production (Kroeger et al., 2017). In another example, dredging in seagrass meadows drives high rates of ecosystem degradation due to reduced light availability, leading to die-offs that can increase erosion and reduce sediment carbon stocks by 21–47% (Trevathan-Tackett et al., 2018).

Our analysis focused on the avoided CO₂ emissions and retained carbon sequestration capacity conferred by avoiding degradation of coastal wetlands via legal protection. While degradation can substantially alter emissions of other GHGs, such as methane and nitrous oxide, we focus on CO₂ due to the limited availability of global spatial data on degradation types and extent and associated effluxes of all GHGs across coastal wetlands. Ignoring methane and nitrous oxide benefits with protection is the most conservative approach because limited data exist on emission profiles from both functional and degraded global coastal wetlands, and even PAs/MPAs can be degraded (Holmquist et al., 2023). This solution considered wetlands to be protected if they are formally designated as PAs or MPAs under International Union for Conservation of Nature (IUCN) protection categories I–IV (UNEP-WCMC &IUCN, 2024; see Appendix for more information).

References

Adame, M. F., Kelleway, J., Krauss, K. W., Lovelock, C. E., Adams, J. B., Trevathan-Tackett, S. M., Noe, G., Jeffrey, L., Ronan, M., Zann, M., Carnell, P. E., Iram, N., Maher, D. T., Murdiyarso, D., Sasmito, S., Tran, D. B., Dargusch, P., Kauffman, J. B., & Brophy, L. (2024). All tidal wetlands are blue carbon ecosystems. BioScience, 74(4), 253–268. Link to source: https://doi.org/10.1093/biosci/biae007

Balmford, A., Gravestock, P., Hockley, N., McClean, C. J., & Roberts, C. M. (2004). The worldwide costs of marine protected areas. Proceedings of the National Academy of Sciences, 101(26), 9694–9697. Link to source: https://doi.org/10.1073/pnas.0403239101

Baniewicz, T. (2020, September 2). Coastal Louisiana tribes team up with biologist to protect sacred sites from rising seas. Southerly. Link to source: https://southerlymag.org/2020/09/02/coastal-louisiana-tribes-team-up-with-biologist-to-protect-sacred-sites-from-rising-seas/

Barbier, E. B., Georgiou, I. Y., Enchelmeyer, B., & Reed, D. J. (2013). The value of wetlands in protecting southeast Louisiana from hurricane storm surges. PLoS ONE, 8(3), Article e58715. Link to source: https://doi.org/10.1371/journal.pone.0058715

Blanchard, L., Haya, B. K., Anderson, C., Badgley, G., Cullenward, D., Gao, P., Goulden, M. L., Holm, J. A., Novick, K. A., Trugman, A. T., Wang, J. A., Williams, C. A., Wu, C., Yang, L., & Anderegg, W. R. L. (2024). Funding forests’ climate potential without carbon offsets. One Earth, 7(7), 1147–1150. Link to source: https://doi.org/10.1016/j.oneear.2024.06.006

Borchert, S. M., Osland, M. J., Enwright, N. M., & Griffith, K. T. (2018). Coastal wetland adaptation to sea level rise: Quantifying potential for landward migration and coastal squeeze. Journal of Applied Ecology, 55(6), 2876–2887. Link to source: https://doi.org/10.1111/1365-2664.13169

Bruner, A. G., Gullison, R. E., & Balmford, A. (2004). Financial costs and shortfalls of managing and expanding protected-area systems in developing countries. BioScience, 54(12), 1119–1126. Link to source: https://doi.org/10.1641/0006-3568(2004)054[1119:FCASOM]2.0.CO;2

Chauhan, R., Datta, A., Ramanathan, A. L., & Adhya, T. K. (2017). Whether conversion of mangrove forest to rice cropland is environmentally and economically viable? Agriculture, Ecosystems & Environment, 246, 38–47. Link to source: https://doi.org/10.1016/j.agee.2017.05.010

Cullen-Unsworth, L. C., & Unsworth, R. (2018). A call for seagrass protection. Science, 361(6401), 446–448. Link to source: https://doi.org/10.1126/science.aat7318

Department of Climate Change, Energy, the Environment and Water. (2016). Wetlands and Indigenous values [Fact sheet]. Commonwealth of Australia. Link to source: https://www.dcceew.gov.au/sites/default/files/documents/factsheet-wetlands-indigenous-values.pdf

Dabalà, A., Dahdouh-Guebas, F., Dunn, D. C., Everett, J. D., Lovelock, C. E., Hanson, J. O., Buenafe, K. C. V., Neubert, S., & Richardson, A. J. (2023). Priority areas to protect mangroves and maximise ecosystem services. Nature Communications, 14(1), Article 5863. Link to source: https://doi.org/10.1038/s41467-023-41333-3

Davidson, N. C. (2014). How much wetland has the world lost? Long-term and recent trends in global wetland area. Marine and Freshwater Research, 65(10), 934–941. Link to source: https://doi.org/10.1071/MF14173

Di Minin, E., & Toivonen, T. (2015). Global protected area expansion: Creating more than paper parks. BioScience, 65(7), 637–638. Link to source: https://doi.org/10.1093/biosci/biv064

Dinerstein, E., Joshi, A. R., Hahn, N. R., Lee, A. T. L., Vynne, C., Burkart, K., Asner, G. P., Beckham, C., Ceballos, G., Cuthbert, R., Dirzo, R., Fankem, O., Hertel, S., Li, B. V., Mellin, H., Pharand‑Deschênes, F., Olson, D., Pandav, B., Peres, C. A., … Zolli, A. (2024). Conservation Imperatives: Securing the last unprotected terrestrial sites harboring irreplaceable biodiversity. Frontiers in Science, 2, Article 1349350. Link to source: https://doi.org/10.3389/fsci.2024.1349350

Donato, D. C., Kauffman, J. B., Murdiyarso, D., Kurnianto, S., Stidham, M., & Kanninen, M. (2011). Mangroves among the most carbon-rich forests in the tropics. Nature Geoscience, 4(5), 293–297. Link to source: https://doi.org/10.1038/ngeo1123

Eyre, B. D., Camillini, N., Glud, R. N., & Rosentreter, J. A. (2023). The climate benefit of seagrass blue carbon is reduced by methane fluxes and enhanced by nitrous oxide fluxes. Communications Earth & Environment, 4(1), Article 374. Link to source: https://doi.org/10.1038/s43247-023-01022-x

Feng, Y., Song, Y., Zhu, M., Li, M., Gong, C., Luo, S., Mei, W., Feng, H., Tan, W., & Song, C. (2025). Microbes drive more carbon dioxide and nitrous oxide emissions from wetland under long-term nitrogen enrichment. Water Research, 272, Article 122942. Link to source: https://doi.org/10.1016/j.watres.2024.122942

Fletcher, M.-S., Hamilton, R., Dressler, W., & Palmer, L. (2021). Indigenous knowledge and the shackles of wilderness. Proceedings of the National Academy of Sciences, 118(40), Article e2022218118. Link to source: https://doi.org/10.1073/pnas.2022218118

Garnett, S. T., Burgess, N. D., Fa, J. E., Fernández-Llamazares, Á., Molnár, Z., Robinson, C. J., Watson, J. E. M., Zander, K. K., Austin, B., Brondizio, E. S., Collier, N. F., Duncan, T., Ellis, E., Geyle, H., Jackson, M. V., Jonas, H., Malmer, P., McGowan, B., Sivongxay, A., & Leiper, I. (2018). A spatial overview of the global importance of Indigenous lands for conservation. Nature Sustainability, 1(7), 369–374. Link to source: https://doi.org/10.1038/s41893-018-0100-6

Giakoumi, S., McGowan, J., Mills, M., Beger, M., Bustamante, R. H., Charles, A., Christie, P., Fox, M., Garcia‑Borboroglu, P., Gelcich, S., Guidetti, P., Mackelworth, P., Maina, J. M., McCook, L., Micheli, F., Morgan, L. E., Mumby, P. J., Reyes, L. M., White, A., … Possingham, H. P. (2018). Revisiting “success” and “failure” of marine protected areas: A conservation scientist perspective. Frontiers in Marine Science, 5, Article 223. Link to source: https://doi.org/10.3389/fmars.2018.00223

Guannel, G., Arkema, K., Ruggiero, P., & Verutes, G. (2016). The power of three: Coral reefs, seagrasses and mangroves protect coastal regions and increase their resilience. PLoS ONE, 11(7), Article e0158094. Link to source: https://doi.org/10.1371/journal.pone.0158094

Green, E. P., & Short, F. T. (Eds.). (2003). World Atlas of Seagrasses. University of California Press. Link to source: https://environmentalunit.com/Documentation/04%20Resources%20at%20Risk/World%20Seagrass%20atlas.pdf

Heck, N., Goldberg, L., Andradi‐Brown, D. A., Campbell, A., Narayan, S., Ahmadia, G. N., & Lagomasino, D. (2024). Global drivers of mangrove loss in protected areas. Conservation Biology, 38(6), Article e14293. Link to source: https://doi.org/10.1111/cobi.14293

Hochard, J. P., Barbier, E. B., & Hamilton, S. E. (2021). Mangroves and coastal topography create economic “safe havens” from tropical storms. Scientific Reports, 11(1), Article 15359. Link to source: https://doi.org/10.1038/s41598-021-94207-3

Holmquist, J. R., Eagle, M., Molinari, R. L., Nick, S. K., Stachowicz, L. C., & Kroeger, K. D. (2023). Mapping methane reduction potential of tidal wetland restoration in the United States. Communications Earth & Environment, 4(1), Article 353. Link to source: https://doi.org/10.1038/s43247-023-00988-y

Hutchinson, M. (2022, September 2). How coastal erosion is affecting the sacred lands of Indigenous Louisianians. Chênière: The Nicholls Undergraduate Humanities Review. Link to source: https://www.nicholls.edu/cheniere/2022/09/02/how-coastal-erosion-is-affecting-the-sacred-lands-of-indigenous-louisianians

Ickowitz, A., Lo, M. G. Y., Nurhasan, M., Maulana, A. M., & Brown, B. M. (2023). Quantifying the contribution of mangroves to local fish consumption in Indonesia: A cross-sectional spatial analysis. The Lancet Planetary Health, 7(10), e819–e830. Link to source: https://doi.org/10.1016/S2542-5196(23)00196-1

Jensen, K. (2022, July 6). Climate benefits of coastal wetlands and coral reefs show why they merit protection now. The Pew Charitable Trusts. Link to source: https://www.pewtrusts.org/en/research-and-analysis/articles/2022/07/06/climate-benefits-of-coastal-wetlands-and-coral-reefs-show-why-they-merit-protection-now

Kroeger, K. D., Crooks, S., Moseman-Valtierra, S., & Tang, J. (2017). Restoring tides to reduce methane emissions in impounded wetlands: A new and potent Blue Carbon climate change intervention. Scientific Reports, 7(1), Article 11914. Link to source: https://doi.org/10.1038/s41598-017-12138-4

Lamb, J. B., Van De Water, J. A., Bourne, D. G., Altier, C., Hein, M. Y., Fiorenza, E. A., Abu, N., Jompa, J., & Harvell, C. D. (2017). Seagrass ecosystems reduce exposure to bacterial pathogens of humans, fishes, and invertebrates. Science, 355(6326), 731–733. Link to source: https://doi.org/10.1126/science.aal1956

Leal, M., & Spalding, M. D. (Eds.). (2022, September 21). The state of the world’s mangroves 2022. Global Mangrove Alliance. Link to source: https://www.wetlands.org/publication/the-state-of-the-worlds-mangroves-2022/

Leal, M., & Spalding, M. D. (Eds.). (2024). The state of the world’s mangroves 2024. Global Mangrove Alliance. Link to source: https://www.mangrovealliance.org/mangrove-forests/

Leverington, F., Costa, K. L., Pavese, H., Lisle, A., & Hockings, M. (2010). A global analysis of protected area management effectiveness. Environmental Management, 46(5), 685–698. Link to source: https://doi.org/10.1007/s00267-010-9564-5

Lovelock, C. E., Fourqurean, J. W., & Morris, J. T. (2017). Modeled CO2 emissions from coastal wetland transitions to other land uses: Tidal marshes, mangrove forests, and seagrass beds. Frontiers in Marine Science, 4, Article 143. Link to source: https://doi.org/10.3389/fmars.2017.00143

Lu, C., Wang, Z., Li, L., Wu, P., Mao, D., Jia, M., & Dong, Z. (2016). Assessing the conservation effectiveness of wetland protected areas in Northeast China. Wetlands Ecology and Management, 24(4), 381–398. Link to source: https://doi.org/10.1007/s11273-015-9462-y

Macreadie, P. I., Costa, M. D., Atwood, T. B., Friess, D. A., Kelleway, J. J., Kennedy, H., Lovelock, C. E., Serrano, O., & Duarte, C. M. (2021). Blue carbon as a natural climate solution. Nature Reviews Earth & Environment, 2(12), 826–839. Link to source: https://doi.org/10.1038/s43017-021-00224-1

Macreadie, P. I., Robertson, A. I., Spinks, B., Adams, M. P., Atchison, J. M., Bell‑James, J., Bryan, B. A., Chu, L., Filbee‑Dexter, K., Drake, L., Duarte, C. M., Friess, D. A., Gonzalez, F., Grafton, R. Q., Helmstedt, K. J., Kaebernick, M., Kelleway, J., Kendrick, G. A., Kennedy, H., … Rogers, K. (2022). Operationalizing marketable blue carbon. One Earth, 5(5), 485–492. Link to source: https://doi.org/10.1016/j.oneear.2022.04.005

Mason, V. G., Burden, A., Epstein, G., Jupe, L. L., Wood, K. A., & Skov, M. W. (2023). Blue carbon benefits from global saltmarsh restoration. Global Change Biology, 29(23), 6517–6545. Link to source: https://doi.org/10.1111/gcb.16943

Mathews, D. L., & Turner, N. J. (2017). Ocean cultures: Northwest Coast ecosystems and Indigenous management systems. In P. S. Levin & M. R. Poe (Eds.), Conservation for the Anthropocene ocean: Interdisciplinary science in support of nature and people (pp.169–206). Academic Press. Link to source: https://doi.org/10.1016/B978-0-12-805375-1.00009-X

McCrea-Strub, A., Zeller, D., Sumaila, U. R., Nelson, J., Balmford, A., & Pauly, D. (2011). Understanding the cost of establishing marine protected areas. Marine Policy, 35(1), 1–9. Link to source: https://doi.org/10.1016/j.marpol.2010.07.001

Mcleod, E., Chmura, G. L., Bouillon, S., Salm, R., Björk, M., Duarte, C. M., Lovelock, C. E., Schlesinger, W. H., & Silliman, B. R. (2011). A blueprint for blue carbon: Toward an improved understanding of the role of vegetated coastal habitats in sequestering CO2. Frontiers in Ecology and the Environment, 9(10), 552–560. Link to source: https://doi.org/10.1890/110004

McIvor, A. L., Spencer, T., Möller, I., & Spalding, M. (2012). Storm surge reduction by mangroves (Natural Coastal Protection Series: Report No. 2). The Nature Conservancy and Wetlands International. Link to source: https://www.nacionmulticultural.unam.mx/mezinal/docs/3151.pdf

McNally, C. G., Uchida, E. and Gold, A. J. (2011). The effect of a protected area on the tradeoffs between short-run and long-run benefits from mangrove ecosystems. Proceedings of the National Academy of Sciences, 108(34), 13945–13950. Link to source: https://doi.org/10.1073/pnas.1101825108

Menéndez, P., Losada, I. J., Torres-Ortega, S., Narayan, S., & Beck, M. W. (2020). The Global Flood Protection Benefits of Mangroves. Scientific Reports, 10(1), 4404. Link to source: https://doi.org/10.1038/s41598-020-61136-6 

Noyce, G. L., Smith, A. J., Kirwan, M. L., Rich, R. L., & Megonigal, J. P. (2023). Oxygen priming induced by elevated CO2 reduces carbon accumulation and methane emissions in coastal wetlands. Nature Geoscience, 16(1), 63–68. Link to source: https://doi.org/10.1038/s41561-022-01070-6

Mcowen, C. J., Weatherdon, L. V., Van Bochove, J.-W., Sullivan, E., Blyth, S., Zockler, C., Stanwell-Smith, D., Kingston, N., Martin, C. S., Spalding, M., & Fletcher, S. (2017). A global map of saltmarshes. Biodiversity Data Journal, 5, Article e11764. Link to source: https://doi.org/10.3897/BDJ.5.e11764

Narayan, S., Beck, M. W., Wilson, P., Thomas, C. J., Guerrero, A., Shepard, C. C., Reguero, B. G., Franco, G., Ingram, J. C., & Trespalacios, D. (2017). The value of coastal wetlands for flood damage reduction in the Northeastern USA. Scientific Reports, 7(1), Article 9463. Link to source: https://doi.org/10.1038/s41598-017-09269-z

Pendleton, L., Donato, D. C., Murray, B. C., Crooks, S., Jenkins, W. A., Sifleet, S., Craft, C., Fourqurean, J. W., Kauffman, J. B., Marbà, N., Megonigal, J. P., Pidgeon, E., Herr, D., Gordon, D., & Baldera, A. (2012). Estimating global “blue carbon” emissions from conversion and degradation of vegetated coastal ecosystems. PLoS ONE, 7(9), Article e43542. Link to source: https://doi.org/10.1371/journal.pone.0043542

Renwick, A. R., Bode, M., & Venter, O. (2015). Reserves in context: Planning for leakage from protected areas. PLoS ONE, 10(6), Article e0129441. Link to source: https://doi.org/10.1371/journal.pone.0129441

Roberts, C. M., O'Leary, B. C., & Hawkins, J. P. (2020). Climate change mitigation and nature conservation both require higher protected area targets. Philosophical Transactions of the Royal Society B, 375(1794), Article 20190121. Link to source: https://doi.org/10.1098/rstb.2019.0121

Rodríguez-Rodríguez, D., & Martínez-Vega, J. (2022). Ecological effectiveness of marine protected areas across the globe in the scientific literature. In C. Sheppard (Ed.), Advances in marine biology (Vol. 92, pp. 129–153). Elsevier. Link to source: https://doi.org/10.1016/bs.amb.2022.07.002

Rosentreter, J. A., Maher, D. T., Erler, D. V., Murray, R. H., & Eyre, B. D. (2018). Methane emissions partially offset “blue carbon” burial in mangroves. Science Advances, 4(6), Article eaao4985. Link to source: https://doi.org/10.1126/sciadv.aao4985

Sasmito, S. D., Taillardat, P., Clendenning, J. N., Cameron, C., Friess, D. A., Murdiyarso, D., & Hutley, L. B. (2019). Effect of land‐use and land‐cover change on mangrove blue carbon: A systematic review. Global Change Biology, 25(12), 4291–4302. Link to source: https://doi.org/10.1111/gcb.14774

Schuerch, M., Spencer, T., Temmerman, S., Kirwan, M. L., Wolff, C., Lincke, D., McOwen, C. J., Pickering, M. D., Reef, R., Vafeidis, A. T., Hinkel, J., Nicholls, R. J., & Brown, S. (2018). Future response of global coastal wetlands to sea-level rise. Nature, 561(7722), 231–234. Link to source: https://doi.org/10.1038/s41586-018-0476-5

Sheng, P., Y., Paramygin, V. A., Rivera-Nieves, A. A., Zou, R., Fernald, S., Hall, T., & Jacob, K. (2022). Coastal marshes provide valuable protection for coastal communities from storm-induced wave, flood, and structural loss in a changing climate. Scientific Reports, 12(1), Article 3051. Link to source: https://doi.org/10.1038/s41598-022-06850-z

Temmink, R. J. M., Lamers, L. P. M., Angelini, C., Bouma, T. J., Fritz, C., van de Koppel, J., Lexmond, R., Rietkerk, M., Silliman, B. R., Joosten, H., & van der Heide, T. (2022). Recovering wetland biogeomorphic feedbacks to restore the world’s biotic carbon hotspots. Science, 376(6593), Article eabn1479. Link to source: https://doi.org/10.1126/science.abn1479

Thampanya, U., Vermaat, J. E., Sinsakul, S., & Panapitukkul, N. (2006). Coastal erosion and mangrove progradation of Southern Thailand. Estuarine, Coastal and Shelf Science, 68(1–2), 75–85. Link to source: https://doi.org/10.1016/j.ecss.2006.01.011

Trevathan‐Tackett, S. M., Wessel, C., Cebrián, J., Ralph, P. J., Masqué, P., & Macreadie, P. I. (2018). Effects of small‐scale, shading‐induced seagrass loss on blue carbon storage: Implications for management of degraded seagrass ecosystems. Journal of Applied Ecology, 55(3), 1351–1359. Link to source: https://doi.org/10.1111/1365-2664.13081

Unsworth, R. K. F., Cullen-Unsworth, L. C., Jones, B. L. H., & Lilley, R. J. (2022). The planetary role of seagrass conservation. Science, 377(6606), 609–613. Link to source: https://doi.org/10.1126/science.abq6923

UNEP-WCMC, & IUCN. (2024). Protected planet: The world database on protected areas (WDPA) and world database on other effective area-based conservation measures (WD-OECM) [Data set]. Retrieved November 2024, from Link to source: https://www.protectedplanet.net

United Nations Environment Programme. (2014). The importance of mangroves to people: A call to action (J. van Bochove, E. Sullivan, & T. Nakamura, Eds.). United Nations Environment Programme World Conservation Monitoring Centre. Link to source: https://www.unep.org/resources/report/importance-mangroves-people-call-action

United Nations Environment Programme. (2020). Out of the blue: The value of seagrasses to the environment and to people. Link to source: https://www.unep.org/resources/report/out-blue-value-seagrasses-environment-and-people

U.S. Environmental Protection Agency. (2025a). Why are wetlands important? Link to source: https://www.epa.gov/wetlands/why-are-wetlands-important

U.S. Environmental Protection Agency. (2025b). About coastal wetlands. Link to source: https://www.epa.gov/wetlands/about-coastal-wetlands

Waldron, A., Adams, V., Allan, J., Arnell, A., Asner, G., Atkinson, S., Baccini, A., Baillie, J. E. M., Balmford, A., Beau, J. A., Brander, L., Brondizio, E., Bruner, A., Burgess, N., Burkart, K., Butchart, S., Button, R., Carrasco, R., Cheung, W., … Zhang, Y. P. (2020). Protecting 30% of the planet for nature: Costs, benefits and economic implications [Working paper]. Campaign for Nature. Link to source: https://pure.iiasa.ac.at/id/eprint/16560/1/Waldron_Report_FINAL_sml.pdf

Wang, F., Sanders, C. J., Santos, I. R., Tang, J., Schuerch, M., Kirwan, M. L., Kopp, R. E., Zhu, K., Li, X., Yuan, J., Liu, W., & Li, Z. (2021). Global blue carbon accumulation in tidal wetlands increases with climate change. National Science Review, 8(9), Article nwaa296. Link to source: https://doi.org/10.1093/nsr/nwaa296

West, T. A. P., Wunder, S., Sills, E. O., Börner, J., Rifai, S. W., Neidermeier, A. N., Frey, G. P., & Kontoleon, A. (2023). Action needed to make carbon offsets from forest conservation work for climate change mitigation. Science, 381(6660), 873–877. Link to source: https://doi.org/10.1126/science.ade3535

Worthington, T. A., Spalding, M., Landis, E., Maxwell, T. L., Navarro, A., Smart, L. S., & Murray, N. J. (2024). The distribution of global tidal marshes from Earth observation data. Global Ecology and Biogeography, 33(8), Article e13852. Link to source: https://doi.org/10.1111/geb.13852

Credits

Lead Fellow

  • Christina Richardson, Ph.D.

Contributors

  • Ruthie Burrows, Ph.D.

  • Avery Driscoll

  • James Gerber, Ph.D.

  • Daniel Jasper

  • Christina Swanson, Ph.D.

  • Alex Sweeney

  • Paul West, Ph.D.

Internal Reviewers

  • Aiyana Bodi

  • Avery Driscoll

  • James Gerber, Ph.D.

  • Hannah Henkin

  • Ted Otte

  • Christina Swanson, Ph.D.

Effectiveness

We estimated that coastal wetland protection avoids emissions of 2.33–5.74 t CO₂‑eq /ha/yr, while also sequestering an additional 1.22–2.14 t CO₂‑eq /ha/yr depending on the ecosystem (Tables 1a–c; see the Appendix for more information). We estimated effectiveness as the avoided CO₂ emissions and the retained carbon sequestration capacity attributable to the reduction in wetland loss conferred by protection, as detailed in Equation 1. First, we calculated the difference between the rate of wetland loss outside PAs and MPAs (Wetland lossbaseline) versus inside PAs and MPAs, since protection does not entirely prevent degradation. Loss rates were primarily driven by anthropogenic habitat conversion. The effectiveness of protection was 53–59% (Reduction in loss). We then multiplied the avoided wetland loss by the sum of the avoided CO₂ emissions associated with the loss of carbon stored in sediment and biomass in one ha of wetland each year over a 30-yr timeframe (Carbonavoided emissions) and the amount of carbon sequestered via long-term storage in sediment carbon by one ha of protected wetland each year over a 30-yr timeframe (Carbonsequestration).

Equation 1.

\[ Effectiveness = (Wetland\text{ }loss_{baseline}\times Reduction\text{ }in\text{ }loss)\times(Carbon_{avoided\text{ } emissions} + Carbon_{sequestration}) \]

We did this calculation separately for mangrove, salt marsh, and seagrass ecosystems, because many of these factors, such as carbon emission and sequestration rates, protection effectiveness, and loss rates, vary across ecosystem types. The rationale for increasing protection varies between coastal wetland ecosystem types, but in all cases, protection is an important tool for retaining and building long-lived carbon stocks. Additionally, climate impacts associated with this solution could be much greater than estimated if protection efficacy improves or is higher than our estimates of 53–59%. 

Table 1a. Effectiveness at avoiding emissions and sequestering carbon in mangrove ecosystems.

Unit: t CO₂‑eq /ha protected/yr, 100-yr basis

25th percentile 5.64
Mean 6.80
Median (50th percentile) 5.74
75th percentile 7.42

Unit: t CO₂‑eq /ha protected/yr, 100-yr basis

25th percentile 2.00
Mean 2.14
Median (50th percentile) 2.14
75th percentile 2.38

Unit: t CO₂‑eq /ha protected/yr, 100-yr basis

25th percentile 7.64
Mean 8.94
Median (50th percentile) 7.88
75th percentile 9.81
Left Text Column Width

Table 1b. Effectiveness at avoiding emissions and sequestering carbon in salt marsh ecosystems.

Unit: t CO₂‑eq /ha protected/yr, 100-yr basis 

25th percentile 2.79
Mean 2.90
Median (50th percentile) 2.90
75th percentile 3.01

Unit: t CO₂‑eq /ha protected/yr, 100-yr basis

25th percentile 1.59
Mean 1.90
Median (50th percentile) 1.88
75th percentile 2.19

Unit: t CO₂‑eq /ha protected/yr, 100-yr basis

25th percentile 4.38
Mean 4.80
Median (50th percentile) 4.78
75th percentile 5.20
Left Text Column Width

Table 1c. Effectiveness at avoiding emissions and sequestering carbon in seagrass ecosystems.

Unit: t CO₂‑eq /ha protected/yr, 100-yr basis

25th percentile 2.11
Mean 2.33
Median (50th percentile) 2.33
75th percentile 2.56

Unit: t CO₂‑eq /ha protected/yr, 100-yr basis

25th percentile 1.04
Mean 1.53
Median (50th percentile) 1.22
75th percentile 1.71

Unit: t CO₂‑eq /ha protected/yr, 100-yr basis

25th percentile 3.15
Mean 3.86
Median (50th percentile) 3.56
75th percentile 4.27
Left Text Column Width
Cost

We estimate that coastal wetland protection costs approximately US$1–2/t CO₂‑eq for mangrove and salt marsh ecosystems and seagrass ecosystem protection saves US$6/t CO₂‑eq (Tables 2a–c). This is based on protection costs of roughly US$11/ha and revenue of US$23/ha compared with the baseline for mangrove/salt marsh and seagrass ecosystems, respectively. However, data related to the costs of coastal wetland protection are extremely limited, and these estimates are uncertain. These estimates likely underestimate the potentially high costs of coastal land acquisition, for instance.

The costs of coastal wetland protection include up-front costs of land acquisition (for salt marshes and mangroves) and other one-time expenditures as well as ongoing operational costs. Protecting coastal wetlands also generates revenue, primarily through increased tourism. For consistency across solutions, we did not include revenue associated with benefits other than climate change mitigation.

Due to data limitations, we estimated the cost of land acquisition for ecosystem protection for mangroves and salt marshes by extracting coastal forest land purchase costs reported by Dinerstein et al. (2024), who found a median cost of US$1,115/ha (range: US$78–5,910/ha), which we amortized over 30 years. For seagrass ecosystems, which do not generally require land acquisition, we based initial costs were on McCrea-Strub et al.’s (2011) findings that reported a median MPA start-up cost of US$208/ha (range: US$55–434/ha) to cover expenses associated with infrastructure, planning, and site research, which we amortized over 30 years.

Costs of PA maintenance were estimated as US$17/ha/yr (Waldron et al., 2020). While these estimates reflect the costs of effective enforcement and management, many PAs lack sufficient funding for effective management (Bruner et al., 2004). Costs of MPA maintenance were estimated at US$14/ha/yr, though only 16% of the MPAs surveyed in this study reported their current funding as sufficient (Balmford et al., 2004). Tourism revenues directly attributable to protection were estimated to be US$43/ha/yr (Waldron et al., 2020) based on estimates for all PAs and MPAs and excluding downstream revenues. For consistency across solutions, we did not include revenues associated with ecosystem services, which would increase projected revenue.

We also excluded carbon credits as a revenue source due to the challenges inherent in accurate carbon accounting in these ecosystems and their frequently intended use to offset carbon emissions, similar to reported concerns with low-quality carbon credits in forest conservation projects (West et al., 2023). Future actions could explore policies that increase market financing for coastal wetland protection in more holistic ways, such as contributions-based approaches as suggested for forests (Blanchard et al., 2024). Financial support will be critical for backing conservation implementation (Macreadie et al., 2022), particularly in the face of existing political and economic challenges that have historically limited expansion. 

Table 2. Cost per unit climate impact.

Unit: 2023 US$/t CO₂‑eq , 100-yr basis

Estimate 1

Unit: 2023 US$/t CO₂‑eq , 100-yr basis

Estimate 2

Unit: 2023 US$/t CO₂‑eq , 100-yr basis

Estimate -6

Negative value indicates cost savings.

Left Text Column Width

Methods and Supporting Data

Learning Curve

We define a learning curve as falling costs with increased adoption. The costs of coastal wetland protection do not fall with increasing adoption, so there is no learning curve for this solution.

Speed of Action

Speed of action refers to how quickly a climate solution physically affects the atmosphere after it is deployed. This is different from speed of deployment, which is the pace at which solutions are adopted.

At Project Drawdown, we define the speed of action for each climate solution as emergency brake, gradual, or delayed.

Protect Coastal Wetlands is an EMERGENCY BRAKE climate solution. It has the potential to deliver a more rapid impact than gradual and delayed solutions. Because emergency brake solutions can deliver their climate benefits quickly, they can help accelerate our efforts to address dangerous levels of climate change. For this reason, they are a high priority.

Caveats

Additionality in this solution refers to whether the ecosystem would have been degraded without protection. In this analysis, we assumed protection confers additional carbon benefits as it reduces degradation and associated emissions. Another aspect of additionality, though not directly relevant to our analysis, is whether coastal wetlands would have been protected in the absence of carbon financing. This could become increasingly important if protection efforts seek carbon credits, since many wetlands are protected for other benefits, such as flood resilience and biodiversity.

The permanence of stored carbon in coastal wetlands is another critical issue as climate change impacts unfold. For instance, with sea-level rise, the ability of salt marshes to expand both vertically and laterally can determine resiliency, suggesting that protection of wetlands might also need to include adjacent areas for expansion (Schuerch et al., 2018). On a global scale, recent research suggests that global carbon accumulation might actually increase by 2100 from climate change impacts on tidal wetlands (Wang et al., 2021), though more work is needed as other work suggests the opposite (Noyce et al., 2023). There is also substantial risk of reversal of carbon benefits if protections are reversed or unenforced, which can require long-term financial investments, community engagement, and management/enforcement commitments (Giakoumi et al., 2018), particularly if the land is leased.

Finally, there are significant uncertainties associated with the available data on coastal wetland areas and distributions, loss rates, drivers of loss, extent and boundaries of PAs/MPAs, and efficacy of PAs/MPAs at reducing coastal wetland disturbance. For example, the geospatial datasets we used to identify the adoption ceiling for this solution could include partially degraded systems, such as drained wetlands, where protection alone would not stop emissions or restore function without restoration – yet we lack enough data to distinguish these current differences at a global scale. Similarly, legal protection of coastal wetlands does not always prevent degradation (Heck et al., 2024). The emissions dynamics of both intact and degraded coastal wetlands are also uncertain. Even less is known about the impacts of different types of degradation on coastal wetland carbon dynamics and how they vary spatially and temporally around the world.

Current Adoption

We estimated that approximately 8.04 million ha of coastal wetlands are currently protected, with 5.13 million ha recognized as PAs and MPAs in strict (I–II) protection categories and 2.90 million ha in non-strict protection categories (III–IV) (Tables 3a–c; Garnett et al., 2018; UNEP-WCMC & IUCN, 2024, see Appendix). Indigenous People’s Lands (IPLs) cover an additional 3.44 million ha; we did not include these in our analysis due to limited data, but we recognize that these sites might currently deliver conservation benefits. In total, we estimate that roughly 15% of all coastal wetlands have some protection (as MPAs or PAs in IUCN categories I–IV), though only about 9% are under strict protection (IUCN categories I or II). Across individual ecosystem types, strict protection categories (IUCN I–II) are highest for mangroves (~15%) and lowest for seagrasses (~7%).

Our estimates of PA and MPA protection (12–19%) were lower than previously reported estimates for mangroves (40–43%, Dabalà et al., 2023; Leal and Spalding, 2024), tidal marshes (45%, Worthington et al., 2024), and seagrasses (26%, United Nations Environment Programme [UNEP], 2020). This is likely because our calculations excluded IUCN categories (“not assigned,” “not applicable,” and “not reported”) that contain large areal estimates for each ecosystem type – 4.3 million ha (mangrove), 1.9 million ha (salt marsh), and 5.4 million ha (seagrasses) – because their protection category was unclear as well as IUCN protection categories V–VI, which permit sustainable use and where extractive activities that could degrade these ecosystems are less formally restricted. Our spatial analysis also differed (see Appendix).

Table 3. Current extent of ecosystems under legal protection by ecosystem type (circa 2023). “Strict Protection” includes land within IUCN Categories I–II PAs or MPAs. “Nonstrict Protection” includes land within IUCN Categories III–IV PAs or MPAs. “Other” includes land within all remaining IUCN PA or MPA categories.

Unit: million ha protected

Strict protection 2.35
Nonstrict protection 0.59
Total (strict + nonstrict) 2.94
IPL 1.86
Other 7.52

Unit: million ha protected

Strict protection 0.62
Nonstrict protection 0.62
Total (strict + nonstrict) 1.24
IPL 1.09
Other 3.14

Unit: million ha protected

Strict protection 2.17
Nonstrict protection 1.69
Total (strict + nonstrict) 3.86
IPL 0.49
Other 9.00
Left Text Column Width
Adoption Trend

We calculated the rate of PA and MPA expansion based on their recorded year of establishment. Protection expanded by an average of 59,600, 19,700, and 98,500 ha/yr in mangrove, salt marsh, and seagrass ecosystems, respectively (Tables 4a–c; Figure 3a). Salt marsh ecosystems have the lowest absolute rate of coastal wetland protection expansion (Figure 3b), while seagrasses have the lowest expansion of PAs relative to their adoption ceiling (Figure 3, right). The median total annual adoption trend across the three ecosystems is roughly 123,100 ha/yr (roughly 0.12 million ha/yr).

Table 4. 2000–2020 adoption trend for legal protection of ecosystems.

Unit: ha/yr protected

25th percentile 23,500
Mean 59,600
Median (50th percentile) 40,700
75th percentile 76,600

Unit: ha/yr protected

25th percentile 8,400
Mean 19,700
Median (50th percentile) 18,500
75th percentile 23,300

Unit: ha/yr protected

25th percentile 12,800
Mean 98,500
Median (50th percentile) 37,800
75th percentile 142,900
Left Text Column Width

Figure 3. (a) Areal trend in coastal wetland protection by ecosystem type (2000–2020). These values reflect only the area located within IUCN Class I–IV PAs or MPAs; (ha/yr protected). (b) Trend in coastal wetland protection by ecosystem type as a percent of the adoption ceiling. These values reflect only the area located within IUCN Class I–IV PAs or MPAs; (Percent). Source: Project Drawdown original analysis.

Credit: Project Drawdown

Enable Download
Off
Adoption Ceiling

We estimate an adoption ceiling of 54.6 million ha of coastal wetlands globally, which includes 15.7 million ha of mangroves, 7.50 million ha of salt marshes, and 31.4 million ha of seagrasses (Tables 5a–c). This estimate is in line with recent existing global estimates of coastal wetlands (36–185 million ha), which have large ranges due to uncertainties surrounding seagrass and salt marsh distributions (Macreadie et al., 2021, Krause et al., 2025). The adoption ceiling of our solution is therefore a conservative estimate of potential climate impact if global areas are indeed larger than calculated. While the protection of all existing coastal wetlands is highly unlikely, these values are used to represent the technical limits of adoption of this solution.

Table 5. Adoption ceiling: upper limit for adoption of legal protection of ecosystems.

Unit: million ha protected

Estimate 15.7

Unit: million ha protected

Estimate 7.50

Unit: million ha protected

Estimate 31.4
Left Text Column Width
Achievable Adoption

We defined the lower end of the achievable range for coastal wetland protection (under IUCN categories I–IV) as 50% of the adoption ceiling and the higher end of the achievable range as 70% of the adoption ceiling for each ecosystem (Tables 6a–c). These numbers are ambitious but precedent exists to support them. For instance, roughly 11 countries already protect over 70% of their mangroves (Dabalà et al., 2023), and the global “30 by 30” target aims to protect 30% of ecosystems on land and in the ocean by 2030 (Roberts et al., 2020). Further, a significant extent of existing global coastal wetland areas already fall under non-strict protection categories not included in our analysis (V–VI and “Other”). These are prime candidates for conversion to stricter protection categories, so long as the designation confers real conservation benefits; recent work suggests that stricter protection can coincide with increased degradation in some mangroves (Heck et al., 2024).

Current adoption of PAs and MPAs in many countries with the highest land areas of coastal wetlands is low. For example, protection levels (IUCN I–IV) in countries with the top 10 greatest mangrove areas ranges between less than 1% (India, Myanmar, Nigeria, and Papua New Guinea) to 8.8–21.2% (Australia, Bangladesh, Brazil, Indonesia, Malaysia, and Mexico;Dabalà et al., 2023). Expansion of PAs, particularly under IUCN I–IV categories, is a significant challenge with real implementation barriers due to competing land uses and local reliance on these areas for livelihoods. Further, protection does not guarantee conservation benefits, and significant funding is required to maintain/enforce these areas or they run the risk of becoming “paper parks” (Di Minin & Toivonen, 2015). Strong policy and financial incentives for conservation will be necessary to achieve these ambitious goals. Pathways for operationalizing protection could include finance, governance, and stakeholder alignment and will likely require a combination of these tactics around the world. 

Table 6. Range of achievable adoption levels for ecosystems.

Unit: million ha protected

Current adoption 2.94
Achievable – low 7.85
Achievable – high 11.0
Adoption ceiling 15.7

Unit: million ha protected

Current adoption 1.24
Achievable – low 3.75
Achievable – high 5.25
Adoption ceiling 7.50

Unit: million ha protected

Current adoption 3.86
Achievable – low 15.7
Achievable – high 22.0
Adoption ceiling 31.4
Left Text Column Width

We estimated that coastal wetland protection currently avoids approximately 0.04 Gt CO₂‑eq/yr, with potential impacts of 0.27 Gt CO₂‑eq/yr at the adoption ceiling (Table 7a–c, see Appendix for more information on the calculations). The lower-end achievable scenario (50% protection) would avoid 0.14 Gt CO₂‑eq/yr, and the upper-end achievable scenario (70% protection) would avoid 0.20 Gt CO₂‑eq/yr (Tables 7a–c). These values are in line with Macreadie et al. (2021), who estimated a maximum mitigation potential from avoided emissions due to degradation (land conversion) of 0.30 (range: 0.14–0.47) Gt CO₂‑eq/yr for mangrove, salt marsh, and seagrass ecosystems. Our estimate was slightly lower, but within their range, and differed in a few key ways. We accounted for the effectiveness of protection at reducing degradation (53–59%, instead of assuming 100%), included retained carbon sequestration with each hectare protected, and used slightly different loss rates and ecosystem areas.

Table 7. Climate impact at different levels of adoption for ecosystems.

Unit: Gt CO₂‑eq/yr, 100-yr basis

Current adoption 0.02
Achievable – low 0.06
Achievable – high 0.09
Adoption ceiling 0.12

Unit: Gt CO₂‑eq/yr, 100-yr basis

Current adoption 0.01
Achievable – low 0.02
Achievable – high 0.03
Adoption ceiling 0.04

Unit: Gt CO₂‑eq/yr, 100-yr basis

Current adoption 0.01
Achievable – low 0.06
Achievable – high 0.08
Adoption ceiling 0.11
Left Text Column Width
Additional Benefits

Extreme Weather Events

Wetlands buffer coastal communities from waves and storm surge due to extreme weather and have important roles in disaster risk mitigation (Sheng et al., 2022; Guannel et al., 2016). Mangroves slow the flow of water and reduce surface waves to protect more than 60 million people in low-lying coastal areas, mainly in low- and middle-income countries (McIvor et al., 2012; Hochard et al., 2021). Wetlands also protect structures against damage during storms and lead to savings in insurance claims (Barbier et al., 2013; Sheng et al., 2022). Mangroves provide an estimated US$65 billion in flood protection globally (Menéndez et al., 2020). A study of the damages of Hurricane Sandy found that wetlands in the northeastern United States avoided US$625 million in direct flood damages (Narayan et al., 2017).

Income and Work

Wetlands are a contributor to local livelihoods, providing employment for coastal populations via the fisheries and tourism that they support. Coastal ecosystems, such as mangroves, are crucial for subsistence fisheries as they sustain approximately 4.1 million small-scale fishers (Leal and Spalding, 2022). Wetlands provide sources of income for low-income coastal communities as they make small-scale fishing accessible, requiring limited gear and materials to fish (Cullen-Unsworth & Unsworth, 2018). The economic value of mangrove ecosystem services is estimated at US$33,000–57,000/ha/yr and is a major contributor to the national economies of low- and middle-income countries with mangroves (UNEP, 2014).

Food Security

Mangroves support the development of numerous commercially important fish species and strengthen overall fishery productivity. For example, research conducted across 6,000 villages in Indonesia found that rural coastal households near high and medium-density mangroves consumed more fish and aquatic animals than households without mangroves nearby (Ickowitz et al., 2023). Seagrasses also support fisheries as 20% of the world’s largest fisheries rely on seagrasses for habitats (Jensen, 2022). The amount and diversity of species within seagrasses also provide important nutrition for fishery species (Cullen-Unsworth & Unsworth, 2018).

Equality

Coastal wetlands are significant in cultural heritages and identities for nearby people. They can be associated with historical, religious, and spiritual values for communities and especially for Indigenous communities (UNEP, 2014). For example, a combination of sea-level rise and oil and gas drilling have contributed to the decline of coastal wetlands in Louisiana, which threatens livelihoods and deep spiritual ties of local Indigenous tribes (Baniewicz, 2020; Hutchinson, 2022). Indigenous people have a long history of managing and protecting coastal wetlands (Mathews & Turner, 2017). Efforts to protect these areas must include legal recognition of Indigenous ownership to support a just and sustainable conservation process (Fletcher et al., 2021).

Nature Protection

Coastal wetlands are integral in supporting the biodiversity of surrounding watersheds. High species diversity of mangroves and seagrasses provide a unique habitat for marine life, birds, insects, and mammals, and contain numerous threatened or endangered species (Green and Short, 2003; U.S. EPA, 2025a). A variety of species rely on wetlands for food and shelter, and they can provide temporary habitats for species during critical times in their life cycles, such as migration and breeding (Unsworth et al., 2022). Wetlands can improve water quality, making the surrounding ecosystem more favorable to supporting marine life (Cullen-Unsworth & Unsworth, 2018). Seagrasses can improve coral health by filtering water and reducing pathogens that could cause disease (Cullen-Unsworth & Unsworth, 2018).

Land Resources

Wetlands reduce coastal erosion which can benefit local communities during strong storms (Jensen, 2022). Wetlands mitigate erosion impacts by absorbing wave energy that would degrade sand and other marine sediments (U.S. EPA, 2025b). Specifically, mangroves reduce erosion through their aerial root structure that retain sediments that would otherwise degrade the shoreline (Thampanya et al., 2006).

Water Quality

Coastal wetlands improve the water quality of watersheds by filtering chemicals, particles (including microplastics), sediment, and cycling nutrients (Unsworth et al. 2022). There is even evidence that wetlands can remove viruses and bacteria from water, leading to better sanitation and health for marine wildlife and humans (Lamb et al., 2017).

Risks

There are several risks associated with coastal wetland protection. Leakage, wherein protection in one region could prompt degradation of another, could reduce climate benefits (Renwick et al., 2015). Strict conservation of coastal wetlands could impact local economies, creating “poverty traps” if protection threatens livelihoods (McNally et al., 2011). Conservation projects also risk unequal distribution of benefits (Lang et al., 2023). In places where habitats are fragmented or existing infrastructure limits landward migration, even protected coastal wetlands are at risk of being lost with climate change (commonly known as “the coastal squeeze”; Borchert et al., 2018). Funding gaps risk reversal of climate benefits despite initial conservation efforts; most MPAs and PAs report a lack of funding (Balmford et al., 2004; Bruner et al., 2004). If coastal wetlands are subjected to human impacts that protection cannot prevent, such as upgradient nutrient pollution, there could also be a risk of increased GHG emissions (Feng et al., 2025) and ecosystem degradation.

Interactions with Other Solutions

Reinforcing

Other ecosystems often occur adjacent to areas of coastal wetlands, and the health of nearby ecosystems can be improved by the services provided by intact coastal wetlands (and vice versa). 

Competing

Mangrove deforestation can occur for fuel wood needs. Fuel wood sourced from mangroves could be replaced with wood sourced from other forested ecosystems.

Protecting coastal wetlands could limit near-shore land availability for renewable energy technologies and competes with the following solution for land:

Dashboard

Solution Basics

ha protected

t CO₂-eq (100-yr)/unit/yr
07.647.88median
units
Current 2.94×10⁶ 07.85×10⁶1.1×10⁷
Achievable (Low to High)

Climate Impact

Gt CO₂-eq (100-yr)/yr
Current 0.02 0.060.09
US$ per t CO₂-eq
1
Emergency Brake

CO₂

Solution Basics

ha protected

t CO₂-eq (100-yr)/unit/yr
04.384.78median
units
Current 1.24×10⁶ 03.75×10⁶5.25×10⁶
Achievable (Low to High)

Climate Impact

Gt CO₂-eq (100-yr)/yr
Current 0.01 0.020.03
US$ per t CO₂-eq
2
Emergency Brake

CO₂

Solution Basics

ha protected

t CO₂-eq (100-yr)/unit/yr
03.153.56median
units
Current 3.86×10⁶ 01.57×10⁷2.2×10⁷
Achievable (Low to High)

Climate Impact

Gt CO₂-eq (100-yr)/yr
Current 0.01 0.060.08
US$ per t CO₂-eq
-6
Emergency Brake

CO₂

Trade-offs

Trade-offs associated with protection of coastal wetlands include emission of other GHGs not quantified in this solution that have higher global warming potentials (GWP) than CO₂. Methane and nitrous oxide emissions can be measurable in coastal wetland ecosystems, though it is important to recognize that degradation can significantly impact the magnitude and types of effluxes, too. In mangroves, methane evasion can offset carbon burial by almost 20% based on a 20-yr GWP (Rosentreter et al., 2018). In seagrasses, methane and nitrous oxide effluxes can offset burial on average, globally, by 33.4% based on a 20-yr GWP and 7.0% based on a 100-yr GWP (Eyre et al., 2023). Finally, conservation of coastal land can also restrict development of desirable coastal property for other uses.

% mangroves
> 0100

Global mangrove ecosystem distribution

Mangrove ecosystems cover approximately 15.7 million ha globally; just five countries (Australia, Brazil, Indonesia, Mexico, and Nigeria) contain nearly 50% of the world’s mangrove ecosystem area (FAO, 2020). Green shaded areas indicate the general location of mangrove ecosystems; zoom in for details.

Liu, L., Zhang, X., & Zhao, T. (2022). GWL_FCS30: global 30 m wetland map with fine classification system using multi-sourced and time-series remote sensing imagery in 2020 [Data set, Version 1]. Link to source: https://doi.org/10.5281/zenodo.7340516

% mangroves
> 0100

Global mangrove ecosystem distribution

Mangrove ecosystems cover approximately 15.7 million ha globally; just five countries (Australia, Brazil, Indonesia, Mexico, and Nigeria) contain nearly 50% of the world’s mangrove ecosystem area (FAO, 2020). Green shaded areas indicate the general location of mangrove ecosystems; zoom in for details.

Liu, L., Zhang, X., & Zhao, T. (2022). GWL_FCS30: global 30 m wetland map with fine classification system using multi-sourced and time-series remote sensing imagery in 2020 [Data set, Version 1]. Link to source: https://doi.org/10.5281/zenodo.7340516

Maps Introduction

The current adoption, potential adoption, and effectiveness of coastal wetland protection is ecosystem-dependent (mangroves, salt marshes, seagrasses) and geographically variable. While coastal wetland protection can help avoid GHG emissions anywhere they occur, ecosystems with high rates of loss from human activity, and large unprotected areas have the greatest potential for avoiding emissions via protection. 

For instance, seagrass ecosystems have the lowest current adoption of protection, ~12%, and highest adoption ceiling (31.4 Mha) (Tables 3 and 6). Protecting seagrasses also potentially can save money (–US$23/ha, Table 2) because they do not generally require land purchase (McCrea-Strub et al., 2011). Protection of seagrasses could therefore provide meaningful climate impact as well as substantial economic and ecologic benefits (Unsworth et al., 2022). 

For seagrasses, countries like Australia (~10 Mha), Indonesia (~3 Mha), the United States (~0.5 Mha), and regions such as the Gulf of Mexico (~2 Mha) and the Western Mediterranean (~0.4 Mha), could be good initial targets for protection due to their significant seagrass extents (Green and Short, 2003). Countries that contain the top 10 largest areas of mangroves (Australia, Bangladesh, Brazil, India, Indonesia, Malaysia, Mexico, Myanmar, Nigeria, Papua New Guinea) might have the greatest potential to significantly expand adoption and scale climate impact (Dabalà et al., 2023). Likewise, salt marsh protection might be most beneficial in countries with the greatest extent, such as the United States (~1.7 Mha), Australia (~1.3 Mha), Russia (~0.7 Mha), and China (~0.6 Mha) (Mcowen et al., 2017).

Action Word
Protect
Solution Title
Coastal Wetlands
Classification
Highly Recommended

Lawmakers and Policymakers

  • Grant Indigenous communities full property rights and autonomy; support them in monitoring, managing, and enforcing MPAs/PAs/IPLs.
  • Ensure effective enforcement and monitoring of existing PAs using real-time and satellite data, if available.
  • Create or strengthen legislative protections for coastal wetlands, requiring their consideration during land use planning and allowing for local decision-making.
  • Start expanding PAs by first designating coastal wetlands adjacent to existing MPAs/PAs/IPLs.
  • Increase designated PAs and MPAs and consider all benefits (e.g., climate, human well-being, biodiversity) and dynamics (e.g., water flows, soil, agriculture) when designating PAs to ensure maximum benefits.
  • Ensure PAs and MPAs don’t displace, violate rights, or reduce access to vital resources for local and Indigenous communities.
  • Classify and map coastal wetlands and tidal information; create local, national, and international standards for classification.
  • Integrate river, watershed, and dam management into coastal wetland protection.
  • Streamline regulations and legal requirements, when possible to simplify management and designation of MPAs/PAs/IPLs.
  • Use financial incentives such as subsidies, tax breaks, payments for ecosystem services (PES), and debt-for-nature swaps to protect coastal wetlands from development.
  • Conduct proactive land-use planning to avoid roads and other development projects that might interfere with MPAs and PAs.
  • Coordinate MPA and PA efforts horizontally (e.g., across agencies) and vertically (e.g., across subnational, national, and international efforts), ensuring an inclusive process for local and Indigenous communities.
  • Incorporate MPAs/PAs/IPLs into local, national, and international climate plans (i.e., Nationally Determined Contributions).
  • Work with insurance companies to reduce insurance premiums for properties that protect or maintain coastal wetlands.
  • Create processes for legal grievances, dispute resolution, and restitution.
  • Create sustainable use regulations for protected coastal wetland areas that provide resources to local communities.
  • Empower local communities to manage coastal wetlands and ensure a participatory approach to designating and managing MPAs and PAs.
  • Create education programs that educate the public on MPA regulations, the benefits of coastal wetlands, and how to use resources sustainably.
  • Join, support, or create certification schemes for sustainable management of coastal wetlands.

Practitioners

  • Avoid draining or degrading coastal wetlands.
  • Avoid developing intact coastal wetlands, including small-scale shoreline developments such as docks.
  • Invest in coastal wetland conservation, restoration, sustainable management practices, specialized research facilities, and other R&D efforts.
  • Participate in stakeholder engagements and help policymakers designate coastal wetlands, create regulations, and implement robust monitoring and enforcement.
  • Grant Indigenous communities full property rights and autonomy and support them in monitoring, managing, and enforcing PAs.
  • Ensure protected coastal wetlands don’t displace, violate rights, or reduce access to vital resources for local and Indigenous communities.
  • Integrate river, watershed, and dam management into coastal wetland protection.
  • Use real-time monitoring and satellite data to manage and enforce PA and MPA regulations.
  • Create sustainable use regulations for protected coastal wetland areas that provide resources to the local community.
  • Conduct proactive land-use planning to avoid infrastructure or development projects that might interfere with protected coastal wetlands or incentivize drainage.
  • Advocate for creating legal grievance processes, dispute resolution mechanisms, and restitution procedures for violations or disagreements over PAs and MPAs.
  • Advocate for or use financial incentives such as subsidies, tax breaks, and PES to protect coastal wetlands from development.
  • Utilize financial mechanisms such as biodiversity offsets, PES, high-integrity voluntary carbon markets, and debt-for-nature swaps to fund coastal wetland protection.
  • Help classify and map coastal wetlands and tidal information as well as create local, national, and international standards for classification.
  • Coordinate PA and MPA efforts horizontally (e.g., across agencies) and vertically (e.g., across subnational, national, and international efforts), ensuring an inclusive process for local and Indigenous communities.
  • Work with insurance companies to reduce insurance premiums for properties that protect or maintain coastal wetlands.
  • Join, support, or create certification schemes for sustainable management of coastal wetlands.
  • Create education programs that educate the public on MPA/PA/IPL regulations, the benefits of coastal wetlands, and how to use resources sustainably.

Further information:

Business Leaders

  • Ensure operations, development, and supply chains are not degrading coastal wetlands or interfering with PA or MPA management.
  • Integrate coastal wetland protection into net-zero strategies, if relevant.
  • Help revise existing or create new high-integrity carbon markets, institutions, rules, and norms to cultivate the demand for high-quality carbon credits.
  • Only purchase carbon credits from high-integrity, verifiable carbon markets, and do not use them as replacements for less carbon-intensive operations or claim them as offsets.
  • Consider donating to established coastal wetland protection funds in place of carbon credits.
  • Take advantage of financial incentives such as subsidies, tax breaks, and PES to coastal wetlands from development.
  • Amplify the voices of local communities and civil society to promote robust media coverage.
  • Invest in and support Indigenous and local communities' capacity for management, legal protection, and public relations.
  • Leverage political influence to advocate for stronger coastal wetland protection policies at national and international levels.
  • Conduct proactive land-use planning to avoid roads and other development projects that might interfere with PAs and MPAs or incentivize deforestation.
  • Join, support, or create certification schemes for sustainable management of coastal wetlands.

Further information:

Nonprofit Leaders

  • Advocate for enhanced enforcement of existing MPAs/PAs/IPLs, expansion of new MPAs/PAs/IPLs, and more public investments.
  • Help manage and monitor protected coastal wetlands using real-time monitoring and satellite data.
  • Provide financial support for MPAs/PAs/IPLs, monitoring, and enforcement.
  • Help conduct proactive land-use planning to avoid infrastructure or development projects that might interfere with protected coastal wetlands or incentivize drainage.
  • Advocate for creating legal grievance processes, dispute resolution mechanisms, and restitution procedures for violations or disagreements over PAs or MPAs.
  • Help revise existing or create new high-integrity carbon markets, institutions, rules, and norms to cultivate the demand for high-quality carbon credits.
  • Amplify the voices of local communities and civil society to promote robust media coverage.
  • Invest in and support the capacity of Indigenous and local communities for management, legal protection, and public relations.
  • Use or advocate for financial incentives such as subsidies, tax breaks, and PES to protect coastal wetlands from development.
  • Help classify and map coastal wetlands and tidal information as well as create local, national, and international standards for classification.
  • Work with insurance companies to reduce insurance premiums for properties that protect or maintain coastal wetlands.
  • Join, support, or create certification schemes for sustainable management of coastal wetlands.
  • Create education programs that educate the public on MPA/PA/IPL regulations, the benefits of coastal wetlands, and how to use resources sustainably.

Further information:

Investors

  • Ensure investment portfolios do not degrade coastal wetlands or interfere with MPAs/PAs/IPLs, using data, information, and the latest technology to inform investments.
  • Invest in coastal wetland protection, monitoring, management, and enforcement mechanisms.
  • Use financial mechanisms such as credible biodiversity offsets, PES, voluntary high-integrity carbon markets, and debt-for-nature swaps to fund coastal wetland protection.
  • Invest in and support Indigenous and local communities' capacity for legal protection and public relations.
  • Share data, information, and investment frameworks that successfully avoid investments that drive coastal wetland destruction with other investors and nongovernmental organizations.
  • Provide favorable loans to Indigenous communities and entrepreneurs and businesses protecting wetlands.
  • Join, support, or create certification schemes for sustainable management of coastal wetlands.

Further information:

Philanthropists and International Aid Agencies

  • Advocate for enhanced enforcement of existing MPAs/PAs/IPLs, expansion of new MPAs/PAs/IPLs, and public investments.
  • Help manage and monitor protected coastal wetlands, using real-time monitoring and satellite data.
  • Provide technical and financial assistance to low- and middle-income countries and communities to protect coastal wetlands.
  • Provide financial support to organizations and institutions developing and deploying monitoring technology and conducting wetland research.
  • Help manage and monitor protected coastal wetlands using real-time monitoring and satellite data.
  • Help conduct proactive land-use planning to avoid infrastructure or development projects that might interfere with protected coastal wetlands or incentivize drainage.
  • Help revise existing or create new high-integrity carbon markets, institutions, rules, and norms to cultivate the demand for high-quality carbon credits.
  • Amplify the voices of local communities and civil society to promote robust media coverage.
  • Invest in and support Indigenous and local communities' capacity for management, legal protection, and public relations.
  • Advocate for creating legal grievance processes, dispute resolution mechanisms, and restitution procedures for violations or disagreements over PAs or MPAs.
  • Help classify and map coastal wetlands and tidal information as well as create local, national, and international standards for classification.
  • Work with insurance companies to reduce insurance premiums for properties that protect or maintain coastal wetlands.
  • Join, support, or create certification schemes for sustainable management of coastal wetlands.
  • Create education programs that educate the public on MPA/PA/IPL regulations, the benefits of coastal wetlands, and how to use resources sustainably.

Further information:

Thought Leaders

  • Advocate for enhanced enforcement of existing MPAs/PAs/IPLs, expansion of new MPAs/PAs/IPLs, and for public investments.
  • Advocate for or use financial incentives such as subsidies, tax breaks, PES, and debt-for-nature swaps to protect coastal wetlands from development.
  • Help manage and monitor protected coastal wetlands using real-time monitoring and satellite data.
  • Help conduct proactive land-use planning to avoid infrastructure or development projects that might interfere with protected coastal wetlands or incentivize drainage.
  • Advocate for creating legal grievance processes, dispute resolution mechanisms, and restitution procedures for violations or disagreements over PAs or MPAs.
  • Help revise existing or create new high-integrity carbon and biodiversity markets, institutions, rules, and norms to cultivate the demand for high-quality carbon credits.
  • Amplify the voices of local communities and civil society to promote robust media coverage.
  • Support Indigenous and local communities' capacity for legal protection, management, and public relations.
  • Help classify and map coastal wetlands and tidal information as well as create local, national, and international standards for classification.
  • Join, support, or create certification schemes for sustainable management of coastal wetlands.
  • Create programs that educate the public on MPA/PA/IPL regulations, the benefits of coastal wetlands, and how to use resources sustainably.

Further information:

Technologists and Researchers

  • Study ecosystem services provided by coastal wetlands and catalogue the benefits.
  • Improve mapping of coastal wetland areas, carbon content and dynamics, tidal impacts, degradation types and levels, and emissions data – specifically methane and nitrous oxide.
  • Improve monitoring methods using field measurements, models, satellite imagery, and GIS tools.
  • Research adjacent technologies and practices such as seaweed farm management, kelp forest conservation, sediment management, and biodiversity restoration.
  • Conduct meta-analyses or synthesize existing literature on coastal wetlands and protection efforts.
  • Explore ways to use smart management systems for PAs and MPAs, including the use of real-time and satellite data.
  • Develop land-use planning tools that help avoid infrastructure or development projects that might interfere with PAs and MPAs or incentivize drainage.
  • Create tools for local communities to monitor coastal wetlands, such as mobile apps, e-learning platforms, and mapping tools.
  • Develop verifiable carbon credits using technology such as blockchain to improve the integrity of carbon markets.
  • Develop supply chain tracking software for investors and businesses seeking to create sustainable portfolios and products.

Further information:

Communities, Households, and Individuals

  • Avoid draining or degrading coastal wetlands.
  • Avoid developing intact coastal wetlands, including small-scale shoreline developments such as docks.
  • Help manage and monitor protected coastal wetlands using real-time monitoring and satellite data.
  • Establish coordinating bodies for farmers, developers, landowners, policymakers, dam operators, and other stakeholders to holistically manage PAs.
  • Advocate for enhanced enforcement of existing MPAs/PAs/IPLs, expansion of new MPAs/PAs/IPLs, and public investments.
  • Help conduct proactive land-use planning to avoid infrastructure or development projects that might interfere with protected coastal wetlands or incentivize drainage.
  • Advocate for creating legal grievance processes, dispute resolution mechanisms, and restitution procedures for violations or disagreements over PAs or MPAs.
  • Help revise existing or create new high-integrity carbon and biodiversity markets, institutions, rules, and norms to cultivate the demand for high-quality carbon credits.
  • Support Indigenous communities' capacity for management, legal protection, and public relations.
  • Use or advocate for financial incentives such as subsidies, tax breaks, and PES to protect coastal wetlands from development.
  • Help classify and map coastal wetlands and tidal information as well as create local, national, and international standards for classification.
  • Ensure PAs and MPAs don’t displace, violate rights, or reduce access to vital resources for local and Indigenous communities.
  • Work with insurance companies to reduce insurance premiums for properties that protect or maintain coastal wetlands.
  • Participate or volunteer in local coastal wetland protection efforts.
  • Plant native species to help improve the local ecological balance and stabilize the soil – especially on waterfront property.
  • Use nontoxic cleaning and gardening supplies, purchase unbleached paper products, and recycle to help keep pollution and debris out of wetlands.
  • Join, support, or create certification schemes for sustainable management of coastal wetlands.
  • Create education programs that educate the public on MPA/PA/IPL regulations, the benefits of coastal wetlands, and how to use resources sustainably.

Further information:

Evidence Base

Consensus of effectiveness in reducing emissions and maintaining carbon removal: High

There is high scientific consensus that coastal wetland protection is an important strategy for reducing wetland loss due to degradation and that degradation results in carbon stock loss from coastal wetlands. Rates of wetland loss are generally lower inside PAs than outside them. An analysis of over 4,000 PAs (wetland and non-wetland area) showed 59% of sites are in “sound management,” which generally reflects PAs with strong enforcement, management implementation, and conservation outcome indicators (Leverington et al., 2010). Here we used a conservative effectiveness of 59% for salt marshes and mangroves that are under legal protection, consistent with the value from Leverington et al. (2010). Other regional studies show similar PA effectiveness values, with 25–50% of wetland PAs in China exhibiting moderate to very high conservation effectiveness (Lu et al., 2016).

Seagrasses differ from mangroves and salt marshes in that they fall under MPA designation because they are subtidal, or submerged. In an analysis of effectiveness of 66 MPAs in 18 countries, nearly 53% of MPAs reported positive or slightly positive ecosystem outcomes (Rodríguez-Rodríguez & Martínez-Vega, 2022). Less is known about MPA effectiveness for seagrass meadows specifically; we assumed an effectiveness of 53% – similar to other MPAs.

Prevention of degradation via legal coastal wetlands protection avoids emissions by preserving carbon stocks while also retaining carbon sequestration capacity. Degradation of coastal wetlands results in measurable loss of short- and long-lived carbon stocks, with emissions that vary based on ecosystem and degradation type (Donato et al., 2011, Holmquist et al., 2023, Lovelock et al., 2017, Mcleod et al., 2011, Pendleton et al., 2012). Estimates of existing carbon stocks in coastal wetlands are substantial, ranging between 8.97–32.7 Gt of carbon (32.9–120 Gt CO₂‑eq ), most of which is likely susceptible to degradation (Macreadie et al., 2021).

The results presented in this document synthesize findings from 14 global datasets. We recognize that geographic bias in the information underlying global data products creates bias and hope this work inspires research and data sharing on this topic in underrepresented regions and understudied ecosystems.

Appendix

In this analysis, we integrated global land cover data; shapefiles of PAs, MPAs, and IPLs; and ecosystem type (mangroves, salt marshes, seagrasses) data on carbon emissions and sequestration rates to calculate currently protected coastal wetland area, total global coastal wetland area, and avoided emissions and additional sequestration from coastal wetland protection by ecosystem type (mangroves, salt marshes, and seagrasses).

Land Cover Data

We used two land cover data products to estimate coastal wetland extent by ecosystem type (mangroves, salt marshes, seagrasses) inside and outside of PAs, MPAs, and IPLs: 1) a global 30 m wetland map, GWL_FCS30, for mangroves and salt marshes (Zhang et al., 2023), and 2) the global distribution of seagrasses map from UN Environment World Conservation Monitoring Centre (UNEP-WCMC & Short, 2021).

Protected Coastal Wetland Areas

The IUCN defines PAs, including MPAs, as geographically distinct areas managed primarily for the long-term conservation of nature and ecosystem services. They are further disaggregated into six levels of protection, ranging from strict wilderness preserves to sustainable use areas that allow for some natural resource extraction (including logging). We calculated all levels of protection but only considered protection categories I–IV in our analysis of adoption. We recognized that other protection categories might provide conservation benefits. We excluded categories labeled as “Not Applicable (NAP),” “Not Reported (NR),” “Not Assigned (NAS),” as well as categories VI and VII. We also estimated IPL area based on available data, but emphasized that much of their extent has not been fully mapped nor recognized for its conservation benefits (Garnett et al., 2018). Additionally, the IPL dataset only covered land and therefore did not include seagrass ecosystems explicitly beyond the extent that ecosystems bordering terrestrial IPL areas were captured within the 1 km pixels of analysis. Coastal wetlands also lack data on the effectiveness of protection with IPLs, so we did not include IPL data as currently protected in our estimates.

We identified protected coastal wetland areas using the World Database on PAs (UNEP-WCMC & IUCN, 2024), which contains boundaries for each PA or MPA and additional information, including their establishment year and IUCN management category (Ia to VI, NAP, NR, and NAS). For each PA or MPA polygon, we extracted the coastal wetland area based on the datasets in the Land Cover Data section. Our spatial analysis required the center point of the pixel of each individual ecosystem under consideration to be covered by the PA or MPA polygon in order to be classified as protected, which is a relatively strict spatial extraction technique that likely leads to lower estimates of conservation compared to previous work with differing techniques (Dabalà et al., 2023).

We used the maps of IPLs from Garnett et al. (2018) to identify IPLs that were not inside of established PAs. We calculated the total coastal wetland area within IPLs (excluding PAs and MPAs) using the same coastal wetland data sources.

Coastal Wetland Loss, Additional Sequestration, and Emissions Factors

We aggregated coastal wetland loss rates by ecosystem type (mangroves, salt marshes, seagrasses). We used data on PA and MPA effectiveness to calculate the difference in coastal wetland loss rates attributable to protection (Equation A1). We compiled baseline estimates of current rates of coastal wetland degradation from all causes (%/yr) from existing literature as shown in the “Detailed coastal wetland loss data” tab of the Supporting Data spreadsheet and used in conjunction with estimates of reductions in loss, 53–59%, associated with protection.

Equation A1.

\[ Wetland\text{ }loss_{avoided}=(Wetland\text{ }loss_{baseline}\times Reduction\text{ }in\text{ }loss) \]

We then used the ratio of coastal wetland loss in unprotected areas versus PAs to calculate avoided CO₂ emissions and additional carbon sequestration for each adoption unit. Specifically, we estimated the carbon benefits of avoided coastal wetland loss by multiplying avoided coastal wetland loss by avoided CO₂ emissions (30-yr time horizon; Equation A2) and carbon sequestration rates (30-yr time horizon; Equation A3) for each ecosystem type. Importantly, the emissions factors we used account for carbon in above- and below-ground biomass and generally do not assume 100% loss of carbon stocks because many land use impacts may retain some stored carbon, some of which is likely resistant to degradation (see the “2. current state effectiveness tab” in the spreadsheet for more information). We derived our estimates of retained carbon sequestration from global databases on sediment organic carbon burial rates in each ecosystem (see the “2. current state effectiveness tab” in the spreadsheet for more information).

Equation A2.

\[ Avoided\text{ } emissions = Wetland\text{ }loss_{avoided} \times \sum_{t=1}^{30}{Emissions} \]

Equation A3.

\[ Sequestration = Wetland\text{ }loss_{avoided} \times \sum_{t=1}^{30}{Sequestration} \]

We then estimated effectiveness (Equation A4) as the avoided CO₂ emissions and the retained carbon sequestration capacity attributable to the reduction in wetland loss conferred by protection estimated in Equations S1–S3.

Equation A4.

\[ Effectiveness = Wetland\text{ }loss_{avoided} \times (Carbon_{avoided\text{ } emissions} + Carbon_{sequestration}) \]

Finally, we calculated climate impact (Equation A5) by multiplying the adoption area under consideration by the estimated effectiveness from Equation A4.

Equation A5.

\[ Climate\text{ }impact = Effectiveness \times Adoption \]

Appendix References

Garnett, S. T., Burgess, N. D., Fa, J. E., Fernández-Llamazares, Á., Molnár, Z., Robinson, C. J., Watson, J. E. M., Zander, K. K., Austin, B., Brondizio, E. S., Collier, N. F., Duncan, T., Ellis, E., Geyle, H., Jackson, M. V., Jonas, H., Malmer, P., McGowan, B., Sivongxay, A., & Leiper, I. (2018). A spatial overview of the global importance of Indigenous lands for conservation. Nature Sustainability, 1(7), 369–374. https://doi.org/10.1038/s41893-018-0100-6

UNEP-WCMC, & Short, F. T. (2021). Global distribution of seagrasses (version 7.1) [Data set]. UN Environment World Conservation Monitoring Centre. https://doi.org/10.34892/x6r3-d211

UNEP-WCMC, & IUCN. (2024). Protected planet: The world database on protected areas (WDPA) and world database on other effective area-based conservation measures (WD-OECM) [Data set]. Retrieved November 2024, from https://www.protectedplanet.net

Zhang, X., Liu, L., Zhao, T., Chen, X., Lin, S., Wang, J., Mi, J., & Liu, W. (2023). GWL_FCS30: a global 30 m wetland map with a fine classification system using multi-sourced and time-series remote sensing imagery in 2020. Earth System Science Data, 15(1), 265–293. https://doi.org/10.5194/essd-15-265-2023

Updated Date
Coming Soon Label
Coming Soon

Protect Peatlands

Image
Image
Peatland
Coming Soon
Off
Summary

The Protect Peatlands solution is defined as legally protecting peatland ecosystems through establishment of protected areas (PAs), which preserves stored carbon and ensures continued carbon sequestration by reducing degradation of the natural hydrology, soils, and/or vegetation. This solution focuses on non-coastal peatlands that have not yet been drained or otherwise severely degraded. Reducing emissions from degraded peatlands is addressed in the Restore Peatlands solution, and mangroves located on peat soils are addressed in the Protect Coastal Wetlands solution.

Description for Social and Search
Protect Peatlands is a HIghly Recommended climate solution. Peatland soils accumulate huge amounts of carbon over centuries. Protecting peatlands reduces disturbances that turn these powerful carbon sinks into major sources of GHG emissions.
Overview

Peatlands are diverse ecosystems characterized by waterlogged, carbon-rich peat soils consisting of partially decomposed dead plant material (Figure 1). They are degraded or destroyed through clearing of vegetation and drainage for agriculture, forestry, peat extraction, or other development. An estimated 600 Gt carbon (~2,200 Gt CO₂‑eq ) is stored in peatlands, twice as much as the carbon stock in all forest biomass (Yu et al., 2010; Pan et al., 2024). Because decomposition occurs very slowly under waterlogged conditions, large amounts of plant material have accumulated in a partially decomposed state over millennia. These carbon-rich ecosystems occupy only 3–4% of land area (Xu et al., 2018b; United Nations Environment Programme [UNEP], 2022). Their protection is both feasible due to their small area and highly impactful due to their carbon density.

Figure 1. These photos show the diversity of peatlands that occur in different places, including a fen peatland and meadow complex in California (top left), a peat swamp in Indonesia (top right), a peat fen and forest in Canada (bottom left), and a peat bog in New Hampshire (bottom right). 

Image
Examples of peatland types

Photo credits: Catie and Jim Bishop | U.S. Department of Agriculture; Rhett A. Butler; Garth Lenz; Linnea Hanson | U.S. Department of Agriculture

When peatlands are drained or disturbed, the rate of carbon loss increases sharply as the accumulated organic matter begins decomposing (Figure 2). Removal of overlying vegetation produces additional GHG emissions while also slowing or stopping carbon uptake. Whereas emissions from vegetation removal occur rapidly following disturbance, peat decomposition and associated emissions can continue for centuries depending on environmental conditions and peat thickness. Peat decomposition after disturbance occurs faster in warmer climates because cold temperatures slow microbial activity. In this analysis, we evaluated tropical, subtropical, temperate, and boreal regions separately.

Figure 2. Intact peatlands (left) are a net greenhouse gas sink, sequestering carbon in peat through photosynthesis but also emitting methane due to waterlogged soils. Drained peatlands (right) are a GHG source, producing emissions from peat decomposition and drainage canals. Modified from IUCN UK Peatland Programme (2024).

Image
Diagram comparing healthy and degraded peatland

Source:  IUCN UK Peatland Programme. (2024, July 10). New briefing addresses the peatlands and methane debate.

In addition to peat decomposition, biomass removal, and lost carbon sequestration, peatland disturbance impacts methane and nitrous oxide emissions and carbon loss through waterways (Figure 2; Intergovernmental Panel on Climate Change [IPCC] Task Force on National Greenhouse Gas Inventories, 2014; UNEP, 2022). Intact peatlands are a methane source because of methane-producing microbes, which thrive under waterlogged conditions. However, carbon uptake typically outweighs methane emissions. Leifield et al. (2019) found that intact peatlands are a net carbon sink of 0.77 ± 0.15 t CO₂‑eq /ha/yr in temperate and boreal regions and 1.65 ± 0.51 t CO₂‑eq /ha/yr in tropical regions after accounting for methane emissions. Peatland drainage reduces methane emissions from the peatland itself, but the drainage ditches can become potent methane sources (Evans et al., 2015; Peacock et al., 2021). Dissolved and particulate organic carbon also run off through drainage ditches, increasing CO₂ emissions in waterways from microbial activity and abiotic processes. Finally, rates of nitrous oxide emissions increase following drainage as the nitrogen stored in the peat becomes available to microbes. 

Patterns of ongoing peatland drainage are poorly understood at the global scale, but rates of ecosystem disturbance are generally lower in PAs and on Indigenous peoples’ lands than outside of them (Li et al., 2024b; Wolf et al., 2021; Sze et al., 2021). The International Union for Conservation of Nature (IUCN) defines six levels of PAs that vary in their allowed uses, ranging from strict wilderness preserves to sustainable use areas that allow for some extraction of natural resources. All PA levels were included in this analysis (UNEP World Conservation Monitoring Center [UNEP-WCMC] and IUCN, 2024). Due to compounding uncertainties in the distributions of peatlands and Indigenous peoples’ lands, which have not yet been comprehensively mapped, and unknown rates of peatland degradation within Indigenous people’s lands, peatlands within Indigenous peoples’ lands were excluded from the tables but are discussed in the text (Garnett et al., 2018; UNEP-WCMC and IUCN, 2024). 

References

Adams, V. M., Iacona, G. D., & Possingham, H. P. (2019). Weighing the benefits of expanding protected areas versus managing existing ones. Nature Sustainability, 2(5), 404–411. Link to source: https://doi.org/10.1038/s41893-019-0275-5

Atkinson, C. L., & Alibašić, H. (2023). Prospects for governance and climate change resilience in peatland management in Indonesia. Sustainability, 15(3), Article 3. Link to source: https://doi.org/10.3390/su15031839

Austin, K. G., Elsen, P. R., Coronado, E. N. H., DeGemmis, A., Gallego-Sala, A. V., Harris, L., Kretser, H. E., Melton, J. R., Murdiyarso, D., Sasmito, S. D., Swails, E., Wijaya, A., Winton, R. S., & Zarin, D. (2025). Mismatch between global importance of peatlands and the extent of their protection. Conservation Letters, 18(1), e13080. Link to source: https://doi.org/10.1111/conl.13080

Barnes, M. D., Glew, L., Wyborn, C., & Craigie, I. D. (2018). Prevent perverse outcomes from global protected area policy. Nature Ecology & Evolution, 2(5), 759–762. Link to source: https://doi.org/10.1038/s41559-018-0501-y

Bruner, A. G., Gullison, R. E., & Balmford, A. (2004). Financial costs and shortfalls of managing and expanding protected-area systems in developing countries. BioScience, 54(12), 1119–1126. Link to source: https://doi.org/10.1641/0006-3568(2004)054[1119:FCASOM]2.0.CO;2

Conchedda, G., & Tubiello, F. N. (2020). Drainage of organic soils and GHG emissions: Validation with country data. Earth System Science Data, 12(4), 3113–3137. Link to source: https://doi.org/10.5194/essd-12-3113-2020

Davidson, N. C. (2014). How much wetland has the world lost? Long-term and recent trends in global wetland area. Marine and Freshwater Research, 65(10), 934. Link to source: https://doi.org/10.1071/MF14173

Deshmukh, C. S., Julius, D., Desai, A. R., Asyhari, A., Page, S. E., Nardi, N., Susanto, A. P., Nurholis, N., Hendrizal, M., Kurnianto, S., Suardiwerianto, Y., Salam, Y. W., Agus, F., Astiani, D., Sabiham, S., Gauci, V., & Evans, C. D. (2021). Conservation slows down emission increase from a tropical peatland in Indonesia. Nature Geoscience, 14(7), Article 7. Link to source: https://doi.org/10.1038/s41561-021-00785-2

Dietrich, O., & Behrendt, A. (2022). Wet grassland sites with shallow groundwater conditions: Effects on local meteorological characteristics. Water, 14(21), Article 21. Link to source: https://doi.org/10.3390/w14213560

Dinerstein, E., Joshi, A. R., Hahn, N. R., Lee, A. T. L., Vynne, C., Burkart, K., Asner, G. P., Beckham, C., Ceballos, G., Cuthbert, R., Dirzo, R., Fankem, O., Hertel, S., Li, B. V., Mellin, H., Pharand-Deschênes, F., Olson, D., Pandav, B., Peres, C. A., … Zolli, A. (2024). Conservation imperatives: Securing the last unprotected terrestrial sites harboring irreplaceable biodiversity. Frontiers in Science, 2. Link to source: https://doi.org/10.3389/fsci.2024.1349350

Evers, S., Yule, C. M., Padfield, R., O’Reilly, P., & Varkkey, H. (2017). Keep wetlands wet: The myth of sustainable development of tropical peatlands – implications for policies and management. Global Change Biology, 23(2), 534–549. Link to source: https://doi.org/10.1111/gcb.13422

Felipe Cadillo, M. M., & Bennett, A. (2024). Navigating socio-political threats to Amazonian peatland conservation: Insights from the Imiria Region, Peru. Sustainability, 16(16), Article 16. Link to source: https://doi.org/10.3390/su16166967

Fluet-Chouinard, E., Stocker, B. D., Zhang, Z., Malhotra, A., Melton, J. R., Poulter, B., Kaplan, J. O., Goldewijk, K. K., Siebert, S., Minayeva, T., Hugelius, G., Joosten, H., Barthelmes, A., Prigent, C., Aires, F., Hoyt, A. M., Davidson, N., Finlayson, C. M., Lehner, B., … McIntyre, P. B. (2023). Extensive global wetland loss over the past three centuries. Nature, 614(7947), 281–286. Link to source: https://doi.org/10.1038/s41586-022-05572-6

Fuller, C., Ondei, S., Brook, B. W., & Buettel, J. C. (2020). Protected-area planning in the Brazilian Amazon should prioritize additionality and permanence, not leakage mitigation. Biological Conservation, 248, 108673. Link to source: https://doi.org/10.1016/j.biocon.2020.108673

Garnett, S. T., Burgess, N. D., Fa, J. E., Fernández-Llamazares, Á., Molnár, Z., Robinson, C. J., Watson, J. E. M., Zander, K. K., Austin, B., Brondizio, E. S., Collier, N. F., Duncan, T., Ellis, E., Geyle, H., Jackson, M. V., Jonas, H., Malmer, P., McGowan, B., Sivongxay, A., & Leiper, I. (2018). A spatial overview of the global importance of Indigenous lands for conservation. Nature Sustainability, 1(7), 369–374. Link to source: https://doi.org/10.1038/s41893-018-0100-6

Girkin, N. T., & Davidson, S. J. (2024). Protect peatlands to achieve climate goals. Science, 383(6682), 490–490. Link to source: https://doi.org/10.1126/science.adn4001

Girkin, N. T., Burgess, P. J., Cole, L., Cooper, H. V., Honorio Coronado, E., Davidson, S. J., Hannam, J., Harris, J., Holman, I., McCloskey, C. S., McKeown, M. M., Milner, A. M., Page, S., Smith, J., & Young, D. (2023). The three-peat challenge: Business as usual, responsible agriculture, and conservation and restoration as management trajectories in global peatlands. Carbon Management, 14(1), 2275578. Link to source: https://doi.org/10.1080/17583004.2023.2275578

Goib, B. K., Fitriani, N., Wicaksono, S., & Chitra, J. (2018). Restoring peat, improving welfare, and empowering women: Can we have it all? Link to source: https://wri-indonesia.org/en/insights/restoring-peat-improving-welfare-and-empowering-women-can-we-have-it-all

Goldstein, A., Turner, W. R., Spawn, S. A., Anderson-Teixeira, K. J., Cook-Patton, S., Fargione, J., Gibbs, H. K., Griscom, B., Hewson, J. H., Howard, J. F., Ledezma, J. C., Page, S., Koh, L. P., Rockström, J., Sanderman, J., & Hole, D. G. (2020). Protecting irrecoverable carbon in Earth’s ecosystems. Nature Climate Change, 10(4), 287–295. Link to source: https://doi.org/10.1038/s41558-020-0738-8

Griscom, B. W., Adams, J., Ellis, P. W., Houghton, R. A., Lomax, G., Miteva, D. A., Schlesinger, W. H., Shoch, D., Siikamäki, J. V., Smith, P., Woodbury, P., Zganjar, C., Blackman, A., Campari, J., Conant, R. T., Delgado, C., Elias, P., Gopalakrishna, T., Hamsik, M. R., … Fargione, J. (2017). Natural climate solutions. Proceedings of the National Academy of Sciences, 114(44), 11645–11650. Link to source: https://doi.org/10.1073/pnas.1710465114

Harris, L. I., Richardson, K., Bona, K. A., Davidson, S. J., Finkelstein, S. A., Garneau, M., McLaughlin, J., Nwaishi, F., Olefeldt, D., Packalen, M., Roulet, N. T., Southee, F. M., Strack, M., Webster, K. L., Wilkinson, S. L., & Ray, J. C. (2022). The essential carbon service provided by northern peatlands. Frontiers in Ecology and the Environment, 20(4), 222–230. Link to source: https://doi.org/10.1002/fee.2437

Harrison, M. E., & Paoli, G. D. (2012). Managing the risk of biodiversity leakage from prioritising REDD+ in the most carbon-rich forests: The case study of peat-swamp forests in Kalimantan, Indonesia. Tropical Conservation Science, 5(4), 426–433. Link to source: https://doi.org/10.1177/194008291200500402

Hein, L., Spadaro, J. V., Ostro, B., Hammer, M., Sumarga, E., Salmayenti, R., Boer, R., Tata, H., Atmoko, D., & Castañeda, J.-P. (2022). The health impacts of Indonesian peatland fires. Environmental Health, 21(1), 62. Link to source: https://doi.org/10.1186/s12940-022-00872-w

Helbig, M., Waddington, J. M., Alekseychik, P., Amiro, B., Aurela, M., Barr, A. G., Black, T. A., Carey, S. K., Chen, J., Chi, J., Desai, A. R., Dunn, A., Euskirchen, E. S., Flanagan, L. B., Friborg, T., Garneau, M., Grelle, A., Harder, S., Heliasz, M., … Schulze, C. (2020). The biophysical climate mitigation potential of boreal peatlands during the growing season. Environmental Research Letters, 15(10), 104004. Link to source: https://doi.org/10.1088/1748-9326/abab34

Hugelius, G., Loisel, J., Chadburn, S., Jackson, R. B., Jones, M., MacDonald, G., Marushchak, M., Olefeldt, D., Packalen, M., Siewert, M. B., Treat, C., Turetsky, M., Voigt, C., & Yu, Z. (2020). Large stocks of peatland carbon and nitrogen are vulnerable to permafrost thaw. Proceedings of the National Academy of Sciences, 117(34), 20438–20446. Link to source: https://doi.org/10.1073/pnas.1916387117

Humpenöder, F., Karstens, K., Lotze-Campen, H., Leifeld, J., Menichetti, L., Barthelmes, A., & Popp, A. (2020). Peatland protection and restoration are key for climate change mitigation. Environmental Research Letters, 15(10), 104093. Link to source: https://doi.org/10.1088/1748-9326/abae2a

IPCC Task Force on National Greenhouse Gas Inventories. (2014). 2013 supplement to the 2006 IPCC guidelines for national greenhouse gas inventories: Wetlands (T. Hiraishi, T. Krug, K. Tanabe, N. Srivastava, J. Baasansuren, M. Fukuda, & T. G. Troxler, Eds.). Intergovernmental Panel on Climate Change. Link to source: https://www.ipcc.ch/site/assets/uploads/2018/03/Wetlands_Supplement_Entire_Report.pdf

IUCN. (2021). Peatlands and climate change (IUCN Issues Briefs). Link to source: https://iucn.org/sites/default/files/2022-04/iucn_issues_brief_peatlands_and_climate_change_final_nov21.pdf

IUCN UK Peatland Programme. (2024, July 10). New briefing addresses the peatlands and methane debate. Link to source: https://www.iucn-uk-peatlandprogramme.org/news/new-briefing-addresses-peatlands-and-methane-debate

Jalilov, S.-M., Rochmayanto, Y., Hidayat, D. C., Raharjo, J. T., Mendham, D., & Langston, J. D. (2025). Unveiling economic dimensions of peatland restoration in Indonesia: A systematic literature review. Ecosystem Services, 71, 101693. Link to source: https://doi.org/10.1016/j.ecoser.2024.101693

Jones, M. C., Harden, J., O’Donnell, J., Manies, K., Jorgenson, T., Treat, C., & Ewing, S. (2017). Rapid carbon loss and slow recovery following permafrost thaw in boreal peatlands. Global Change Biology, 23(3), 1109–1127. Link to source: https://doi.org/10.1111/gcb.13403

Kiely, L., Spracklen, D. V., Arnold, S. R., Papargyropoulou, E., Conibear, L., Wiedinmyer, C., Knote, C., & Adrianto, H. A. (2021). Assessing costs of Indonesian fires and the benefits of restoring peatland. Nature Communications, 12(1), 7044. Link to source: https://doi.org/10.1038/s41467-021-27353-x

Konecny, K., Ballhorn, U., Navratil, P., Jubanski, J., Page, S. E., Tansey, K., Hooijer, A., Vernimmen, R., & Siegert, F. (2016). Variable carbon losses from recurrent fires in drained tropical peatlands. Global Change Biology, 22(4), 1469–1480. Link to source: https://doi.org/10.1111/gcb.13186

Leifeld, J., & Menichetti, L. (2018). The underappreciated potential of peatlands in global climate change mitigation strategies. Nature Communications, 9(1), 1071. Link to source: https://doi.org/10.1038/s41467-018-03406-6

Leifeld, J., Wüst-Galley, C., & Page, S. (2019). Intact and managed peatland soils as a source and sink of GHGs from 1850 to 2100. Nature Climate Change, 9(12), 945–947. Link to source: https://doi.org/10.1038/s41558-019-0615-5

Li, B. V., Wu, S., Pimm, S. L., & Cui, J. (2024a). The synergy between protected area effectiveness and economic growth. Current Biology, 34(13), 2907-2920.e5. Link to source: https://doi.org/10.1016/j.cub.2024.05.044

Li, G., Fang, C., Watson, J. E. M., Sun, S., Qi, W., Wang, Z., & Liu, J. (2024b). Mixed effectiveness of global protected areas in resisting habitat loss. Nature Communications, 15(1), 8389. Link to source: https://doi.org/10.1038/s41467-024-52693-9

Loisel, J., Gallego-Sala, A. V., Amesbury, M. J., Magnan, G., Anshari, G., Beilman, D. W., Benavides, J. C., Blewett, J., Camill, P., Charman, D. J., Chawchai, S., Hedgpeth, A., Kleinen, T., Korhola, A., Large, D., Mansilla, C. A., Müller, J., van Bellen, S., West, J. B., … Wu, J. (2021). Expert assessment of future vulnerability of the global peatland carbon sink. Nature Climate Change, 11(1), 70–77. Link to source: https://doi.org/10.1038/s41558-020-00944-0

Marlier, M. E., Liu, T., Yu, K., Buonocore, J. J., Koplitz, S. N., DeFries, R. S., Mickley, L. J., Jacob, D. J., Schwartz, J., Wardhana, B. S., & Myers, S. S. (2019). Fires, smoke exposure, and public health: An integrative framework to maximize health benefits from peatland restoration. GeoHealth, 3(7), 178–189. Link to source: https://doi.org/10.1029/2019GH000191

Melton, J. R., Chan, E., Millard, K., Fortier, M., Winton, R. S., Martín-López, J. M., Cadillo-Quiroz, H., Kidd, D., & Verchot, L. V. (2022). A map of global peatland extent created using machine learning (Peat-ML). Geoscientific Model Development, 15(12), 4709–4738. Link to source: https://doi.org/10.5194/gmd-15-4709-2022

Miettinen, J., Shi, C., & Liew, S. C. (2011). Deforestation rates in insular Southeast Asia between 2000 and 2010. Global Change Biology, 17(7), 2261–2270. Link to source: https://doi.org/10.1111/j.1365-2486.2011.02398.x

Miettinen, J., Shi, C., & Liew, S. C. (2016). Land cover distribution in the peatlands of Peninsular Malaysia, Sumatra and Borneo in 2015 with changes since 1990. Global Ecology and Conservation, 6, 67–78. Link to source: https://doi.org/10.1016/j.gecco.2016.02.004

Minasny, B., Adetsu, D. V., Aitkenhead, M., Artz, R. R. E., Baggaley, N., Barthelmes, A., Beucher, A., Caron, J., Conchedda, G., Connolly, J., Deragon, R., Evans, C., Fadnes, K., Fiantis, D., Gagkas, Z., Gilet, L., Gimona, A., Glatzel, S., Greve, M. H., … Zak, D. (2024). Mapping and monitoring peatland conditions from global to field scale. Biogeochemistry, 167(4), 383–425. Link to source: https://doi.org/10.1007/s10533-023-01084-1

Minayeva, T. Yu., Bragg, O. M., & Sirin, A. A. (2017). Towards ecosystem-based restoration of peatland biodiversity. Mires and Peat, 19, 1–36. Link to source: https://doi.org/10.19189/MaP.2013.OMB.150

Müller, J., & Joos, F. (2021). Committed and projected future changes in global peatlands – continued transient model simulations since the Last Glacial Maximum. Biogeosciences, 18(12), 3657–3687. Link to source: https://doi.org/10.5194/bg-18-3657-2021

Nelson, K., Thompson, D., Hopkinson, C., Petrone, R., & Chasmer, L. (2021). Peatland-fire interactions: A review of wildland fire feedbacks and interactions in Canadian boreal peatlands. Science of The Total Environment, 769, 145212. Link to source: https://doi.org/10.1016/j.scitotenv.2021.145212

Noon, M. L., Goldstein, A., Ledezma, J. C., Roehrdanz, P. R., Cook-Patton, S. C., Spawn-Lee, S. A., Wright, T. M., Gonzalez-Roglich, M., Hole, D. G., Rockström, J., & Turner, W. R. (2022). Mapping the irrecoverable carbon in Earth’s ecosystems. Nature Sustainability, 5(1), 37–46. Link to source: https://doi.org/10.1038/s41893-021-00803-6

Pan, Y., Birdsey, R. A., Phillips, O. L., Houghton, R. A., Fang, J., Kauppi, P. E., Keith, H., Kurz, W. A., Ito, A., Lewis, S. L., Nabuurs, G.-J., Shvidenko, A., Hashimoto, S., Lerink, B., Schepaschenko, D., Castanho, A., & Murdiyarso, D. (2024). The enduring world forest carbon sink. Nature, 631(8021), 563–569. Link to source: https://doi.org/10.1038/s41586-024-07602-x

Peacock, M., Audet, J., Bastviken, D., Futter, M. N., Gauci, V., Grinham, A., Harrison, J. A., Kent, M. S., Kosten, S., Lovelock, C. E., Veraart, A. J., & Evans, C. D. (2021). Global importance of methane emissions from drainage ditches and canals. Environmental Research Letters, 16(4), 044010.  https://doi.org/10.1088/1748-9326/abeb36

Posa, M. R. C., Wijedasa, L. S., & Corlett, R. T. (2011). Biodiversity and conservation of tropical peat swamp forests. BioScience, 61(1), 49–57. Link to source: https://doi.org/10.1525/bio.2011.61.1.10

Ritson, J. P., Bell, M., Brazier, R. E., Grand-Clement, E., Graham, N. J. D., Freeman, C., Smith, D., Templeton, M. R., & Clark, J. M. (2016). Managing peatland vegetation for drinking water treatment. Scientific Reports, 6(1), 36751. Link to source: https://doi.org/10.1038/srep36751

Sasmito, S. D., Taillardat, P., Adinugroho, W. C., Krisnawati, H., Novita, N., Fatoyinbo, L., Friess, D. A., Page, S. E., Lovelock, C. E., Murdiyarso, D., Taylor, D., & Lupascu, M. (2025). Half of land use carbon emissions in Southeast Asia can be mitigated through peat swamp forest and mangrove conservation and restoration. Nature Communications, 16(1), 740. Link to source: https://doi.org/10.1038/s41467-025-55892-0

Schulz, C., Martín Brañas, M., Núñez Pérez, C., Del Aguila Villacorta, M., Laurie, N., Lawson, I. T., & Roucoux, K. H. (2019). Uses, cultural significance, and management of peatlands in the Peruvian Amazon: Implications for conservation. Biological Conservation, 235, 189–198. Link to source: https://doi.org/10.1016/j.biocon.2019.04.005

Spitzer, K., & Danks, H. V. (2006). Insect biodiversity of boreal peat bogs. Annual Review of Entomology, 51, 137–161. Link to source: https://doi.org/10.1146/annurev.ento.51.110104.151036

Strack, M., Davidson, S. J., Hirano, T., & Dunn, C. (2022). The potential of peatlands as nature-based climate solutions. Current Climate Change Reports, 8(3), 71–82. Link to source: https://doi.org/10.1007/s40641-022-00183-9

Suwarno, A., Hein, L., & Sumarga, E. (2016). Who benefits from ecosystem services? A case study for central Kalimantan, Indonesia. Environmental Management, 57(2), 331–344. Link to source: https://doi.org/10.1007/s00267-015-0623-9

Syahza, A., Suswondo, Bakce, D., Nasrul, B., Irianti, W., & Irianti, M. (2020). Peatland policy and management strategy to support sustainable development in Indonesia. Journal of Physics: Conference Series, 1655, 012151. Link to source: https://doi.org/10.1088/1742-6596/1655/1/012151

Sze, J. S., Carrasco, L. R., Childs, D., & Edwards, D. P. (2021). Reduced deforestation and degradation in Indigenous Lands pan-tropically. Nature Sustainability, 5(2), 123–130. Link to source: https://doi.org/10.1038/s41893-021-00815-2

Tan, Z. D., Lupascu, M., & Wijedasa, L. S. (2021). Paludiculture as a sustainable land use alternative for tropical peatlands: A review. Science of The Total Environment, 753, 142111. Link to source: https://doi.org/10.1016/j.scitotenv.2020.142111

Thorburn, C. C., & Kull, C. A. (2015). Peatlands and plantations in Sumatra, Indonesia: Complex realities for resource governance, rural development and climate change mitigation. Asia Pacific Viewpoint, 56(1), 153–168. Link to source: https://doi.org/10.1111/apv.12045

Thornton, S. A., Setiana, E., Yoyo, K., Dudin, Yulintine, Harrison, M. E., Page, S. E., & Upton, C. (2020). Towards biocultural approaches to peatland conservation: The case for fish and livelihoods in Indonesia. Environmental Science & Policy, 114, 341–351. Link to source: https://doi.org/10.1016/j.envsci.2020.08.018

Turetsky, M. R., Benscoter, B., Page, S., Rein, G., van der Werf, G. R., & Watts, A. (2015). Global vulnerability of peatlands to fire and carbon loss. Nature Geoscience, 8(1), 11–14. Link to source: https://doi.org/10.1038/ngeo2325

Uda, S. K., Hein, L., & Sumarga, E. (2017). Towards sustainable management of Indonesian tropical peatlands. Wetlands Ecology and Management, 25(6), 683–701. Link to source: https://doi.org/10.1007/s11273-017-9544-0

Uda, S. K., Hein, L., & Atmoko, D. (2019). Assessing the health impacts of peatland fires: A case study for Central Kalimantan, Indonesia. Environmental Science and Pollution Research, 26(30), 31315–31327. Link to source: https://doi.org/10.1007/s11356-019-06264-x

UNEP. (2022). Global peatlands assessment: The state of the world’s peatlands: Evidence for action toward the conservation, restoration, and sustainable management of peatlands. Link to source: https://www.unep.org/resources/global-peatlands-assessment-2022

UNEP-WCMC and IUCN. (2024). Protected planet report. Link to source: https://digitalreport.protectedplanet.net

Waldron, A., Adams, V., Allan, J., Arnell, A., Asner, G., Atkinson, S., Baccini, A., Baillie, J. E. M., Balmford, A., Beau, J. A., Brander, L., Brondizio, E., Bruner, A., Burgess, N., Burkart, K., Butchart, S., Button, R., Carrasco, R., Cheung, W., …Zhang, Y. P. (2020). Protecting 30% of the planet for nature: Costs, benefits and economic implications. Link to source: https://pure.iiasa.ac.at/id/eprint/16560/1/Waldron_Report_FINAL_sml.pdf

Williams, M., Reay, D., & Smith, P. (2023). Avoiding emissions versus creating sinks—Effectiveness and attractiveness to climate finance. Global Change Biology, 29(8), 2046–2049. Link to source: https://doi.org/10.1111/gcb.16598

Wolf, C., Levi, T., Ripple, W. J., Zárrate-Charry, D. A., & Betts, M. G. (2021). A forest loss report card for the world’s protected areas. Nature Ecology & Evolution, 5(4), 520–529. Link to source: https://doi.org/10.1038/s41559-021-01389-0

Worrall, F., Howden, N. J. K., Burt, T. P., Rico-Ramirez, M. A., & Kohler, T. (2022). Local climate impacts from ongoing restoration of a peatland. Hydrological Processes, 36(3), e14496. Link to source: https://doi.org/10.1002/hyp.14496

Xu, J., Morris, P. J., Liu, J., & Holden, J. (2018a). Hotspots of peatland-derived potable water use identified by global analysis. Nature Sustainability, 1(5), 246–253. Link to source: https://doi.org/10.1038/s41893-018-0064-6

Xu, J., Morris, P. J., Liu, J., & Holden, J. (2018b). PEATMAP: Refining estimates of global peatland distribution based on a meta-analysis. CATENA, 160, 134–140. Link to source: https://doi.org/10.1016/j.catena.2017.09.010

Yu, Z., Loisel, J., Brosseau, D. P., Beilman, D. W., & Hunt, S. J. (2010). Global peatland dynamics since the Last Glacial Maximum. Geophysical Research Letters, 37(13), L13402. Link to source: https://doi.org/10.1029/2010GL043584

Credits

Lead Fellow

  • Avery Driscoll

Contributors

  • Ruthie Burrows, Ph.D.

  • James Gerber, Ph.D.

  • Daniel Jasper

  • Alex Sweeney

Internal Reviewers

  • Aiyana Bodi

  • Hannah Henkin

  • Megan Matthews, Ph.D.

  • Ted Otte

  • Christina Swanson, Ph.D.

  • Paul C. West, Ph.D.

Effectiveness

We estimated that protecting a ha of peatland avoids 0.92–13.47 t CO₂‑eq /ha/yr, with substantially higher emissions reductions in subtropical and tropical regions and lower emissions reductions in boreal regions (100-yr GWP; Table 1a–d; Appendix). 

We estimated effectiveness as the avoided emissions attributable to the reduction in peatland loss conferred by protection (Equation 1). First, we calculated the biome-specific difference between the annual rate of peatland loss outside PAs (Peatland lossbaseline) versus inside PAs (Peatland lossprotected) (Appendix; Conchedda & Tubellio, 2020; Davidson et al., 2014; Miettinen et al., 2011; Miettinen et al., 2016; Uda et al., 2017, Wolf et al., 2021). We then multiplied the avoided peatland loss by the total emissions from one ha of drained peatland over 30 years. This is the sum of the total biomass carbon stock (Carbonbiomass), which degrades relatively quickly; 30 years of annual emissions from peat itself (Carbonflux); and 30 years of lost carbon sequestration potential, reflecting the carbon that would have been taken up by one ha of intact peatland in the absence of degradation (Carbonuptake) (IPCC Task Force on National Greenhouse Gas Inventories, 2014; UNEP, 2022). The carbon flux includes CO₂‑eq emissions from: 1) peat oxidation, 2) dissolved organic carbon loss through drainage, 3) the net change in on-field methane between undrained and drained states, 4) methane emissions from drainage ditches, and 5) on-field nitrous oxide emissions.

Equation 1.

\[Effectiveness = (Peatland\text{ }loss_{baseline} - Peatland\text{ }loss_{protected})\times( Carbon_{biomass} + 30\cdot Carbon_{flux} + 30\cdot Carbon_{uptake}) \]

Without rewetting, peat loss typically persists beyond 30 years and can continue for centuries (Leifield & Menichetti, 2018). Thus, this is a conservative estimate of peatland protection effectiveness that captures near-term impacts, aligns with the 30-yr cost amortization time frame, and is roughly consistent with commonly used 2050 targets. Using a longer time frame produces larger estimates of emissions from degraded peatlands and therefore higher effectiveness of peatland protection.

The effectiveness of peatland protection as defined here reflects only a small percentage of the carbon stored in peatlands because we account for the likelihood that the peatland would be destroyed without protection. Peatland protection is particularly impactful for peatlands at high risk of drainage.

Table 1. Effectiveness at avoiding emissions and sequestering carbon. Regional differences in values are driven by variation in emissions factors and baseline rates of peatland drainage.

Unit: t CO₂‑eq /ha of peatland protected/yr, 100-yr basis

Estimate 0.92

Unit: t CO₂‑eq /ha of peatland protected/yr, 100-yr basis

Estimate 4.42

Unit: t CO₂‑eq /ha of peatland protected/yr, 100-yr basis

Estimate 13.47

Unit: t CO₂‑eq /ha of peatland protected/yr, 100-yr basis

Estimate 13.23
Left Text Column Width
Cost

We estimated that the net cost of peatland protection is approximately US$1.5/ha/yr, or $0.25/t CO₂‑eq avoided (Table 2). Data related to the costs of peatland protection are very limited. These estimates reflect global averages rather than regionally specific values, and rarely include data specific to peatlands. The costs of peatland protection include up-front costs of land acquisition and ongoing costs of management and enforcement. The market price of land reflects the opportunity cost of not using the land for other purposes, such as agriculture, forestry, peat extraction, or urban development. Protecting peatlands can also generate revenue through increased tourism. Costs and revenues are highly variable across regions, depending on the costs of land and enforcement and potential for tourism. 

Dienerstein et al. (2024) estimated the initial cost of establishing a protected area for 60 high-biodiversity ecoregions. Amongst the 33 regions that were likely to contain peatlands, the median acquisition cost was US$957/ha, which we amortized over 30 years. Costs of protected area maintenance were estimated at US$9–17/ha/yr (Bruner et al., 2004; Waldron et al., 2020), though these estimates were not specific to peatlands. Additionally, these estimates reflect the costs of effective enforcement and management, but many existing protected areas lack adequate funds for effective enforcement (Adams et al., 2019; Barnes et al., 2018; Burner et al., 2004). Waldron et al. (2020) estimated that, across all ecosystems, tourism revenues directly attributable to protected area establishment were US$43/ha/yr, not including downstream revenues from industries that benefit from increased tourism. Inclusion of a tourism multiplier would substantially increase the estimated economic benefits of peatland protection.

Table 2. Cost per unit climate impact.

Unit: 2023 US$/t CO₂‑eq , 100-yr basis

Median 0.25
Left Text Column Width

Methods and Supporting Data

Learning Curve

A learning curve is defined here as falling costs with increased adoption. The costs of peatland protection do not fall with increasing adoption, so there is no learning curve for this solution.

Speed of Action

Speed of action refers to how quickly a climate solution physically affects the atmosphere after it is deployed. This is different from speed of deployment, which is the pace at which solutions are adopted.

At Project Drawdown, we define the speed of action for each climate solution as gradual, emergency brake, or delayed.

Protect Peatlands is an EMERGENCY BRAKE climate solution. It has the potential to deliver a more rapid impact than gradual and delayed solutions. Because emergency brake solutions can deliver their climate benefits quickly, they can help accelerate our efforts to address dangerous levels of climate change. For this reason, they are a high priority.

Caveats

Permanence, or the durability of stored carbon, is a caveat for emissions avoidance through peatland protection that is not addressed in this analysis. Protected peatlands could be drained if legal protections are reversed or inadequately enforced, resulting in the loss of stored carbon. Additionally, fires on peatlands have become more frequent due to climate change (Turetsky et al., 2015; Loisel et al., 2021), and can produce very large emissions pulses (Konecny et al., 2016; Nelson et al., 2021). In boreal regions, permafrost thaw can trigger large, sustained carbon losses from previously frozen peat (Hugelius et al., 2020; Jones et al., 2017). In tropical regions, climate change-induced changes in precipitation can lower water tables in intact peatlands, increasing risks of peat loss and reducing sequestration potential (Deshmukh et al., 2021). 

Additionality, or the degree to which emissions reductions are above and beyond a baseline, is another important caveat for emissions avoidance through ecosystem protection (Atkinson & Alibašić, 2023; Fuller et al., 2020; Williams et al., 2023). In this analysis, additionality was addressed by using baseline rates of peatland degradation in calculating effectiveness. Evaluating additionality is challenging and remains an active area of research.

Finally, there are substantial uncertainties in the available data on peatland areas and distributions, peatland loss rates, the drivers of peatland loss, the extent and boundaries of PAs, and the efficacy of PAs at reducing peatland disturbance. Emissions dynamics on both intact and cleared peatlands are also uncertain, particularly under different land management practices and in the context of climate change.

Current Adoption

Because peatlands are characterized by their soils rather than by overlying vegetation, they are difficult to map at the global scale (Minasny et al., 2024). Mapping peatlands remains an active area of research, and the adoption values presented here are uncertain. We estimated that 22.6 Mha of peatlands are located within strictly protected PAs (IUCN classes I or II), and 82.3 Mha are within other or unknown PA classes (Table 3a–e; UNEP, 2022; UNEP-WCMC & IUCN, 2024), representing 22% of total global peatland area (482 Mha). Because of data limitations, we did not include Indigenous peoples’ lands in subsequent analyses despite their conservation benefits. There are an additional 186 Mha of peatlands within Indigenous peoples’ lands that are not classified as PAs, with a large majority (155 Mha) located in boreal regions (Table 3; Garnett et al., 2018; UNEP, 2022).

Given the uncertainty in the global extent of peatlands, estimates of peatland protection vary. The Global Peatlands Assessment estimated that 19% (90.7 Mha) of peatlands are protected (UNEP, 2022), with large regional variations ranging from 35% of peatlands protected in Africa to only 10% in Asia. Using a peatland map from Melton et al. (2022), Austin et al. (2025) estimated that 17% of global peatlands are within PAs, and an additional 27% are located in Indigenous peoples’ lands (excluding Indigenous peoples’ lands in Canada covering large peatland areas).

Table 3. Current peatland area under protection by biome (circa 2023). Estimates are provided for two different forms of protection: “strict” protection, including IUCN classes I and II, and “nonstrict” protection, including all other IUCN classes. Regional values may not sum to global totals due to rounding.

Unit: Mha protected

Area within strict PAs 12.4
Area within non-strict PAs 41.7

Unit: Mha protected

Area within strict PAs 3.0
Area within non-strict PAs 10.1

Unit: Mha protected

Area within strict PAs 1.1
Area within non-strict PAs 1.6

Unit: Mha protected

Area within strict PAs 6.1
Area within non-strict PAs 28.9

Unit: Mha protected

Area within strict PAs 22.6
Area within non-strict PAs 82.3
Left Text Column Width
Adoption Trend

We calculated the annual rate of new peatland protection based on the year of PA establishment for areas established in 2000–2020. The median annual increase in peatland protection was 0.86 Mha (mean 2.0 Mha; Table 4a–d). This represents a roughly 0.8%/yr increase in peatlands within PAs, or protection of an additional 0.2%/yr of total global peatlands. This suggests that peatland protection is likely occurring at a somewhat slower rate than peatland degradation – which is estimated to be around 0.5% annually at the global scale – though this estimate is highly uncertain and spatially variable (Davidson et al., 2014).

There were large year-to-year differences in how much new peatland area was protected over this period, ranging from only 0.2 Mha in 2016 to 7.9 Mha in 2007. The rate at which peatland protection is increasing has been decreasing, with a median increase of 1.7 Mha/yr between 2000 and 2010 declining to 0.7 Mha/yr during 2010–2020. Recent median adoption of peatland protection by area is highest in boreal (0.5 Mha/yr, Table 4a) and tropical regions (0.2 Mha/yr, Table 4d), followed by temperate regions (0.1 Mha/yr, Table 4b) and subtropical regions (0.01 Mha/yr, Table 4c) (2010–2020). Scaled by total peatland area, however, recent rates of peatland protection are lowest in the subtropics (0.04%/yr), followed by the boreal (0.14%/yr), the tropics (0.16%/yr), and temperate regions (0.19%/yr).

Table 4. Adoption trend for peatland protection in PAs of any IUCN class (2000–2020). The 25th and 75th percentiles reflect only interannual variance.

Unit: Mha of peatland protected/yr

25th percentile 0.24
Mean 0.87
Median (50th percentile) 0.50
75th percentile 0.89

Unit: Mha of peatland protected/yr

25th percentile 0.07
Mean 0.23
Median (50th percentile) 0.10
75th percentile 0.28

Unit: Mha of peatland protected/yr

25th percentile 0.00
Mean 0.04
Median (50th percentile) 0.01
75th percentile 0.04

Unit: Mha of peatland protected/yr

25th percentile 0.05
Mean 0.84
Median (50th percentile) 0.25
75th percentile 0.83
Left Text Column Width
Adoption Ceiling

We considered the adoption ceiling to include all undrained, non-coastal peatlands and estimated this to be 425 Mha, based on the Global Peatlands Database and Global Peatlands Map (UNEP, 2022; Table 5e; Appendix). We estimated that 284 Mha of undrained peatlands remain in boreal regions (Table 5a), 26 Mha in temperate regions (Table 5b), 12 Mha in the subtropics (Table 5c), and 103 Mha in the tropics (Table 5d). The adoption ceiling represents the technical upper limit to adoption of this solution.

There is substantial uncertainty in the global extent of peatlands, which is not quantified in these adoption ceiling values. Estimates of global peatland extent from recent literature include 404 Mha (Melton et al., 2022), 423 Mha (Xu et al., 2018b), 437 Mha (Müller & Joos, 2021), 463 Mha (Leifield & Menichetti, 2018), and 488 Mha (UNEP, 2022). Several studies suggest that the global peatland area may still be underestimated (Minasny et al., 2024; UNEP, 2022). 

Table 5. Adoption ceiling: upper limit for adoption of legal protection of peatlands by biome. Values may not sum to global totals due to rounding.

Unit: Mha protected

Peatland area (Mha) 284

Unit: Mha protected

Peatland area (Mha) 26

Unit: Mha protected

Peatland area (Mha) 12

Unit: Mha protected

Peatland area (Mha) 103

Unit: Mha protected

Peatland area (Mha) 425
Left Text Column Width
Achievable Adoption

UNEP (2022) places a high priority on protecting a large majority of remaining peatlands for both climate and conservation objectives. We defined the achievable range for peatland protection as 70% (low achievable) to 90% (high achievable) of remaining undrained peatlands. Only ~19% of peatlands are currently under formal protection within PAs (UNEP, 2022; UNEP-WCMC and IUCN, 2024). However, approximately 60% of undrained peatlands are under some form of protection if peatlands within Indigenous peoples’ lands are considered (Garnett et al., 2018; UNEP, 2022; UNEP-WCMC and IUCN, 2024). While ambitious, this provides support for our selected achievable range of 70–90% (Table 6a-e). 

Ensuring effective and durable protection of these peatlands from drainage and degradation, including secure land tenure for Indigenous peoples who steward peatlands and other critical ecosystems, is a critical first step. Research suggests that local community leadership, equitable stakeholder engagement, and cross-scalar governance are needed to achieve conservation goals while also balancing social and economic outcomes through sustainable use (Atkinson & Alibašić, 2023; Cadillo & Bennett, 2024; Girkin et al., 2023; Harrison et al., 2019; Suwarno et al., 2015). Sustainable uses of peatlands include some forms of paludiculture, which can involve peatland plant cultivation, fishing, or gathering without disturbance of the hydrology or peat layer (Tan et al., 2021).

Table 6. Range of achievable adoption of peatland protection by biome.

Unit: Mha protected

Current adoption 54
Achievable – low 199
Achievable – high 255
Adoption ceiling 284

Unit: Mha protected

Current adoption 13
Achievable – low 18
Achievable – high 24
Adoption ceiling 26

Unit: Mha protected

Current adoption 3
Achievable – low 9
Achievable – high 11
Adoption ceiling 12

Unit: Mha protected

Current adoption 35
Achievable – low 72
Achievable – high 92
Adoption ceiling 103

Unit: Mha protected

Current adoption 105
Achievable – low 297
Achievable – high 382
Adoption ceiling 425
Left Text Column Width

We estimated that PAs currently reduce emissions from peatland degradation by 0.6 Gt CO₂‑eq/yr (Table 7a-e). Achievable levels of peatland protection have the potential to reduce emissions 1.3–1.7 Gt CO₂‑eq/yr, with a technical upper bound of 1.9 Gt CO₂‑eq/yr. The estimate of climate impacts under current adoption does not include the large areas of peatlands protected by Indigenous peoples but not legally recognized as PAs. Inclusion of these areas would increase the current estimated impact of peatland protection to 0.9 Gt CO₂‑eq/yr.

Other published estimates of additional emissions reductions through peatland protection are somewhat lower, with confidence intervals of 0–1.2 Gt CO₂‑eq/yr (Griscom et al., 2017; Humpenöder et al., 2020; Loisel et al., 2021; Strack et al., 2022). These studies vary in their underlying methodology and data, including the extent of peatland, the baseline rate of peatland loss, the potential for protected area expansion, which GHGs are considered, the time frame over which emissions are calculated, and whether they account for vegetation carbon loss or just emissions from the peat itself. 

Table 7. Climate impact at different levels of adoption.

Unit: Gt CO₂ ‑eq/yr, 100-yr basis

Current adoption 0.05
Achievable – low 0.18
Achievable – high 0.24
Adoption ceiling 0.26

Unit: Gt CO₂ ‑eq/yr, 100-yr basis

Current adoption 0.06
Achievable – low 0.08
Achievable – high 0.11
Adoption ceiling 0.12

Unit: Gt CO₂ ‑eq/yr, 100-yr basis

Current adoption 0.04
Achievable – low 0.12
Achievable – high 0.15
Adoption ceiling 0.17

Unit: Gt CO₂ ‑eq/yr, 100-yr basis

Current adoption 0.46
Achievable – low 0.95
Achievable – high 1.22
Adoption ceiling 1.36

Unit: Gt CO₂ ‑eq/yr, 100-yr basis

Current adoption 0.61
Achievable – low 1.33
Achievable – high 1.71
Adoption ceiling 1.90
Left Text Column Width
Additional Benefits

Extreme Weather Events

Peatland protection can help communities adapt to extreme weather. Because peatlands regulate water flows, they can reduce the risk of droughts and floods (IUCN, 2021; Ritson et al., 2016). Evidence suggests that peatlands can provide a cooling effect to the immediate environment, lowering daytime temperatures and reducing temperature extremes between day and night (Dietrich & Behrendt, 2022; Helbig et al., 2020; Worrall et al., 2022).

Health

When peatlands are drained they are susceptible to fire. Peatland fires can significantly contribute to air pollution because of the way these fires smolder (Uda et al., 2019). Smoke and pollutants, particularly PM2.5, from peatland fires can harm respiratory health and lead to premature mortality (Marlier et al., 2019). A study of peatland fires in Indonesia estimated they contribute to the premature mortality of about 33,100 adults and about 2,900 infants annually (Hein et al., 2022). Researchers have linked exposure to PM2.5 from peatland fires to increased hospitalizations, asthma, and lost workdays (Hein et al., 2022). Peatland protection mitigates exposure to air pollution and can save money from reduced health-care expenditures (Kiely et al., 2021).

Income and Work

Peatlands support the livelihoods of nearby communities, especially those in low- and middle-income countries. In the peatlands of the Amazon and Congo basins, fishing livelihoods depend on aquatic wildlife (Thornton et al., 2020). Peatlands in the Peruvian Amazon provide important goods for trade, such as palm fruit and timber, and are used for hunting by nearby populations (Schulz et al., 2019). Peatlands can also support the livelihoods of women and contribute to gender equality. For example, raw materials – purun – from Indonesian peatlands are used by women to create and sell mats used in significant events such as births, weddings, and burials (Goib et al., 2018).

Nature Protection

Peatlands are home to a wide range of species, supporting biodiversity of flora and an abundance of wildlife (UNEP, 2022; Minayeva et al., 2017; Posa et al., 2011). Because of their unique ecosystem, peatlands provide a habitat for many rare and threatened species (Posa et al., 2011). A study of Indonesian peat swamps found that the IUCN Red List classified approximately 45% of mammals and 33% of birds living in these ecosystems as threatened, vulnerable, or endangered (Posa et al., 2011). Peatlands also support a variety of insect species (Spitzer & Danks, 2006). Because of their sensitivity to environmental changes, some peatland insects can act as indicators of peatland health and play a role in conservation efforts (Spitzer & Danks, 2006).

Water Resources

Peatlands can filter water pollutants and improve water quality and are important sources of potable water for some populations (Minayeva et al., 2017). Xu et al. (2018a) estimated that peatlands store about 10% of freshwater globally, not including glacial water. Peatlands are a significant drinking water source for people in the United Kingdom and Ireland, where they provide potable water for about 71.4 million people (Xu et al., 2018a).

Water Quality

See Water Resources section above.

Risks

Leakage occurs when peatland drainage and clearing moves outside of protected area boundaries and is a risk of relying on peatland protection as an emissions reduction strategy (Harrison & Paoli, 2012; Strack et al., 2022). If the relocated clearing also occurs on peat soils, emissions from peatland drainage and degradation are relocated but not actually reduced. If disturbance is relocated to mineral soils, however, the disturbance-related emissions will typically be lower. Combining peatland protection with policies to reduce incentives for peatland clearing can help avoid leakage.

Peatland protection must be driven by or conducted in close collaboration with local communities, which often depend on peatlands for their livelihoods and economic advancement (Jalilov et al., 2025; Li et al., 2024a; Suwarno et al., 2016). Failure to include local communities in conservation efforts violates community sovereignty and can exacerbate existing socioeconomic inequities (Felipe Cadillo & Bennet, 2024; Thorburn & Kull, 2015). Effective peatland protection requires development of alternative income opportunities for communities currently dependent on peatland drainage, such as tourism; sustainable peatland use practices like paludiculture; or compensation for ecosystem service provisioning, including carbon storage (Evers et al., 2017; Girkin et al., 2023; Suwarno et al., 2016; Syahza et al., 2020; Tan et al., 2021; Uda et al., 2017).

Interactions with Other Solutions

Reinforcing

Protected areas often include multiple ecosystems. Peatland protection will likely lead to protection of other ecosystems within the same areas, and the health of nearby ecosystems is improved by the services provided by intact peatlands. 

Restored peatlands need protection to reduce the risk of future disturbance, and the health of protected peatlands can be improved through restoration of adjacent degraded peatlands.

Competing

Protecting peatlands could limit land availability for renewable energy technologies and raw material and food production. Protect Peatlands competes with the following solutions for land.

Dashboard

Solution Basics

ha protected

t CO₂-eq (100-yr)/unit/yr
0.92
units
Current 5.4×10⁷ 01.99×10⁸2.55×10⁸
Achievable (Low to High)

Climate Impact

Gt CO₂-eq (100-yr)/yr
Current 0.05 0.180.24
US$ per t CO₂-eq
0
Emergency Brake

CO₂ , CH₄, N₂O

Solution Basics

ha protected

t CO₂-eq (100-yr)/unit/yr
4.42
units
Current 1.3×10⁷ 01.8×10⁷2.4×10⁷
Achievable (Low to High)

Climate Impact

Gt CO₂-eq (100-yr)/yr
Current 0.06 0.080.11
US$ per t CO₂-eq
0
Emergency Brake

CO₂ , CH₄, N₂O

Solution Basics

ha protected

t CO₂-eq (100-yr)/unit/yr
13.47
units
Current 3.0×10⁶ 09.0×10⁶1.1×10⁷
Achievable (Low to High)

Climate Impact

Gt CO₂-eq (100-yr)/yr
Current 0.04 0.120.15
US$ per t CO₂-eq
0
Emergency Brake

CO₂ , CH₄, N₂O

Solution Basics

ha protected

t CO₂-eq (100-yr)/unit/yr
13.23
units
Current 3.5×10⁷ 07.2×10⁷9.2×10⁷
Achievable (Low to High)

Climate Impact

Gt CO₂-eq (100-yr)/yr
Current 0.46 0.951.22
US$ per t CO₂-eq
0
Emergency Brake

CO₂ , CH₄, N₂O

Trade-offs

None

Action Word
Protect
Solution Title
Peatlands
Classification
Highly Recommended

Lawmakers and Policymakers

  • Set clear designations of remaining peatlands and implement robust monitoring and enforcement methods.
  • Place bans or regulations on draining intact peatlands, compensate farmers for income losses, and offer extension services that promote protection and paludiculture (growing food on peatlands).
  • Grant Indigenous communities full property rights and autonomy and support them in monitoring, managing, and enforcing protected areas.
  • Incorporate peatland protection into national climate plans and international commitments.
  • Coordinate peatland protection efforts horizontally (e.g., across agencies) and vertically (e.g., across subnational, national, and international efforts), ensuring an inclusive process for local and Indigenous communities.
  • Use financial incentives such as subsidies, tax breaks, and payments for ecosystem services (PES) to protect peatlands from development.
  • Synthesize water management regulations to ensure local authorities, renters, and landowners coordinate sufficient water levels in peatlands.
  • Remove harmful agricultural, logging, and mining subsidies.
  • Map and utilize real-time data to monitor the status and condition of peatland areas.
  • Invest public funds in peatland conservation, restoration, sustainable management practices, specialized research facilities, and other R&D efforts.
  • Invest in fire warning, prevention, and response efforts and establish local volunteer fire prevention groups.
  • Work with farmers, civil society, and businesses to develop high-integrity carbon markets for peatlands.

Practitioners

  • Refrain from draining or developing intact peatlands.
  • Invest in peatland conservation, restoration, sustainable management practices, specialized research facilities, and other R&D efforts.
  • Participate in stakeholder engagements and assist policymakers in designating peatlands, creating regulations, and implementing robust monitoring and enforcement methods.
  • Grant Indigenous communities full property rights and autonomy and support them in monitoring, managing, and enforcing protected areas.
  • Ensure protected peatlands don’t displace, violate rights, or reduce access to vital resources for local and Indigenous communities.
  • Assist in managing and monitoring protected peatlands, utilizing real-time monitoring and satellite data.
  • Create sustainable use regulations for protected peatland areas that provide resources to the local community.
  • Conduct proactive land-use planning to avoid infrastructure or development projects that may interfere with protected peatlands or incentivize drainage.
  • Create legal grievance processes, dispute resolution mechanisms, and restitution procedures for violations or disagreements over protected peatlands.
  • Help shift public narratives to mobilize public action and build political will for protecting peatlands by creating educational campaigns and strengthening networks of stakeholders and rightsholders.
  • Take advantage of existing financial incentives such as subsidies, tax breaks, and payments for ecosystem services (PES) to protect peatlands from development.
  • Offer or create market mechanisms such as biodiversity offsets, payments for ecosystem services, voluntary high-integrity carbon markets, and debt-for-nature swaps to fund peatland protection.
  • Synthesize water management regulations to ensure local authorities, renters, and landowners coordinate sufficient water levels in peatlands.
  • Establish coordinating bodies for farmers, landowners, policymakers, and other stakeholders to manage protected areas holistically.
  • Invest in fire warning, prevention, and response efforts and establish local volunteer fire prevention groups.

Business Leaders

  • Create peat-free supply chains, utilizing data, information, and the latest technology to inform product sourcing.
  • Integrate peat-free business and investment policies and practices in net zero strategies.
  • Only purchase carbon credits from high-integrity, verifiable carbon markets and do not use them as replacements for decarbonizing operations.
  • Develop financial instruments to invest in peatlands focusing on supporting Indigenous communities.
  • Conduct proactive land-use planning to avoid infrastructure or development projects that may interfere with protected peatlands or incentivize drainage.
  • Amplify the voices of local communities and civil society to promote robust media coverage.
  • Invest in and support Indigenous and local communities' capacity for legal protection and public relations.
  • Leverage political influence to advocate for stronger peatland protection policies at national and international levels. 

Nonprofit Leaders

  • Ensure operations utilize peat-free products and supply chains.
  • Advocate for protecting peatlands and for public investments.
  • Assist in managing and monitoring protected peatlands, utilizing real-time monitoring and satellite data.
  • Provide financial support for protecting peatlands management, monitoring, and enforcement.
  • Assist in conducting proactive land-use planning to avoid infrastructure or development projects that may interfere with protected peatlands or incentivize drainage.
  • Advocate for creating legal grievance processes, dispute resolution mechanisms, and restitution procedures for violations or disagreements over protected peatlands.
  • Support high-integrity carbon markets, institutions, rules, and norms to cultivate the demand for high-quality carbon credits.
  • Share data, information, and investment frameworks that successfully avoid deforestation to support protected peatlands, businesses, and investors.
  • Help shift public narratives to mobilize public action and build political will for protecting peatlands by creating educational campaigns and strengthening networks of stakeholders and rightsholders.
  • Amplify the voices of local communities and civil society to promote robust media coverage.
  • Invest in and support Indigenous and local communities' capacity for legal protection and public relations.

Investors

  • Create peat-free investment portfolios, utilizing data, information, and the latest technology to inform investments.
  • Invest in peatland protection, monitoring, management, and enforcement mechanisms.
  • Utilize financial mechanisms such biodiversity offsets, payments for ecosystem services, voluntary high-integrity carbon markets, and debt-for-nature swaps to fund peatland protection.
  • Invest in and support Indigenous and local communities' capacity for legal protection and public relations.
  • Share data, information, and investment frameworks that successfully avoid investments that drive peatland destruction to support peatlands, other investors, and NGOs.
  • Help shift public narratives to mobilize public action and build political will for protecting peatlands by creating educational campaigns and strengthening networks of stakeholders and rightsholders.

Philanthropists and International Aid Agencies

  • Ensure operations utilize peat-free products and supply chains.
  • Advocate for protecting peatlands and for public investments.
  • Provide technical assistance to low- and middle-income countries and communities to protect peatlands.
  • Provide financial assistance to low- and middle-income countries and communities for peatland protection.
  • Assist in managing and monitoring protected peatlands, utilizing real-time monitoring and satellite data.
  • Assist in conducting proactive land-use planning to avoid infrastructure or development projects that may interfere with protected peatlands or incentivize drainage.
  • Support and finance high-integrity carbon markets, institutions, rules, and norms to cultivate the demand for high-quality carbon credits.
  • Advocate for creating legal grievance processes, dispute resolution mechanisms, and restitution procedures for violations or disagreements over protected peatlands.
  • Support peatlands, other investors, and NGOs by sharing data, information, and investment frameworks that successfully avoid financing peatland destruction.
  • Help shift public narratives to mobilize public action and build political will for protecting peatlands by creating educational campaigns and strengthening networks of stakeholders and rightsholders.
  • Amplify the voices of local communities and civil society to promote robust media coverage.
  • Invest in and support Indigenous and local communities' capacity for legal protection and public relations.
  • Financially support Indigenous land tenure.

Thought Leaders

  • Advocate for protecting peatlands and for public investments.
  • Assist in managing and monitoring protected peatlands, utilizing real-time monitoring and satellite data.
  • Assist in conducting proactive land-use planning to avoid infrastructure or development projects that may interfere with protected peatlands or incentivize drainage.
  • Provide technical assistance to low- and middle-income countries and communities to protect peatlands.
  • Advocate for creating legal grievance processes, dispute resolution mechanisms, and restitution procedures for violations or disagreements over protected peatlands.
  • Support high-integrity carbon markets, institutions, rules, and norms to cultivate the demand for high-quality carbon credits.
  • Share data, information, and investment frameworks that successfully avoid deforestation to support protected peatlands, businesses, and investors.
  • Help shift public narratives to mobilize public action and build political will for protecting peatlands by creating educational campaigns and strengthening networks of stakeholders and rightsholders.
  • Amplify the voices of local communities and civil society to promote robust media coverage.
  • Support Indigenous and local communities' capacity for legal protection and public relations.

Technologists and Researchers

  • Improve mapping of peatland area, carbon content, emissions data, and monitoring methods, utilizing field measurements, models, satellite imagery, and GIS tools.
  • Develop land-use planning tools that help avoid infrastructure or development projects that may interfere with protecting peatlands or incentivize drainage.
  • Create tools for local communities to monitor peatlands, such as mobile apps, e-learning platforms, and mapping tools.
  • Develop verifiable carbon credits using technology such as blockchain to improve the integrity of carbon markets.
  • Develop supply chain tracking software for investors and businesses seeking to create peat-free portfolios and products.

Communities, Households, and Individuals

  • Ensure purchases and investments utilize peat-free products and supply chains.
  • Advocate for protecting peatlands and for public investments.
  • Invest in fire warning, prevention, and response efforts and establish local volunteer fire prevention groups.
  • Establish coordinating bodies for farmers, landowners, policymakers, and other stakeholders to manage protected areas holistically.
  • Assist in managing and monitoring protected peatlands, utilizing real-time monitoring and satellite data.
  • Assist in conducting proactive land-use planning to avoid infrastructure or development projects that may interfere with protected peatlands or incentivize drainage.
  • Advocate for creating legal grievance processes, dispute resolution mechanisms, and restitution procedures for violations or disagreements over protected peatlands.
  • Help shift public narratives to mobilize public action and build political will for protecting peatlands by creating educational campaigns and strengthening networks of stakeholders and rightsholders.
  • Support Indigenous and local communities' capacity for legal protections and public relations.
Evidence Base

Consensus of effectiveness in reducing emissions and maintaining carbon removal: High

There is high scientific consensus that protecting peatland carbon stocks is a critical component of mitigating climate change (Girkin & Davidson, 2024; Harris et al., 2022; Leifield et al., 2019; Noon et al., 2022; Strack et al., 2022). Globally, an estimated 11–12% of peatlands have been drained for uses such as agriculture, forestry, and harvesting of peat for horticulture and fuel, with much more extensive degradation in temperate and tropical regions (~45%) than in boreal regions (~4%) (Fluet-Chouinard et al., 2023; Leifield & Menichetti, 2018; UNEP, 2022). Rates of peatland degradation are highly uncertain, and the effectiveness of PAs at reducing drainage remains unquantified. In lieu of peatland-specific data on the effectiveness of PAs at reducing drainage, we used estimates from Wolf et al. (2021), who found that PAs reduce forest loss by approximately 40.5% at the global average. 

Carbon stored in peatlands has been characterized as “irrecoverable carbon” because it takes centuries to millennia to accumulate and could not be rapidly recovered if lost (Goldstein et al., 2020; Noon et al., 2021). Degraded peatlands currently emit an estimated 1.3–1.9 Gt CO₂‑eq/yr (excluding fires), equal to ~2–4% of total global emissions (Leifield and Menichetti., 2018; UNEP, 2022). Leifield et al. (2019) projected that without protection or restoration measures, drained peatlands could produce enough emissions to consume 10–41% of the remaining emissions budget for keeping warming below 1.5–2.0 °C. Peatland drainage had produced a cumulative 80 Gt CO₂‑eq by 2015, equal to nearly two years worth of total global emissions. In a modeling study, Humpenöder et al. (2020) projected that an additional 10.3 Mha of peatlands would be degraded by 2100 in the absence of new protection efforts, increasing annual emissions from degraded peatlands by ~25% (an additional 0.42 Gt CO₂‑eq/yr  in their study). 

The results presented in this document synthesize findings from 11 global datasets, supplemented by four regional studies on peatland loss rates in Southeast Asia. We recognize that geographic bias in the information underlying global data products creates bias, and hope this work inspires research and data sharing on this topic in underrepresented regions.

Appendix

This analysis quantifies the emissions associated with peatland degradation and their potential reduction via establishment of Protected Areas (PAs). We leveraged multiple data products, including national-scale peatland area estimates, a peatland distribution map, shapefiles of PAs and Indigenous peoples’ lands, available data on rates of peatland degradation by driver, country-scale data on reductions in ecosystem degradation inside of PAs, maps of biomass carbon stocks, and biome-level emissions factors from disturbed peat soils. This appendix describes the source data products and how they were integrated. 

Peatland Extent

The global extent and distribution of peatlands is highly uncertain, and all existing peatland maps have limitations. Importantly, there is no globally accepted definition of a peatland, and different countries and data products use variable thresholds for peat depth and carbon content to define peatlands. The Global Peatland Assessment was a recent comprehensive effort to compile and harmonize existing global peatland area estimates (UNEP, 2022). We rely heavily on two products resulting from this effort: a national-scale dataset of peatland area titled the Global Peatland Database (GPD) and a map of likely peatland areas titled the Global Peatlands Map (GPM; 1 km resolution). 

Scaling Procedures

The GPM represents a known overestimate of the global peatland area, so we scaled area estimates derived from spatially explicit analyses dependent on the GPM to match total areas from the GPD. To develop a map of country-level scaling factors, we first calculated the peatland area within each country from the GPM. We calculated the country-level scaling factors as the country-level GPD values divided by the associated GPM values and converted them to a global raster. Some countries had peatland areas represented in either the GPD or GPM, but not both. Four countries had peatland areas in the GPM that were not present in the GPD, which contained 0.51 Mha of peatlands per the GPM. These areas were left unscaled. There were 38 countries with peatland areas in the GPD that did not have areas in the GPM, containing a total 0.70 Mha of peatlands. These areas, which represented 0.14% of the total peatland area in the GPD, were excluded from the scaled maps. We then multiplied the pixel-level GPM values by the scalar raster. Because of the missing countries, this scaling step very slightly overestimated (by 0.4%) total peatlands relative to the GPD. To account for this, we multiplied this intermediate map by a final global scalar (calculated as the global GPM total divided by the GPD total). This process produced a map with the same peatland distribution as the GPM but a total area that summed to that reported in the GPD.

Exclusion of Coastal Peatlands

Many coastal wetlands have peat soils, though the extent of this overlap has not been well quantified. Coastal wetlands are handled in the Protect Coastal Wetlands solution, so we excluded them from this solution to avoid double-counting. Because of the large uncertainties in both the peatland maps and available maps of coastal wetlands, we were not confident that the overlap between the two sets of maps provided a reliable estimate of the proportion of coastal wetlands located on peat soils. Therefore, we took the conservative approach of excluding all peatland pixels that were touching or overlapping with the coastline. This reduced the total peatland area considered in this solution by 5.33 Mha (1.1%). We additionally excluded degraded peatlands from the adoption ceiling and achievable range using country-level data from the GPD. Degraded peatlands will continue to be emissions sources until they are restored, so protection alone will not confer an emissions benefit.

Total Peatland Area

We conducted the analyses by latitude bands (tropical: –23.4° to 23.4°; subtropical: –35° to –23.4° and 23.4° to 35°; temperate: –35° to –50° and 35° to 50°; boreal: <–50° and >50°) in order to retain some spatial variability in emissions factors and degradation rates and drivers. We calculated the total peatland area within each latitude band based on both the scaled and unscaled peatland maps with coastal pixels excluded. We used these values as the adoption ceiling and for subsequent calculations of protected areas. 

Protected Peatland Areas

We identified protected peatland areas using the World Database on Protected Areas (WDPA, 2024), which contains boundaries for each PA and additional information, including their establishment year and IUCN management category (Ia to VI, not applicable, not reported, and not assigned). For each PA polygon, we extracted the peatland area from the unscaled version of the GPM with coastal pixels removed. 

Each PA was classified into climate zones (described above) based on the midpoint between its minimum and maximum latitude. Then, protected peatland areas were summed to the IUCN class-climate zone level, and the proportion of peatlands protected within each was calculated by dividing the protected area by the unscaled total area in each climate zone. The proportion of area protected was then multiplied by the scaled total area for each zone to calculate adoption in hectares within each IUCN class and climate zone. To evaluate trends in adoption over time, we aggregated protected areas by establishment year as reported in the WDPA. We used the same procedure to calculate the proportion of area protected using the unscaled maps, and then scale for the total area by biome. 

We used the maps of Indigenous people’s lands from Garnett et al. 2018 to identify Indigenous people’s lands that were not inside of established PAs. The total peatland area within Indigenous people’s lands process as above.

Peatland Degradation and Emissions

Broadly, we estimated annual, per-ha emissions savings from peatland protection as the difference between net carbon exchange in a protected peatland versus an unprotected peatland, accounting for all emissions pathways, the drivers of disturbance, the baseline rates of peatland disturbance, and the effectiveness of PAs at reducing ecosystem degradation. In brief, our calculation of the effectiveness of peatland protection followed Equation S1, in which the annual peatland loss avoided due to protection (%/yr) is multiplied by the 30-yr cumulative sum of emissions per ha of degraded peatland (CO₂‑eq /ha over a 30-yr period). These two terms are described in depth in the subsequent sections. 

Equation A1.

\[ Effectiveness = Peatland\text{ }loss_{avoided} \times \sum_{t=1}^{30}{Emissions} \]

Peatland Degradation Rates 

We calculated the avoided rate of peatland loss (%/yr) as the difference between the baseline rate of peatland loss without protection and the estimated rate of peatland loss within PAs (Equation A2), since PAs do not confer complete protection from ecosystem degradation. 

Equation A2.

\[ Peatland\text{ }loss_{avoided} = Peatland\text{ }loss_{baseline} \times Reduction\text{ }in\text{ }loss \]

We compiled baseline estimates of the current rates of peatland degradation from all causes (%/yr) from the existing literature (Table A1). Unfortunately, data on the rate of peatland loss within PAs are not available. However, satellite data have enabled in-depth, global-scale studies of the effectiveness of PAs at reducing tree cover loss. While not all peatlands are forested and degradation dynamics on peatlands can differ from those on forests writ large, these estimates are a reasonable approximation of the effectiveness of PAs at reducing peatland loss. We used the country-level estimates of the proportionate reduction in loss inside versus outside of PAs from Wolf et al. (2021), which we aggregated to latitude bands based on the median latitude of each country (Table A1).

Table A1. Biome-level annual baseline rate of peatland loss, the effectiveness of protection at reducing loss, and the annual avoided rate of peatland loss under protection.

Climate Zone Mean Annual Peatland Loss (%/yr) Proportionate Reduction in Loss Under Protection Avoided Loss Under Protection (%/yr)
Boreal 0.3% 0.44 0.13%
Subtropic 1.2% 0.60 0.73%
Temperate 0.6% 0.56 0.33%
Tropic 1.5% 0.41 0.63%
Left Text Column Width

Emissions Factors for Peatland Degradation

Equation S3 provides an overview of the calculation of emissions from degraded peatlands. In brief, we calculated cumulative emissions as the biomass carbon stock plus the 30-yr total of CO₂‑equivalent fluxes from peat oxidation (Pox), dissolved organic carbon losses (DOC), methane from drainage ditches (Mditch), on-field methane (Mfield), on-field nitrous oxide (N) and the lost net sequestration from an intact peatland, accounting for carbon sequestration in peat and methane emissions from intact peatlands (Seqloss).

Equation A3.

\[ \sum_{t=1}^{30}{Emissions} = Biomass + \sum_{t=1}^{30}{(P_{ox} + DOC + M_{ditch} + M_{field} + N + Seq_{loss})} \]

The IPCC Tier 1 emissions factors for peatland degradation are disaggregated by climate zone (tropical, temperate, and boreal), soil fertility status (nutrient-poor versus nutrient rich), and the driver of degradation (many subclasses of forestry, cropland, grassland, and peat extraction) (IPCC 2014; Tables 2.1–2.5). Table III.5 of Annex III of the Global Peatlands Assessment provides a summarized set of emissions factors based directly on the IPCC values but aggregated to the four coarser classes of degradation drivers listed above (UNEP, 2022), which we use for our analysis. They include the following pathways: CO₂ from peat oxidation, off-site emissions from lateral transport of dissolved organic carbon (DOC), methane emissions from the field and drainage ditches, and nitrous oxide emissions from the field. Particulate organic carbon (POC) losses may be substantial, but were not included in the IPCC methodology due to uncertainties about the fate of transported POC. These emissions factors are reported as annual rates per disturbed hectare, and emissions from these pathways continue over long periods of time.

Three additional pathways that are not included in the IPCC protocol are relevant to the emissions accounting for this analysis: the loss of carbon sequestration potential from leaving the peatland intact, the methane emissions that occur from intact peatlands, and the emissions from removal of the vegetation overlying peat soils. Leifield et al. (2019) reported the annual net carbon uptake per hectare of intact peatlands, including sequestration of carbon in peat minus naturally occurring methane emissions due to the anoxic conditions. If the peatland is not disturbed, these methane emissions and carbon sequestration will persist indefinitely on an annual basis. 

We accounted for emissions from removal of biomass using a separate protocol than emissions occurring from the peat soil due to differences in the temporal dynamics of loss. While all other emissions from peat occur on an annual basis and continue for many decades or longer, emissions from biomass occur relatively quickly. Biomass clearing produces a rapid pulse of emissions from labile carbon pools followed by a declining, but persistent, rate of emissions as more recalcitrant carbon pools decay over subsequent years. The entire biomass carbon stock is likely to be lost within 30 years. Average biomass carbon stocks over the extent of the peatland distribution in the GPM were calculated by latitude band based on the above and below ground biomass carbon stock data from Spawn et al. (2020). We presumed 100% of the biomass carbon stock is lost from peatland degradation, though in many cases some amount of biomass remains following degradation, depending on the terminal land use.

Peatland Degradation Drivers 

Emissions from peatland loss depend on the driver of degradation (e.g., forestry, cropland, peat extraction; IPCC 2014). The GPD contains national-scale estimates of historical peatland loss by driver, which we used to calculate weights for each driver, reflecting the proportion of peatland loss attributable to each driver by latitude band. We took the weighted average of the driver-specific peatland emissions factors, calculated as the sum of the products of the weights and the driver-specific emissions factors.

Appendix References

Garnett, S. T., Burgess, N. D., Fa, J. E., Fernández-Llamazares, Á., Molnár, Z., Robinson, C. J., Watson, J. E. M., Zander, K. K., Austin, B., Brondizio, E. S., Collier, N. F., Duncan, T., Ellis, E., Geyle, H., Jackson, M. V., Jonas, H., Malmer, P., McGowan, B., Sivongxay, A., & Leiper, I. (2018). A spatial overview of the global importance of Indigenous lands for conservation. Nature Sustainability, 1(7), 369–374. https://doi.org/10.1038/s41893-018-0100-6

IPCC Task Force on National Greenhouse Gas Inventories. (2014). 2013 supplement to the 2006 IPCC guidelines for national greenhouse gas inventories: Wetlands (T. Hiraishi, T. Krug, K. Tanabe, N. Srivastava, J. Baasansuren, M. Fukuda, & T. G. Troxler, Eds.). Intergovernmental Panel on Climate Change. https://www.ipcc.ch/site/assets/uploads/2018/03/Wetlands_Supplement_Entire_Report.pdf

Leifeld, J., Wüst-Galley, C., & Page, S. (2019). Intact and managed peatland soils as a source and sink of GHGs from 1850 to 2100. Nature Climate Change, 9(12), 945–947. https://doi.org/10.1038/s41558-019-0615-5

Spawn, S. A., Sullivan, C. C., Lark, T. J., & Gibbs, H. K. (2020). Harmonized global maps of above and belowground biomass carbon density in the year 2010. Scientific Data, 7(1), 112. https://doi.org/10.1038/s41597-020-0444-4

UNEP. (2022). Global peatlands assessment: The state of the world’s peatlands: Evidence for action toward the conservation, restoration, and sustainable management of peatlands. https://www.unep.org/resources/global-peatlands-assessment-2022

UNEP-WCMC and IUCN (2024), Protected Planet: The World Database on Protected Areas (WDPA) and World Database on Other Effective Area-based Conservation Measures (WD-OECM) [Online], Accessed November 2024, Cambridge, UK: UNEP-WCMC and IUCN. Available at: www.protectedplanet.net.

Wolf, C., Levi, T., Ripple, W. J., Zárrate-Charry, D. A., & Betts, M. G. (2021). A forest loss report card for the world’s protected areas. Nature Ecology & Evolution, 5(4), 520–529. https://doi.org/10.1038/s41559-021-01389-0

Updated Date
Coming Soon Label
Coming Soon

Protect Forests

Image
Image
Fog sitting among trees of a dense forest canopy
Coming Soon
Off

Key Takeaways

  • Forests store a huge amount of carbon in vegetation and soils, much of which is released when trees are cut.
  • On average, more than 16 million ha of forest are cleared each year, producing 7 Gt CO₂‑eq of GHGs.
  • At a high achievable adoption level, protecting forests could prevent the release of 3.62 Gt CO₂‑eq/yr, making it one of the most powerful nature-based climate solutions available.
  • Protecting forests also has huge benefits for biodiversity, local cooling, water quality, human health, food provisioning, tourism income for local communities, and cultural and recreational value.
Summary

We define the Protect Forests solution as the long-term protection of tree-dominated ecosystems through establishment of protected areas (PAs), managed with the primary goal of conserving nature, and land tenure for Indigenous peoples. These protections reduce forest degradation, avoiding GHG emissions and ensuring continued carbon sequestration by healthy forests. This solution addresses protection of forests on mineral soils. The Protect Peatlands and Protect Coastal Wetlands solutions address protection of forested peatlands and mangrove forests, respectively, and the Restore Forests solution addresses restoring degraded forests.

Description for Social and Search
Protect Forests is a Highly Recommended climate solution. Forest protection ensures that intact forests stay standing, avoiding GHG emissions, maintaining their ability to absorb carbon, and providing numerous other environmental benefits.
Overview

Forests store carbon in biomass and soils and serve as carbon sinks, taking up an estimated 12.8 Gt CO₂‑eq/yr  (including mangroves and forested peatlands; Pan et al., 2024). Carbon stored in forests is released into the atmosphere through deforestation and degradation, which refer to forest clearing or reductions in ecosystem integrity from human influence (DellaSala et al., 2025). Humans cleared an average of 0.4% (16.3 Mha) of global forest area annually from 2001–2019 (excluding wildfire but including mangroves and forested peatlands; Hansen et al., 2013, updated 2024). This produced a gross flux of 7.4 Gt CO₂‑eq/yr (Harris et al., 2021), equivalent to ~14% of total global GHG emissions over that period (Dhakal et al., 2022). Different forest types store varying amounts of carbon and experience different rates of clearing; in this analysis, we individually evaluate forest protection in boreal, temperate, subtropical, and tropical regions. We included woodlands in our definition of forests because they are not differentiated in the satellite-based data used in this analysis.

We consider forests to be protected if they 1) are formally designated as protected areas (PAs) (UNEP-WCMC and IUCN, 2024), or 2) are mapped as Indigenous peoples’ lands in the global study by Garnett et al. (2018). The International Union for Conservation of Nature defines PAs as areas managed primarily for the long-term conservation of nature and ecosystem services. They are disaggregated into six levels of protection, ranging from strict wilderness preserves to sustainable-use areas that allow for some natural resource extraction, including logging. We included all levels of protection in this analysis, primarily because not all PAs have been classified into these categories. We rely on existing maps of Indigenous peoples’ lands but emphasize that much of their extent has not been fully mapped nor recognized for its conservation benefits (Garnett et al., 2018). Innovative and equity-driven strategies for forest protection that recognize the land rights, sovereignty, and stewardship of Indigenous peoples and local communities are critical for achieving just and effective forest protection globally (Dawson et al., 2024; Fa et al., 2020; FAO, 2024; Garnett et al., 2018; Tran et al., 2020; Zafra-Calvo et al., 2017).

Indigenous peoples’ lands and PAs reduce, but do not eliminate, forest clearing relative to unprotected areas (Baragwanath et al., 2020; Blackman & Viet 2018; Li et al., 2024; McNicol et al., 2023; Sze et al. 2022; Wolf et al., 2023; Wade et al., 2020). We rely on estimates of how effective PA are currently for this analysis but highlight that improving management to further reduce land use change within PAs is a critical component of forest protection (Jones et al., 2018; Meng et al., 2023; Vijay et al., 2018; Visconti et al., 2019; Watson et al., 2014).

Market-based strategies and other policies can complement legal protections by increasing the value of intact forests and reducing incentives for clearing (e.g., Garett et al., 2019; Golub et al., 2021; Heilmayr et al., 2020; Lambin et al., 2018; Levy et al., 2023; Macdonald et al., 2024; Marin et al., 2022; Villoria et al., 2022; West et al., 2023). The estimates in this report are based on legal protection alone because the effectiveness of market-based strategies is difficult to quantify, but strategies such as sustainable commodities programs, reducing or redirecting agricultural subsidies, and strategic infrastructure planning will be further discussed in a future update. 

References

Adams, V. M., Iacona, G. D., & Possingham, H. P. (2019). Weighing the benefits of expanding protected areas versus managing existing ones. Nature Sustainability, 2(5), 404–411. Link to source: https://doi.org/10.1038/s41893-019-0275-5

Anderegg, W. R. L., Trugman, A. T., Badgley, G., Anderson, C. M., Bartuska, A., Ciais, P., Cullenward, D., Field, C. B., Freeman, J., Goetz, S. J., Hicke, J. A., Huntzinger, D., Jackson, R. B., Nickerson, J., Pacala, S., & Randerson, J. T. (2020). Climate-driven risks to the climate mitigation potential of forests. Science, 368(6497), eaaz7005. Link to source: https://doi.org/10.1126/science.aaz7005

Arneth, A., Leadley, P., Claudet, J., Coll, M., Rondinini, C., Rounsevell, M. D. A., Shin, Y.-J., Alexander, P., & Fuchs, R. (2023). Making protected areas effective for biodiversity, climate and food. Global Change Biology, 29(14), 3883–3894. Link to source: https://doi.org/10.1111/gcb.16664

Baragwanath, K., & Bayi, E. (2020). Collective property rights reduce deforestation in the Brazilian Amazon. Proceedings of the National Academy of Sciences, 117(34), 20495–20502. Link to source: https://doi.org/10.1073/pnas.1917874117

Barnes, M. D., Glew, L., Wyborn, C., & Craigie, I. D. (2018). Prevent perverse outcomes from global protected area policy. Nature Ecology & Evolution, 2(5), 759–762. Link to source: https://doi.org/10.1038/s41559-018-0501-y

Bliege Bird, R., & Nimmo, D. (2018). Restore the lost ecological functions of people. Nature Ecology & Evolution, 2(7), 1050–1052. Link to source: https://doi.org/10.1038/s41559-018-0576-5

Blackman, A., & Veit, P. (2018). Titled Amazon Indigenous Communities Cut Forest Carbon Emissions. Ecological Economics, 153, 56–67. Link to source: https://doi.org/10.1016/j.ecolecon.2018.06.016

Brennan, A., Naidoo, R., Greenstreet, L., Mehrabi, Z., Ramankutty, N., & Kremen, C. (2022). Functional connectivity of the world’s protected areas. Science, 376(6597), 1101–1104. Link to source: https://doi.org/10.1126/science.abl8974

Brinck, K., Fischer, R., Groeneveld, J., Lehmann, S., Dantas De Paula, M., Pütz, S., Sexton, J. O., Song, D., & Huth, A. (2017). High resolution analysis of tropical forest fragmentation and its impact on the global carbon cycle. Nature Communications, 8(1), 14855. Link to source: https://doi.org/10.1038/ncomms14855

Bruner, A. G., Gullison, R. E., & Balmford, A. (2004). Financial Costs and Shortfalls of Managing and Expanding Protected-Area Systems in Developing Countries. BioScience, 54(12), 1119–1126. Link to source: https://doi.org/10.1641/0006-3568(2004)054[1119:FCASOM]2.0.CO;2

Buotte, P. C., Law, B. E., Ripple, W. J., & Berner, L. T. (2020). Carbon sequestration and biodiversity co-benefits of preserving forests in the western United States. Ecological Applications, 30(2), e02039. Link to source: https://doi.org/10.1002/eap.2039

Curtis, P. G., Slay, C. M., Harris, N. L., Tyukavina, A., & Hansen, M. C. (2018). Classifying drivers of global forest loss. Science, 361(6407), 1108–1111. Link to source: https://doi.org/10.1126/science.aau3445

Dawson, N. M., Coolsaet, B., Bhardwaj, A., Booker, F., Brown, D., Lliso, B., Loos, J., Martin, A., Oliva, M., Pascual, U., Sherpa, P., & Worsdell, T. (2024). Is it just conservation? A typology of Indigenous peoples’ and local communities’ roles in conserving biodiversity. One Earth, 7(6), 1007–1021. Link to source: https://doi.org/10.1016/j.oneear.2024.05.001

de Souza, S. E. X. F., Vidal, E., Chagas, G. de F., Elgar, A. T., & Brancalion, P. H. S. (2016). Ecological outcomes and livelihood benefits of community-managed agroforests and second growth forests in Southeast Brazil. Biotropica, 48(6), 868–881. Link to source: https://doi.org/10.1111/btp.12388

Delacote, P., Le Velly, G., & Simonet, G. (2022). Revisiting the location bias and additionality of REDD+ projects: The role of project proponents status and certification. Resource and Energy Economics, 67, 101277. Link to source: https://doi.org/10.1016/j.reseneeco.2021.101277

Delacote, P., Velly, G. L., & Simonet, G. (2024). Distinguishing potential and effective additionality of forest conservation interventions. Environment and Development Economics, 1–21. Link to source: https://doi.org/10.1017/S1355770X24000202

DellaSala, D. A., Mackey, B., Kormos, C. F., Young, V., Boan, J. J., Skene, J. L., Lindenmayer, D. B., Kun, Z., Selva, N., Malcolm, J. R., & Laurance, W. F. (2025). Measuring forest degradation via ecological-integrity indicators at multiple spatial scales. Biological Conservation, 302, 110939. Link to source: https://doi.org/10.1016/j.biocon.2024.110939

Dhakal, S., J.C. Minx, F.L. Toth, A. Abdel-Aziz, M.J. Figueroa Meza, K. Hubacek, I.G.C. Jonckheere, Yong-Gun Kim, G.F. Nemet, S. Pachauri, X.C. Tan, T. Wiedmann, 2022: Emissions Trends and Drivers. In IPCC, 2022: Climate Change 2022: Mitigation of Climate Change. Contribution of Working Group III to the Sixth Assessment Report of the Intergovernmental Panel on Climate Change [P.R. Shukla, J. Skea, R. Slade, A. Al Khourdajie, R. van Diemen, D. McCollum, M. Pathak, S. Some, P. Vyas, R. Fradera, M. Belkacemi, A. Hasija, G. Lisboa, S. Luz, J. Malley, (eds.)]. Cambridge University Press, Cambridge, UK and New York, NY, USA. Link to source: https://doi.org/10.1017/9781009157926.004

Dinerstein, E., Joshi, A. R., Hahn, N. R., Lee, A. T. L., Vynne, C., Burkart, K., Asner, G. P., Beckham, C., Ceballos, G., Cuthbert, R., Dirzo, R., Fankem, O., Hertel, S., Li, B. V., Mellin, H., Pharand-Deschênes, F., Olson, D., Pandav, B., Peres, C. A., … Zolli, A. (2024). Conservation Imperatives: Securing the last unprotected terrestrial sites harboring irreplaceable biodiversity. Frontiers in Science, 2. Link to source: https://doi.org/10.3389/fsci.2024.1349350

Dye, A. W., Houtman, R. M., Gao, P., Anderegg, W. R. L., Fettig, C. J., Hicke, J. A., Kim, J. B., Still, C. J., Young, K., & Riley, K. L. (2024). Carbon, climate, and natural disturbance: A review of mechanisms, challenges, and tools for understanding forest carbon stability in an uncertain future. Carbon Balance and Management, 19(1), 35. Link to source: https://doi.org/10.1186/s13021-024-00282-0

Ellison, D., N. Futter, M., & Bishop, K. (2012). On the forest cover–water yield debate: From demand- to supply-side thinking. Global Change Biology, 18(3), 806–820. Link to source: https://doi.org/10.1111/j.1365-2486.2011.02589.x

ESA CCI (2019). Copernicus Climate Change Service, Climate Data Store: Land cover classification gridded maps from 1992 to present derived from satellite observation. Copernicus Climate Change Service (C3S) Climate Data Store (CDS). Accessed November 2024. Link to source: https://doi.org/10.24381/cds.006f2c9a

Fa, J. E., Watson, J. E., Leiper, I., Potapov, P., Evans, T. D., Burgess, N. D., Molnár, Z., Fernández-Llamazares, Á., Duncan, T., Wang, S., Austin, B. J., Jonas, H., Robinson, C. J., Malmer, P., Zander, K. K., Jackson, M. V., Ellis, E., Brondizio, E. S., & Garnett, S. T. (2020). Importance of Indigenous Peoples’ lands for the conservation of Intact Forest Landscapes. Frontiers in Ecology and the Environment, 18(3), 135–140. Link to source: https://doi.org/10.1002/fee.2148

FAO. 2024. The State of the World’s Forests 2024 – Forest-sector innovations towards a more sustainable future. Rome. Link to source: https://doi.org/10.4060/cd1211en

Filoso, S., Bezerra, M. O., Weiss, K. C. B., & Palmer, M. A. (2017). Impacts of forest restoration on water yield: A systematic review. PLOS ONE, 12(8), e0183210. Link to source: https://doi.org/10.1371/journal.pone.0183210

Fletcher, M.-S., Hamilton, R., Dressler, W., & Palmer, L. (2021). Indigenous knowledge and the shackles of wilderness. Proceedings of the National Academy of Sciences, 118(40), e2022218118. Link to source: https://doi.org/10.1073/pnas.2022218118

Fuller, C., Ondei, S., Brook, B. W., & Buettel, J. C. (2020). Protected-area planning in the Brazilian Amazon should prioritize additionality and permanence, not leakage mitigation. Biological Conservation, 248, 108673. Link to source: https://doi.org/10.1016/j.biocon.2020.108673

Gallemore, C., Bowsher, A., Atheeque, A., Groff, E., & Furtado, J. (n.d.). The geography of avoided deforestation and sustainable forest management offsets: The enduring question of additionality. Climate Policy, 0(0), 1–17. Link to source: https://doi.org/10.1080/14693062.2024.2383418

Gallemore, C., Bowsher, A., Atheeque, A., Groff, E., & Furtado, J. (2023). The geography of avoided deforestation and sustainable forest management offsets: The enduring question of additionality. Climate Policy, 0(0), 1–17. Link to source: https://doi.org/10.1080/14693062.2024.2383418

Garnett, S. T., Burgess, N. D., Fa, J. E., Fernández-Llamazares, Á., Molnár, Z., Robinson, C. J., Watson, J. E. M., Zander, K. K., Austin, B., Brondizio, E. S., Collier, N. F., Duncan, T., Ellis, E., Geyle, H., Jackson, M. V., Jonas, H., Malmer, P., McGowan, B., Sivongxay, A., & Leiper, I. (2018). A spatial overview of the global importance of Indigenous lands for conservation. Nature Sustainability, 1(7), 369–374. Link to source: https://doi.org/10.1038/s41893-018-0100-6

Garrett, R. D., Levy, S., Carlson, K. M., Gardner, T. A., Godar, J., Clapp, J., Dauvergne, P., Heilmayr, R., le Polain de Waroux, Y., Ayre, B., Barr, R., Døvre, B., Gibbs, H. K., Hall, S., Lake, S., Milder, J. C., Rausch, L. L., Rivero, R., Rueda, X., … Villoria, N. (2019). Criteria for effective zero-deforestation commitments. Global Environmental Change, 54, 135–147. Link to source: https://doi.org/10.1016/j.gloenvcha.2018.11.003

Gibbs, H. K., Ruesch, A. S., Achard, F., Clayton, M. K., Holmgren, P., Ramankutty, N., & Foley, J. A. (2010). Tropical forests were the primary sources of new agricultural land in the 1980s and 1990s. Proceedings of the National Academy of Sciences, 107(38), 16732–16737. Link to source: https://doi.org/10.1073/pnas.0910275107

Golub, A., Herrera, D., Leslie, G., Pietracci, B., & Lubowski, R. (2021). A real options framework for reducing emissions from deforestation: Reconciling short-term incentives with long-term benefits from conservation and agricultural intensification. Ecosystem Services, 49, 101275. Link to source: https://doi.org/10.1016/j.ecoser.2021.101275

Graham, V., Geldmann, J., Adams, V. M., Negret, P. J., Sinovas, P., & Chang, H.-C. (2021). Southeast Asian protected areas are effective in conserving forest cover and forest carbon stocks compared to unprotected areas. Scientific Reports, 11(1), 23760. Link to source: https://doi.org/10.1038/s41598-021-03188-w

Grantham, H. S., Duncan, A., Evans, T. D., Jones, K. R., Beyer, H. L., Schuster, R., Walston, J., Ray, J. C., Robinson, J. G., Callow, M., Clements, T., Costa, H. M., DeGemmis, A., Elsen, P. R., Ervin, J., Franco, P., Goldman, E., Goetz, S., Hansen, A., … Watson, J. E. M. (2020). Anthropogenic modification of forests means only 40% of remaining forests have high ecosystem integrity. Nature Communications, 11(1), 5978. Link to source: https://doi.org/10.1038/s41467-020-19493-3

Gray, C. L., Hill, S. L. L., Newbold, T., Hudson, L. N., Börger, L., Contu, S., Hoskins, A. J., Ferrier, S., Purvis, A., & Scharlemann, J. P. W. (2016). Local biodiversity is higher inside than outside terrestrial protected areas worldwide. Nature Communications, 7(1), 12306. Link to source: https://doi.org/10.1038/ncomms12306

Griscom, B. W., Adams, J., Ellis, P. W., Houghton, R. A., Lomax, G., Miteva, D. A., Schlesinger, W. H., Shoch, D., Siikamäki, J. V., Smith, P., Woodbury, P., Zganjar, C., Blackman, A., Campari, J., Conant, R. T., Delgado, C., Elias, P., Gopalakrishna, T., Hamsik, M. R., … Fargione, J. (2017). Natural climate solutions. Proceedings of the National Academy of Sciences, 114(44), 11645–11650. Link to source: https://doi.org/10.1073/pnas.1710465114

Hansen, M. C., Potapov, P. V., Moore, R., Hancher, M., Turubanova, S. A., Tyukavina, A., Thau, D., Stehman, S. V., Goetz, S. J., Loveland, T. R., Kommareddy, A., Egorov, A., Chini, L., Justice, C. O., & Townshend, J. R. G. (2013). High-Resolution Global Maps of 21st-Century Forest Cover Change. Science, 342(6160), 850–853. Link to source: https://doi.org/10.1126/science.1244693. Data available on-line from: Link to source: http://earthenginepartners.appspot.com/science-2013-global-forest. Accessed through Global Forest Watch on 01/12/2024. www.globalforestwatch.org

Harris, N. L., Gibbs, D. A., Baccini, A., Birdsey, R. A., de Bruin, S., Farina, M., Fatoyinbo, L., Hansen, M. C., Herold, M., Houghton, R. A., Potapov, P. V., Suarez, D. R., Roman-Cuesta, R. M., Saatchi, S. S., Slay, C. M., Turubanova, S. A., & Tyukavina, A. (2021). Global maps of twenty-first century forest carbon fluxes. Nature Climate Change, 11(3), 234–240. Link to source: https://doi.org/10.1038/s41558-020-00976-6

Heilmayr, R., Rausch, L. L., Munger, J., & Gibbs, H. K. (2020). Brazil’s Amazon Soy Moratorium reduced deforestation. Nature Food, 1(12), 801–810. Link to source: https://doi.org/10.1038/s43016-020-00194-5

Herrera, D., Ellis, A., Fisher, B., Golden, C. D., Johnson, K., Mulligan, M., Pfaff, A., Treuer, T., & Ricketts, T. H. (2017). Upstream watershed condition predicts rural children’s health across 35 developing countries. Nature Communications, 8(1), 811. Link to source: https://doi.org/10.1038/s41467-017-00775-2

Herrera, D., Pfaff, A., & Robalino, J. (2019). Impacts of protected areas vary with the level of government: Comparing avoided deforestation across agencies in the Brazilian Amazon. Proceedings of the National Academy of Sciences, 116(30), 14916–14925. Link to source: https://doi.org/10.1073/pnas.1802877116

Jones, K. R., Venter, O., Fuller, R. A., Allan, J. R., Maxwell, S. L., Negret, P. J., & Watson, J. E. M. (2018). One-third of global protected land is under intense human pressure. Science, 360(6390), 788–791. Link to source: https://doi.org/10.1126/science.aap9565

Kolden, C. A., Abatzoglou, J. T., Jones, M. W., & Jain, P. (2024). Wildfires in 2023. Nature Reviews Earth & Environment, 5(4), 238–240. Link to source: https://doi.org/10.1038/s43017-024-00544-y

Kreye, M. M., Adams, D. C., & Escobedo, F. J. (2014). The Value of Forest Conservation for Water Quality Protection. Forests, 5(5), Article 5. Link to source: https://doi.org/10.3390/f5050862

Lambin, E. F., Gibbs, H. K., Heilmayr, R., Carlson, K. M., Fleck, L. C., Garrett, R. D., le Polain de Waroux, Y., McDermott, C. L., McLaughlin, D., Newton, P., Nolte, C., Pacheco, P., Rausch, L. L., Streck, C., Thorlakson, T., & Walker, N. F. (2018). The role of supply-chain initiatives in reducing deforestation. Nature Climate Change, 8(2), 109–116. Link to source: https://doi.org/10.1038/s41558-017-0061-1

Lawrence, D., Coe, M., Walker, W., Verchot, L., & Vandecar, K. (2022). The unseen effects of deforestation: biophysical effects on climate. Frontiers in Forests and Global Change, 5. Link to source: https://doi.org/10.3389/ffgc.2022.756115

Levy, S. A., Cammelli, F., Munger, J., Gibbs, H. K., & Garrett, R. D. (2023). Deforestation in the Brazilian Amazon could be halved by scaling up the implementation of zero-deforestation cattle commitments. Global Environmental Change, 80, 102671. Link to source: https://doi.org/10.1016/j.gloenvcha.2023.102671

Li, G., Fang, C., Watson, J. E. M., Sun, S., Qi, W., Wang, Z., & Liu, J. (2024). Mixed effectiveness of global protected areas in resisting habitat loss. Nature Communications, 15(1), 8389. Link to source: https://doi.org/10.1038/s41467-024-52693-9

Lindenmayer, D. (2024). Key steps toward expanding protected areas to conserve global biodiversity. Frontiers in Science, 2. Link to source: https://doi.org/10.3389/fsci.2024.1426480

Lutz, J. A., Furniss, T. J., Johnson, D. J., Davies, S. J., Allen, D., Alonso, A., Anderson-Teixeira, K. J., Andrade, A., Baltzer, J., Becker, K. M. L., Blomdahl, E. M., Bourg, N. A., Bunyavejchewin, S., Burslem, D. F. R. P., Cansler, C. A., Cao, K., Cao, M., Cárdenas, D., Chang, L.-W., … Zimmerman, J. K. (2018). Global importance of large-diameter trees. Global Ecology and Biogeography, 27(7), 849–864. Link to source: https://doi.org/10.1111/geb.12747

Macdonald, K., Diprose, R., Grabs, J., Schleifer, P., Alger, J., Bahruddin, Brandao, J., Cashore, B., Chandra, A., Cisneros, P., Delgado, D., Garrett, R., & Hopkinson, W. (2024). Jurisdictional approaches to sustainable agro-commodity governance: The state of knowledge and future research directions. Earth System Governance, 22, 100227. Link to source: https://doi.org/10.1016/j.esg.2024.100227

McCallister, M., Krasovskiy, A., Platov, A., Pietracci, B., Golub, A., Lubowski, R., & Leslie, G. (2022). Forest protection and permanence of reduced emissions. Frontiers in Forests and Global Change, 5. Link to source: https://doi.org/10.3389/ffgc.2022.928518

Marin, F. R., Zanon, A. J., Monzon, J. P., Andrade, J. F., Silva, E. H. F. M., Richter, G. L., Antolin, L. A. S., Ribeiro, B. S. M. R., Ribas, G. G., Battisti, R., Heinemann, A. B., & Grassini, P. (2022). Protecting the Amazon forest and reducing global warming via agricultural intensification. Nature Sustainability, 5(12), 1018–1026. Link to source: https://doi.org/10.1038/s41893-022-00968-8

McNicol, I. M., Keane, A., Burgess, N. D., Bowers, S. J., Mitchard, E. T. A., & Ryan, C. M. (2023). Protected areas reduce deforestation and degradation and enhance woody growth across African woodlands. Communications Earth & Environment, 4(1), 1–14. Link to source: https://doi.org/10.1038/s43247-023-01053-4

Melo, F. P. L., Parry, L., Brancalion, P. H. S., Pinto, S. R. R., Freitas, J., Manhães, A. P., Meli, P., Ganade, G., & Chazdon, R. L. (2021). Adding forests to the water–energy–food nexus. Nature Sustainability, 4(2), 85–92. Link to source: https://doi.org/10.1038/s41893-020-00608-z

Meng, Z., Dong, J., Ellis, E. C., Metternicht, G., Qin, Y., Song, X.-P., Löfqvist, S., Garrett, R. D., Jia, X., & Xiao, X. (2023). Post-2020 biodiversity framework challenged by cropland expansion in protected areas. Nature Sustainability, 6(7), 758–768. Link to source: https://doi.org/10.1038/s41893-023-01093-w

Morales-Hidalgo, D., Oswalt, S. N., & Somanathan, E. (2015). Status and trends in global primary forest, protected areas, and areas designated for conservation of biodiversity from the Global Forest Resources Assessment 2015. Forest Ecology and Management, 352, 68–77. Link to source: https://doi.org/10.1016/j.foreco.2015.06.011

Mykleby, P. M., Snyder, P. K., & Twine, T. E. (2017). Quantifying the trade-off between carbon sequestration and albedo in midlatitude and high-latitude North American forests. Geophysical Research Letters, 44(5), 2493–2501. Link to source: https://doi.org/10.1002/2016GL071459

Nabuurs, G-J., R. Mrabet, A. Abu Hatab, M. Bustamante, H. Clark, P. Havlík, J. House, C. Mbow, K.N. Ninan, A. Popp, S. Roe, B. Sohngen, S. Towprayoon, 2022: Agriculture, Forestry and Other Land Uses (AFOLU). In IPCC, 2022: Climate Change 2022: Mitigation of Climate Change. Contribution of Working Group III to the Sixth Assessment Report of the Intergovernmental Panel on Climate Change [P.R. Shukla, J. Skea, R. Slade, A. Al Khourdajie, R. van Diemen, D. McCollum, M. Pathak, S. Some, P. Vyas, R. Fradera, M. Belkacemi, A. Hasija, G. Lisboa, S. Luz, J. Malley, (eds.)]. Cambridge University Press, Cambridge, UK and New York, NY, USA. Link to source: https://doi.org/10.1017/9781009157926.009

Naidoo, R., Gerkey, D., Hole, D., Pfaff, A., Ellis, A. M., Golden, C. D., Herrera, D., Johnson, K., Mulligan, M., Ricketts, T. H., & Fisher, B. (2019). Evaluating the impacts of protected areas on human well-being across the developing world. Science Advances, 5(4), eaav3006. Link to source: https://doi.org/10.1126/sciadv.aav3006

Oldekop, J. A., Rasmussen, L. V., Agrawal, A., Bebbington, A. J., Meyfroidt, P., Bengston, D. N., Blackman, A., Brooks, S., Davidson-Hunt, I., Davies, P., Dinsi, S. C., Fontana, L. B., Gumucio, T., Kumar, C., Kumar, K., Moran, D., Mwampamba, T. H., Nasi, R., Nilsson, M., … Wilson, S. J. (2020). Forest-linked livelihoods in a globalized world. Nature Plants, 6(12), 1400–1407. Link to source: https://doi.org/10.1038/s41477-020-00814-9

Pan, Y., Birdsey, R. A., Phillips, O. L., Houghton, R. A., Fang, J., Kauppi, P. E., Keith, H., Kurz, W. A., Ito, A., Lewis, S. L., Nabuurs, G.-J., Shvidenko, A., Hashimoto, S., Lerink, B., Schepaschenko, D., Castanho, A., & Murdiyarso, D. (2024). The enduring world forest carbon sink. Nature, 631(8021), 563–569. Link to source: https://doi.org/10.1038/s41586-024-07602-x

Phillips, C. A., Rogers, B. M., Elder, M., Cooperdock, S., Moubarak, M., Randerson, J. T., & Frumhoff, P. C. (2022). Escalating carbon emissions from North American boreal forest wildfires and the climate mitigation potential of fire management. Science Advances, 8(17), eabl7161. Link to source: https://doi.org/10.1126/sciadv.abl7161

Reddington, C. L., Butt, E. W., Ridley, D. A., Artaxo, P., Morgan, W. T., Coe, H., & Spracklen, D. V. (2015). Air quality and human health improvements from reductions in deforestation-related fire in Brazil. Nature Geoscience, 8(10), 768–771. Link to source: https://doi.org/10.1038/ngeo2535

Reek, J. E., Zohner, C. M., Smith, G. R., Cook-Patton, S. C., Frenne, P. D., D’Odorico, P., Floriancic, M. G., Jackson, R. B., Jones, J. A., Kirchner, J. W., Laguë, M., Liang, Y., Masuda, Y. J., McDonald, R. I., Parsons, L. A., Probst, B. S., Spector, J. T., West, T. A. P., Wolff, N. H., … Crowther, T. W. (2026). More than mitigation: The role of forests in climate adaptation. Science, 391(6786), 669–678. Link to source: https://doi.org/10.1126/science.ads4361

Richter, J., Goldman, E., Harris, N., Gibbs, D., Rose, M., Peyer, S., Richardson, S., & Velappan, H. (2024). Spatial Database of Planted Trees (SDPT Version 2.0) [Dataset]. Link to source: https://doi.org/10.46830/writn.23.00073

Rogers, B. M., Mackey, B., Shestakova, T. A., Keith, H., Young, V., Kormos, C. F., DellaSala, D. A., Dean, J., Birdsey, R., Bush, G., Houghton, R. A., & Moomaw, W. R. (2022). Using ecosystem integrity to maximize climate mitigation and minimize risk in international forest policy. Frontiers in Forests and Global Change, 5. Link to source: https://doi.org/10.3389/ffgc.2022.929281

Ruseva, T., Marland, E., Szymanski, C., Hoyle, J., Marland, G., & Kowalczyk, T. (2017). Additionality and permanence standards in California’s Forest Offset Protocol: A review of project and program level implications. Journal of Environmental Management, 198, 277–288. Link to source: https://doi.org/10.1016/j.jenvman.2017.04.082

Sarira, T. V., Zeng, Y., Neugarten, R., Chaplin-Kramer, R., & Koh, L. P. (2022). Co-benefits of forest carbon projects in Southeast Asia. Nature Sustainability, 5(5), 393–396. Link to source: https://doi.org/10.1038/s41893-022-00849-0

Seymour, F., Wolosin, M., & Gray, E. (2022, October 23). Policies underestimate forests’ full effect on the climate. World Resources Institute. Link to source: https://www.wri.org/insights/how-forests-affect-climate

Smith, C., Baker, J. C. A., & Spracklen, D. V. (2023). Tropical deforestation causes large reductions in observed precipitation. Nature, 615(7951), 270–275. Link to source: https://doi.org/10.1038/s41586-022-05690-1

Soto-Navarro, C., Ravilious, C., Arnell, A., de Lamo, X., Harfoot, M., Hill, S. L. L., Wearn, O. R., Santoro, M., Bouvet, A., Mermoz, S., Le Toan, T., Xia, J., Liu, S., Yuan, W., Spawn, S. A., Gibbs, H. K., Ferrier, S., Harwood, T., Alkemade, R., … Kapos, V. (2020). Mapping co-benefits for carbon storage and biodiversity to inform conservation policy and action. Philosophical Transactions of the Royal Society B: Biological Sciences, 375(1794), 20190128. Link to source: https://doi.org/10.1098/rstb.2019.0128

Sunderlin, W. D., Angelsen, A., Belcher, B., Burgers, P., Nasi, R., Santoso, L., & Wunder, S. (2005). Livelihoods, forests, and conservation in developing countries: An Overview. World Development, 33(9), 1383–1402. Link to source: https://doi.org/10.1016/j.worlddev.2004.10.004

Sweeney, B. W., Bott, T. L., Jackson, J. K., Kaplan, L. A., Newbold, J. D., Standley, L. J., Hession, W. C., & Horwitz, R. J. (2004). Riparian deforestation, stream narrowing, and loss of stream ecosystem services. Proceedings of the National Academy of Sciences, 101(39), 14132–14137. Link to source: https://doi.org/10.1073/pnas.0405895101

Sze, J. S., Carrasco, L. R., Childs, D., & Edwards, D. P. (2022). Reduced deforestation and degradation in Indigenous Lands pan-tropically. Nature Sustainability, 5(2), 123–130. Link to source: https://doi.org/10.1038/s41893-021-00815-2

Tauli-Corpuz, V., Alcorn, J., Molnar, A., Healy, C., & Barrow, E. (2020). Cornered by PAs: Adopting rights-based approaches to enable cost-effective conservation and climate action. World Development, 130, 104923. Link to source: https://doi.org/10.1016/j.worlddev.2020.104923

Tran, T. C., Ban, N. C., & Bhattacharyya, J. (2020). A review of successes, challenges, and lessons from Indigenous protected and conserved areas. Biological Conservation, 241, 108271. Link to source: https://doi.org/10.1016/j.biocon.2019.108271

UNEP-WCMC and IUCN (2024), Protected Planet: The World Database on Protected Areas (WDPA) and World Database on Other Effective Area-based Conservation Measures (WD-OECM) [Online], Accessed November 2024, Cambridge, UK: UNEP-WCMC and IUCN. Available at: www.protectedplanet.net

Vijay, V., Fisher, J. R. B., & Armsworth, P. R. (2022). Co-benefits for terrestrial biodiversity and ecosystem services available from contrasting land protection policies in the contiguous United States. Conservation Letters, 15(5), e12907. Link to source: https://doi.org/10.1111/conl.12907

Villoria, N., Garrett, R., Gollnow, F., & Carlson, K. (2022). Leakage does not fully offset soy supply-chain efforts to reduce deforestation in Brazil. Nature Communications, 13(1), 5476. Link to source: https://doi.org/10.1038/s41467-022-33213-z

Visconti, P., Butchart, S. H. M., Brooks, T. M., Langhammer, P. F., Marnewick, D., Vergara, S., Yanosky, A., & Watson, J. E. M. (2019). Protected area targets post-2020. Science, 364(6437), 239–241. Link to source: https://doi.org/10.1126/science.aav6886

Wade, C. M., Austin, K. G., Cajka, J., Lapidus, D., Everett, K. H., Galperin, D., Maynard, R., & Sobel, A. (2020). What Is Threatening Forests in Protected Areas? A Global Assessment of Deforestation in Protected Areas, 2001–2018. Forests, 11(5), Article 5. Link to source: https://doi.org/10.3390/f11050539

Waldron, A., Adams, V., Allan, J., Arnell, A., Asner, G., Atkinson, S., Baccini, A., Baillie, J., Balmford, A., & Austin Beau, J. (2020). Protecting 30% of the planet for nature: Costs, benefits and economic implications. Link to source: https://pure.iiasa.ac.at/id/eprint/16560/1/Waldron_Report_FINAL_sml.pdf

Walton, Z. L., Poudyal, N. C., Hepinstall-Cymerman, J., Johnson Gaither, C., & Boley, B. B. (2016). Exploring the role of forest resources in reducing community vulnerability to the heat effects of climate change. Forest Policy and Economics, 71, 94–102. Link to source: https://doi.org/10.1016/j.forpol.2015.09.001

Watson, J. E. M., Dudley, N., Segan, D. B., & Hockings, M. (2014). The performance and potential of protected areas. Nature, 515(7525), 67–73. Link to source: https://doi.org/10.1038/nature13947

West, T. A. P., Wunder, S., Sills, E. O., Börner, J., Rifai, S. W., Neidermeier, A. N., Frey, G. P., & Kontoleon, A. (2023). Action needed to make carbon offsets from forest conservation work for climate change mitigation. Science, 381(6660), 873–877. Link to source: https://doi.org/10.1126/science.ade3535

Wolf, C., Levi, T., Ripple, W. J., Zárrate-Charry, D. A., & Betts, M. G. (2021). A forest loss report card for the world’s protected areas. Nature Ecology & Evolution, 5(4), 520–529. Link to source: https://doi.org/10.1038/s41559-021-01389-0

Zafra-Calvo, N., Pascual, U., Brockington, D., Coolsaet, B., Cortes-Vazquez, J. A., Gross-Camp, N., Palomo, I., & Burgess, N. D. (2017). Towards an indicator system to assess equitable management in protected areas. Biological Conservation, 211, 134–141. Link to source: https://doi.org/10.1016/j.biocon.2017.05.014

Credits

Lead Fellow

  • Avery Driscoll

Contributors

  • Ruthie Burrows, Ph.D.

  • James Gerber, Ph.D.

  • Yusuf Jameel, Ph.D. 

  • Daniel Jasper

  • Alex Sweeney

Internal Reviewers

  • Hannah Henkin

  • Megan Matthews, Ph.D.

  • Ted Otte

  • Christina Swanson, Ph.D.

  • Paul C. West, Ph.D.

Effectiveness

We estimated that one ha of forest protection provides total carbon benefits of 0.299–2.204 t CO₂‑eq/yr depending on the biome (Table 1a–d; Appendix). This effectiveness estimate includes avoided emissions and preserved sequestration capacity attributable to the reduction in forest loss conferred by protection (Equation 1). First, we calculated the difference between the rate of human-caused forest loss outside of PAs (Forest lossbaseline) and the rate inside of PAs (Forest lossprotected). We then multiplied the annual rate of avoided forest loss by the sum of the carbon stored in one hectare of forest (Carbonstock) and the amount of carbon that one hectare of intact forest takes up over a 30-yr timeframe (Carbonsequestration).

Equation 1.

\[ Effectiveness = (Forest\text{ }loss_{baseline} - Forest\text{ }loss_{protected})\times(Carbon_{stock} + Carbon_{sequestration}) \]

Each of these factors varies across biomes. Based on our definition, for instance, the effectiveness of forest protection in boreal forests is lower than that in tropical and subtropical forests primarily because the former face lower rates of human-caused forest loss (though greater wildfire impacts). Importantly, the effectiveness of forest protection as defined here reflects only a small percentage of the carbon stored (394 t CO₂‑eq ) and absorbed (4.25 t CO₂‑eq/yr ) per hectare of forest (Harris et al., 2021). This is because humans clear ~0.4% of forest area annually, and forest protection is estimated to reduce human-caused forest loss by an average of 40.5% (Curtis et al., 2018; Wolf et al., 2023). 

Table 1. Effectiveness at reducing emissions and sequestering carbon, with carbon sequestration calculated over a 30-yr time frame. Differences in values between biomes are driven by variation in forest carbon stocks and sequestration rates, baseline rates of forest loss, and effectiveness of PAs at reducing forest loss. See the Appendix for source data and calculation details. Emissions and sequestration values may not sum to total effectiveness due to rounding.

Unit: t CO₂‑eq/ha/yr, 100-yr basis

Avoided emissions 0.207
Sequestration 0.091
Total effectiveness 0.299

Unit: t CO₂‑eq/ha/yr, 100-yr basis

Avoided emissions 0.832
Sequestration 0.572
Total effectiveness 1.403

Unit: t CO₂‑eq/ha/yr, 100-yr basis

Avoided emissions 1.860
Sequestration 0.344
Total effectiveness 2.204

Unit: t CO₂‑eq/ha/yr, 100-yr basis

Avoided emissions 1.190
Sequestration 0.300
Total effectiveness 1.489
Left Text Column Width
Cost

We estimated that forest protection costs approximately US$2/t CO₂‑eq (Table 2). Data related to the costs of forest protection are limited, and these estimates are uncertain. The costs of forest protection include up-front costs of land acquisition and ongoing costs of management and enforcement. The market price of land reflects the opportunity cost of not using the land for other purposes (e.g., agriculture or logging). Protecting forests also generates revenue, notably through increased tourism. Costs and revenues vary across regions, depending on the costs of land and enforcement and potential for tourism. 

The cost of land acquisition for ecosystem protection was estimated by Dienerstein et al. (2024), who found a median cost of US$988/ha (range: US$59–6,616/ha), which we amortized over 30 years. Costs of PA maintenance were estimated at US$9–17/ha/yr (Bruner et al., 2004; Waldron et al., 2020). These estimates reflect the costs of effective enforcement and management, but many existing PAs do not have adequate funds for effective enforcement (Adams et al., 2019; Barnes et al., 2018; Burner et al., 2004). Tourism revenues directly attributable to forest protection were estimated to be US$43/ha/yr (Waldron et al., 2020), not including downstream revenues from industries that benefit from increased tourism. Inclusion of a tourism multiplier would substantially increase the estimated economic benefits of forest protection.

Table 2. Cost per unit of climate impact.

Unit: 2023 US$/t CO₂‑eq, 100-yr basis

Median 2
Left Text Column Width

Methods and Supporting Data

Learning Curve

A learning curve is defined here as falling costs with increased adoption. The costs of forest protection do not fall with increasing adoption, so there is no learning curve for this solution.

Speed of Action

Speed of action refers to how quickly a climate solution physically affects the atmosphere after it is deployed. This is different from speed of deployment, which is the pace at which solutions are adopted.

At Project Drawdown, we define the speed of action for each climate solution as emergency brake, gradual, or delayed.

Protect Forests is an EMERGENCY BRAKE climate solution. It has the potential to deliver a more rapid impact than gradual and delayed solutions. Because emergency brake solutions can deliver their climate benefits quickly, they can help accelerate our efforts to address dangerous levels of climate change. For this reason, they are a high priority.

Caveats

Additionality, or the degree to which emissions reductions are above and beyond a baseline, is a key caveat for emissions avoided through forest protection (e.g., Fuller et al., 2020; Ruseva et al., 2017). Emissions avoided via forest protection are only considered additional if that forest would have been cleared or degraded without protection (Delacote et al., 2022; Delacote et al., 2024; Gallemore et al., 2020). In this analysis, additionality is addressed by using baseline rates of forest loss outside of PAs in the effectiveness calculation. Additionality is particularly important when forest protection is used to generate carbon offsets. However, the likelihood of forest removal in the absence of protection is often difficult to determine at the local level.

Permanence, or the durability of stored carbon over long timescales, is another important consideration not directly addressed in this solution. Carbon stored in forests can be compromised by natural factors, like drought, heat, flooding, wildfire, pests, and diseases, which are further exacerbated by climate change (Anderegg et al., 2020; Dye et al., 2024). Forest losses via wildfire in particular can create very large pulses of emissions (e.g., Kolden et al. 2024; Phillips et al. 2022) that negate accumulated carbon benefits of forest protection. Reversal of legal protections, illegal forest clearing, biodiversity loss, edge effects from roads, and disturbance from permitted uses can also cause forest losses directly or reduce ecosystem integrity, further increasing vulnerability to other stressors (McCallister et al., 2022).

Current Adoption

We estimated that approximately 1,673 Mha of forests are currently recognized as PAs or Indigenous peoples’ lands (Table 3e; Garnett et al., 2018; UNEP-WCMC and IUCN, 2024). Using two different maps of global forests that differ in their methodologies and definitions (ESA CCI, 2019; Hansen et al., 2013), we found an upper-end estimate of 1,943 Mha protected and a lower-end estimate of 1,404 Mha protected. These two maps classify forests using different thresholds for canopy cover and vegetation height, different satellite data, and different classification algorithms (see the Appendix for details). 

Based on our calculations, tropical forests make up the majority of forested PAs, with approximately 936 Mha under protection (Table 3d), followed by boreal forests (467 Mha, Table 3a), temperate forests (159 Mha, Table 3b), and subtropical forests (112 Mha, Table 3c). We estimate that 49% of all forests have some legal protection, though only 7% of forests are under strict protection (IUCN class I or II), with the remaining area protected under other IUCN levels, as OECMs, or as Indigenous peoples’ lands.

Table 3. Current (circa 2023) forest and woodland area under legal protection by biome (Mha). The low and high values are calculated using two different maps of global forest cover that differ in methodology for defining a forest (ESA CCI, 2019; Hansen et al., 2013). Biome-level values may not sum to global totals due to rounding.

Unit: Mha

Low 313
Mean 467
High 621

Unit: Mha

Low 135
Mean 159
High 183

Unit: Mha

Low 85
Mean 112
High 138

Unit: Mha

Low 872
Mean 936
High 1,000

Unit: Mha

Low 1,404
Mean 1,673
High 1,943
Left Text Column Width
Adoption Trend

We calculated the rate of PA expansion based on the year the PA was established. We do not have data on the expansion rate of Indigenous peoples’ lands, so the calculated adoption trend reflects only PAs. An average of 19 Mha of additional forests were protected each year between 2000 and 2020 (Table 4a–e; Figure 1), representing a roughly 2% increase in PAs per year (excluding Indigenous peoples’ lands that are not located in PAs). There were large year-to-year differences in how much new forest area was protected over this period, ranging from only 6.4 Mha in 2020 to over 38 Mha in both 2000 and 2006. Generally, the rate at which forest protection is increasing has been decreasing, with an average increase of 27 Mha/yr between 2000–2010 declining to 11 Mha/yr between 2010–2020. Recent rates of forest protection (2010–2020) are highest in the tropics (5.6 Mha/yr), followed by temperate regions (2.4 Mha/yr) and the boreal (2.0 Mha/yr), and lowest in the subtropics (0.7 Mha/yr).

Figure 1. Trend in forest protection by climate zone. These values reflect only the area located within PAs; Indigenous peoples’ lands, which were not included in the calculation of the adoption trend, are excluded.

Enable Download
On

Table 4. 2000–2020 adoption trend.

Unit: Mha protected/yr

25th percentile 1.3
Mean 2.8
Median (50th percentile) 2.0
75th percentile 3.4

Unit: Mha protected/yr

25th percentile 1.9
Mean 2.8
Median (50th percentile) 2.5
75th percentile 3.1

Unit: Mha protected/yr

25th percentile 0.5
Mean 1.0
Median (50th percentile) 0.7
75th percentile 1.1

Unit: Mha protected/yr

25th percentile 5.4
Mean 12.5
Median (50th percentile) 7.7
75th percentile 17.8

Unit: Mha protected/yr

25th percentile 9.1
Mean 19.0
Median (50th percentile) 12.9
75th percentile 25.4
Left Text Column Width
Adoption Ceiling

We estimated an adoption ceiling of 3,370 Mha of forests globally (Table 5e), defined as all existing forest areas, excluding peatlands and mangroves. Of the calculated adoption ceiling, 469 Mha of boreal forests (Table 5a), 282 Mha of temperate forests (Table 5b), 211 Mha of subtropical forests (Table 5c), and 734 Mha of tropical forests (Table 5d) are currently unprotected. The high and low values represent estimates of currently forested areas from two different maps of forest cover that use different methodologies and definitions (ESA CCI, 2019; Hansen et al., 2013). While it is not socially, politically, or economically realistic that all existing forests could be protected, these values represent the technical upper limit to adoption of this solution. Additionally, some PAs allow for ongoing sustainable use of resources, enabling some demand for wood products to be met via sustainable use of trees in PAs.

Table 5. Adoption ceiling.

Unit: Mha protected

Low 686
Mean 936
High 1,186

Unit: Mha protected

Low 385
Mean 441
High 498

Unit: Mha protected

Low 260
Mean 323
High 385

Unit: Mha protected

Low 1,557
Mean 1,669
High 1,782

Unit: Mha protected

Low 2,889
Mean 3,370
High 3,851
Left Text Column Width
Achievable Adoption

We defined the lower end of the achievable range for forest protection as all high integrity forests in addition to forests in existing PAs and Indigenous peoples’ lands, totaling 2,297 Mha (Table 6a–e). We estimated that there are 624 Mha of unprotected high integrity forests, based on maps of forest integrity developed by Grantham et al. (2020). High integrity forests have experienced little disturbance from human pressures (i.e., logging, agriculture, and buildings), are located further away from areas of human disturbance, and are well-connected to other forests. High integrity forests are a top priority for protection as they have particularly high value with respect to biodiversity and ecosystem service provisioning. These forests are also not currently being used to meet human demand for land or forest-derived products, and thus their protection may be more feasible. 

To estimate the upper end of the achievable range, we excluded the global areas of planted trees and tree crops from the adoption ceiling (Richter et al., 2024), comprising approximately 335 Mha globally (Table 6a–e). Planted trees include tree stands established for crops such as oil palm, products such as timber and fiber production, and those established as windbreaks or for ecosystem services such as erosion control. These stands are often actively managed and are unlikely to be protected.

Table 6. Range of achievable adoption levels. 

Unit: Mha protected

Current adoption 467
Achievable – low 847
Achievable – high 861
Adoption ceiling 936

Unit: Mha protected

Current adoption 159
Achievable – low 204
Achievable – high 378
Adoption ceiling 441

Unit: Mha protected

Current adoption 112
Achievable – low 126
Achievable – high 219
Adoption ceiling 323

Unit: Mha protected

Current adoption 936
Achievable – low 1,120
Achievable – high 1,577
Adoption ceiling 1,669

Unit: Mha protected

Current adoption 1,673
Achievable – low 2,297
Achievable – high 3,035
Adoption ceiling 3,370
Left Text Column Width

We estimated that forest protection currently avoids approximately 2.00 Gt CO₂‑eq/yr, with potential impacts of 2.49 Gt CO₂‑eq/yr at the low-achievable scenario, 3.62 Gt CO₂‑eq/yr  at the high-achievable scenario, and 4.10 Gt CO₂‑eq/yr at the adoption ceiling (Table 7a–e). Although not directly comparable due to the inclusion of different land covers, these values are aligned with Griscom et al. (2017) estimates that forest protection could avoid 3.6 Gt CO₂‑eq/yr and the IPCC estimate that protection of all ecosystems could avoid 6.2 Gt CO₂‑eq/yr (Nabuurs et al., 2022).

Note that the four adoption scenarios vary only with respect to the area under protection. Increases in either the rate of forest loss that would have occurred if the area had not been protected or in the effectiveness of PAs at avoiding forest loss would substantially increase the climate impacts of forest protection. For instance, a hypothetical 50% increase in the rate of forest loss outside of PAs would increase the carbon impacts of the current adoption, low achievable, high achievable, and adoption ceiling scenarios to 3.0, 3.7, 5.4, and 6.1 Gt CO₂‑eq/yr, respectively. Similarly, if legal forest protection reduced forest loss twice as much as it currently does, the climate impacts of the four scenarios would increase to 3.9, 4.8, 7.0, and 7.8 Gt CO₂‑eq/yr, respectively.

Table 7. Climate impact at different levels of adoption.

Unit: Gt CO₂‑eq/yr, 100-yr basis

Current adoption 0.14
Achievable – low 0.25
Achievable – high 0.26
Adoption ceiling 0.28

Unit: Gt CO₂‑eq/yr, 100-yr basis

Current adoption 0.22
Achievable – low 0.29
Achievable – high 0.53
Adoption ceiling 0.62

Unit: Gt CO₂‑eq/yr, 100-yr basis

Current adoption 0.25
Achievable – low 0.28
Achievable – high 0.48
Adoption ceiling 0.71

Unit: Gt CO₂‑eq/yr, 100-yr basis

Current adoption 1.39
Achievable – low 1.67
Achievable – high 2.35
Adoption ceiling 2.49

Unit: Gt CO₂‑eq/yr, 100-yr basis

Current adoption 2.00
Achievable – low 2.49
Achievable – high 3.62
Adoption ceiling 4.10
Left Text Column Width
Additional Benefits

Heat Stress

See Extreme Weather Events for details. 

Extreme Weather Events

Protected forests are more biodiverse and therefore more resilient and adaptable, providing higher-quality ecosystem services to surrounding communities (Gray et al., 2016). Protected forests can also buffer surrounding areas from the effects of extreme weather events. By increasing plant species richness, forest preservation can contribute to drought and fire tolerance (Buotte et al., 2020). Forests help regulate local climate by reducing daytime temperatures and temperature extremes (Lawrence et al., 2022; Reek et al., 2026). Studies have shown that the extent of forest coverage helps to alleviate vulnerability associated with heat effects (Walton et al., 2016). Tropical deforestation threatens human well-being by removing critical local cooling effects provided by tropical forests, exacerbating extreme heat conditions in already vulnerable regions (Seymour et al., 2022).

Income and Work

For a description of the Income and Work benefits, please refer to Food Security and Health sections below. 

Food Security

Protecting forests in predominantly natural areas can improve food security by supporting crop pollination of nearby agriculture. Sarira et al. (2022) found that protecting 58% of threatened forests in Southeast Asia could support the dietary needs of about 305,000–342,000 people annually. Forests also provide a key source of income and livelihoods for subsistence households and individuals (de Souza et al., 2016; Herrera et al., 2017; Naidoo et al., 2019). By maintaining this source of income through forest protection, households can earn sufficient income that contributes to food security. 

Health

Protected forests can benefit the health and well-being of surrounding communities through impacts on the environment and local economies. Herrera et al. (2017) found that in rural areas of low- and middle-income countries, household members living downstream of higher tree cover had a lower probability of diarrheal disease. Proximity to PAs can benefit local tourism, which may provide more economic resources to surrounding households. Naidoo et al. (2019) found that households near PAs in low- and middle-income countries were more likely to have higher levels of wealth and were less likely to have children who were stunted. Reducing deforestation can improve health by lowering vector-borne diseases, mitigating extreme weather impacts, and improving air quality (Reddington et al., 2015). 

Equality

Indigenous peoples have a long history of caring for and shaping landscapes that are rich with biodiversity (Fletcher et al., 2021). Indigenous communities provide vital ecological functions for preserving biodiversity, like seed dispersal and predation (Bliege Bird & Nimmo, 2018). Indigenous peoples also have spiritual and cultural ties to their lands (Garnett et al., 2018). Establishing protected areas must prioritize the return of landscapes to Indigenous peoples so traditional owners can feel the benefits of biodiversity. However, the burden of conservation should not be placed on Indigenous communities without legal recognition or support (Fa et al., 2020). In fact, land grabs and encroachments on Indigenous lands have led to greater deforestation pressure (Sze et al., 2022). Efforts to protect these lands must include legal recognition of Indigenous ownership to support a just and sustainable conservation process (Fletcher et al., 2021).

Nature Protection

Forests are home to a wide range of species and habitats and are essential for safeguarding biodiversity. Forests have high above- and below-ground carbon density, high tree species richness, and often provide habitat to threatened and endangered species (Buotte et al., 2020). PAs can aid in avoiding extinctions by protecting rare and threatened species (Dinerstein et al. 2024). In Southeast Asia, protecting 58% of threatened forests could safeguard about half of the key biodiversity areas in the region (Sarira et al., 2022). 

Water Quality

Forests act as a natural water filter and can maintain and improve water quality (Melo et al., 2021). Forests can also retain nutrients from polluting the larger watershed (Sweeney et al., 2004). For example, forests can uptake excess nutrients like nitrogen, reducing their flow into surrounding water (Sarira et al., 2022). These excessive nutrients can cause eutrophication and algal blooms that negatively impact water quality and aquatic life. 

Risks

Ecosystem protection initiatives that are not led by or undertaken in close collaboration with local communities can compromise community sovereignty and create injustice and inequity (Baragwanath et al., 2020; Blackman & Viet 2018; Dawson et al., 2024; Fa et al., 2020; FAO, 2024; Garnett et al. 2018; Sze et al. 2022; Tauli-Corpuz et al., 2020). Forest protection has the potential to be a win-win for climate and communities, but only if PAs are established with respect to livelihoods and other socio-ecological impacts, ensuring equity in procedures, recognition, and the distribution of benefits (Zafra-Calvo et al., 2017).

Leakage is a key risk of relying on forest protection as a climate solution. Leakage occurs when deforestation-related activities move outside of PA boundaries, resulting in the relocation of, rather than a reduction in, emissions from forest loss. If forest protection efforts are not coupled with policies to reduce incentives for forest clearing, leakage will likely offset some of the emissions avoided through forest protection. Additional research is needed to comprehensively quantify the magnitude of leakage effects, though two regional-scale studies found only small negative effects (Fuller et al., 2020; Herrera et al., 2019).

Interactions with Other Solutions

Reinforcing

Other intact and degraded ecosystems often occur within areas of forest protection. Therefore, forest protection can facilitate natural restoration of these other degraded ecosystems, and increase the health of adjacent ecosystems.

Forest protection helps restored ecosystems avoid future degradation and can also accelerate the adoption of improved forest management practices

Competing

Protecting forests could limit land availability for renewable energy technologies and raw material and food production. Protect Forests competes with the following solutions for land

This solution reduces the supply of wood. This limits the wood available as raw material to the following solutions that use it.

Dashboard

Solution Basics

ha protected

t CO₂-eq (100-yr)/unit/yr
0.299
units
Current 4.67×10⁸ 08.47×10⁸8.61×10⁸
Achievable (Low to High)

Climate Impact

Gt CO₂-eq (100-yr)/yr
Current 0.14 0.250.26
US$ per t CO₂-eq
2
Emergency Brake

CO₂

Solution Basics

ha protected

t CO₂-eq (100-yr)/unit/yr
1.403
units
Current 1.59×10⁸ 02.04×10⁸3.78×10⁸
Achievable (Low to High)

Climate Impact

Gt CO₂-eq (100-yr)/yr
Current 0.22 0.290.53
US$ per t CO₂-eq
2
Emergency Brake

CO₂

Solution Basics

ha protected

t CO₂-eq (100-yr)/unit/yr
2.204
units
Current 1.12×10⁸ 01.26×10⁸2.19×10⁸
Achievable (Low to High)

Climate Impact

Gt CO₂-eq (100-yr)/yr
Current 0.25 0.280.48
US$ per t CO₂-eq
2
Emergency Brake

CO₂

Solution Basics

ha protected

t CO₂-eq (100-yr)/unit/yr
1.489
units
Current 9.36×10⁸ 01.12×10⁹1.577×10⁹
Achievable (Low to High)

Climate Impact

Gt CO₂-eq (100-yr)/yr
Current 1.39 1.672.35
US$ per t CO₂-eq
2
Emergency Brake

CO₂

% tree cover
0100

Tree cover, 2000 (excluding mangroves and peatlands)

We exclude mangroves and peatlands because they are addressed in other solutions.

Global Forest Watch (2023). Global peatlands [Data set]. Retrieved December 6, 2024 from Link to source: https://data.globalforestwatch.org/datasets/gfw::global-peatlands/about

Hansen, M.C., Potapov, P.V., Moore, R., Hancher, M., Turubanova, S.A., Tyukavina, A., Thau, D., Stehman, S.V., Goetz, S.J., Loveland, T.R., Kommareddy, A., Egorov, A., Chini, L., Justice, C.O., and Townshend, J.R.G. (2013). High-resolution global maps of 21st-century forest cover change [Data set]. Science 342 (15 November): 850-53. Link to source: https://glad.earthengine.app/view/global-forest-change

UNEP-WCMC (2025). Ocean+ habitats (version 1.3) [Data set]. Retrieved November 2024 from habitats.oceanplus.org

% tree cover
0100

Tree cover, 2000 (excluding mangroves and peatlands)

We exclude mangroves and peatlands because they are addressed in other solutions.

Global Forest Watch (2023). Global peatlands [Data set]. Retrieved December 6, 2024 from Link to source: https://data.globalforestwatch.org/datasets/gfw::global-peatlands/about

Hansen, M.C., Potapov, P.V., Moore, R., Hancher, M., Turubanova, S.A., Tyukavina, A., Thau, D., Stehman, S.V., Goetz, S.J., Loveland, T.R., Kommareddy, A., Egorov, A., Chini, L., Justice, C.O., and Townshend, J.R.G. (2013). High-resolution global maps of 21st-century forest cover change [Data set]. Science 342 (15 November): 850-53. Link to source: https://glad.earthengine.app/view/global-forest-change

UNEP-WCMC (2025). Ocean+ habitats (version 1.3) [Data set]. Retrieved November 2024 from habitats.oceanplus.org

Maps Introduction

The adoption, potential adoption, and effectiveness of forest protection are highly geographically variable. While forest protection can help avoid emissions anywhere that forests occur, areas with high rates of forest loss from human drivers and particularly carbon-rich forests have the greatest potential for avoiding emissions via forest protection. The tropics and subtropics are high-priority areas for forest protection as they contain 55% of currently unprotected forest area, forest loss due to agricultural expansion is particularly concentrated in these regions (Curtis et al., 2018; West et al., 2014; Gibbs et al., 2010), and tend to have larger biomass carbon stocks than boreal forests (Harris et al., 2021). 

Developed countries also have significant potential to protect remaining old and long unlogged forests and foster recovery in secondary natural forests. The top 10 forested countries include Canada, the USA, Russia and even Australia, with the latter moving towards ending commodity production in its natural forests and increasing formal protection. Restoration of degraded forests is addressed in the Forest Restoration solution, but including regenerating forests in well designed protected areas is well within the capacity of every developed country.

Buffering and reconnecting existing high integrity forests is a low risk climate solution that increases current and future forest ecosystem resilience and adaptive capacity (Brennan et al., 2022; Brink et al., 2017; Grantham et al., 2020; Rogers et al., 2022). Forests with high ecological integrity provide outsized benefits for carbon storage and biodiversity and have greater resilience, making them top priorities for protection (Grantham et al., 2020; Rogers et al., 2022). Within a given forest, large-diameter trees similarly provide outsized carbon storage and biodiversity benefits, comprising only 1% of trees globally but storing 50% of the above ground forest carbon (Lutz et al., 2018). Additionally, forests that improve protected area connectivity (Brennan et al., 2022; Brink et al., 2017), areas at high risk of loss (particularly to expansion of commodity agriculture; Curtis et al., 2018; Hansen et al., 2013), and areas with particularly large or specialized benefits for biodiversity, ecosystem services, and human well-being (Dinerstein et al., 2024; Sarira et al., 2022; Soto-Navarro et al., 2020) may be key targets for forest protection.

Action Word
Protect
Solution Title
Forests
Classification
Highly Recommended

Lawmakers and Policymakers

  • Set achievable targets and pledges for PA designation and set clear effectiveness goals for PAs, emphasizing the effectiveness of current PAs before seeking to expand designations.
  • Use a variety of indicators to measure effectiveness, such as estimated avoided deforestation.
  • Ensure public procurement utilizes deforestation-free products and supply chains.
  • Grant Indigenous communities full property rights and autonomy and support them in monitoring, managing, and enforcing PAs.
  • Ensure PAs do not displace, violate rights, or reduce access to vital resources for local and Indigenous communities.
  • Invest in PA infrastructure, monitoring, management, and enforcement mechanisms.
  • Utilize real-time monitoring and satellite data such as the “Real-Time System for Detection of Deforestation” (DETER).
  • Join, support, or create certification schemes like the Forest Stewardship Council for sustainable logging practices.
  • Conduct proactive land-use planning to avoid roads and other development projects that may interfere with PAs or incentivize deforestation.
  • Create processes for legal grievances, dispute resolution, and restitution.
  • Remove harmful agricultural and logging subsidies.
  • Prioritize reducing food loss and waste.
  • Create education programs that educate the public on PA regulations, the benefits of the regulations, and how to use forest resources sustainably.

Practitioners

  • Set achievable targets and pledges for PA designation and set clear effectiveness goals for PAs, emphasizing the effectiveness of current PAs before seeking to expand designations
  • Use a variety of indicators to measure effectiveness, such as estimated avoided deforestation.
  • Ensure PAs do not displace, violate rights, or reduce access to vital resources for local and Indigenous communities.
  • Utilize real-time monitoring and satellite data such as the “Real-Time System for Detection of Deforestation” (DETER).
  • Create sustainable use regulations for PA areas that provide resources to the local community.
  • Conduct proactive land-use planning to avoid infrastructure or development projects that may interfere with PAs or incentivize deforestation.
  • Grant Indigenous communities full property rights and autonomy and support them in monitoring, managing, and enforcing PAs.
  • Join, support, or create certification schemes like the Forest Stewardship Council for sustainable logging practices.
  • Create processes for legal grievances, dispute resolution, and restitution.
  • Create education programs that educate the public on PA regulations, the benefits of the regulations, and how to use forest resources sustainably.

Business Leaders

  • Create deforestation-free supply chains, utilizing data, information, and the latest technology to inform product sourcing.
  • Integrate deforestation-free business and investment policies and practices in Net-Zero strategies.
  • Only purchase carbon credits from high-integrity, verifiable carbon markets and do not use them as replacements for reducing emissions.
  • Help shift the public narrative around carbon markets as integrity increases to boost education, dialogue, and awareness.
  • Develop financial instruments to invest in PA jurisdictions, focusing on supporting Indigenous communities.
  • Join or create public-private partnerships, alliances, or coalitions of stakeholders and rightsholders to support PAs and advance deforestation-free markets.
  • Join, support, or create certification schemes like the Forest Stewardship Council for sustainable logging practices.
  • Conduct proactive land-use planning to avoid infrastructure or development projects that may interfere with PAs or incentivize deforestation.
  • Amplify the voices of local communities and civil society to promote robust media coverage.
  • Invest in and support Indigenous and local communities' capacity for public relations and communications.
  • Support education programs that educate the public on PA regulations, the benefits of the regulations, and how to use forest resources sustainably.
  • Leverage political influence to advocate for stronger PA policies at national and international levels, especially policies that reduce deforestation pressure. 

Nonprofit Leaders

  • Ensure operations utilize deforestation-free products and supply chains.
  • Advocate for PAs and for public investments and evaluation indicators to strengthen the effectiveness of PAs.
  • Assist in managing and monitoring PAs, utilizing real-time monitoring and satellite data such as the “Real-Time System for Detection of Deforestation” (DETER).
  • Provide financial support for PAs management, monitoring, and enforcement.
  • Assist in conducting proactive land-use planning to avoid infrastructure or development projects that may interfere with PAs or incentivize deforestation.
  • Advocate for creating legal grievance processes, dispute resolution mechanisms, and restitution procedures for violations or disagreements over PAs.
  • Support high-integrity carbon markets, institutions, rules, and norms to cultivate the demand for high-quality carbon credits.
  • Help shift the public narrative around carbon markets as integrity increases to boost education, dialogue, and awareness.
  • Support PAs, businesses, and investors by sharing data, information, and investment frameworks that successfully avoid deforestation.
  • Help shift public narratives to mobilize public action and build political will for PAs by creating educational campaigns and strengthening networks of stakeholders and rightsholders.
  • Join, support, or create certification schemes like the Forest Stewardship Council for sustainable logging practices.
  • Amplify the voices of local communities and civil society to promote robust media coverage.
  • Invest in and support Indigenous and local communities' capacity for legal protection and public relations.
  • Advocate for non-timber forest products to support local and Indigenous communities.
  • Advocate to remove harmful agricultural subsidies and prioritize reducing food loss and waste.

Investors

  • Create deforestation-free investment portfolios, utilizing data, information, and the latest technology to inform investments.
  • Invest in PA infrastructure, monitoring, management, and enforcement mechanisms.
  • Invest in green bonds or high-integrity carbon credits for forest conservation efforts.
  • Develop financial instruments to invest in PA jurisdictions, focusing on supporting Indigenous communities.
  • Support PAs, other investors, and NGOs by sharing data, information, and investment frameworks that successfully avoid investments that drive deforestation.
  • Join, support, or create science-based certification schemes like the Forest Stewardship Council for sustainable logging practices.
  • Help shift public narratives to mobilize public action and build political will for PAs by creating educational campaigns and strengthening networks of stakeholders and rightsholders.
  • Require portfolio companies to eliminate deforestation from their supply chains and ask that they demonstrate strong PA practices.
  • Consider opportunities to invest in forest monitoring technologies or bioeconomy products derived from standing forests (e.g., nuts, berries, or other derivatives)

Philanthropists and International Aid Agencies

  • Ensure operations utilize deforestation-free products and supply chains.
  • Provide financial support for PAs management, monitoring, and enforcement.
  • Assist in monitoring PAs, utilizing real-time monitoring and satellite data such as the “Real-Time System for Detection of Deforestation” (DETER).
  • Assist in conducting proactive land-use planning to avoid infrastructure or development projects that may interfere with PAs or incentivize deforestation.
  • Support and finance high-integrity carbon markets, institutions, rules, and norms to cultivate the demand for high-quality carbon credits.
  • Help shift the public narrative around carbon markets as integrity increases to boost education, dialogue, and awareness.
  • Support PAs, businesses, and investors by sharing data, information, and investment frameworks that successfully avoid deforestation.
  • Help shift public narratives to mobilize public action and build political will for PAs by creating educational campaigns and strengthening networks of stakeholders and rightsholders.
  • Amplify the voices of local communities and civil society to promote robust media coverage.
  • Invest in and support Indigenous and local communities' capacity for public relations and communications.
  • Financially support Indigenous land tenure.
  • Join, support, or create certification schemes like the Forest Stewardship Council for sustainable logging practices.
  • Advocate for PAs and for public investments and evaluation indicators to strengthen the effectiveness of PAs.
  • Advocate for legal grievances, dispute resolution, and restitution processes.

Thought Leaders

  • Advocate for PAs and for public investments and evaluation indicators to strengthen the effectiveness of PAs.
  • Assist in monitoring PAs, utilizing real-time monitoring and satellite data such as the “Real-Time System for Detection of Deforestation” (DETER).
  • Assist in conducting proactive land-use planning to avoid infrastructure or development projects that may interfere with PAs or incentivize deforestation.
  • Advocate for legal grievances, dispute resolution, and restitution processes.
  • Support high-integrity carbon markets, institutions, rules, and norms to cultivate the demand for high-quality carbon credits.
  • Help shift the public narrative around carbon markets as integrity increases to boost education, dialogue, and awareness.
  • Support PAs, businesses, and investors by sharing data, information, and investment frameworks that successfully avoid deforestation.
  • Help shift public narratives to mobilize public action and build political will for PAs by creating educational campaigns and strengthening networks of stakeholders and rightsholders.
  • Amplify the voices of local communities and civil society to promote robust media coverage.
  • Support Indigenous and local communities' capacity for public relations and communications.

Technologists and Researchers

  • Improving PA monitoring methods and data collection, utilizing satellite imagery and GIS tools.
  • Develop land-use planning tools that help avoid infrastructure or development projects that may interfere with PAs or incentivize deforestation.
  • Create tools for local communities to monitor PAs, such as mobile apps, e-learning platforms, and mapping tools.
  • Conduct evaluations of the species richness of potential PAs and recommend areas of high biodiversity to be designated as PAs.
  • Develop verifiable carbon credits using technology such as blockchain to improve the integrity of carbon markets.
  • Develop supply chain tracking software for investors and businesses seeking to create deforestation-free portfolios and products.

Communities, Households, and Individuals

  • Ensure purchases and investments utilize deforestation-free products and supply chains.
  • Advocate for PAs and for public investments and evaluation indicators to strengthen the effectiveness of PAs.
  • Assist in monitoring PAs, utilizing real-time monitoring and satellite data such as the “Real-Time System for Detection of Deforestation” (DETER).
  • Assist in conducting proactive land-use planning to avoid infrastructure or development projects that may interfere with PAs or incentivize deforestation.
  • Advocate for legal grievances, dispute resolution, and restitution processes.
  • Support Indigenous and local communities' capacity for public relations and communications.
  • Assist with evaluations of the species richness of potential PAs and advocate for PAs in areas of high biodiversity that are threatened.
  • Help shift public narratives to mobilize public action and build political will for PAs by creating educational campaigns and strengthening networks of stakeholders and rightsholders.
  • Undertake forest protection and expansion initiatives locally by working to preserve existing forests and restore degraded forest areas.
  • Engage in citizen science initiatives by partnering with researchers or conservation groups to monitor PAs and document threats. 
Evidence Base

Consensus of effectiveness in reducing emissions and maintaining carbon removal: High

There is high scientific consensus that forest protection is a key strategy for reducing forest loss and addressing climate change. Rates of forest loss are lower inside of PAs and Indigenous peoples’ lands than outside of them. Globally, Wolf et al. (2021) found that rates of forest loss inside PAs are 40.5% lower on average than in unprotected areas, and Li et al. (2024) estimated that overall forest loss is 14% lower in PAs relative to unprotected areas. Regional studies find similar average effects of PAs on deforestation rates. For instance, McNichol et al. (2023) reported 39% lower deforestation rates in African woodlands in PAs relative to unprotected areas, and Graham et al. (2021) reported 69% lower deforestation rates in PAs relative to unprotected areas in Southeast Asia. In the tropics, Sze et al. (2022) found that rates of forest loss were similar between Indigenous lands and PAs, with forest loss rates reduced 17–29% relative to unprotected areas. Baragwanath & Bayi (2020) reported a 75% decline in deforestation in the Brazilian Amazon when Indigenous peoples are granted full property rights.

Reductions in forest loss lead to proportionate reductions in CO₂ emissions. The Intergovernmental Panel on Climate Change (IPCC) estimated that ecosystem protection, including forests, peatlands, grasslands, and coastal wetlands, has a technical mitigation potential of 6.2 Gt CO₂‑eq/yr, 4.0 Gt of which are available at a carbon price less than US$100 tCO₂‑eq/yr  (Nabuurs et al., 2022). Similarly, Griscom et al. (2017) found that avoiding human-caused forest loss is among the most effective natural climate solutions, with a potential impact of 3.6 Gt CO₂‑eq/yr (including forests on peatlands), nearly 2 Gt CO₂‑eq/yr of which is achievable at a cost below US$10/t CO₂‑eq/yr.

The results presented in this document were produced through analysis of 12 global datasets. We recognize that geographic biases can influence the development of global datasets and hope this work inspires research and data sharing on this topic in underrepresented regions.

Appendix

In this analysis, we integrated global land cover data, maps of forest loss rates, shapefiles of PAs and Indigenous people’s lands, country-scale data on reductions in forest loss inside of PAs, and biome-scale data on forest carbon stocks and sequestration rates to calculate currently protected forest area, total global forest area, and avoided emissions from forest protection. Forested peatlands and mangroves are excluded from this analysis and addressed in the Protect Peatlands and Protect Coastal Wetlands solutions, respectively.

Land cover data

We used two land cover data products to estimate forest extent inside and outside of PAs and Indigenous people’s lands, including: 1) the Global Forest Watch (GFW) tree cover dataset (Hansen et al., 2013), resampled to 30 second resolution, and 2) the 2022 European Space Agency Climate Change Initiative (ESA CCI) land cover dataset at native resolution (300 m). For the ESA CCI dataset, all non-flooded tree cover classes (50, 60, 70, 80, 90) and the “mosaic tree and shrub (>50%)/herbaceous cover (<50%)” class (100) and associated subclasses were included as forests. Both products are associated with uncertainty, which we did not address directly in our calculations. We include estimates from both products in order to provide readers with a sense of the variability in values that can stem from different land cover classification methods, which are discussed in more detail below.

These two datasets have methodological differences that result in substantially different classifications of forest extent, including their thresholds for defining forests, their underlying satellite data, and the algorithms used to classify forests based on the satellite information. For example, the ESA CCI product classifies 300-meter pixels with >15% tree cover as forests (based on our included classes), attempts to differentiate tree crops, relies on a 2003–2012 baseline land cover map coupled with a change-detection algorithm, and primarily uses imagery from MERIS, PROBA-V, and Sentinel missions (ESA CCI 2019). In contrast, the Global Forest Watch product generally requires >30% tree cover at 30-meter resolution, does not exclude tree crops, relies on a regression tree model for development of a baseline tree cover map circa 2010, and primarily uses Landsat ETM+ satellite imagery (Hansen et al., 2013). We recommend that interested readers refer to the respective user guides for each data product for a comprehensive discussion of the complex methods used for their development.

We used the Forest Landscape Integrity Index map developed by Grantham et al. (2020), which classifies forests with integrity indices ≥9.6 as high integrity. These forests are characterized by minimal human disturbance and high connectivity. Mangroves and peatlands were excluded from this analysis. We used a map of mangroves from Giri et al. (2011) and a map of peatlands compiled by Global Forest Watch to define mangrove and peatland extent (accessed at https://data.globalforestwatch.org/datasets/gfw::global-peatlands/about). The peatlands map is a composite of maps from five publications: Crezee et al. (2022), Gumbricht et al. (2017), Hastie et al. (2022), Miettinen et al. (2016), and Xu et al. (2018). For each compiled dataset, the data were resampled to 30-second resolution by calculating the area of each grid cell occupied by mangroves or peatlands. For each grid cell containing forests, the “eligible” forest area was calculated by subtracting the mangrove and peatland area from the total forest area for each forest cover dataset (GFW, ESA CCI, and high-integrity forests).

Protected forest areas

We identified protected forest areas using the World Database on Protected Areas (WDPA, 2024), which contains boundaries for each PA and additional information, including their establishment year and IUCN management category (Ia to VI, not applicable, not reported, and not assigned). For each PA polygon, we extracted the forest area from the GFW, ESA CCI, and high-integrity dataset (after removing the peatland and mangrove areas).

Each protected area was classified into a climate zone based on the midpoint between its minimum and maximum latitude. Zones included tropical (23.4°N–23.4°S), subtropical (23.4°–35° latitude), temperate (35°–50° latitude), and boreal (>50° latitude) in order to retain some spatial variability in emissions factors. We aggregated protected forest cover areas (from each of the two forest cover datasets and the high-integrity forest data) by IUCN class and climate zone. To evaluate trends in adoption over time, we also aggregated protected areas by establishment year. We used the same method to calculate the forest area that could be protected, extracting the total area of each land cover type by climate zone (inside and outside of existing PAs). 

We used maps from Garnett et al. (2018) to identify Indigenous people’s lands that were not inside established PAs. We calculated the total forest area within Indigenous people’s lands (excluding PAs, mangroves, and peatlands) using the same three forest area data sources. 

Forest loss and emissions factors

Forest loss rates were calculated for unprotected areas using the GFW forest loss dataset for 2001–2022, resampled to 1 km resolution. Forest losses were reclassified according to their dominant drivers based on the maps originally developed by Curtis et al. (2018), with updates accessible through GFW. Dominant drivers of forest loss include commodity agriculture, shifting agriculture, urbanization, forestry, and wildfire. We classified all drivers except wildfire as human-caused forest loss for this analysis. We calculated the area of forest loss attributable to each driver within each climate zone, which represented the “baseline” rate of forest loss outside of PAs. 

To calculate the difference in forest loss rates attributable to protection, we used country-level data from Wolf et al. (2021) on the ratio of forest loss in unprotected areas versus PAs, controlling for a suite of socio-environmental characteristics. We classified countries into climate zones based on their median latitude and averaged the ratios within climate zones. We defined the avoided forest loss attributable to protection as the product of the baseline forest loss rate and the ratio of forest loss outside versus inside of PAs.

We calculated the carbon benefits of avoided forest loss by multiplying avoided forest loss by average forest carbon stocks and sequestration rates. Harris et al. (2021) reported carbon stocks and sequestration rates by climate zone (boreal, temperate, subtropical, and tropical), and forest type. Carbon stocks and sequestration rates for primary and old secondary (>20 years old) forests were averaged for this analysis. We calculated carbon sequestration over a 20-yr period to provide values commensurate with the one-time loss of biomass carbon stocks.

Source data

Crezee, B. et al. Mapping peat thickness and carbon stocks of the central Congo Basin using field data. Nature Geoscience 15: 639-644 (2022). https://www.nature.com/articles/s41561-022-00966-7. Data downloaded from https://congopeat.net/maps/, using classes 4 and 5 only (peat classes). 

Curtis, P. G., Slay, C. M., Harris, N. L., Tyukavina, A., & Hansen, M. C. (2018). Classifying drivers of global forest loss. Science, 361(6407), 1108–1111. https://doi.org/10.1126/science.aau3445

ESA CCI (2019). Copernicus Climate Change Service, Climate Data Store: Land cover classification gridded maps from 1992 to present derived from satellite observation. Copernicus Climate Change Service (C3S) Climate Data Store (CDS). Accessed November 2024. doi: 10.24381/cds.006f2c9a

Garnett, S. T., Burgess, N. D., Fa, J. E., Fernández-Llamazares, Á., Molnár, Z., Robinson, C. J., Watson, J. E. M., Zander, K. K., Austin, B., Brondizio, E. S., Collier, N. F., Duncan, T., Ellis, E., Geyle, H., Jackson, M. V., Jonas, H., Malmer, P., McGowan, B., Sivongxay, A., & Leiper, I. (2018). A spatial overview of the global importance of Indigenous lands for conservation. Nature Sustainability, 1(7), 369–374. https://doi.org/10.1038/s41893-018-0100-6

Giri C, Ochieng E, Tieszen LL, Zhu Z, Singh A, Loveland T, Masek J, Duke N (2011). Status and distribution of mangrove forests of the world using earth observation satellite data (version 1.3, updated by UNEP-WCMC). Global Ecology and Biogeography 20: 154-159. doi: 10.1111/j.1466-8238.2010.00584.x . Data URL: http://data.unep-wcmc.org/datasets/4

Gumbricht, T. et al. An expert system model for mapping tropical wetlands and peatlands reveals South America as the largest contributor. Global Change Biology 23, 3581–3599 (2017). https://onlinelibrary.wiley.com/doi/full/10.1111/gcb.13689 

Hansen, M. C., Potapov, P. V., Moore, R., Hancher, M., Turubanova, S. A., Tyukavina, A., Thau, D., Stehman, S. V., Goetz, S. J., Loveland, T. R., Kommareddy, A., Egorov, A., Chini, L., Justice, C. O., & Townshend, J. R. G. (2013). High-Resolution Global Maps of 21st-Century Forest Cover Change. Science, 342(6160), 850–853. https://doi.org/10.1126/science.1244693. Data available on-line from: http://earthenginepartners.appspot.com/science-2013-global-forest. Accessed through Global Forest Watch on 01/12/2024. www.globalforestwatch.org

Harris, N. L., Gibbs, D. A., Baccini, A., Birdsey, R. A., de Bruin, S., Farina, M., Fatoyinbo, L., Hansen, M. C., Herold, M., Houghton, R. A., Potapov, P. V., Suarez, D. R., Roman-Cuesta, R. M., Saatchi, S. S., Slay, C. M., Turubanova, S. A., & Tyukavina, A. (2021). Global maps of twenty-first century forest carbon fluxes. Nature Climate Change, 11(3), 234–240. https://doi.org/10.1038/s41558-020-00976-6

Hastie, A. et al. Risks to carbon storage from land-use change revealed by peat thickness maps of Peru. Nature Geoscience 15: 369-374 (2022). https://www.nature.com/articles/s41561-022-00923-4

Miettinen, J., Shi, C. & Liew, S. C. Land cover distribution in the peatlands of Peninsular Malaysia, Sumatra and Borneo in 2015 with changes since 1990. Global Ecological Conservation. 6, 67– 78 (2016). https://www.sciencedirect.com/science/article/pii/S2351989415300470

UNEP-WCMC and IUCN (2024), Protected Planet: The World Database on Protected Areas (WDPA) and World Database on Other Effective Area-based Conservation Measures (WD-OECM) [Online], Accessed November 2024, Cambridge, UK: UNEP-WCMC and IUCN. Available at: www.protectedplanet.net.

Wolf, C., Levi, T., Ripple, W. J., Zárrate-Charry, D. A., & Betts, M. G. (2021). A forest loss report card for the world’s protected areas. Nature Ecology & Evolution, 5(4), 520–529. https://doi.org/10.1038/s41559-021-01389-0

Xu et al. PEATMAP: Refining estimates of global peatland distribution based on a meta-analysis. CATENA 160: 134-140 (2018). https://www.sciencedirect.com/science/article/pii/S0341816217303004 

Updated Date
Coming Soon Label
Coming Soon
Subscribe to Water quality