This solution meets all of Project Drawdown’s criteria for global climate solutions.

Use Smart & Programmable Thermostats

Image
Image
Hand pointing to smart thermostat on the wall
Coming Soon
Off

Key Takeaways

  • Smart and programmable thermostats reduce energy use and associated GHG emissions from heating and cooling by automatically adjusting the set temperature of a residential building.
  • A single smart or programmable thermostat can reduce heating GHG emissions by 0.23 t CO₂‑eq/yr and cooling emissions by 0.091 t CO₂‑eq/yr (100-yr basis).
  • To be effective, a smart or programmable thermostat must be used to automatically adjust temperatures; most in the U.S. are not used this way. 
  • An estimated 140 million households own and use smart or programmable thermostats for heating while 30 million do so for cooling. 
  • We estimate the achievable impact for smart or programmable thermostats to be 0.065–0.12 Gt CO₂‑eq/yr for heating and 0.017-0.046 Gt CO₂‑eq/yr for cooling (100-yr basis). 
Summary

We define Use Smart & Programmable Thermostats as reducing energy use and associated GHG emissions from heating and cooling by automatically making adjustments to the set temperature of a residential building. Smart thermostats can be remotely controlled and can adjust indoor temperature settings in response to learned occupancy patterns, while programmable thermostats require a user to manually program a temperature schedule.

Description for Social and Search
Using smart or programmable thermostats to adjust residential temperature settings for energy savings also reduces GHG emissions.
Overview

Residential buildings directly and indirectly generate GHG emissions through the fuels and electricity used for heating, cooling, and other functions. These emissions accounted for 12.5% of global emissions in 2021 (Ge et al., 2026). Heating is the largest residential source of operational emissions, with cooling being another major contributor (Energy Transitions Commission, 2025).

Smart and programmable thermostats reduce energy use by allowing temperatures to drift when occupants are away or asleep and restoring optimal temperatures in anticipation of occupants returning or waking. Since heating systems often rely on burning fossil fuels for heat (International Energy Agency [IEA], 2023), the emissions affected are primarily CO₂. Similarly, the emissions affected when cooling demands are reduced are primarily CO₂ from the electricity generated to power heat pumps and air conditioners. 

The amount of CO₂ saved with smart and programmable thermostats can vary substantially with occupant behavior, set points, occupancy levels, and climate (Pritoni et al., 2015; Stopps & Touchie, 2021). We used the minimum performance standard for Energy Star–certified smart thermostats, namely 8% run-time reduction for heating and 10% for cooling (Energy Star, 2017), with run time being used as a proxy for energy savings. This is a conservative value; many studies have measured or modeled higher savings (Alhamayani et al., 2021; Pang et al., 2021). 

Owning a smart or programmable thermostat does not guarantee it will be used to adjust temperatures to save energy (Pritoni et al., 2015; Stopps & Touchie, 2021). For example, while 53% of U.S. homes own a smart or programmable thermostat, only 16% report using a smart or programmable thermostat to automatically adjust temperatures (U.S. Energy Information Administration [U.S. EIA], 2023a). We also assumed that households that do not have a smart or programmable thermostat are not manually adjusting temperatures to save energy. 

As societies electrify, smart and programmable thermostats may play an increasingly important role in shifting demand away from grid peak periods (Stopps & Touchie, 2022). This can reduce emissions even further because grids often depend more on fossil fuel peaker plants during these times. This analysis does not include such emissions reductions. 

References

Alhamayani, A. D., Sun, Q., & Hallinan, K. P. (2021). Estimating smart Wi-Fi thermostat-enabled thermal comfort control savings for any residence. Clean Technologies, 3(4), 743–760. Link to source: https://doi.org/10.3390/cleantechnol3040044  

Allcott, H., & Rogers, T. (2014). The short-run and long-run effects of behavioral interventions: Experimental evidence from energy conservation. American Economic Review, 104(10), 3003–3037. Link to source: https://doi.org/10.1257/aer.104.10.3003  

Bergeron, R. (2024, May 9). Installation obligatoire d’un thermostat connecté en 2027. Expertise Rénovation. Link to source: https://www.expertise-renovation.com/actualites/installation-thermostat-connecte  

Bielig, M., Kutzner, F., Klingert, S., & Kacperski, C. (2025). Understanding intention to adopt smart thermostats: The role of individual predictors and social beliefs across five EU countries: Proceedings of the 14th International Conference on Smart Cities and Green ICT Systems, 1, 36–47. Link to source: https://doi.org/10.5220/0013356200003953  

Blonz, J., Palmer, K., Wichman, C. J., & Wietelman, D. C. (2025). Smart thermostats, automation, and time-varying prices. American Economic Journal: Applied Economics, 17(1), 90–125. Link to source: https://doi.org/10.1257/app.20210618  

Chassin, D. P., Stoustrup, J., Agathoklis, P., & Djilali, N. (2015). A new thermostat for real-time price demand response: Cost, comfort and energy impacts of discrete-time control without deadband. Applied Energy, 155, 816–825. Link to source: https://doi.org/10.1016/j.apenergy.2015.06.048 

EGIA Contractor University. (2025). Average service life of residential HVAC equipment. Link to source: https://library.mycontractoruniversity.com/wp-content/uploads/2025/10/EGIA-AverageServiceLife.pdf  

Ellsworth, R. (2026, February 12). Residential HVAC industry statistics. ZipDo Education Reports. Link to source: https://zipdo.co/residential-hvac-industry-statistics/  

Energy Star. (2017). Energy Star® program requirements for connected thermostat products: Partner commitments. Link to source: https://www.energystar.gov/sites/default/files/asset/document/ENERGY%20STAR%20Program%20Requirements%20for%20Connected%20Thermostats%20Version%201.0_0.pdf  

Energy Transitions Commission. (2025). Achieving zero-carbon buildings: Electric, efficient and flexible [Report]. Link to source: https://static.energy-transitions.org/uploads/resources/ETC_Buildings-Decarbonisation-Report_DIGITALFINAL.pdf  

Falchetta, G., Cian, E. D., Pavanello, F., & Wing, I. S. (2024). Inequalities in global residential cooling energy use to 2050. Nature Communications, 15(1), Article 7874. Link to source: https://doi.org/10.1038/s41467-024-52028-8  

Fine, J. P., & Touchie, M. F. (2020). A grouped control strategy for the retrofit of post-war multi-unit residential building hydronic space heating systems. Energy and Buildings, 208, Article 109604. Link to source: https://doi.org/10.1016/j.enbuild.2019.109604  

Ge, M., Friedrich, J., & Vigna, L. (2026, April 27). Where do emissions come from? These charts explain greenhouse gas emissions by sector. World Resources Institute. Link to source: https://www.wri.org/insights/4-charts-explain-greenhouse-gas-emissions-countries-and-sectors   

Government of Canada. (2025). Heating and cooling with a heat pump. Link to source: https://natural-resources.canada.ca/energy-efficiency/energy-star/heating-cooling-heat-pump#hds  

Hendron, R., German, A., & Pereira, J. (2021). Modeling savings for Energy Star smart home energy management systems. National Renewable Energy Laboratory. Link to source: https://docs.nlr.gov/docs/fy21osti/79534.pdf 

Henneman, L., Choirat, C., Dedoussi, I., Dominici, F., Roberts, J., & Zigler, C. (2023). Mortality risk from United States coal electricity generation. Science, 382(6673), 941–946. Link to source: https://doi.org/10.1126/science.adf4915  

International Energy Agency. (2023). Space heating. Link to source: https://www.iea.org/reports/space-heating#dashboard  

Kini, R. L., Vlachokostas, A., Brambley, M. R., & Rogers, A. (2025). Occupant-centric demand response for thermostatically-controlled home loads. IEEE Transactions on Smart Grid, 16(3), 2234–2245. Link to source: http://doi.org/10.1109/TSG.2025.3540427  

Lee, Z. E., & Max Zhang, K. (2022). Unintended consequences of smart thermostats in the transition to electrified heating. Applied Energy, 322, Article 119384. Link to source: https://doi.org/10.1016/j.apenergy.2022.119384  

Lee, Z. E., Sun, Q., Ma, Z., Wang, J., MacDonald, J. S., & Max Zhang, K. (2020). Providing grid services with heat pumps: A review. ASME Journal of Engineering for Sustainable Buildings and Cities, 1(1), Article 011007. Link to source: https://doi.org/10.1115/1.4045819  

Lu, J., Sookoor, T., Srinivasan, V., Gao, G., Holben, B., Stankovic, J., Field, E., & Whitehouse, K. (2010). The smart thermostat: Using occupancy sensors to save energy in homes. Proceedings of the 8th ACM Conference on Embedded Networked Sensor Systems, SenSys ’10, 211–224. Link to source: https://doi.org/10.1145/1869983.1870005

Mourshed, M. (2016). Climatic parameters for building energy applications: A temporal-geospatial assessment of temperature indicators. Renewable Energy, 94, 55–71. Link to source: https://doi.org/10.1016/j.renene.2016.03.021  

Nägele, F., Kasper, T., & Girod, B. (2017). Turning up the heat on obsolete thermostats: A simulation-based comparison of intelligent control approaches for residential heating systems. Renewable and Sustainable Energy Reviews, 75, 1254–1268. Link to source: https://doi.org/10.1016/j.rser.2016.11.112  

Lockheed Martin Energy. (2017). Home energy management system savings validation pilot [NYSERDA Report 17-16]. New York State Energy Research and Development Authority. Link to source: https://www.ashb.com/wp-content/uploads/2020/04/IS-2019-05.pdf  

Pang, Z., Chen, Y., Zhang, J., O’Neill, Z., Cheng, H., & Dong, B. (2021). How much HVAC energy could be saved from the occupant-centric smart home thermostat: A nationwide simulation study. Applied Energy, 283, Article 116251. Link to source: https://doi.org/10.1016/j.apenergy.2020.116251  

Peffer, T., Perry, D., Pritoni, M., Aragon, C., & Meier, A. (2013). Facilitating energy savings with programmable thermostats: Evaluation and guidelines for the thermostat user interface. Ergonomics, 56(3), 463–479. Link to source: https://doi.org/10.1080/00140139.2012.718370  

Pew Research Center. (2019). Religion and living arrangements around the world. Link to source: https://www.pewresearch.org/wp-content/uploads/sites/20/2019/12/PF_12.12.19_religious.households.FULL_.pdf  

Pritoni, M., Meier, A. K., Aragon, C., Perry, D., & Peffer, T. (2015). Energy efficiency and the misuse of programmable thermostats: The effectiveness of crowdsourcing for understanding household behavior. Energy Research & Social Science, 8, 190–197. Link to source: https://doi.org/10.1016/j.erss.2015.06.002  

Pritoni, M., Woolley, J. M., & Modera, M. P. (2016). Do occupancy-responsive learning thermostats save energy? A field study in university residence halls. Energy and Buildings, 127, 469–478. Link to source: https://doi.org/10.1016/j.enbuild.2016.05.024  

Statistics Canada. (2025). Use of thermostats [Data set]. Link to source: https://www150.statcan.gc.ca/t1/tbl1/en/tv.action?pid=3810004901  

Stopps, H., & Touchie, M. F. (2021). Residential smart thermostat use: An exploration of thermostat programming, environmental attitudes, and the influence of smart controls on energy savings. Energy and Buildings, 238, Article 110834. Link to source: https://doi.org/10.1016/j.enbuild.2021.110834  

Stopps, H., & Touchie, M. F. (2022). Load shifting and energy conservation using smart thermostats in contemporary high-rise residential buildings: Estimation of runtime changes using field data. Energy and Buildings, 255, Article 111644. Link to source: https://doi.org/10.1016/j.enbuild.2021.111644  

Tamas, R., O’Brien, W., & Quintero, M. S. (2021). Residential thermostat usability: Comparing manual, programmable, and smart devices. Building and Environment, 203, Article 108104. Link to source: https://doi.org/10.1016/j.buildenv.2021.108104  

World Bank. (n.d.). Mapping energy efficiency: A global dataset on building code effectiveness and compliance [Methodology note]. Link to source: https://www.worldbank.org/content/dam/sites/buildinggreen/doc/building_green_methodology.pdf  

United Nations. (2024). World population prospects 2024 - Special aggregates [Data set]. Link to source: https://population.un.org/wpp/downloads?folder=Special%20Aggregates&group=UN-related%20groups   

U.S. Energy Information Administration. (2018a). Table HC6.1 Space heating in U.S. homes, by housing unit type, 2015 [Data set]. Link to source: https://www.eia.gov/consumption/residential/data/2015/  

U.S. Energy Information Administration. (2018b). Table HC7.1 Air conditioning in U.S. homes by housing unit type, 2015 [Data set]. Link to source: https://www.eia.gov/consumption/residential/data/2015/  

U.S. Energy Information Administration. (2023a). Table HC6.1 Space heating in U.S. homes, by housing unit type, 2020 [Data set]. Link to source: https://www.eia.gov/consumption/residential/data/2020/hc/pdf/HC%206.1.pdf  

U.S. Energy Information Administration. (2023b). Table HC7.1 Air conditioning in U.S. homes, by housing unit type, 2020 [Data set]. Link to source: https://www.eia.gov/consumption/residential/data/2020/hc/pdf/HC%207.1.pdf  

U.S. Environmental Protection Agency. (2026). Power sector programs—Progress report. Link to source: https://www.epa.gov/power-sector/progress-report  

Wang, C., Pattawi, K., & Lee, H. (2020). Energy saving impact of occupancy-driven thermostat for residential buildings. Energy and Buildings, 211, Article 109791. Link to source: https://doi.org/10.1016/j.enbuild.2020.109791  

Yuan, Y., Song, C., Gao, L., Zeng, K., & Chen, Y. (2024). A review of current research on occupant-centric control for improving comfort and energy efficiency. Building Simulation, 17(10), 1675–1692. Link to source: https://doi.org/10.1007/s12273-024-1170-1  

Credits

Lead Fellow

  • Heather McDiarmid, Ph.D

Contributors

  • Ruthie Burrows, Ph.D.

  • James Gerber, Ph.D.

  • Daniel Jasper

  • Alex Sweeney

Internal Reviewers

  • Henry Igugu, Ph.D.

  • Amanda D. Smith, Ph.D.

  • Christina Swanson, Ph.D.

Effectiveness

For heating, 0.23 t CO₂‑eq/yr (20- and 100-yr basis) is reduced for every smart or programmable thermostat in use (Table 1a). This is a weighted global average based on the proportion of homes that use different sources of energy for space heating and assumes an 8% reduction in heating energy with a smart or programmable thermostat (Energy Star, 2017). 

For cooling, 0.091 t CO₂‑eq/yr is reduced for every smart or programmable thermostat in use (100-year basis, 0.092 t CO₂‑eq/yr on a 20-yr basis) (Table 1b). This is a weighted global average based on regional electricity demand for space cooling and regional electricity grid emission factors. The analysis assumes a 10% reduction in cooling energy with a smart or programmable thermostat (Energy Star, 2017).

The effectiveness of smart or programmable thermostats at reducing emissions will vary based on total heating and cooling demand. This is a function of climate and building performance as well as occupant behaviors (Hendron et al., 2021). Occupants may, for example, differ in how much they allow temperatures to drift while away or at night, how frequently overrides are used, and the schedules on which programming is based (Hendron et al., 2021).

Table 1. Effectiveness at reducing emissions.

Unit: t CO₂‑eq /smart or programmable thermostat used to save energy for heating/yr, 100-yr basis

Mean 0.23

Unit: t CO₂‑eq )/smart or programmable thermostat used to save energy on cooling/yr, 100-yr basis

Mean 0.091
Left Text Column Width
Cost

A smart or programmable thermostat for heating will save an average household US$370/t CO₂‑eq reduced (Table 2a). A smart or programmable thermostat for heating has an average initial cost of US$74, and households that adopt and use these thermostats to save on energy will spend on average US$89 less per year on heating. Assuming a 15-year lifespan (EGIA Contractor University, 2025), this results in a net US$84/yr savings.

We assumed that half of adopting households worldwide purchase a smart or programmable thermostat to use in their homes and the other half already own a smart or programmable thermostat and start using them to save energy with programmed setbacks. This is consistent with US statistics that show 55% of households with heating have a smart or programmable thermostat but only 16% use one to adjust heating temperatures, with most using one set temperature most of the time (U.S. EIA, 2023a). 

A smart or programmable thermostat for cooling will save a household US$230/t CO₂‑eq reduced (see Table 2b). The average initial cost for a smart or programmable thermostat for cooling is US$58, and will save a household an average of US$25/yr on cooling. Assuming a 15-year lifespan, this results in a net US$21/yr savings for the household.

For cooling, the initial cost assumes one-third of homes purchase a smart or programmable thermostat for a central air conditioning system, one-third purchase such a thermostat for a window or portable air conditioner, and one third use an existing smart or programmable thermostat but change behaviors to start using the programming feature. Similar to heating, 60% of U.S. households with cooling have a smart or programmable thermostat but only 15% use one to adjust cooling temperatures (U.S. EIA, 2023b). 

Table 2. Cost per unit climate impact. Negative values reflect cost savings.

Unit: 2023 US$/t CO₂‑eq , 100-year basis

Mean -370

Unit: 2023 US$/t CO₂‑eq , 100-year basis

Mean -230
Left Text Column Width

Methods and Supporting Data

Learning Curve

Insufficient data exist to quantify the learning curve for smart or programmable thermostats. 

Speed of Action

Speed of action refers to how quickly a climate solution physically affects the atmosphere after it is deployed. This is different from speed of deployment, which is the pace at which solutions are adopted.

At Project Drawdown, we define the speed of action for each climate solution as emergency brake, gradual, or delayed.

Use Smart & Programmable Thermostats is a GRADUAL climate solution. It has a steady, linear impact on the atmosphere. The cumulative effect over time builds as a straight line.

Caveats

Smart or programmable thermostats may be more difficult to implement in multiunit residential buildings with centralized heating and cooling systems in which units do not have temperature control (Fine & Touchie, 2020). Additionally, some existing space heating systems such as fireplaces and wood stoves may not be compatible with programmable thermostats. 

The Government of Canada (2025) recommends minimizing temperature setbacks for heat pumps or programming the return to normal temperatures in stages to avoid triggering the use of less efficient backup heating systems. 

This solution depends on households programming their thermostat or directing a smart thermostat to save energy. As with any outcome that depends on behavior change, post-intervention persistence can decay over time (Allcott & Rogers, 2014). Comfort concerns, changes to schedules, low perceived benefits, and lack of perceived control over heating and cooling systems are common reasons why households inactivate thermostat programming (Heatherly et al., 2023; Peffer et al., 2013; Pritoni et al., 2015; Stopps & Touchie, 2021). 

Some studies show little to no change in energy use with programmable thermostats, particularly if the thermostats are not easy to use (Peffer et al., 2013). Energy savings setbacks are more likely to be used with smart thermostats than programmable ones (Stopps & Touchie, 2021; Tamas et al., 2021), likely because of improved ease of use and increased automation. 

Use of smart and programmable thermostats reduces the emissions from operating buildings. However, these reductions pale in comparison to those offered by heat pumps and decarbonizing the electricity sector by adopting solutions such as distributed solar PV, utility-scale solar PV, onshore wind, and offshore wind.

Current Adoption

We estimated that 140 million households worldwide use smart or programmable thermostats to save energy for heating (Table 3a) and 30 million use them to save energy for cooling (Table 3b). 

The climate impact of this solution depends on households not only adopting the technology, but also using it to regularly adjust temperatures with the goal of saving energy. Where only adoption values exist, we assumed use patterns are similar to those in the United States, where 25–29% of households that own a smart or programmable thermostat are using the programming feature (U.S. EIA, 2023a; U.S. EIA, 2023b).

For adoption, we estimated the number of households with smart or programmable thermostats in high-income countries separately from low- and middle-income countries and combined them to get a global total. In each case, we applied the average smart or programmable thermostat use rate for the group of countries to their estimated number of households that require heating or cooling. 

These estimates are based on data from seven studies covering different geographies and spanning 2017–2025. 

Table 3. Current adoption level (2025).

Unit: smart or programmable thermostats used for the purposes of saving energy on heating 

Total 140,000,000

Unit: smart or programmable thermostats used for the purposes of saving energy on cooling

Total 30,000,000
Left Text Column Width
Adoption Trend

We estimate that globally, each year 1.4 million households start using smart or programmable thermostats to save on heating (Table 4a) and 0.60 million households start using them to save on cooling (Table 4b).

These data are based on surveys for heating and cooling covering 2015–2020 in the United States (U.S. EIA 2018b, 2018a, 2023b, 2023a) and 2007–2023 in Canada (Statistics Canada, 2025). Due to lack of data, we were not able to estimate adoption trends for low- and middle-income countries, and assumed the trend is negligible. 

Table 4. Adoption trend (2007–2023).

Unit: smart or programmable thermostats put to use for saving energy on heating/yr 

Total 1,400,000

Unit: smart or programmable thermostats put to use for saving energy on cooling/yr

Total 600,000
Left Text Column Width
Adoption Ceiling

If every household that currently relies on heating were to adopt and use smart or programmable thermostats to save energy, the total adoption would be 650 million households (Table 5a). This is based on the IEA’s estimate that 40% of households worldwide require space heating (World Bank, n.d.), combined with regional population estimates (United Nations, 2024), and estimates for household sizes by region (Pew Research Center, 2019).

Similarly for cooling, if every household that currently uses air conditioning were to adopt and use smart or programmable thermostats to save energy, the total adoption would be 580 million households (Table 5b). This is based on Falchetta et al.’s (2024) estimate that 35% of households worldwide currently have space cooling, combined with population and household size estimates (Pew Research Center, 2019; United Nations, 2024). This analysis does not reflect anticipated growing demand for space cooling with rising populations, rising affluence in low- and middle-income countries, and rising temperatures (Falchetta et al., 2024).

Table 5. Adoption ceiling.

Unit: smart or programmable thermostats put to use for saving energy on heating

Total 650,000,000

Unit: smart or programmable thermostats put to use for saving energy on cooling

Total 580,000,000
Left Text Column Width
Achievable Adoption

For heating, we estimate that use of smart or programmable thermostats to save on energy could reach 290 to 510 million households globally (Table 6a). In high income countries, this assumes 65–100% of households with heating needs adopt and use thermostats to save energy. At the low end, this represents the reported rate of regular setback use for heating homes in the state of New York (Lockheed Martin Energy, 2017), and we assume all heating households could program thermostats to save energy at the high end. In low and middle income countries, we assume 16–48% of households with heating needs adopt and use smart or programmable thermostats to save energy. This is based on today’s estimated smart and programmable thermostat adoption and use rate in the United States and Canada respectively (Statistics Canada, 2025; U.S. EIA, 2023a).

For cooling, we estimate that use of smart or programmable thermostats to save on energy could reach 190–510 million households globally (see Table 6b). In high income countries, this assumes 75–100% of households with cooling systems use thermostats to save energy for cooling. At the low end, this represents the reported rate of regular setback use for cooling homes in the state of New York (Lockheed Martin Energy, 2017) and we assume all households adopt and use smart or programmable thermostats at the high end. In low and middle income countries, we assume households adopt and use smart and programmable thermostats at a rate of 15 and 75%, representing the current rates for the United States and the state of New York, respectively (Lockheed Martin Energy, 2017; U.S. EIA, 2023a).

Table 6. Range of achievable adoption levels. 

Unit: smart or programmable thermostats put to use for saving energy on heating

Current adoption 140,000,000
Achievable – low 290,000,000
Achievable – high 510,000,000
Adoption ceiling 650,000,000

Unit: smart or programmable thermostats put to use for saving energy on cooling

Current adoption 30,000,000
Achievable – low 190,000,000
Achievable – high 510,000,000
Adoption ceiling 580,000,000
Left Text Column Width

For space heating, current adoption and use of a smart or programmable thermostat to save energy has an estimated climate impact of 0.033 Gt CO₂‑eq/yr globally (100- and 20-year basis; Table 7a). If all households with heating were to adopt and use these thermostats, the estimated climate impact would be 0.15 Gt CO₂‑eq/yr (100- and 20-year basis). We estimate the achievable range to be 0.065–0.12 Gt CO₂‑eq/yr (100- and 20-year basis). 

For space cooling, current adoption and use of a smart or programmable thermostat to save energy has an estimated climate impact of 0.0028 Gt CO₂‑eq/yr globally (100- and 20-year basis; Table 7b). If all households with cooling were to adopt and use these thermostats, the estimated climate impact would be 0.052 Gt CO₂‑eq/yr (100-year basis) and 0.053 Gt CO₂‑eq/yr (20-year basis). We estimate the achievable range to be 0.017–0.46 Gt CO₂‑eq/yr (100-year basis) and 0.018–0.47 Gt CO₂‑eq/yr (20-year basis). 

The impact from heating is greater than the impact from cooling because there are more households that use heating and more energy is needed on average per household for heating. 

Table 7. Climate impact at different levels of adoption.

Unit: Gt CO₂‑eq/yr, 100-yr basis

Current adoption 0.033
Achievable – low 0.065
Achievable – high 0.12
Adoption ceiling 0.15

Unit: Gt CO₂‑eq/yr, 100-yr basis

Current adoption 0.0028
Achievable – low 0.017
Achievable – high 0.046
Adoption ceiling 0.052
Left Text Column Width
Additional Benefits

Income and Work

When used as intended, smart and programmable thermostats can save money by reducing energy use (Blonz et al., 2025; Lu et al., 2010; Wang et al., 2020). The cost savings can vary depending on the type of thermostat, fuel used for heating, geographic location, and sources of energy used to generate electricity. In our estimates, on average, households using smart or programmable thermostats could save US$84/yr on heating and US$21/yr on cooling (see Table 2). Where time-of-use electricity pricing exists, smart and programmable thermostats can be used to heat or cool a home in advance of peak periods to save even more (Chassin et al., 2015). 

Health

A reduction in energy demand from smart thermostats may lower air pollution and limit exposure to pollutants such as lead and fine particulate matter generated by fossil fuel-based power plants, thereby improving health in nearby communities (Henneman et al., 2023; U.S. Environmental Protection Agency [U.S. EPA], 2026). 

Air Quality

Reducing energy use can reduce climate and air pollutants associated with burning fossil fuels, such as CO₂, nitrogen oxides, methane, lead, and fine particulate matter (U.S. EPA, 2026).

Risks

Smart and programmable thermostats have the potential to increase peak demand for electricity when programmed around common schedules. For example, thermostats may be programmed to raise temperatures in the early morning in winter when electricity grids are already strained (Lee & Max Zhang, 2022). Conversely, grid-integrated thermostats can reduce grid peaks by optimizing when heating or cooling occurs while maintaining occupant comfort (Kini et al., 2025).

Interactions with Other Solutions

Competing

There are diminishing returns as solutions that reduce heating and cooling loads are combined. When smart or programmable thermostats reduce the energy and emissions from heating and cooling, they also reduce the emissions savings these other solutions achieve. 

Consensus
Dashboard

Solution Basics

smart or programmable thermostat programmed to adjust temperatures for the purposes of saving energy

t CO₂-eq (100-yr)/unit/yr
0.23
units
Current 1.4×10⁸ 02.9×10⁸5.1×10⁸
Achievable (Low to High)

Climate Impact

Gt CO₂-eq (100-yr)/yr
Current 0.033 0.0650.12
US$ per t CO₂-eq
-370
Gradual

CO₂ , CH₄, N₂O

Solution Basics

smart or programmable thermostat programmed to adjust temperatures

t CO₂-eq (100-yr)/unit/yr
0.091
units
Current 3.0×10⁷ 01.9×10⁸5.1×10⁸
Achievable (Low to High)

Climate Impact

Gt CO₂-eq (100-yr)/yr
Current 0.003 0.0170.046
US$ per t CO₂-eq
-230
Gradual

CO₂ , CH₄, N₂O

Trade-offs

When large numbers of households use smart or programmable thermostats to save energy, it can unintentionally cause spikes in electricity demand when heating systems are simultaneously turned on to return temperatures to normal (Lee & Max Zhang, 2022). These spikes can increase overall grid capacity needs and increase demand from fossil-fueled peaking generation. Grid-interactive smart thermostats can reduce these spikes through grid level energy management (Lee et al., 2020). 

Action Word
Use
Solution Title
Smart & Programmable Thermostats
Classification
Highly Recommended

Lawmakers and Policymakers

  • Offer one-stop educational resources for thermostats; offer demonstrations for installation and programming through online videos and in-person demos; clearly state benefits of smart and programmable thermostats, highlighting the cost savings, social benefits, and environmental impacts.
  • Set clear and measurable targets for building efficiency, emissions reduction, and deployment of smart and programmable thermostats.
  • Ensure public procurement standards require smart and programmable thermostats for new construction; require retrofits for existing public buildings.
  • Create regulatory standards and building codes that encourage, incentivize, and/or require the use of smart and programmable thermostats, especially in new construction.
  • Periodically update codes, policies, and public guidance to keep pace with adoption and technology advances.
  • Encourage utilities to incentivize smart and programmable thermostat uptake and use for demand management.
  • Consider offering subsidies that allow for flexible implementation or selective applicability within national systems; ensure subsidy programs are designed based on scientific evidence showing they will have a positive impact on adoption for the intended beneficiaries; target subsidies to low- and middle-income households and simultaneously offer incentives for broadband and digital connectivity; ensure financial incentives cover both new installations and retrofits.
  • Focus broader policies on energy efficiency through the use of intelligent control.
  • Create regulatory standards and building codes that encourage, incentivize, and/or require the use of smart and programmable thermostats, especially in new construction.

Practitioners

  • Offer one-stop educational resources for thermostats; offer demonstrations for installation and programming through online videos and in-person demos; clearly state benefits of smart and programmable thermostats highlighting the cost savings, social benefits, and environmental impacts.
  • Offer free or discounted thermostats in electrically heated homes and homes with cooling in exchange for control when the electricity grid is strained. 
  • Ensure customers know they can upgrade their thermostats; provide recommendations to customers on purchasing, installing, and using smart and programmable thermostats; inform customers of public or private incentives for purchases and/or installation; educate customers on the savings, social, and environmental benefits of installation. 
  • Develop or offer easy-to-use smart and programmable thermostat systems; provide scheduled maintenance services for customers; bundle services with heating and cooling system services when possible; ensure customers have the option to review products and services online.
  • Offer thermostats that are compatible with widely used electronic devices such as laptops and smart phones; incorporate Wi-Fi, bluetooth, and the Internet of Things into thermostats, allow for remote control and visibility via smartphone apps.
  • Provide 0% financing options for bundled services, including thermostats and/or related energy efficiency measures.
  • Ease the learning curve for customers by providing clear, concise instructions; ensure elderly customers are comfortable with using the thermostat before leaving after installation.
  • Use customer feedback and work with manufacturers to simplify interface designs and improve functionality. 
  • Advertise for smart and programmable thermostats depicting individual savings on heating and cooling; use social media to reach broader audiences.
  • Create algorithms that can save energy and money for consumers by responding to time of use, customer behavior, and current weather; ensure thermostats have the ability to be updated for future improvements to the software.
  • When installing a thermostat, ensure it is easily accessible and will not be obstructed.
  • Create or join green building certification schemes, green building councils, and/or public-private partnerships that offer information, training, and general support for smart and programmable thermostats.

Business Leaders

  • Help socialize the importance of smart and programmable thermostats by incorporating them into corporate net zero strategies; highlight the use of smart and programmable thermostats in public communications.
  • Invest in or offer grants to start-ups seeking to deploy smart and programmable thermostats; invest in research and development to determine optimal user interfaces and/or algorithms for smart and programmable thermostats.
  • Offer pro bono business advice to nonprofit organizations working to improve building efficiency and deploy smart and programmable thermostats.
  • Offer employees information or benefits for upgrading their thermostats at home.
  • Create or join green building certification schemes, green building councils, and/or public-private partnerships that offer information, training, and general support for smart and programmable thermostats.

Nonprofit Leaders

  • Offer one-stop educational resources for thermostats; offer demonstrations for installation and programming through online videos and in-person demos; clearly state benefits of smart and programmable thermostats highlighting the cost savings, social benefits, and environmental impacts.
  • Help policymakers set clear and measurable targets for building efficiency, emissions reduction, and the deployment of smart and programmable thermostats.
  • Advocate for and help design regulatory standards and building codes that encourage, incentivize, and/or require the use of smart and programmable thermostats, especially in new construction.
  • Assist regulators in periodically updating codes, policies, and public guidance to keep pace with adoption and technology advances.
  • Advocate for subsidies that allow for flexible implementation or selective applicability within national systems; help ensure subsidy programs are designed based on scientific-evidence showing they will have a positive impact on adoption for the intended beneficiaries; recommend that subsidies be targeted to low- and middle-income households and simultaneously offer incentives for broadband and digital connectivity; help ensure financial incentives cover both new installations and retrofits.
  • Help shift policy frameworks to focus on energy efficiency through the use of intelligent control.
  • Conduct research to improve adoption and use of smart and programmable thermostats, paying close attention to how user interfaces impact behavior.
  • Create or join green building certification schemes, green building councils, and/or public-private partnerships that offer information, training, and general support for smart and programmable thermostats.

Investors

  • Finance only new construction and retrofits that use smart or programmable thermostats as well as other energy-efficient heating and cooling technologies and practices.
  • Invest in research and development to improve smart and programmable thermostat design and user interface.
  • Invest in or offer grants to start-ups seeking to deploy smart and programmable thermostats.
  • Issue or buy green bonds to deploy capital to projects that use smart or programmable thermostats and integrate other energy-efficient heating and cooling technologies and practices.
  • Offer preferential loan agreements for developers using smart or programmable thermostats, energy efficient building practices, and other related climate solutions.
  • Create or join green building certification schemes, green building councils, and/or public-private partnerships that offer information, training, and general support for smart and programmable thermostats.

Philanthropists and International Aid Agencies

  • Offer one-stop educational resources for thermostats; offer demonstrations for installation and programming through online videos and in-person demos; clearly state benefits of smart and programmable thermostats, highlighting the cost savings, social benefits, and environmental impacts.
  • Offer grants or access to no-interest financing for retrofits and installations of smart and programmable thermostats; ensure financial support for projects involving building retrofits or new construction; require the use of smart or programmable thermostats.
  • Offer grants or financing for research and development to improve smart and programmable thermostat design and user interface.
  • Invest in or offer grants to start-ups seeking to deploy smart or programmable thermostats.
  • Issue or buy green bonds to deploy capital to projects that use smart or programmable thermostats and integrate other energy-efficient heating and cooling technologies and practices.
  • Offer preferential loan agreements for developers using smart or programmable thermostats, energy efficient building practices, and other related climate solutions.
  • Help policymakers set clear and measurable targets for building efficiency, emissions reduction, and deployment of smart and programmable thermostats.
  • Advocate for and help design regulatory standards and building codes that encourage, incentivize, and/or require the use of smart and programmable thermostats, especially in new construction.
  • Help regulators periodically update codes, policies, and public guidance to keep pace with adoption and technology advances.
  • Advocate for subsidies that allow for flexible implementation or selective applicability within national systems; help ensure subsidy programs are designed based on scientific evidence showing they will have a positive impact on adoption for the intended beneficiaries; recommend that subsidies be targeted to low- and middle-income households and simultaneously offer incentives for broadband and digital connectivity; help ensure financial incentives cover both new installations and retrofits.
  • Help shift policy frameworks to focus on energy efficiency through the use of intelligent control.
  • Conduct research to improve adoption and use of smart and programmable thermostats, paying close attention to how user interfaces impact behavior.
  • Create or join green building certification schemes, green building councils, and/or public-private partnerships that offer information, training, and general support for smart and programmable thermostats.

Thought Leaders

  • Help create educational efforts and resources for smart and programmable thermostats; offer demonstrations for installation and programming through online videos and in-person demos; clearly state benefits of smart and programmable thermostats, highlighting the cost savings, social benefits, and environmental impacts.
  • Help policymakers set clear and measurable targets for building efficiency, emissions reduction, and deployment of smart and programmable thermostats.
  • Advocate for and help design regulatory standards and building codes that encourage, incentivize, and/or require the use of smart or programmable thermostats, especially in new construction.
  • Help regulators periodically update codes, policies, and public guidance to keep pace with adoption and technology advances.
  • Advocate for subsidies that allow for flexible implementation or selective applicability within national systems; help ensure subsidy programs are designed based on scientific evidence showing they will have a positive impact on adoption for the intended beneficiaries; recommend that subsidies be targeted to low- and middle-income households and simultaneously offer incentives for broadband and digital connectivity; help ensure financial incentives cover both new installations and retrofits.
  • Help shift policy frameworks to focus on energy efficiency through the use of intelligent control.
  • Conduct research to improve adoption and use of smart and programmable thermostats, paying close attention to how user interfaces impact behavior.
  • Create or join green building certification schemes, green building councils, and/or public-private partnerships that offer information, training, and general support for smart and programmable thermostats.

Technologists and Researchers

  • Develop smart systems that integrate thermostats into a systems level perspective, allowing thermostats to make adjustments based on household energy consumption; design these systems for automatic adjustments to energy usage depending on price signals, energy spikes, appliance use, charging time (e.g., for EVs), weather patterns, occupancy, and related factors; ensure thermostats can automatically update utility rates, weather forecasts, and other data that support cost- and energy-efficient use.
  • Develop smart thermostats and smart home systems that can be grid-integrated for demand management. 
  • Design software for smart and programmable thermostats that provides detailed feedback and individualized suggestions to consumers on energy usage, costs, and estimated savings.
  • Research how users interact with smart and programmable thermostats; examine impact of user interfaces (UIs) on consumer use; develop simplified UIs to facilitate adoption.
  • Research the relationship between household decision-making and smart or programmable thermostat adoption; highlight recommendations for reaching household decision-makers.

Communities, Households, and Individuals

  • Upgrade to a smart or programmable thermostat, learn how to use its features, set the programming accordingly, and override the system as little as possible.
  • Consult and work with licensed heating and cooling system installers to determine best available options for smart or programmable thermostats, installation, and maintenance.
  • Make sure your thermostat is installed in a position that allows for easy, unobstructed access.
  • Take advantage of public incentives such as subsidies or low-interest financing for installation, retrofits, and/or maintenance.
  • If provided by your smart thermostat or energy provider, opt into alerts that inform you of abnormally high energy usage which can be an early warning of problems with a heating and cooling system.
  • Take time to understand your smart or programmable thermostat; use profile settings and scheduling to optimize energy and money savings.
  • If you own a smart thermostat, opt into demand response programs to lower energy consumption during peak times; turn on notifications for heating and cooling system maintenance.
  • Share your experience with your neighbors, community, and social networks, and offer help in programming a thermostat where appropriate.
  • If possible, regularly schedule heating and cooling system maintenance and upgrades, including for related equipment such as thermostats. 
  • If smart or programmable thermostats are not an option, manually adjust your thermostat to reduce energy consumption when you’re not home, during peak hours, or to reflect weather conditions; consult your energy provider for tips on thermostat adjustments that can save money and energy.

“Take Action” Sources

Evidence Base

Consensus of effectiveness in reducing GHG emissions: High 

There is strong consensus that smart and programmable thermostats will reduce energy use and associated emissions when used to regularly adjust temperatures. 

Numerous studies have demonstrated that energy savings with smart or programmable thermostats can be significant but also vary significantly. For example, A review by Yuan et al. (2024) of occupancy-based control studies for heating, air conditioning and ventilation systems found energy savings of 7–44%. Pang et al. (2021) noted that factors such as climate conditions, building characteristics, occupant behaviors, and setback temperatures can affect energy savings outcomes. 

Pritoni et al. (2016) found that field study outcomes for smart thermostats can differ from the outcomes predicted by models, which are the most common approach to estimating energy savings and, by extension, emissions savings. Factors that can account for some of this discrepancy include comfort preferences, overrides, poor programming, and occupancy (Pritoni et al., 2015; Stopps & Touchie, 2021). 

A major barrier to realizing energy savings with smart or programmable thermostats is getting households to use the programming feature. Bielig et al. (2025) demonstrated that smart thermostat adoption and use are tied to perceived value, usefulness, and ease of use in European Union countries. Meanwhile, Pritoni et al. (2015) highlighted how many U.S. households have a poor understanding of how and when programmed set points save energy, and identified challenges with programming thermostats and comfort concerns as barriers to their use. Smart thermostats that learn occupant behaviors and preferences have shown to be easier to use than programmable thermostats (Tamas et al., 2021) and can achieve higher energy savings with higher thermal comfort (Nägele et al., 2017).

The results presented in this document summarize findings from five original studies, 10 reports, nine databases, two market research reports, and 11 product information web pages. This reflects current evidence from 11 countries, primarily high-income countries, and seven global regions. We recognize this limited geographic scope creates bias, and hope this work inspires research and data sharing on this topic in underrepresented regions.

Updated Date
Coming Soon Label
Coming Soon

Deploy Precision Fermentation

Image
Image
Peatland
Coming Soon
On
Description for Social and Search
The Drawdown Explorer’s Deploy Precision Fermentation assessment will be coming soon.
Solution in Action
Speed of Action
Caveats
Risks
Consensus
Trade-offs
Action Word
Deploy
Solution Title
Precision Fermentation
Classification
Highly Recommended

Lawmakers and Policymakers

Practitioners

Business Leaders

Nonprofit Leaders

Investors

Philanthropists and International Aid Agencies

Thought Leaders

Technologists and Researchers

Communities, Households, and Individuals

Coming Soon Label
Coming Soon

Mobilize Electric Buses

Cluster
Fuel Switching
Image
Image
Peatland
Coming Soon
On
Description for Social and Search
Mobilize Electric Buses is a Highly Recommended climate solution.
Solution in Action
Speed of Action
Caveats
Risks
Consensus
Trade-offs
Action Word
Mobilize
Solution Title
Electric Buses
Classification
Highly Recommended

Lawmakers and Policymakers

Practitioners

Business Leaders

Nonprofit Leaders

Investors

Philanthropists and International Aid Agencies

Thought Leaders

Technologists and Researchers

Communities, Households, and Individuals

Coming Soon Label
Coming Soon

Manage & Increase Urban Trees

Image
Image
Peatland
Coming Soon
On
Description for Social and Search
Increase Urban Vegetation is a Highly Recommended climate solution.
Solution in Action

Methods and Supporting Data

Speed of Action
Caveats
Risks
Consensus
Trade-offs
Action Word
Manage & Increase
Solution Title
Urban Trees
Classification
Highly Recommended

Lawmakers and Policymakers

Practitioners

Business Leaders

Nonprofit Leaders

Investors

Philanthropists and International Aid Agencies

Thought Leaders

Technologists and Researchers

Communities, Households, and Individuals

Updated Date
Coming Soon Label
Coming Soon

Deploy Agrivoltaics

Sector
Electricity
Image
Image
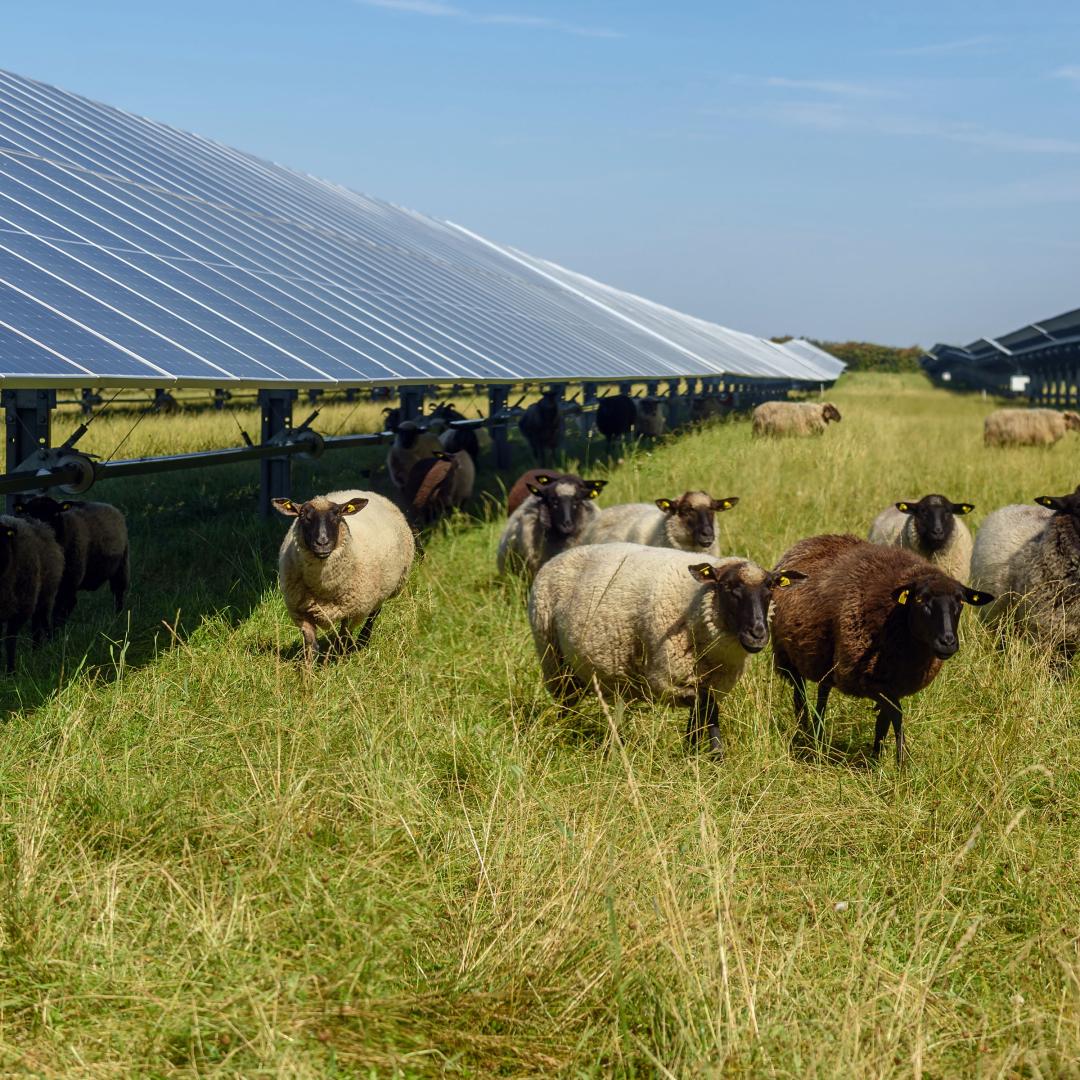
Sheep in a pasture with solar panels
Coming Soon
On

Key Takeaways

  • Deploying agrivoltaics on just 1% of global agricultural land could offset 21 PWh/yr of electricity demand, equivalent to total global electricity consumption in 2019.
  • Agrivoltaics systems generate clean, renewable electricity without displacing agricultural activities, potentially increasing overall land use efficiency up to 200%.
  • By shading crops and livestock, solar panels installed as part of an agrivoltaics system moderate soil temperatures and reduce evapotranspiration, improving agricultural water-use efficiency by 150–300% compared with conventional farming.
  • Agrivoltaics can diversify income sources for farmers and expand rural employment opportunities.
  • Agrivoltaic systems have the greatest adoption potential in arid, dry, and land-constrained regions – particularly Africa, the Asia-Pacific, and South and Central America – where solar resources are abundant and the crop-protection benefits of shading are most pronounced.
Summary

Agrivoltaics is the dual use of land for simultaneous solar photovoltaic (PV) power generation and agricultural production. It reduces GHG emissions by shifting electricity production from fossil fuels to renewables. Agrivoltaic systems can be categorized by system type, PV configuration, module tilt, and agricultural activity. These systems operate at both utility and distributed scales. We consider all combinations of system type, PV structure, module tilt, and agricultural activity in this solution.

Description for Social and Search
​​Agrivoltaics makes it possible to grow food and generate clean solar power on the same land. It can improve land-use efficiency, stabilize crop yields in suitable climates, and add new revenue for farmers.
Overview

Electricity generation accounts for an estimated 23% of GHG emissions on a 100-year basis (Clarke et al., 2022), with fossil fuel–based sources supplying more than 60% of electricity generated in 2023 (International Energy Agency [IEA], 2024b). Since solar PV is a clean and renewable resource, agrivoltaics produces electricity without contributing to GHG emissions or air pollution during operation. Unlike conventional utility-scale solar PV, which often competes with agriculture for space, agrivoltaics combines solar PV electricity generation and agricultural production without requiring additional land use change or sacrificing arable land (Trommsdorff et al., 2025).

The primary climate benefit is the reduction of CO₂ emissions and smaller amounts of methane and nitrous oxide from displacing fossil fuel–based electricity from the grid. This solution quantifies only emissions avoided through electricity generation and does not include emissions from agricultural activities beneath or between the solar panels.

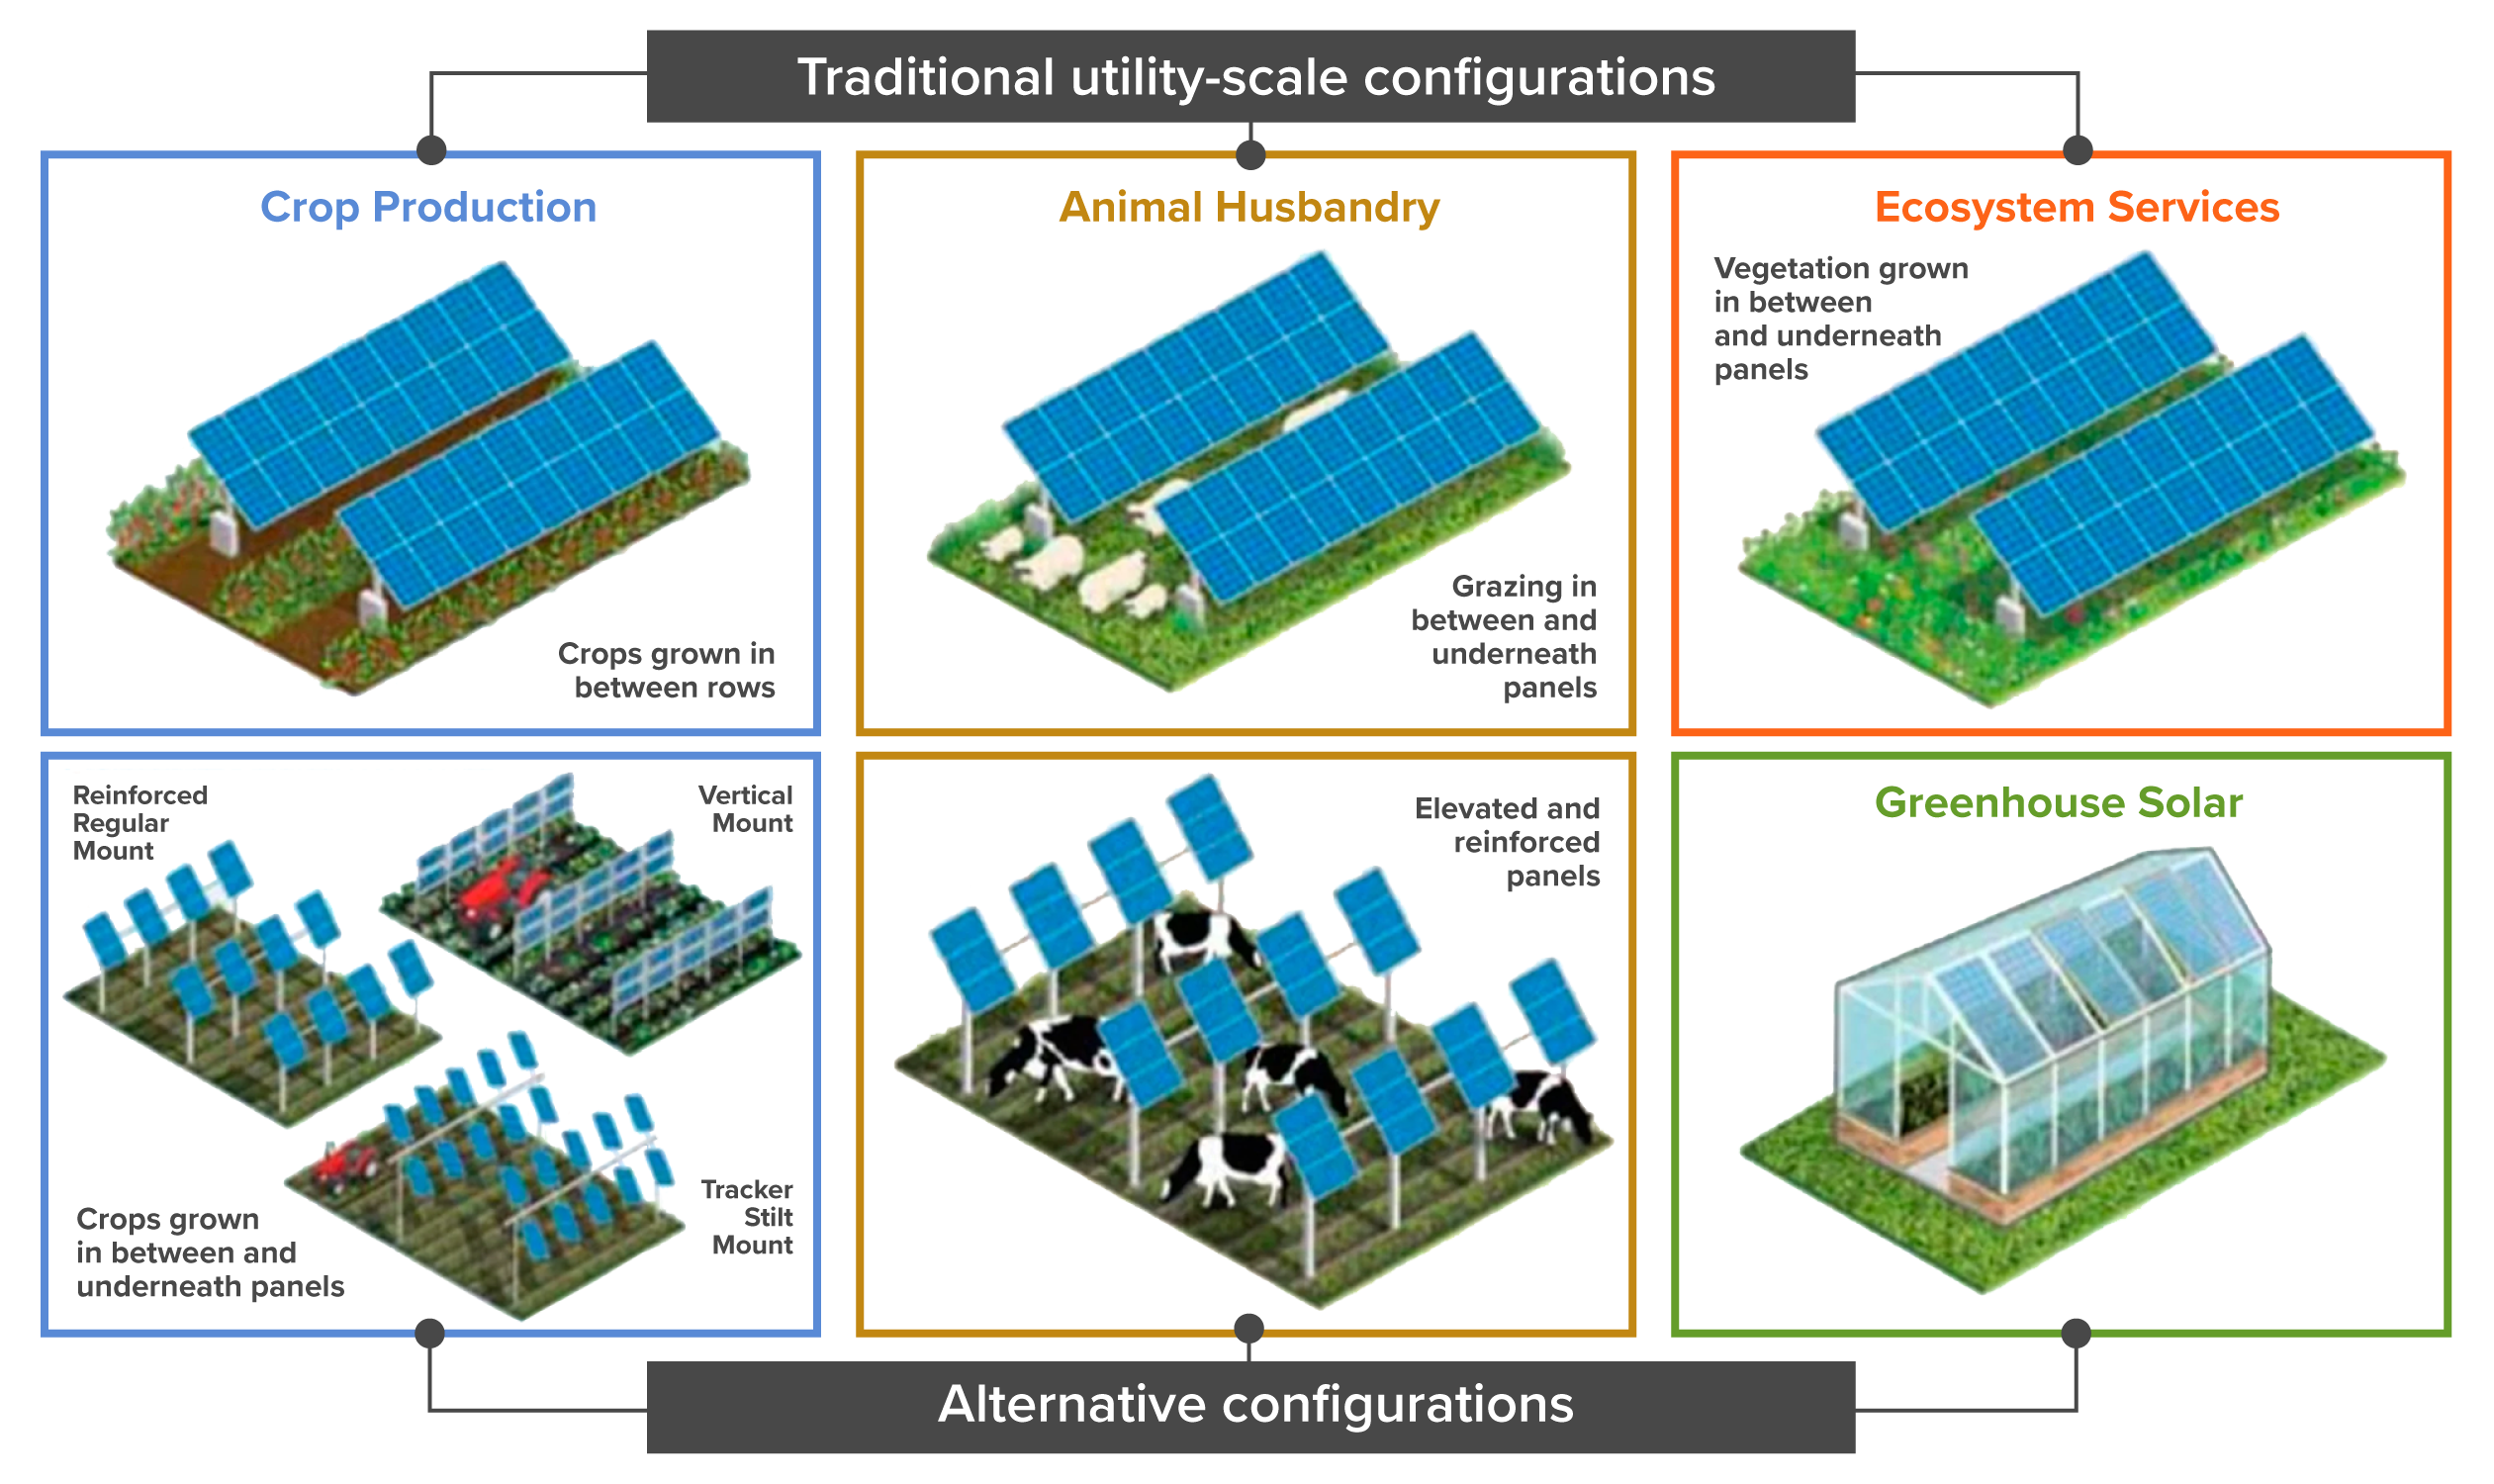
Agrivoltaic systems come in several configurations to coexist with different agricultural activities, including crop production, animal husbandry or grazing, ecosystem services, aquaculture, and pollinator habitat (Macknick et al., 2022). As shown in Figure 1, these systems range from standard ground-mounted arrangements – with crops growing between rows or livestock grazing underneath – to more specialized alternative designs such as elevated panels, vertical bifacial mounts, stilt-mounted trackers, and solar-integrated greenhouses. Overhead configurations elevate panels 2–6 meters above ground to allow standard farm operations while providing shade and weather protection for crops or livestock. Interspace (or interrow) configurations leave wide alleys between ground-mounted PV arrays for vegetation. Rooftop and structure-mounted configurations place panels on greenhouses, barns, or other farm infrastructure, using rigid or flexible panels (Campana et al., 2025; Macknick et al., 2022; Solar Power Europe, 2024a; Trommsdorff et al., 2021).

Each configuration involves different trade-offs between energy output, crop performance, land compatibility, and cost (Campana et al., 2025; Horowitz et al., 2020; Trommsdorff et al., 2025). Well-designed systems often achieve higher overall productivity with a land equivalent ratio exceeding 1 (Trommsdorff et al., 2025). Successful implementation typically requires partnerships among farmers, agricultural cooperatives, solar developers, and utilities, supported by government policies such as subsidies, tax credits, or zoning support (Trommsdorff et al., 2025). 

Figure 1. Agrivoltaic configurations range from standard ground-mounted arrangements (top row) to more specialized alternative designs (bottom row), including elevated overhead systems, vertical mounts, stilt-mounted trackers, and solar-integrated greenhouses. These systems can support agricultural activities – including crop production, grazing, ecosystem services, and habitats – on the same land. 

Image
Diagram demonstrating Agrivoltaic configurations

Source: Macknick, J., et al. (2022). The 5 Cs of agrivoltaic success factors in the United States: Lessons from the InSPIRE research study (No. NREL/TP-6A20-83566). National Renewable Energy Laboratory (NREL), Golden, Colo. (United States). Copyrighted.

Solution in Action

References

Abel, D., Holloway, T., Harkey, M., Rrushaj, A., Brinkman, G., Duran, P., Janssen, M., & Denholm, P. (2018). Potential air quality benefits from increased solar photovoltaic electricity generation in the Eastern United States. Atmospheric Environment, 175, 65–74. Link to source: https://doi.org/10.1016/j.atmosenv.2017.11.049

Adeh, E. H., Good, S. P., Calaf, M., & Higgins, C. W. (2019). Solar PV power potential is greatest over croplands. Scientific Reports, 9, Article 11442. Link to source: https://doi.org/10.1038/s41598-019-47803-3

Agostini, A., Colauzzi, M., & Amaducci, S. (2021). Innovative agrivoltaic systems to produce sustainable energy: An economic and environmental assessment. Applied Energy, 281, 116102. Link to source: https://doi.org/10.1016/j.apenergy.2020.116102

Agrivoltaics Map (National Laboratory of the Rockies). (n.d.). [Dataset]. InSPIRE. Retrieved April 13, 2026, from Link to source: https://openei.org/wiki/InSPIRE/Agrivoltaics_Map

Ahmad, M., Zeeshan, M., & Khan, J. A. (2023). Life cycle multi-objective (geospatial, techno-economic, and environmental) feasibility and potential assessment of utility scale photovoltaic power plants. Energy Conversion and Management, 291. https://doi.org/10.1016/j.enconman.2023.117260

Amaducci, S., Yin, X., & Colauzzi, M. (2018). Agrivoltaic systems to optimise land use for electric energy production. Applied Energy, 220, 545–561. Link to source: https://doi.org/10.1016/j.apenergy.2018.03.081

Andrew, A. C., Higgins, C. W., Smallman, M. A., Graham, M., & Ates, S. (2021). Herbage yield, lamb growth and foraging behavior in agrivoltaic production system. Frontiers in Sustainable Food Systems, Volume 5-2021. Link to source: https://www.frontiersin.org/journals/sustainable-food-systems/articles/10.3389/fsufs.2021.659175

Asa’a, S., Reher, T., Rongé, J., Diels, J., Poortmans, J., Radhakrishnan, H. S., van der Heide, A., Van de Poel, B., & Daenen, M. (2024). A multidisciplinary view on agrivoltaics: Future of energy and agriculture. Renewable and Sustainable Energy Reviews, 200, 114515. Link to source: https://doi.org/10.1016/j.rser.2024.114515

Badza, K., Soro, Y. M., & Sawadogo, M. (2023). Life cycle assessment of a 33.7 MW solar photovoltaic power plant in the context of a developing country. Sustainable Environment Research, 33(1), 1–15. https://doi.org/10.1186/S42834-023-00201-X

Baik, E., Chawla, K. P., Jenkins, J. D., Kolster, C., Patankar, N. S., Olson, A., Benson, S. M., & Long, J. C. S. (2021). What is different about different net-zero carbon electricity systems? Energy and Climate Change, 2, Article 100046. Link to source: https://doi.org/10.1016/j.egycc.2021.100046 

Barron-Gafford, G. A., Pavao-Zuckerman, M. A., Minor, R. L., Sutter, L. F., Barnett-Moreno, I., Blackett, D. T., Thompson, M., Dimond, K., Gerlak, A. K., Nabhan, G. P., & Macknick, J. E. (2019). Agrivoltaics provide mutual benefits across the food–energy–water nexus in drylands. Nature Sustainability, 2(9), 848–855. Link to source: https://doi.org/10.1038/s41893-019-0364-5

Beck, M., Bopp, G., Goetzberger, A., Obergfell, T., Reise, C., & Schindele, S. (2012). Combining PV and food crops to agrophotovoltaic – optimization of orientation and harvest [PDF]. 27th European Photovoltaic Solar Energy Conference and Exhibition; 4096-4100, 5 pages, 6000 kb. Link to source: https://doi.org/10.4229/27THEUPVSEC2012-5AV.2.25

Bhatta, G., Lohani, S. P., Kc, M., Bhandari, R., Palit, D., & Anderson, T. (2025). Harnessing solar PV potential for decarbonization in Nepal: A GIS based assessment of ground-mounted, rooftop, and agrivoltaic solar systems for Nepal. Energy for Sustainable Development, 85, 101618. Link to source: https://doi.org/10.1016/j.esd.2024.101618

Biswas, A., Qiu, M., Braun, D., Dominici, F., & Mork, D. (2025). Quantifying effects of solar power adoption on CO2 emissions reduction. Science Advances, 11, Article eadq5660. https://doi.org/10.1126/sciadv.adq5660

Brown, T. & Reichenberg, L. (2021). Decreasing market value of variable renewables can be avoided by policy action. Energy Economics, 100, Article 105354. Link to source: https://doi.org/10.1016/j.eneco.2021.105354 

Buonocore, J. J., Hughes, E. J., Michanowicz, D. R., Heo, J., Allen, J. G., & Williams, A. (2019). Climate and health benefits of increasing renewable energy deployment in the United States*. Environmental Research Letters, 14(11), 114010. Link to source: https://doi.org/10.1088/1748-9326/ab49bc

Busch, C., & Wydra, K. (2023). Life cycle assessment of an agrivoltaic system with conventional potato production. Journal of Renewable and Sustainable Energy, 15(4), 043501. Link to source: https://doi.org/10.1063/5.0156779

Campana, P. E., Macknick, J., Croci, M., Elkadeem, M. R., Gorjian, S., Pascaris, A., Cuppari, R. I., Amaducci, S., Liu, W., Trommsdorff, M., Sturchio, M. A., Muller, O., Agostini, A., Chatzipanagi, A., Scognamiglio, A., & Zhang, J. (2025). Scientific frontiers of agrivoltaic cropping systems. Nature Reviews Clean Technology, 1(11), 801–821. Link to source: https://doi.org/10.1038/s44359-025-00110-9

Carvalho Fonsêca, V. D. F., De Andrade Culhari, E., Moura, G. A. B., Nascimento, S. T., Milan, H. M., Neto, M. C., & Maia, A. S. C. (2023). Shade of solar panels relieves heat load of sheep. Applied Animal Behaviour Science, 265, 105998. Link to source: https://doi.org/10.1016/j.applanim.2023.105998

Chirinda, N., Leonard, S. A., Bierbaum, R., & Whaley, C. (2024). Agrivoltaics. STAP. Link to source: http://www.stapgef.org/resources/advisory-documents/agrivoltaics

Christ, M., & Wagner, M. (2025). Integrating solar energy into German vineyards: A geospatial framework for identifying agrivoltaic potential. Agronomy, 15(9), 2174. Link to source: https://doi.org/10.3390/agronomy15092174

Clarke, L., Wei, Y.-M., De La Vega Navarro, A., Garg, A., Hahmann, A. N., Khennas, S., Azevedo, I. M. L., Löschel, A., Singh, A. K., Steg, L., Strbac, G., & Wada, K. (2022). Energy systems. In P. R. Shukla, J. Skea, R. Slade, A. Al Khourdajie, R. van Diemen, D. McCollum, M. Pathak, S. Some, P. Vyas, R. Fradera, M. Belkacemi, A. Hasija, G. Lisboa, S. Luz, & J. Malley (Eds.), Climate change 2022: Mitigation of climate change. Contribution of Working Group III to the Sixth Assessment Report of the Intergovernmental Panel on Climate Change (pp. 613–746). Cambridge University Press. Link to source: https://doi.org/10.1017/9781009157926.008

Cuppari, R. I., Branscomb, A., Graham, M., Negash, F., Smith, A. K., Proctor, K., Rupp, D., Tilahun Ayalew, A., Getaneh Tilaye, G., Higgins, C. W., & Najm, M. A. (2024). Agrivoltaics: Synergies and trade-offs in achieving the sustainable development goals at the global and local scale. Applied Energy, 362, 122970. Link to source: https://doi.org/10.1016/j.apenergy.2024.122970

Daniels, T. L. (2023). The development of utility-scale solar projects on US agricultural land: Opportunities and obstacles. Socio-Ecological Practice Research, 5(2), 205–213. Link to source: https://doi.org/10.1007/s42532-023-00139-9

de Falco, M., Sarrica, M., Scognamiglio, A., & Fasanelli, R. (2025). What does agrivoltaics mean? A study on social representations shared by experts and the press in Italy. Energy Research & Social Science, 119, 103918. Link to source: https://doi.org/10.1016/j.erss.2024.103918

Dinesh, H., & Pearce, J. M. (2016). The potential of agrivoltaic systems. Renewable and Sustainable Energy Reviews, 54, 299–308. Link to source: https://doi.org/10.1016/j.rser.2015.10.02

DNV. (2024). Energy transition outlook 2024. Link to source: https://brandcentral.dnv.com/original/gallery/10651/files/original/5c2470ac-597c-43f9-87dd-4e6b238d7845.pdf

Dupraz, C., Marrou, H., Talbot, G., Dufour, L., Nogier, A., & Ferard, Y. (2011). Combining solar photovoltaic panels and food crops for optimising land use: Towards new agrivoltaic schemes. Renewable Energy, Renewable Energy: Generation & Application, 36(10), 2725–2732. Link to source: https://doi.org/10.1016/j.renene.2011.03.005

Ember. (n.d.). Global electricity trends. In Global Electricity Review 2024. Link to source: https://ember-energy.org/latest-insights/global-electricity-review-2024/global-electricity-trends/

Ember. (2024, August 29). Empowering farmers in Central Europe: The case for agri-PV. Link to source: https://ember-energy.org/latest-insights/empowering-farmers-in-central-europe-the-case-for-agri-pv

Fan, T., Trommsdorff, M., Gölz, S., & He, J. (2022, June 17). Agrivoltaics in China: A Study of the Current State of Agrivoltaics Development, Governmental Support Schemes, and Stakeholder Groups’ Perspectives and Acceptance based on Expert Interviews. 3rd Agrivoltaics Conference & Exhibition 2022. Agrivoltaics Conference 2022. Link to source: https://publica.fraunhofer.de/entities/publication/afa41072-9cc3-4ee1-97c9-f2027d6c7a2b

FAO. (2023). Land statistics and indicators 2000–2021 (Brief No. 71). Link to source: https://openknowledge.fao.org/server/api/core/bitstreams/5c8b2707-1bcf-4c29-90e2-3487e583f71e/content#:~:text=Page%203,over%20the%20past%20two%20decades.

Firoozi, A. A., Firoozi, A. A., & Maghami, M. R. (2025). Harnessing photovoltaic innovation: Advancements, challenges, and strategic pathways for sustainable global development. Energy Conversion and Management: X, 27, 101058. Link to source: https://doi.org/10.1016/J.ECMX.2025.101058 

Ferreira Junior, R. A., Torres, I. C., De Souza, L. F. L., Dos Santos, M. A., Cavalcante, M. A. A., Tiba, C., & De Souza, J. L. (2025). Agrophotovoltaic systems in sugarcane crop − A Brazilian case study. Energy Conversion and Management, 344, 120307. Link to source: https://doi.org/10.1016/j.enconman.2025.120307

Fraunhofer Institute of Solar Energy ISE. (2024, July). Study: Levelized cost of electricity - Renewable energy technologies [PDF]. Link to source: https://www.ise.fraunhofer.de/en/publications/studies/cost-of-electricity.html

Gadhiya, G. A., & Chakraborty, S. (2025). Agrivoltaics in the Andaman and Nicobar Islands: Assessing the geo-spatial potential for sustainable development. Energy for Sustainable Development, 88, 101807. Link to source: https://doi.org/10.1016/j.esd.2025.101807

Gagnon, P., & O’Shaughnessy, E. (2024). Consequential analysis of the greenhouse gas emissions impacts of actions that influence the electric grid: The theory and practice of using marginal emissions rates (Report No. TP-6A40-91580). National Renewable Energy Laboratory. Link to source: https://doi.org/10.2172/24816

Gallagher, C. L., & Holloway, T. (2020). Integrating air quality and public health benefits in U.S. decarbonization strategies. Frontiers in Public Health, Volume 8-2020. Link to source: https://www.frontiersin.org/journals/public-health/articles/10.3389/fpubh.2020.563358

Horowitz, K., Ramasamy, V., Macknick, J., & Margolis, R. (2020). Capital costs for dual-use photovoltaic installations: 2020 benchmark for ground-mounted PV systems with pollinator-friendly vegetation, grazing, and crops (Report No. TP-6A20-77811). National Renewable Energy Laboratory. Link to source: https://doi.org/10.2172/1756713

Hwang, K.-W., & Lee, C.-Y. (2024). Estimating the deterministic and stochastic levelized cost of the energy of fence-type agrivoltaics. Energies, 17(8), 1932. Link to source: https://doi.org/10.3390/en17081932

International Energy Agency. (2024a). World Energy Outlook 2024. Link to source: https://www.iea.org/reports/world-energy-outlook-2024

International Energy Agency. (2024b). World energy balances—Data product. Link to source: https://www.iea.org/data-and-statistics/data-product/world-energy-balance

International Renewable Energy Agency. (2025). Renewable power generation costs in 2024. Link to source: https://www.irena.org/-/media/Files/IRENA/Agency/Publication/2025/Jul/IRENA_TEC_RPGC_in_2024_2025.pdf 

International Renewable Energy Agency. (2026). Renewable power generation costs in 2025. Link to source: https://www.irena.org/-/media/Files/IRENA/Agency/Publication/2026/Jul/IRENA_TEC_RPGC_in_2025_2026.pdf

Intergovernmental Panel on Climate Change. (2023). Climate change 2023: Synthesis report. Contribution of Working Groups I, II and III to the Sixth Assessment Report of the Intergovernmental Panel on Climate Change (Core Writing Team, H. Lee, & J. Romero, Eds.). Link to source: https://doi.org/10.59327/IPCC/AR6-9789291691647. 

Jung, D., Gareis, G. H., Staiger, A., & Salmon, A. (2022). Effects of soiling on agrivoltaic systems: Results of a case study in Chile. AIP Conference Proceedings, 2635(1), 020001. Link to source: https://doi.org/10.1063/5.0107943

Keiner, D., Walter, L., Bogdanov, D., Peters, I. M., & Breyer, C. (2025). Assessing the impact of bifacial solar photovoltaics on future power systems based on capacity-density-optimised power plant yield modelling. Solar Energy, 295, 113543. Link to source: https://doi.org/10.1016/j.solener.2025.113543

Laub, M., Pataczek, L., Feuerbacher, A., Zikeli, S., & Högy, P. (2022). Contrasting yield responses at varying levels of shade suggest different suitability of crops for dual land-use systems: A meta-analysis. Agronomy for Sustainable Development, 42(3), 51. Link to source: https://doi.org/10.1007/s13593-022-00783-7

Lytle, W., Meyer, T. K., Tanikella, N. G., Burnham, L., Engel, J., Schelly, C., & Pearce, J. M. (2021). Conceptual design and rationale for a new agrivoltaics concept: Pasture-raised rabbits and solar farming. Journal of Cleaner Production, 282, 124476. Link to source: https://doi.org/10.1016/j.jclepro.2020.124476

Mamun, M. A. A., Dargusch, P., Wadley, D., Zulkarnain, N. A., & Aziz, A. A. (2022). A review of research on agrivoltaic systems. Renewable and Sustainable Energy Reviews, 161, 112351. Link to source: https://doi.org/10.1016/j.rser.2022.112351

Macknick, J., Hartmann, H., Barron-Gafford, G., Beatty, B., Burton, R., Seok-Choi, C., Davis, M., Davis, R., Figueroa, J., Garrett, A., Hain, L., Herbert, S., Janski, J., Kinzer, A., Knapp, A., Lehan, M., Losey, J., Marley, J., MacDonald, J., … Walston, L. (2022). The 5 Cs of agrivoltaic success factors in the United States: Lessons from the InSPIRE research study (Report No. TP-6A20-83566). National Renewable Energy Laboratory. Link to source: https://doi.org/10.2172/1882930

Mahim, T. M., Rahman, M. M., & Huda, A. S. N. (2026). Review of the challenges and prospects in agrivoltaics. Advanced Energy and Sustainability Research, 7(1), e202500227. Link to source: https://doi.org/10.1002/aesr.202500227

Maia, A. S. C., Culhari, E. D. A., Fonsêca, V. D. F. C., Milan, H. F. M., & Gebremedhin, K. G. (2020). Photovoltaic panels as shading resources for livestock. Journal of Cleaner Production, 258, 120551. Link to source: https://doi.org/10.1016/j.jclepro.2020.120551

Malu, P. R., Sharma, U. S., & Pearce, J. M. (2017). Agrivoltaic potential on grape farms in India. Sustainable Energy Technologies and Assessments, 23, 104–110. Link to source: https://doi.org/10.1016/j.seta.2017.08.004

Masson, G., l’Epine, M. de, & Kaizuka, I. (2024). Trends in PV applications 2024. IEA PVPS. Link to source: https://iea-pvps.org/trends_reports/trends-in-pv-applications-2024/

McCall, J., Staie, B., Carron, W., & Jamison, J. (2024). Initial feasibility assessment of agrivoltaics in Jackson County, IL (Report No. TP-6A20-88816). National Renewable Energy Laboratory. Link to source: https://doi.org/10.2172/2335896

Mehedi, T. H., Gemechu, E., & Kumar, A. (2022). Life cycle greenhouse gas emissions and energy footprints of utility-scale solar energy systems. Applied Energy, 314, 118918. Link to source: https://doi.org/10.1016/J.APENERGY.2022.118918

Millstein, D., Wiser, R., Bolinger, M., & Barbose, G. (2017). The climate and air-quality benefits of wind and solar power in the United States. Nature Energy, 2(9), Article 17134. Report #: ARTN 17134. Link to source: http://dx.doi.org/10.1038/nenergy.2017.134

Millstein, D., O’Shaughnessy, E., & Wiser, R. (2024). Climate and air quality benefits of wind and solar generation in the United States from 2019 to 2022. Cell Reports Sustainability, 1(6), 100105. Link to source: https://doi.org/10.1016/j.crsus.2024.100105

Montedonico, M., Pando, D., Santillán, V. A., Guevara, M. Á., Salazar, K. P., Mezzomo, W., Butrón, N., Solís, N., & Díaz, A. (2026). Perspectivas De La Energía Agrivoltaica En América Latina. Link to source: https://ideathinktank.org.mx/wp-content/uploads/2026/03/DocumentoTecnico_PerspectivasDeLaAgrovoltaicaEnAmericaLatina.pdf

 Morash, J. D., & Pavao-Zuckerman, M. (2026). Regional dynamics of agrivoltaics adoption: Stakeholder perceptions and barriers in Maryland, USA. Energy Policy, 210, 115066. Link to source: https://doi.org/10.1016/j.enpol.2025.115066

National Renewable Energy Laboratory. (2021). Life Cycle Greenhouse Gas Emissions from Electricity Generation: Update. Link to source: https://docs.nlr.gov/docs/fy21osti/80580.pdf

National Laboratory of the Rockies. (2024, November 21). Lighting the Way for Agrivoltaics: How NREL Empowers Communities To Capture the Benefits of Solar Energy, Agriculture, and Ecosystems | NLR. Link to source: https://www.nlr.gov/news/feature/2024/lighting-the-way-for-agrivoltaics

Pandey, G., Lyden, S., Franklin, E., Millar, B., & Harrison, M. T. (2025). A systematic review of agrivoltaics: Productivity, profitability, and environmental co-benefits. Sustainable Production and Consumption, 56, 13–36. Link to source: https://doi.org/10.1016/j.spc.2025.03.006

Pascaris, A. S., Schelly, C., Burnham, L., & Pearce, J. M. (2021). Integrating solar energy with agriculture: Industry perspectives on the market, community, and socio-political dimensions of agrivoltaics. Energy Research & Social Science, 75, 102023. Link to source: https://doi.org/10.1016/j.erss.2021.102023

Patel, U., Gadhiya, G., & Chauhan, P. (2023). Case Study on Power Generation from Agrivoltaic System in India. International Journal of Environment and Climate Change, 13, 1447–1454. Link to source: https://doi.org/10.9734/IJECC/2023/v13i92375

Pehl, M., Arvesen, A., Humpenöder, F., Popp, A., Hertwich, E. G., & Luderer, G. (2017). Understanding future emissions from low-carbon power systems by integration of life-cycle assessment and integrated energy modelling. Nature Energy 2017 2:12, 2(12), 939–945. Link to source: https://doi.org/10.1038/s41560-017-0032-9

Pincelli, I. P., Hinkley, J., & Brent, A. (2024). Carbon, materials and energy footprint of a utility-scale solar plant in Aotearoa New Zealand. Solar Energy, 273, 112535. Link to source: https://doi.org/10.1016/J.SOLENER.2024.112535

Scarano, A., Curci, L. M., Semeraro, T., Calisi, A., Lenucci, M. S., Santino, A., Basset, A., & De Caroli, M. (2025). Agrivoltaics as a sustainable strategy to enhance food security under water scarcity. Horticulturae, 11(4), 401. Link to source: https://doi.org/10.3390/horticulturae11040401 

Seay-Fleming, C., Swanson, T., Gerlak, A. K., Pavao-Zuckerman, M. A., Andrews, H., Moore, K., & Barron-Gafford, G. A. (2025). Cultivating engagement: Public participation in agrivoltaics planning and design. Energy Research & Social Science, 127, 104273. Link to source: https://doi.org/10.1016/j.erss.2025.104273

Smith, B. L., Sekar, A., Mirletz, H., Heath, G., & Margolis, R. (2024). An updated life cycle assessment of utility-scale solar photovoltaic systems installed in the United States. Link to source: https://www.nrel.gov/docs/fy24osti/87372.pdf

Smith, M. (2024). Dual-use solar photovoltaics: Emerging applications and issues for congress (No. R48197). Congressional Research Service. Link to source: https://www.congress.gov/crs-product/R48197

Sojib Ahmed, M., Rezwan Khan, M., Haque, A., & Ryyan Khan, M. (2022). Agrivoltaics analysis in a techno-economic framework: Understanding why agrivoltaics on rice will always be profitable. Applied Energy, 323, 119560. Link to source: https://doi.org/10.1016/j.apenergy.2022.119560

Solar Power Europe. (2024a). Agrisolar handbook. Link to source: https://www.solarpowereurope.org/insights/thematic-reports/agrisolar-handbook-1

Solar Power Europe. (2024b). New agrisolar digital map presents over 200 projects across Europe—SolarPower Europe. Link to source: https://www.solarpowereurope.org/press-releases/new-agrisolar-digital-map-presents-over-200-projects-across-europe

Sorensen, A., Nogeire, T., & Hunter, M. (2022). Potential placement of utility-scale solar installations on agricultural lands in the U.S. to 2040. American Farmland Trust. Link to source: https://farmlandinfo.org/wp-content/uploads/sites/2/2023/03/AFT_FUT2040-solar-white-paper.pdf

Suri, D., de Chalendar, J. & Azevedo, I.M.L. (2025). Assessing the real implications for CO2 as generation from renewables increases. Nature Communications, 16, Article 7124. Link to source: https://doi.org/10.1038/s41467-025-59800-4

Swanson, T., Seay-Fleming, C., Gerlak, A. K., & Barron-Gafford, G. A. (2025). “Enough is enough, we like our farms”: The role of landscape ideology in shaping perceptions of solar energy and agrivoltaics in the rural American Southwest. Journal of Rural Studies, 114, 103572. Link to source: https://doi.org/10.1016/j.jrurstud.2025.103572

Trommsdorff, M., Kang, J., Reise, C., Schindele, S., Bopp, G., Ehmann, A., Weselek, A., Högy, P., & Obergfell, T. (2021). Combining food and energy production: Design of an agrivoltaic system applied in arable and vegetable farming in Germany. Renewable and Sustainable Energy Reviews, 140, 110694. Link to source: https://doi.org/10.1016/j.rser.2020.110694

Trommsdorff, M., Campana, P. E., Macknick, J., Fernández Solas, A., Gorjian, S., & Tsanakas, I. (2025). Dual Land Use for Agriculture and Solar Power Production: Overview and Performance of Agrivoltaic Systems. International Energy Agency Photovoltaic Power Systems Programme. Link to source: https://doi.org/10.69766/XAEU5008

United Nations Conference on Trade and Development UNCTAD. (2023, October 4). Italy—Adopts €2.61 billion schemes to support agrivoltaic energy production and agro-industrial development | Investment Policy Monitor | UNCTAD Investment Policy Hub. Link to source: https://investmentpolicy.unctad.org/investment-policy-monitor/measures/4543/italy-adopts-2-61-billion-schemes-to-support-agrivoltaic-energy-production-and-agro-industrial-development

U.S. Department of Energy. (n.d.). Solar photovoltaic system cost benchmarks. Energy.Gov. Retrieved March 11, 2026, from  Link to source: https://www.energy.gov/eere/solar/solar-photovoltaic-system-cost-benchmarks

Walsh, K. B., Stedman, R., & Kay, D. (2026). Imagining agrivoltaics: Farmer expectations for co-locating solar energy and agricultural production in Western New York. Energy Research & Social Science, 137, 104789. Link to source: https://doi.org/10.1016/j.erss.2026.104789

Walston, L. J., Mishra, S. K., Hartmann, H. M., Hlohowskyj, I., McCall, J., & Macknick, J. (2018). Examining the potential for agricultural benefits from pollinator habitat at solar facilities in the United States. Environmental Science & Technology, 52(13), 7566–7576. Link to source: https://doi.org/10.1021/acs.est.8b00020

Williams, H. J., Wang, Y., Yuan, B., Wang, H., & Zhang, K. M. (2025). Rethinking agrivoltaic incentive programs: A science-based approach to encourage practical design solutions. Applied Energy, 377, 124272. Link to source: https://doi.org/10.1016/j.apenergy.2024.124272

Williams, H. J., Wang, Y., & Zhang, K. M. (2024, June). Advantages and disadvantages of vertical solar racking for agrivoltaic systems. World Agrivoltaics Conference. Link to source: https://www.osti.gov/biblio/25305

Yeligeti, M., Hu, W., Scholz, Y., Stegen, R., & von Krbek, K. (2023). Cropland and rooftops: The global undertapped potential for solar photovoltaics. Environmental Research Letters, 18(5), 054027. Link to source: https://doi.org/10.1088/1748-9326/accc47

Zhang, X., & Ma, X. (2026). Vectorized agrivoltaics dataset in China from 2010 to 2022. Scientific Data, 13(1), 116. Link to source: https://doi.org/10.1038/s41597-025-06305-w

Zubi, G., Parag, Y., & Wald, S. (2024). Implications of large-scale PV integration on grid operation, costs, and emissions: Challenges and proposed solutions. Energies 2025, Vol. 18, Page 130, 18(1), 130. Link to source: https://doi.org/10.3390/EN18010130 

Credits

Lead Fellow

  • Al-Amin Bugaje, Ph.D.

Contributors

  • Ruthie Burrows, Ph.D.

  • James Gerber, Ph.D.

  • Daniel Jasper

  • Alex Sweeney

Internal Reviewers

  • Amanda D. Smith, Ph.D.

  • Christina Swanson, Ph.D.

  • Megan Matthews, Ph.D.

Effectiveness

We estimate that agrivoltaics reduces GHG emissions by 720 t CO₂‑eq /MW/yr (730 t CO₂‑eq /MW/yr, 20-year basis) (Table 1). This assumes that newly installed agrivoltaics displace an equivalent MWh of the 2023 global electricity grid mix (estimated at 530 kg CO₂‑eq /MWh (540 kg CO₂‑eq /MWh, 20-year basis; IEA, 2024b; see Methodology: Appendix A for calculation details). We used a median capacity factor of 15% based on country-level estimates (Ember, 2024; Ferreira Junior et al., 2025; McCall et al., 2024; Patel et al., 2023; Williams et al., 2024) to convert annual emissions reductions from per MWh to per MW installed capacity. 

Actual avoided emissions will depend on local grid conditions and the specific power sources displaced (see Methodology: Appendix A). Studies in the U.S. show that from 2007–2015, solar deployment avoided approximately 0.5 t CO₂ /MWh (613 t CO₂ /MW/yr; Millstein et al., 2017) emissions, and a 15% increase in deployment avoided 8.54 Mt CO₂ /yr (Biswas et al., 2025). 

Although solar PV emits negligible GHGs during operations, emissions arise during manufacturing, transportation, installation, maintenance, and decommissioning. However, these embodied emissions are paid back in approximately 1–2 yr (Badza et al., 2023; M. Ahmad et al., 2023; Mehedi et al., 2022; Pincelli et al., 2024; Smith et al., 2024). While total life-cycle emissions remain far below those of fossil fuels (National Renewable Energy Laboratory [NREL], 2021; Smith et al., 2024), decarbonizing industrial supply chains is essential to maximize climate impact (Pehl et al., 2017). In our analysis, we focused solely on emissions avoided during electricity generation. Carbon payback time, embodied life-cycle emissions, and on-farm agricultural emissions from ruminant grazing were excluded from the effectiveness and climate impact estimates. 

Table 1. Effectiveness at reducing emissions. 

Unit: t CO₂‑eq /MW/yr, 100-yr basis

Estimate 720
Left Text Column Width
Cost

We estimated a mean levelized cost of electricity (LCOE) for agrivoltaics of US$69/MWh based on industry reports and journal articles (Bhatta et al., 2025; Fraunhofer ISE, 2024; Gadhiya & Chakraborty, 2025; Hwang & Lee, 2024; Sojib Ahmed et al., 2022; U.S. Department of Energy [U.S. DOE], n.d.; see Methodology: Appendix A for details). LCOE values represent the average cost of producing one MWh of electricity over the operational lifetime of a power plant, allowing investors to compare their expected revenue to a standard set of costs. This cost metric has been used by international agencies for cost comparison across generation technologies, incorporating installed capital costs, operation and maintenance, project lifespan, and energy output. The agrivoltaics LCOE describes costs to utility-scale generators and does not include agricultural output.

The LCOE for agrivoltaics is generally higher than that for utility-scale solar PV (Trommsdorff et al., 2025), due to higher capital expenditure requirements for overhead configurations and specialized partially see-through PV modules. However, agrivoltaics has a lower LCOE than distributed solar PV. For instance, a study conducted by the U.S. DOE (n.d.) showed that the LCOE of distributed solar PV was US$142/MWh (0.006 MWdc system) compared to agrivoltaics’ US$75/MWh (3 MWdc system). In the same study, a 100 MWdc utility-scale solar PV had an LCOE of US$47/MWh. These costs do not consider any subsidies or revenue. 

In practice, revenues and costs will vary based on the ownership model structure. In developer-owned models, farmers receive fixed lease payments of US$250–2,500 per acre, while the solar provider bears the up-front cost (Daniels, 2022; Trommsdorff et al., 2025). In farmer-owned models, the farmers incur the initial investment burden and generate revenue by selling power to the grid or reducing their on-farm energy bills (Pandey et al., 2025).

Methods and Supporting Data

Learning Curve

Agrivoltaics does not have an empirically derived learning rate. The technology has only scaled meaningfully since the early 2010s, and its configurations vary too widely for a clean cost reduction curve to be fitted to the data. However, agrivoltaics is built from several existing technologies with well-understood learning dynamics. 

We estimated the current global learning rate for module costs at about 34% (DNV, 2024; Masson, 2024). This high rate is heavily influenced by the accelerated growth of solar PV from 2012–2022; however, this number comes down over a longer period of time. Projections suggest it will slow to around 17% by 2050 as cost components stabilize and the largest gains from scaling are realized (DNV, 2024). Because agrivoltaic systems draw their modules from the same global supply chain as any other solar PV project, we expect that they inherit this curve directly.

What distinguishes agrivoltaics economically from utility-scale solar PV is the cost premium of its elevated or specialized mounting structures, more complex permitting, dual-use legal frameworks, and crop-specific engineering (Trommsdorff et al., 2025). These components follow slower learning curves than electronics, constrained by manufacturing scale-up and standardization of elevated racking/tracking systems. However, hardware innovations such as vertical bifacial or open-source designs, module reuse from decommissioned plants, and policy incentives (feed-in tariffs, grants, regulatory clarity) have potential to accelerate deployment and cross-sector learning (Pandey et al., 2025). 

Speed of Action

Speed of action refers to how quickly a climate solution physically affects the atmosphere after it is deployed. This is different from speed of deployment, which is the pace at which solutions are adopted.

At Project Drawdown, we define the speed of action for each climate solution as emergency brake, gradual, or delayed.

Deploy Agrivoltaics is a GRADUAL climate solution. It has a steady, linear impact on the atmosphere. As installed capacity of agrivoltaics increases over time, emissions from electricity generation are expected to decrease assuming solar PV displaces fossil fuel sources.

Caveats

Implementing agrivoltaics requires careful site and crop selection to avoid unintended consequences. In temperate climates, excessive shading can reduce yields of shade-intolerant crops such as wheat, corn, and tomatoes (Pandey et al., 2025). Significant yield declines may displace food production to other land, triggering land conversion and emissions that offset climate gains (Agostini et al., 2021; Wagner et al., 2023). The greatest benefits occur when agrivoltaics is deployed on marginal or low-productivity farmland, where dual-use systems can improve efficiency up to 200% without compromising high yield agriculture (Pandey et al., 2025). 

Farming activities also increase panel soiling from dust, pollen, or harvest residue, necessitating frequent maintenance to prevent energy losses, especially in arid or high-wind regions (Campana et al., 2025; Chirinda et al., 2024; Jung et al., 2022).

We acknowledge the partial overlap of agrivoltaics with utility-scale and distributed solar PV estimates; to avoid double-counting capacity, we treat it as a complementary pathway that expands solar adoption while mitigating land-use competition (Sorensen et al., 2022; Smith, 2024). Policy frameworks that differentiate dual-use systems through incentives, performance standards, or land-use regulations will determine the extent of overlap (Pandey et al., 2025). While proximity to the grid is essential, deployment is limited by transmission capacity and interconnection queue delays (Campana et al., 2025). Large utility-scale projects often face multi-year queues to connect to regional grids, with transmission costs sometimes approaching 50–100% of total project costs (Daniels, 2023; Macknick et al., 2022)

Our assessment assumed that each additional MWh from agrivoltaics displaces an equivalent MWh of the existing grid mix. In reality, avoided emissions vary by regional grid dynamics, marginal generation sources, and the timing and location of production. New solar generation can sometimes displace other renewables rather than fossil-based sources, especially in grids with high existing renewable, nuclear, or geothermal capacity (Baik et al., 2021; Suri et al., 2025). Because agrivoltaics is constrained to agriculturally suitable land – which is unevenly distributed globally – the degree to which these dynamics affect emissions reductions will vary by region. 

Current Adoption

As of 2023, the global installed capacity for agrivoltaics reached approximately 140,000 MW (Table 2). China leads global adoption, accounting for roughly 91% of this estimated total. The U.S. represents 8.4%, while Europe accounts for the remainder (Masson et al., 2024; Solar Power Europe, 2024b; Zhang & Ma, 2026). 

Table 2. Current adoption level (2023).

Unit: MW installed capacity

Estimate 140,000
Left Text Column Width

We estimated this global capacity by aggregating data from industry reports, journal papers, and public datasets across these three regions. However, tracking remains challenging because agrivoltaics deployment estimates partially overlap with utility-scale and distributed solar PV totals. Existing databases often count dual-use projects within broader solar capacity figures, particularly when configurations resemble conventional solar PV systems (Daniels, 2023; Smith, 2024; Sorensen et al., 2022; Trommsdorff et al., 2025). The precise degree of overlap cannot yet be quantified, but developers increasingly adopt dual-use designs to minimize land-use conflict (Campana et al., 2025; Masson et al., 2024; Trommsdorff et al., 2025). While agrivoltaics adoption is present in other regions (e.g., Japan, South Korea, and India), consistent and credible datasets to estimate accurate current adoption and growth trends are limited. Consequently, this estimate likely underestimates current global adoption. 

Adoption Trend

We estimated the median global adoption trend for agrivoltaics at 9,800 MW/yr of additional installed capacity (Table 3) by summing regional adoption values for each year from 2010–2023 and taking the year-to-year difference. Because this analysis relied primarily on data from China and the U.S., the results reflect a geographic distribution skewed toward these leading markets. 

Table 3. Adoption trend (2010–2023).

Unit: MW installed capacity/yr

25th percentile 2300
Mean 9400
Median (50th percentile) 9800
75th percentile 15000
Left Text Column Width

Estimated global agrivoltaics capacity grew roughly 200-fold from 580 MW in 2010 to approximately 140,000 MW in 2023 (Figure 2). While agrivoltaics adoption is still in its early stages – with global installed capacity roughly five times lower than distributed solar PV and seven times lower than utility-scale solar PV – growth is expected to accelerate. Supportive policies in pioneer regions such as Europe, China, Japan, and Korea have driven recent expansion. These policies address both the need for clean energy and the rising climate stresses on farmlands, including heat and drought (Trommsdorff et al., 2025). 

Figure 2. Estimated global adoption of agrivoltaics, 2010–2023.

Sources: Zhang & Ma, 2026; Agrivoltaics Map, n.d.

Enable Download
On

Market momentum has also strengthened over the past decade. From 2010–2015, global agrivoltaics added an average of about 4,100 MW/yr. Post 2015, that rate jumped to around 14,000 MW/yr, fueled by targeted incentives. For instance, agrivoltaics capacity in the United States. more than doubled from 2020–2024 (National Laboratory of the Rockies [NLR], 2024). In Italy, the government launched a competitive bidding process in 2023 to award contracts and funding for 500 MW of agrivoltaics projects (Masson et al., 2024); the country aims to reach 1,000 MW of capacity by 2026 (United Nations Conference on Trade and Development [UNCTAD], 2023). We expect that continued cost declines of elevated structures and bifacial modules and improved profitability (Pandey et al., 2025; Keiner et al., 2025) will drive future adoption.

Adoption Ceiling

We estimated the median technical potential for agrivoltaics to arrive at an adoption ceiling of 250 million MW of installed capacity (Table 4). We determined the adoption ceiling for agrivoltaics by considering the global technical potential of solar PV and the availability of cropland or grazing land suited to shading (Yeligeti et al., 2023).

Table 4. Adoption ceiling.

Unit: MW installed capacity

25th percentile 230,000,000
Mean 250,000,000
Median (50th percentile) 250,000,000
75th percentile 270,000,000
Left Text Column Width

Cropland accounts for only one-third of total agricultural land (Food and Agricultural Organization [FAO], 2023) and global estimates for agrivoltaics across cropland vary depending on assumptions about crop suitability, panel density, and grid access. A global suitability assessment of 18 major crops found approximately 4.64 million km² (464 million ha) of cropland suitable for agrivoltaics in an optimistic scenario, corresponding to a maximum installable capacity of around 217 million MW (Yeligeti et al., 2023). This technological ceiling aligns closely with the analysis of Campana et al. (2025), which projects annual electricity output of 385 PWh (≈ 284 million MW/yr). These optimistic figures assume favorable policy environments, technological advancement in panel design, financing, grid proximity and availability, and adoption of shade-tolerant crop varieties.

Despite the abundant 1.6 billion ha of global arable land (Chirinda et al., 2024), the adoption ceiling is unlikely to be reached due to other constraints (Yeligeti et al., 2023). Considerations for technoeconomic, political, and social effects, including land use changes, economic value of land, and shading effect, determine the actual upper limit for adoption. 

Achievable Adoption

In the low achievable scenario, agrivoltaics is projected to grow more than 20-fold, from 140,000 MW in 2023 to 2.5 million MW in 2050 (Table 5). This scenario accounts for real-world constraints, including fragmented land tenure, uneven grid access, regulatory barriers, and high up-front costs.

Table 5. Range of achievable adoption levels.

Unit: MW installed capacity

Current adoption 140,000
Achievable – low 2,500,000
Achievable – high 5,600,000
Adoption ceiling 250,000,000
Left Text Column Width

In the high achievable scenario, agrivoltaics is projected to grow more than 40-fold, from 140,000 MW in 2023 to 5.6 million MW in 2050 (Table 5). This scenario assumes the continuation of supportive government policies, with adoption primarily constrained by transmission availability. 

We estimated the achievable adoption ranges from scenarios reflecting technical limits (Campana et al., 2025; Yeligeti et al., 2023). These scenarios combine crop suitability and geospatial analysis to estimate annual potential electricity supply from agrivoltaics, constrained by electricity infrastructure. We then applied a mean scaling factor of 9.2% from previous work (Beck et al., 2012; Christ & Wagner, 2025; Trommsdorff et al., 2024) to convert these potential estimates to realizable scenarios. This scaling aligns with historical patterns and complementary international assessments.

Our low and high achievable scenarios fall within the observed market trends, reflecting a still nascent industry with significant but unevenly distributed growth potential.

Beyond the technical and financial considerations, achievable adoption is shaped and often superseded by non-quantitative social forces, where cultural norms, agricultural heritage, and local traditions fundamentally shape stakeholder acceptance (Asa’a et al., 2024; Walsh et al., 2026). Rural residents can perceive solar infrastructure as an industrial intrusion that is incompatible with the pastoral identity and landscape ideology of their communities (de Falco et al., 2025; Mahim et al., 2026; Morash & Pavao-Zuckerman, 2026; Swanson et al., 2025;). If agrivoltaics is framed merely as a technological fix without regard for these cultural values, it can lead to a social gap where broad societal approval for renewables fails to translate into local project success (Pascaris et al., 2021; Walsh et al., 2026).

The achievable adoption range of 2.5–5.6 million MW represents approximately 1–2.3% of the adoption ceiling of 250 million MW. The current adoption is roughly 0.06% of that ceiling. 

The current estimated climate impact of agrivoltaics is approximately 0.1 Gt CO₂‑eq/yr of reduced emissions (Table 6), based on 140,000 MW of global installed capacity and effectiveness of 720 t CO₂‑eq /MW/yr.

Table 6. Climate impact at different levels of adoption.

Unit: Gt CO₂‑eq/yr, 100-yr basis

Current adoption 0.1
Achievable – low 1.80
Achievable – high 4.10
Adoption ceiling 180
Left Text Column Width

Under the low achievable adoption scenario (2.5 million MW), annual emissions reductions could grow to about 1.8 Gt CO₂‑eq/yr.  

In the high achievable scenario (5.6 million MW), reductions could reach approximately 4.1 Gt CO₂‑eq/yr.  

We based the adoption ceiling solely on the technical potential of agrivoltaics, while neglecting social and economic constraints and realistic scenarios of future power demand. The electricity sector in 2023 emitted 15.6 Gt CO₂ ‑eq (International Energy Agency [IEA], 2024b); therefore, even if agrivoltaics could meet all current electricity demand, emissions reductions could not surpass this value without increased demand. Consequently, agrivoltaic systems are unlikely to reach 250 million MW of installed capacity in the next 100 years. But if current grid emissions were to remain constant while capacity increases, GHG emission reductions would be approximately 180 Gt CO₂ ‑eq/yr. This maximum is unrealistic as a forward-looking climate impact because it treats grid carbon intensity as permanently fixed at 2023 levels and ignores future decarbonization and corresponding decreases in marginal avoided emissions. Real-world climate impacts will depend on not only grid decarbonization and policy support, but also on system design choices and regional agricultural contexts.

By using only 1% of global agricultural land, agrivoltaics could offset 21 PWh/yr of electricity demand, equivalent to global electricity consumption in 2019 (Adeh et al., 2019). Even as demand grows, reaching ~29 PWh in 2023 (Ember, n.d.), the opportunity remains massive. 

Additional Benefits

Heat Stress

Daytime air temperatures surrounding agrivoltaics are lower than traditional utility PV systems that are usually installed over gravel (Pandey et al., 2025). This cooling effect is mostly attributed to evapotranspiration from the crops underneath PV panels (Barron-Gafford et al., 2019). 

Income and Work

Agrivoltaics can diversify income sources for farmers (Campana et al., 2025) by allowing them to export excess power to the grid to generate revenue (Dinesh & Pearce, 2016; Trommsdorff et al., 2025). PV revenue often outweighs revenue from agriculture (Malu et al., 2017; Lytle et al., 2021). Because agrivoltaics are more expensive to install than traditional PV systems, they are often installed at larger scales on larger farms (Campana et al., 2025). In these cases, the income and revenue benefits may be shared between the farmer and a third-party investor. 

New roles in installation, maintenance, and agrivoltaics management also create rural employment opportunities, particularly in regions where energy poverty and food insecurity overlap (Chirinda et al., 2024).

Food Security

Because agrivoltaics lower daytime temperatures, they can increase yields of crops that are sensitive to high temperatures, such as fruits and seed-bearing vegetables (Scarano et al., 2025). This is especially pertinent to drought-prone areas, where agrivoltaics have been shown to increase crop yields in water-stressed systems. For example, a study of crop yields in semi-arid southwestern United States found that yields of peppers and cherry tomatoes were double in agrivoltaic systems relative to those under traditional agriculture (Barron-Gafford, 2019). In addition to shade, agrivoltaic systems can protect crops from weather events such as hail and wind (Pandey et al., 2025). Agrivoltaic fields can also be used for livestock grazing, such as cattle and sheep, maintaining meat and dairy production on solar land while panel shading relieves animal heat stress and improves forage digestibility (Andrew et al., 2021).

Energy Availability

The efficiency of PV panels starts to decrease as cell temperatures rise above 25 °C (Chirinda et al., 2024). The cooler temperatures surrounding agrivoltaic systems can increase electricity production per panel (Adeh et al., 2019). In many environments, vegetation below the PV panels provides a cooling effect that boosts annual electricity output by 1–3% (Barron-Gafford et al., 2019).

Health

Solar PV reduces the emission of pollutants such as nitrogen oxides, sulfur dioxide, and PM2.5 from fossil-fuel energy generation (Abel et al., 2018; Millstein et al., 2024; Millstein et al., 2017; Wiser et al., 2016). This offers health benefits, including reduced premature mortality. The magnitude and distribution of these benefits depend on the local electricity grid mix, the fuels used to generate electricity, and atmospheric conditions that determine how far pollutants travel (Buonocore et al., 2019). Regions with a higher proportion of coal-powered electricity generation will often see more health benefits (Buonocore et al., 2019). Pollutants can travel long distances after they are emitted, so air pollution benefits can be widespread (Millstein et al., 2024).

These health benefits often translate into cost savings associated with reductions in hospital admissions, improved respiratory and cardiovascular conditions, and work and school days that might have otherwise been missed due to illness (Millstein et al., 2017; Wiser et al., 2016).

Nature Protection

Agrivoltaic systems that integrate pollinator-friendly habitats can increase pollination and may even increase crop yields in surrounding farmland (Macknick 2022; Walston et al., 2018).

Animal Well-being

Shade from the panels can relieve heat stress for livestock when temperatures are high (Maia et al., 2020; Carvalho Fonsêca et al., 2023) 

Land Resources

Agrivoltaics can help avoid land use conflicts because the PV panels are placed on land already used for agriculture (Swanson et a., 2025). 

Water Resources

Agrivoltaics may reduce water use up to 50% compared to traditional agricultural systems (Scarano et al., 2025). Reduced solar radiation from shading can reduce soil evaporation rates and enhance water savings for crops (Amaducci et al., 2018). Additionally, water used to clean panels and suppress dust can be reused for irrigation (Patel et al., 2019 ).

Air Quality

For air quality benefits, please refer to the “health” section. 

Risks

Large-scale rollout of agrivoltaics carries several risks. Rapid deployment without adequate storage, grid flexibility, or transmission can elevate curtailment rates. This undermines financial returns and emissions reductions, creating financial risks from high solar deployment and integration (Firoozi et al., 2025; Zubi et al., 2024). Higher up-front capital requirements also expose farmers and developers to revenue risk if crop yields decrease or electricity prices fluctuate (Campana et al., 2025). These financial risks can be mitigated with policy levers, including carbon taxes, though different levers are needed at different adoption levels (Brown & Reichenberg, 2021). 

Lack of regulatory clarity regarding dual-use land may stall adoption (Campana et al., 2025). This lack of legal status often leads to reclassification of agricultural land to energy or industrial use, creating ambiguity over property-tax rates and potentially triggering farmland occupation taxes (Chirinda et al., 2024). Furthermore, reclassification can result in the loss of agricultural subsidies, such as the European Union’s Common Agricultural Policy (CAP) payments, and jeopardize eligibility for crop insurance programs (Smith, 2024; Trommsdorff et al., 2025). Without a clear regulatory framework to differentiate agrivoltaics from standard ground-mounted solar, conflicting goals between energy and agricultural ministries can cause substantial administrative delays and financial uncertainty (Chirinda et al., 2024). 

Agricultural and environmental risks include soil compaction from construction and machinery traffic, reducing infiltration, root growth, and long-term soil fertility. This effect is amplified where heavy equipment must navigate under elevated panels (Campana et al., 2025; Chirinda et al., 2024). Poorly managed end-of-life PV components also risk chemical pollution (Chirinda et al., 2024). 

Finally, social and distributive justice risks can impede adoption. Visual landscape impacts and inequitable benefit-sharing between energy developers and tenant farmers can spark opposition and erode community support. The potential displacement of tenant farmers is a major socioeconomic risk (Campana et al., 2025; Chirinda et al., 2024). Because solar developers offer lease rates that significantly outbid traditional agricultural rents, landowners are increasingly incentivized to prioritize energy production over farming (Morash & Pavao-Zuckerman, 2026 Sorensen et al., 2022; Swanson et al., 2025). Furthermore, high solar leases can drive up overall land prices, making it difficult for new or disadvantaged farmers to access land (Morash & Pavao-Zuckerman, 2026). Without inclusive participatory processes and clear land use agreements, agrivoltaics expansion risks eroding social cohesion and economic viability of the farming communities it is intended to sustain (Campana et al., 2025; Trommsdorff et al., 2025). Ensuring that projects reflect local values, such as community stewardship over simple ownership, is crucial to mitigating the risk of eroding social cohesion of agricultural communities (Seay-Fleming et al., 2025; Trommsdorff et al., 2025).

Interactions with Other Solutions

Reinforcing

The microclimate effects of agrivoltaics can reduce the volume of water required to achieve equivalent crop yields, amplifying the impact of farm-level irrigation efficiency improvements. Electricity generated by solar PV can power irrigation pumps.

By reducing evapotranspiration and moderating temperate and water stress on crops, agrivoltaic systems can reduce agricultural water demand. In water-stressed and arid regions, this interaction can improve food system resilience.

Increased availability of renewable energy from agrivoltaics helps reduce emissions from the electricity grid as a whole. Reduced emissions from the electricity grid lead to lower downstream emissions for solutions that rely on electricity use. Deploying agrivoltaics also supports increased integration of wind power technologies by diversifying the renewable energy mix and reducing exposure to wind variability.

Electrification of transportation systems will be more beneficial in reducing global emissions if the underlying grid includes a higher proportion of non-emitting power sources. Electric transportation systems can also reduce curtailment of solar energy through controlled-time charging and other load-shifting technologies.

Competing

Since wind and solar can generate electricity at the same times of day, deploying agrivoltaics could create competition for grid connections, lower daytime electricity revenues, and suppress adoption of additional wind power.

Use of agricultural land for dedicated bioenergy crop production represents a competing land use, albeit agrivoltaics may offer higher combined energy and food productivity per hectare.

Widespread agrivoltaic deployment on high irradiance agricultural land could reduce the land base available for utility-scale concentrated solar in regions where both are technically viable, albeit the two solutions target different land type and scales.

Consensus
Dashboard

Solution Basics

MW installed capacity

t CO₂-eq (100-yr)/unit/yr
720
units
Current 140,000 02.5×10⁶5.6×10⁶
Achievable (Low to High)

Climate Impact

Gt CO₂-eq (100-yr)/yr
Current 0.1 1.84.1
Gradual

CO₂ , CH₄, N₂O

Trade-offs

Agrivoltaics may involve an inherent trade-off between agricultural productivity and energy conversion efficiency. Well-sited and properly designed systems typically cause no significant declines in agricultural productivity and can even stabilize or increase biomass production in certain conditions (Pandey et al., 2025). Poorly designed systems, however, can underperform both stand-alone agriculture and stand-alone PV on key sustainability metrics (Campana et al., 2025; Trommsdorff et al., 2025).

Elevated panels require extra steel and aluminum, increasing embodied emissions by roughly 20% compared with utility-scale solar PV (Busch & Wydra, 2023). These embodied emissions are modest, up to 100 times lower than the operational savings from displacing fossil fuel–based electricity (Pandey et al., 2025). 

The net climate benefit is greatest in carbon-intensive grids. It diminishes, however, where grid decarbonization is already rapid or where yield losses on prime farmland shift food production to other land, triggering indirect land use change emissions (Agostini et al., 2021; Campana et al., 2025). Water-use efficiency and microclimate cooling can partially offset yield penalties in hot, dry climates, but gains may be small or negative in temperate or wet climates (Campana et al., 2025; Pandey et al., 2025). Overall benefits depend on careful siting, crop selection, and policies that offset higher installation costs while avoiding land-use competition.

Action Word
Deploy
Solution Title
Agrivoltaics
Classification
Highly Recommended

Lawmakers and Policymakers

  • Set ambitious long-term renewable energy goals in national climate plans and multilateral agreements; incorporate agrivoltaics into national climate, energy, and agriculture plans. 
  • Create clear and easy-to-understand regulations that support agrivoltaics deployment and attract investment; use flexible definitions to encourage innovation; ground policies in scientific evidence, incorporating the latest data on the impacts to grid stability, microgrids development, soil carbon, biodiversity, and water management; avoid rigid annual yield requirements; allow flexibility in subsidy programs and regulations to give farmers using agrivoltaics greater choice in crop selection.
  • Create clear guidelines for installing and operating agrivoltaics to optimize land productivity while minimizing soil compaction and other environmental impacts.
  • Coordinate agrivoltaic policies horizontally (e.g., across agencies) and vertically (e.g., across subnational, national, and international efforts); align social and environmental safeguards with agrivoltaic policies.
  • Provide financial incentives to developers and farmers, such as subsidies (especially to reduce up-front cost), feed-in tariffs, tax credits, grants, green bonds, waived grid connection fees, and forgivable or concessional loans; gradually reduce subsidies as markets mature; offer farmers increased incentives for farmer-owned systems; prioritize smallholder and low- to middle-income farmers.
  • Streamline permitting procedures for agrivoltaic projects; standardize documents such as templates for power purchase agreements (PPAs).
  • Develop long-term, flexible partnership frameworks with industry, including adaptable or aggregated PPAs, aligned with national decarbonization targets and timelines.
  • Implement or strengthen renewable portfolio standards, clean energy standards, or other similar policy mechanisms with carve-outs for agrivoltaics.
  • Implement carbon taxes and redirect fossil-fuel subsidy savings into agrivoltaics and renewables.
  • Invest in grid-enhancing technologies, flexibility, storage, and transmission infrastructure to manage variable generation.
  • Work with industry to diversify solar panel supply chains; design incentives and policies to stimulate local or regional production, and advance R&D for solar and related equipment, such as batteries.
  • Strengthen labor and human rights laws and standards around solar PV supply chains; invest in enforcement mechanisms – particularly for the extraction and use of critical minerals and panel manufacturing.
  • Strengthen land tenure rights; clarify rules allowing agrivoltaics on agricultural land; differentiate agrivoltaics from conventional ground-mounted solar panels; create supportive policies to deploy agrivoltaic systems for restoring abandoned or contaminated land.
  • Require environmental and health impact assessments before installation and during operation.
  • Co-design agrivoltaic projects with relevant stakeholders; ensure the stakeholder engagement process starts early and is transparent, inclusive, and ongoing; solicit feedback from the local community on location, design, and finance; ensure finalized projects address relevant sociological, agriculture, and ecological considerations.
  • Ensure regulations support diverse development and ownership models (e.g., build-own-operate, public-private partnerships, energy communities, and cooperatives).
  • Establish strong quality control requirements for all stages of deployment, including resource extraction, manufacturing, installation, maintenance, and end-of-life service for solar panels used in agrivoltaics; create certification programs for each stage of the process.
  • Require or encourage manufacturers to provide minimum warranties; establish independent grievance mechanisms to resolve customer disputes and help foster trust in the industry.
  • Work with the private sector on workforce training programs, professional certifications, and capacity development for all project phases.
  • Partner with insurance agencies to develop tailored products for farmers adopting agrivoltaics.
  • Implement strong end-of-life regulations for solar panels, including extended producer responsibility (EPR) for manufacturers; support markets for reuse, refurbishment, and recycling.
  • Join, create, or participate in public-private partnerships dedicated to de-risking markets, deployment, technology transfers, education, and other relevant areas.
  • Expand extension services with agrivoltaics-specific guidance, demonstration projects, and peer learning; work with energy agencies to raise awareness; create accessible one-stop-shop educational programs (online and in-person) on regulations, benefits, and best practices, tailored to local contexts. 

Further information:

Practitioners

  • Farmer / Solar Provider: Take advantage of government incentives such as subsidies, grants, tax credits, or waived-connection fees; as the market matures, gradually reduce reliance on these incentives to create long-term market stability.
  • Solar Provider: Conduct careful planning and thorough consultation with farmers to determine the best installation practices; minimize disruption to farming operations and customize configurations to each farmer’s needs and planting schedules.
  • Farmer / Solar Provider: AMinimize soil compaction during installation and servicing with techniques such as scheduling installations during farming off seasons or using specialized equipment.
  • Solar Provider: Use a variety of panel systems, including vertical, single-axis, and dual-axis tracking systems in addition to fixed-tilt systems; improve optimization strategies for single-axis and dual-axis systems and integrate sun-tracking with agricultural strategies, crop selectivity, and soil and weather monitoring systems.
  • Solar Provider: Offer tools or services to help farmers navigate solar arrays more easily, such as geospatial navigation systems, remote sensors, and vision-assisted navigation systems.
  • Solar Provider: Avoid the use of concrete and permanent structures when installing PV systems on farmland.
  • Solar Provider: Offer a variety of business arrangements for farmers, such as pay-as-you-go build-own-operate models, revenue-sharing agreements, and flat lease payments.
  • Solar Provider: Provide options and guidance to improve visual attractiveness of agrivoltaic systems, such as hedges, strategic spacing, and panel coloring.
  • Solar Provider: Standardize agrivoltaic system designs for different geographies and agriculture applications.
  • Farmer / Solar Provider: Consult on maintenance and cleaning protocols, accounting for food safety, the need to reduce soil compaction, and other relevant environmental or health regulations.
  • Solar Provider: Use geospatial and satellite data to assess landscape, market dynamics, and potential customer base.
  • Solar Provider: Design agrivoltaic minigrid systems for compatibility with the main grid to enable future connection. 
  • Solar Provider: Reduce customer acquisition costs using machine learning models to identify potential customers and eligible sites.
  • Solar Provider / Regulator: Collaborate with the public sector to diversify solar panel supply chains; leverage incentives and policies that stimulate local or regional production and advance R&D.
  • Solar Provider: Ensure supply chains comply with international labor and human rights laws and standards, particularly for the extraction of critical minerals and panel manufacturing.
  • Solar Provider: Work to decarbonize the full life cycle, including supply chains, production, installation, recycling, and disposal.
  • Solar Provider / Regulator: Partner with the public sector and private organizations to develop workforce training programs; ensure capacity development for all stages of deployment, including installation best practices and end-of-life services.
  • Farmer / Solar Provider: Stay abreast of and engage with changing policies, regulations, zoning laws, tax incentives, and related developments to help remove commercial barriers.
  • Farmer / Solar Provider: Join, create, or participate in public-private partnerships dedicated to de-risking markets, deployment, technology transfers, education, and other relevant areas.
  • [Farmer / Solar Provider] Help expand extension services and create educational opportunities, including demonstration projects and peer-to-peer learning, in agrivoltaics; work with energy agencies to raise awareness.

Further information:

Business Leaders

  • Set ambitious long-term renewable energy goals; incorporate agrivoltaics, where feasible, into corporate net-zero strategies.
  • Support long-term, stable contracts (e.g., PPAs) that de-risk investment in agrivoltaic technologies and incentivize local supply chain development.
  • Invest in companies that produce, deploy, or provide end-of-life servicing for solar panels used for agrivoltaic systems; seek to diversify and localize supply chains.
  • Invest in R&D and related technology, such as batteries, navigation systems for farmers, and software to manage agrivoltaic systems.
  • Support workforce development programs, offer employee scholarships, and/or sponsor training for careers in agrivoltaics; help ensure capacity development for all stages of deployment, including installation and end-of-life services.
  • Offer pro bono business advice or general support for community and cooperative agrivoltaic projects.
  • Join, create, or participate in public-private partnerships dedicated to de-risking markets, deployment, technology transfers, education, and other relevant areas.

Further information:

Nonprofit Leaders

  • Advocate for ambitious long-term renewable energy goals in national climate plans and multilateral agreements; help incorporate agrivoltaics into national climate, energy, and agriculture plans. 
  • Operate or support agrivoltaic demonstration projects, equipment testing, certification, market information disclosures, and onsite supervision.
  • Conduct open-access research to improve the performance of solar PVs in agrivoltaic systems; research optimal crops and panel arrangements, forecasting, and related technologies; help standardize models across geographies and agricultural applications. 
  • Advocate for clear and easy-to-understand regulations that enable agrivoltaics deployment and investment; promote flexible definitions to allow for innovation; provide scientific evidence on the impacts to grid stability, microgrids, soil carbon, biodiversity, and water management; recommend avoiding rigid annual yield requirements and allowing farmers flexibility in crop selection in subsidy and insurance programs.
  • Contribute to clear guidelines for installing and operating agrivoltaics to optimize land productivity while minimizing soil compaction and other environmental impacts.
  • Urge governments to coordinate agrivoltaic policies horizontally (e.g., across agencies) and vertically (e.g., across subnational, national, and international efforts); help align social and environmental safeguards with agrivoltaic policies.
  • Advocate for streamlined permitting procedures and standardize documents such as templates for PPAs.
  • Offer financial assistance to farmers, cooperatives, or communities seeking to deploy agrivoltaics; advocate for targeted incentives to developers and farmers, such as subsidies (especially to reduce up-front cost), feed-in tariffs, tax credits, grants, green bonds, waived grid connection fees, and forgivable or concessional loans; recommend subsidies be gradually reduced as the market stabilizes; earmark funds and/or urge governments to earmark incentives for smallholder and low- and middle-income farmers.
  • Advocate for carbon taxes and redirection of fossil fuel subsidies into agrivoltaics and renewables.
  • Urge policymakers to invest in and subsidize grid-enhancing technologies, flexibility, storage, and transmission infrastructure to manage variable generation.
  • Work with policymakers and industry to diversify solar panel supply chains; help design incentives and policies to stimulate local or regional production; urge policymakers to invest in R&D for solar panels and related equipment such as batteries.
  • Help strengthen labor and human rights laws and standards around solar PV supply chains; invest in enforcement mechanisms – particularly for the extraction and use of critical minerals and panel manufacturing.
  • Help strengthen land tenure rights through documentation and advocacy; help policymakers clarify and allow agrivoltaics on agricultural land; differentiate agrivoltaics from conventional ground-mounted solar panels; create supportive policies to deploy agrivoltaic systems for restoring abandoned or contaminated land.
  • Offer services to conduct environmental and health impact assessments before installation and during operations of agrivoltaics.
  • Participate in community feedback sessions and co-design agrivoltaic projects with farmers, developers, and other relevant stakeholders.
  • Help create or support community agrivoltaics using a variety of development models and benefit-sharing arrangements (e.g., build-own-operate, publicly owned businesses, developer-owned businesses, public-private partnerships, energy communities, and cooperatives).
  • Create certification programs for all stages of deployment, including resource extraction, manufacturing, installation, maintenance, and end-of-life service for solar panels used in agrivoltaic systems.
  • Work with policymakers and the private sector to develop workforce training programs; ensure capacity development for all stages of deployment, including end-of-life services; create professional certifications for the full spectrum of roles.
  • Help create strong regulations for end-of-life services for solar panels; advocate for EPR for manufacturers; work with industry to foster a market for used, refurbished, and recycled panels.
  • Join, create, or participate in public-private partnerships dedicated to de-risking markets, deployment, technology transfers, education, and other relevant areas.
  • Help expand extension services and create educational opportunities, including demonstration projects and peer-to-peer learning in agrivoltaics; work with energy agencies to raise awareness.

Further information:

Investors

  • Offer low-interest loans and concessional financing to farmers, panel manufacturers, developers, operators, recyclers, and others involved in agrivoltaics.
  • Invest directly in agrivoltaics projects.
  • Invest in companies that produce, deploy, or provide end-of-life servicing for solar panels used in agrivoltaics; support supply chain localization and diversification.
  • Invest in supportive infrastructures, such as utility companies and grid development.
  • Invest in green bonds and/or explore blended finance structures to mobilize capital for agrivoltaics and enabling infrastructure.
  • Invest in solar panel recycling infrastructure and circular supply chains.
  • Invest in R&D for component technology and related equipment, such as batteries.
  • Help de-risk agrivoltaics adoption in low- and middle-income communities through low-interest loans, concessional financing, and/or favorable terms.
  • Align investments with existing public-private partnerships, voluntary agreements, or voluntary guidance that may apply in the location of the investment.

Further information:

Philanthropists and International Aid Agencies

  • Advocate for ambitious long-term renewable energy goals in national climate plans and multilateral agreements; help incorporate agrivoltaics into national climate, energy, and agriculture plans. 
  • Operate agrivoltaic demonstration projects, equipment testing, certification systems, market information disclosures, and onsite supervision.
  • Offer low-interest loans and concessional financing for farmers, panel manufacturers, developers, operators, recyclers, and others involved in agrivoltaics.
  • Award grants for the development of agrivoltaics projects and/or adjacent areas such as mini-grids.
  • Award grants to or invest in companies that produce, deploy, or provide end-of-life servicing for solar panels used in agrivoltaics; seek to diversify and localize supply chains.
  • Provide financing for supportive infrastructures, such as utility companies and grid development.
  • Invest in green bonds and/or explore blended finance structures to mobilize capital for companies developing or deploying agrivoltaics and supportive infrastructure.
  • Finance recycling infrastructure for solar panels and circular supply chains.
  • Help de-risk transitions to agrivoltaic systems in low- and middle-income communities by earmarking a percentage of grant funds and/or offering low-interest loans, concessional financing, and/or favorable terms.
  • Conduct open-access research to improve the performance of solar PVs in agrivoltaic systems; research optimal crops and panel arrangements, forecasting, and related technologies; help standardize models across geographies and agricultural applications. 
  • Help create clear and easy-to-understand regulations that enable agrivoltaics deployment and investment; promote flexible definitions to allow for innovation; provide scientific evidence for the impacts to grid stability, microgrids, soil carbon, biodiversity, and water management; recommend avoiding rigid annual yield requirements and allowing farmers flexibility in crop selection in subsidy and insurance programs.
  • Contribute to clear guidelines for installing and operating agrivoltaics to optimize land productivity while minimizing soil compaction and other environmental impacts.
  • Urge governments to coordinate agrivoltaic policies horizontally (e.g., across agencies) and vertically (e.g., across subnational, national, and international efforts); help align social and environmental safeguards with agrivoltaic policies.
  • Advocate for streamlined permitting procedures and standardize documents such as templates for PPAs.
  • Call on governments to provide financial incentives to developers and farmers, such as subsidies (especially to reduce up-front cost), feed-in tariffs, tax credits, grants, green bonds, waived grid connection fees, and forgivable or concessional loans; recommend subsidies be gradually reduced as the market stabilizes; urge governments to earmark incentives for smallholder, low- and middle-income farmers.
  • Advocate for carbon taxes and redirection of fossil fuel subsidies into agrivoltaics and renewables.
  • Urge policymakers to invest in and subsidize grid enhancing technologies, flexibility, storage, and transmission infrastructure to manage variable generation.
  • Work with policymakers and industry to diversify solar panel supply chains; help design incentives and policies to stimulate local or regional production and advance R&D for solar panels and related equipment such as batteries.
  • Help strengthen labor and human rights laws and standards around solar PV supply chains; invest in enforcement mechanisms – particularly for the extraction and use of critical minerals and panel manufacturing.
  • Help strengthen land tenure rights through documentation and advocacy; help policymakers clarify and allow agrivoltaics on agricultural land; differentiate agrivoltaics from conventional ground-mounted solar panels; create supportive policies to deploy agrivoltaic systems for restoring abandoned or contaminated land.
  • Offer or support services to conduct environmental and health impact assessments before installation and during operations of agrivoltaics.
  • Participate in community feedback sessions and co-design agrivoltaic projects with farmers, developers, and other relevant stakeholders.
  • Help create or support community agrivoltaics using a variety of development models and benefit-sharing arrangements (e.g., build-own-operate, publicly owned businesses, developer-owned businesses, public-private partnerships, energy communities, and cooperatives).
  • Finance or create certification programs for all stages of deployment, including resource extraction, manufacturing, installation, maintenance, and end-of-life service for agrivoltaic systems. 
  • Work with policymakers and the private sector to develop workforce training programs; ensure capacity development for all stages of deployment, including end-of-life services; create professional certifications for the full spectrum of roles.
  • Help create strong regulations for end-of-life services for solar panels; advocate for EPR for manufacturers; work with industry to foster a market for used, refurbished, and recycled panels.
  • Join, create, or participate in public-private partnerships dedicated to de-risking markets, deployment, technology transfers, education, and other relevant areas.
  • Help expand extension services or create educational opportunities that offer options for deployment, technical guidance, demonstration projects, and peer-to-peer learning opportunities in agrivoltaics; work with energy agencies to raise awareness.

Further information:

Thought Leaders

  • Advocate for ambitious long-term renewable energy goals in national climate plans and multilateral agreements; help incorporate agrivoltaics into national climate, energy, and agriculture plans. 
  • Operate agrivoltaic demonstration projects, equipment testing, certification systems, market information disclosures, and onsite supervision.
  • Conduct open-access research to improve the performance of solar PV in agrivoltaic systems; research optimal crops and panel arrangements, forecasting, and related technologies; help standardize models across geographies and agricultural applications. 
  • Help create clear and easy-to-understand regulations that enable agrivoltaics deployment and investment; promote flexible definitions to allow for innovation; provide scientific evidence on the impacts to grid stability, microgrids, soil carbon, biodiversity, and water management; recommend avoiding rigid annual yield requirements and allowing farmers flexibility in crop selection in subsidy and insurance programs. 
  • Contribute to clear guidelines for installing and operating agrivoltaics to optimize land productivity while minimizing soil compaction and other environmental impacts.
  • Urge governments to coordinate agrivoltaic policies horizontally (e.g., across agencies) and vertically (e.g., across subnational, national, and international efforts); help align social and environmental safeguards with agrivoltaic policies.
  • Advocate for streamlined permitting procedures and standardize documents such as templates for PPAs.
  • Call on governments to provide financial incentives to developers and farmers, such as subsidies (especially to reduce up-front cost), feed-in tariffs, tax credits, grants, green bonds, waived grid connection fees, and forgivable or concessional loans; recommend subsidies be gradually reduced as the market stabilizes; urge policymakers to earmark incentives for smallholder, low- and middle-income farmers.
  • Advocate for carbon taxes and redirection of fossil fuel subsidies into agrivoltaics and renewables.
  • Urge policymakers to invest in and subsidize grid-enhancing technologies, flexibility, storage, and transmission infrastructure to manage variable generation.
  • Help strengthen labor and human rights laws and standards around solar PV supply chains; invest in enforcement mechanisms –particularly, for the extraction and use of critical minerals and panel manufacturing.
  • Help strengthen land tenure rights through documentation and advocacy; help policymakers clarify and allow agrivoltaics on agricultural land; differentiate agrivoltaics from conventional ground-mounted solar panels; create supportive policies to deploy agrivoltaic systems for restoring abandoned or contaminated land.
  • Offer services to conduct environmental and health impact assessments before installation and during operations of agrivoltaics.
  • Participate in community feedback sessions and co-design agrivoltaic projects with farmers, developers, and other relevant stakeholders.
  • Help create certification programs for all stages of deployment, including resource extraction, manufacturing, installation, maintenance, and end-of-life service for agrivoltaic systems.
  • Work with policymakers and the private sector to develop workforce training programs; ensure capacity development for all stages of deployment, including end-of-life services; create professional certifications for the full spectrum of roles.
  • Help create strong regulations for end-of-life services for solar panels; advocate for EPR for manufacturers; work with industry to foster a market for used, refurbished, and recycled panels.
  • Join, create, or participate in public-private partnerships dedicated to de-risking markets, deployment, technology transfers, education, and other relevant areas.
  • Help expand extension services or create educational opportunities that offer options for deployment, technical guidance, demonstration projects, and peer-to-peer learning opportunities in agrivoltaics; work with energy agencies to raise awareness.

Further information:

Technologists and Researchers

  • Design solar panels and mounting systems that reduce material requirements and overall system weight.
  • Research lighter-weight materials for agrivoltaic systems and evaluate their technical, economic, and environmental feasibility. 
  • Advance scientific understanding of optimal crop selection for agrivoltaic systems; improve solar panel wavelength selectivity; develop standardized system configurations for specific geographies and agricultural applications; identify optimal spacing requirements for various arrangements.
  • Research soil compaction impacts in agrivoltaic systems, ways to prevent or minimize it during site preparation and installation, and ways to alleviate or reverse it post-installation – with priority on approaches compatible with ongoing PV operations and long-term soil health.
  • Identify ways to reduce the impact of agrivoltaic systems on satellite signals to improve navigation technology.
  • Improve semi-transparent photovoltaic panels to increase efficiency and reduce costs for agrivoltaic systems.
  • Examine the impacts of agrivoltaics on soil health, water management, biodiversity, and other environmental factors.
  • Create publicly accessible databases of agrivoltaic models, performance data, and best practices.
  • Assess policy frameworks and regulations that enable or inhibit agrivoltaics adoption. 
  • Identify barriers to adoption for farmers; research impacts of agrivoltaics on property value and land classification.
  • Improve and update spatial data on power grid locations and available transmission capacities, especially in rural and underserved areas.
  • Examine the impacts of agrivoltaics on food security, energy access, and rural communities.
  • Advance the use of AI or other technological tools for predictive analytics, yield forecasting, and power system control.
  • Improve recycling infrastructure and scalable technologies to repair, reuse, or recover materials from solar panels.
  • Improve related mining technologies for critical minerals, making the extraction process safer, less disruptive to local communities and ecosystems, and less energy intensive.
  • Develop ways of eliminating, reducing, reusing, and/or safely disposing of hazardous by-products of PV manufacturing.
  • Research social factors that drive community acceptance and the role of agrivoltaics in a fair and just energy transition. 

Further information:

Communities, Households, and Individuals

  • Help create or support community agrivoltaic projects using models such as build-own-operate, public-private partnerships, energy communities, and cooperatives.
  • Take advantage of available government incentives such as subsidies, tax breaks, and forgivable or concessional loans for community agrivoltaic projects.
  • Advocate for ambitious long-term renewable energy goals in national climate plans and multilateral agreements.
  • Call on governments to provide financial incentives to developers and farmers, such as subsidies (especially to reduce up-front cost), feed-in tariffs, tax credits, grants, green bonds, waived grid connection fees, and forgivable or concessional loans; recommend subsidies be gradually reduced as the market stabilizes; urge policymakers to earmark incentives for smallholder, low- and middle-income farmers.
  • Advocate for carbon taxes and the redirection of fossil fuel subsidies into agrivoltaics and renewables.
  • Urge policymakers to invest in and subsidize improvements to grid integration and flexibility, storage, and infrastructure to manage variable generation.
  • Participate in community feedback sessions and co-design agrivoltaic projects with farmers, developers, and other relevant stakeholders.
  • Join, create, or participate in public-private partnerships dedicated to de-risking markets, deployment, technology transfers, education, and other relevant areas.
  • Volunteer with community agrivoltaic projects; participate in public awareness campaigns; share information with your community and networks regarding the benefits of agrivoltaic systems.

Further information:

Evidence Base

Consensus of overall effectiveness of agrivoltaics: High

A wide range of peer-reviewed studies, meta-analyses, and life-cycle assessments provide strong evidence that agrivoltaics reduce GHG emissions. International organizations such as the Intergovernmental Panel on Climate Change (IPCC) and IEA identify rapid solar PV deployment as a critical component in mitigation pathways and net-zero scenarios. Life-cycle assessments show that, despite 20% higher embodied emissions from elevated structures compared with conventional solar PV, agrivoltaic systems deliver significant net emissions reductions by displacing fossil generation while maintaining agricultural output on the same footprint (Agostini et al., 2021; Barron-Gafford et al., 2019; Campana et al., 2025).

There is sufficient evidence that well-sited agrivoltaic systems increase land-use efficiency, and can provide additional benefits including reduced water stress, avoided land-use conflict, and improved solar PV performance in suitable climates (Barron-Gafford et al., 2019; Campana et al., 2025; Dupraz et al., 2011; Trommsdorff et al., 2025). Meta-analyses show manageable yield responses for shade-tolerant or neutral crops, especially in arid and semi-arid regions (Chirinda et al., 2024; Mamun et al., 2022); however yields for shade-intolerant crops or in temperate and humid climates are less consistent. Higher capital costs, site-specific challenges, and limited long-term data beyond two to three growing seasons create economic uncertainty. 

Consensus is mixed regarding net emissions savings of solar PV, given the diurnal nature of solar energy and the need for storage or other energy resources to meet peak evening demand. There is also a lack of global scientific or regulatory consensus regarding the definition of agrivoltaics, with qualification thresholds for which agricultural activities and what level of activity constitutes dual-use land varying substantially across jurisdictions (Trommsdorff et al., 2025).

This summary draws from 5 reviews and meta-analyses, 25 institutional reports, 6 market reports, and 32 original studies covering more than 25 countries, with strongest evidence from Europe, North America, East Asia, and select arid regions. We recognize this limited geographic scope creates bias toward higher-income and temperate-to-arid settings. Further research and data sharing in underrepresented low-income regions is required, where land, water, and energy pressures makes agrivoltaic systems potentially most impactful.

Updated Date
Coming Soon Label
Coming Soon

Produce Biochar

Image
Image
Biochar
Coming Soon
On

Key Takeaways

  • By transforming carbon absorbed by plants and animals into a highly stable form, large-scale biochar production and application to soils could potentially remove 0.13–0.47 Gt CO₂‑eq/yr.
  • The carbon permanence of biochar can range from hundreds to thousands of years when applied to soil, but more research is needed to understand durability in response to real-world soil and environmental factors.
  • Biochar increases soil health and nutrient availability. This can increase yields of a variety of staple crops, but benefits vary across soil types.
Summary

Producing biochar is the process of taking organic matter such as crop residues, animal manure, and forest residues and converting it into a charcoal-like substance known as biochar. Producing biochar removes carbon from the atmosphere by transforming carbon absorbed by plants and animals and into a highly stable form, preventing it from quickly returning to the atmosphere (Belmont & Sanchez, 2025). Biochar can be used as a soil amendment, a replacement for certain construction materials, or for filtration or pollution remediation. This solution focuses on large-scale production of biochar for soil application.

Description for Social and Search
Producing biochar takes the carbon from organic wastes (agricultural and forestry wastes) and converts it into a stable form that will sequester the carbon for hundreds of years. Biochar is mainly used as a soil amendment where it can improve soil fertility.
Overview

Biochar is a charcoal-like substance that is mainly produced by burning organic matter in an oxygen-deficient environment, a process called pyrolysis (Spears, 2018; Figure 1). Biochar production converts the carbon in the organic matter into a stable form that is not readily released into the atmosphere. 

This solution considers producing biochar from agricultural (crop residue, manure) or industrial (forest residue) waste feedstocks. It does not include using purpose-grown plants, edible portions of food or feed crops, or other non-waste feedstocks, which could compete for land use and reduce the climate benefits. We focused on biochar facilities that process 1,000 or more metric tons of waste per year (Amonette et al., 2021). We included both pyrolysis and gasification in our analysis; however, the proportion of carbon that is turned into biochar can differ between processes (NorthX, 2025). We excluded hydrothermal processing of wet biomass that produces hydrochar from our analysis because the carbon storage properties differ from those of typical biochar (Lehmann & Joseph, 2015).

Co-products such as bio-oil or syngas can be produced during biochar production and used as energy or sold. Using biochar can have climate benefits in addition to storing carbon, such as avoiding the production of methane from waste (Afshar & Mofatteh, 2024) and enhancing soil carbon sequestration in certain soil types (Yang et al., 2025). This solution focuses only on the carbon sequestered in biochar. We do not quantify potential avoided waste emissions, reduced energy use from co-products, or any enhanced sequestration after soil application. 

Figure 1. Example of a biochar production process. The conversion of 100% of biomass carbon to 50% biochar is specific to the pyrolysis process and can vary with different temperatures and methods used.

Image
Diagram of biochar process.

Source: International Biochar Initiative. (n.d.). Why Biochar. Retrieved 6 March 2026.

This solution focuses on biochar use as a soil additive in soils where it can improve soil organic matter as well as help retain water and nutrients. The carbon permanence of biochar can range from hundreds to thousands of years when applied to soil (Belmont & Sanchez, 2025). Biochar also can be used in filtration or remediation applications or as a filler material in building materials such as asphalt or concrete (Amonette et al., 2022).

References

Afshar, M., & Mofatteh, S. (2024). Biochar for a sustainable future: Environmentally friendly production and diverse applications. Results in Engineering, 23, Article 102433. Link to source: https://doi.org/10.1016/j.rineng.2024.102433

Agegnehu, G., Bass, A. M., Nelson, P. N., & Bird, M. I. (2016). Benefits of biochar, compost and biochar–compost for soil quality, maize yield and greenhouse gas emissions in a tropical agricultural soil. Science of The Total Environment, 543, 295–306. Link to source: https://doi.org/10.1016/j.scitotenv.2015.11.054

Alayaki, F. M., Hajikarimi, P., Meky, N., Rashid, S., & Fini, E. H. (2025). Global applications of biochar in sustainable cities of the future: A perspective. Biochar X, 1(1), Article e010. Link to source: https://doi.org/10.48130/bchax-0025-0009

Aman, A. M. N., Selvarajoo, A., Lau, T. L., & Chen, W.-H. (2022). Biochar as cement replacement to enhance concrete composite properties: A review. Energies, 15(20), Article 7662. Link to source: https://doi.org/10.3390/en15207662 

Amonette, James. E., Archuleta, J. G., Fuchs, M. R., Hills, K. M., Yorgey, G. G., Flora, G., Hunt, J., Han, H.-S., Jobson, B. T., Miles, T. R., Page-Dumroese, D. S., Thompson, S., Trippe, K. M., Wilson, K., Baltar, R., Carloni, K., Christoforou, C., Collins, D. P., Dooley, J., … Wheeler, E. (2021). Biomass to biochar: Maximizing the carbon value. Center for Sustaining Agriculture and Natural Resources, Washington State University, Pullman WA. Link to source: https://csanr.wsu.edu/biomass2biochar/

Baek, N., Lee, S.-I., Pia, H. I., Park, S.-W., Shin, E.-S., Lee, J., Kim, H.-Y., & Choi, W-.J. (2025). Biochar effects on methane emission from rice paddy differ with nitrogen fertilization, organic inputs, and water management. Korean Journal of Soil Science and Fertilizer, 58(1), 133-143. Link to source: https://doi.org/10.7745/KJSSF.2025.58.1.133 

Belmont, E. L., & Sanchez, D. L. (2025, July 8). Biochar’s long game: Unraveling the science of carbon permanence. Carbon Direct. Link to source: https://www.carbon-direct.com/research-and-reports/biochars-long-game-unraveling-the-science-of-carbon-permanence

Bhuvaneshwari, S., Hettiarachchi, H., & Meegoda, J. N. (2019). Crop residue burning in India: Policy challenges and potential solutions. International Journal of Environmental Research and Public Health, 16(5), Article 832. Link to source: https://doi.org/10.3390/ijerph16050832

Bijay-Singh, & Craswell, E. (2021). Fertilizers and nitrate pollution of surface and ground water: An increasingly pervasive global problem. SN Applied Sciences, 3(4), Article 518. Link to source: https://doi.org/10.1007/s42452-021-04521-8

British Columbia Centre for Innovation & Clean Energy & Deloitte. (2023). Carbon management blueprint report: Attracting investments in British Columbia. Link to source: https://northx.ca/intelligence/bc-carbon-management-blueprint-report

British Columbia Centre for Innovation & Clean Energy & Innovative Breakthrough Energy Technologies. (2024). Catalyzing carbon dioxide removal at scale. Link to source: https://northx.ca/announcements/catalyzing-carbon-dioxide-removal-at-scale-new-report-released

Buss, W., Wurzer, C., Manning, D. A. C., Rohling, E. J., Borevitz, J., & Mašek, O. (2022). Mineral-enriched biochar delivers enhanced nutrient recovery and carbon dioxide removal. Communications Earth & Environment, 3(67). Link to source: https://doi.org/10.1038/s43247-022-00394-w

Energy Transitions Commission. (2022). Mind the gap: How carbon dioxide removals must complement deep decarbonisation to keep 1.5°C alive. Link to source: https://www.energy-transitions.org/publications/mind-the-gap-cdr/

Fuss, S., Lamb, W. F., Callaghan, M. W., Hilaire, J., Creutzig, F., Amann, T., Beringer, T., de Oliveira Garcia, W., Hartmann, J., Khanna, T., Luderer, G., Nemet, G. F., Rogelj, J., Smith, P., Vicente, J. L. V., Wilcox, J., del Mar Zamora Dominguez, M., & Minx, J. C. (2018). Negative emissions—part 2: Costs, potentials and side effects. Environmental Research Letters, 13(6). Link to source: https://doi.org/10.1088/1748-9326/aabf9f

Genesio, L., Vaccari, F. P., & Miglietta, F. (2016). Black carbon aerosol from biochar threats its negative emission potential. Global Change Biology, 22(7), 2313–2314. Link to source: https://doi.org/10.1111/gcb.13254

Griscom, B. W., Adams, J., Ellis, P. W., Houghton, R. A., Lomax, G., Miteva, D. A., Schlesinger, W. H., Shoch, D., Siikamäki, J. V., Smith, P., Woodbury, P., Zganjar, C., Blackman, A., Campari, J., Conant, R. T., Delgado, C., Elias, P., Gopalakrishna, T., Hamsik, M. R., … Fargione, J. (2017). Natural climate solutions. Proceedings of the National Academy of Sciences, 114(44), 11645–11650. Link to source: https://doi.org/10.1073/pnas.1710465114

Grossi, G., Goglio, P., Vitali, A., & Williams, A. G. (2019). Livestock and climate change: Impact of livestock on climate and mitigation strategies. Animal Frontiers, 9(1), 69–76. Link to source: https://doi.org/10.1093/af/vfy034

Gupta, S. (2019). Agriculture crop residue burning and its consequences on respiration health of school-going children. Global Pediatric Health, 6, Article 333794X19874679. Link to source: https://doi.org/10.1177/2333794X19874679

Huang, T., Ma, J., Song, S., Ling, Z., Macdonald, R. W., Gao, H., Tao, S., Shen, H., Zhao, Y., Liu, X., Tian, C., Li, Y., Jia, H., Lian, L., & Mao, X. (2022). Health and environmental consequences of crop residue burning correlated with increasing crop yields midst India’s green revolution. Npj Climate and Atmospheric Science, 5(1). Link to source: https://doi.org/10.1038/s41612-022-00306-x

Intergovernmental Panel on Climate Change. (2018). Strengthening and implementing the global response (Special Report: Global Warming of 1.5 oC). Link to source: https://www.ipcc.ch/sr15/chapter/chapter-4/

Intergovernmental Panel on Climate Change. (2022). Chapter 7: Agriculture, forestry and other land uses (AFOLU). Link to source: https://www.ipcc.ch/report/ar6/wg1/chapter/chapter-7/

International Biochar Initiative. (n.d.). Why Biochar. Retrieved 6 March 2026, from  https://biochar-international.org/why-biochar/

International Biochar Initiative. (2014). State of the biochar industry 2013. Link to source: https://biochar-international.org/state-of-the-biochar-industry-2013/

International Biochar Initiative. (2015). State of the biochar industry 2014. Link to source: https://biochar-international.org/state-of-the-biochar-industry-2014/

International Biochar Initiative. (2016). State of the biochar industry 2015. Link to source: https://biochar-international.org/state-of-the-biochar-industry-2015/

International Biochar Initiative. (2024). 2023 Global biochar market report. Link to source: http://145249425.hs-sites-eu1.com/2023-global-biochar-market-report

International Biochar Initiative & HAMERKOP. (2025). Announcing the updated manual for biochar carbon removal. Link to source: https://biochar-international.org/news/announcing-the-updated-manual-for-biochar-carbon-removal/

International Renewable Energy Agency. (2018). Biogas for road vehicles technology brief. Link to source: https://www.irena.org/publications/2017/Mar/Biogas-for-road-vehicles-Technology-brief

Joseph, S., Cowie, A. L., Van Zwieten, L., Bolan, N., Budai, A., Buss, W., Cayuela, M. L., Graber, E. R., Ippolito, J. A., Kuzyakov, Y., Luo, Y., Ok, Y. S., Palansooriya, K. N., Shepherd, J., Stephens, S., Weng, Z. (Han), & Lehmann, J. (2021). How biochar works, and when it doesn’t: A review of mechanisms controlling soil and plant responses to biochar. GCB Bioenergy, 13(11), 1731–1764. Link to source: https://doi.org/10.1111/gcbb.12885

Kabir, E., Kim, K.-H., & Kwon, E. E. (2023). Biochar as a tool for the improvement of soil and environment. Frontiers in Environmental Science, 11. Link to source: https://doi.org/10.3389/fenvs.2023.1324533

Krause, M., Kenny, S., Stephenson, J., & Singleton, A. (2023). Quantifying methane emissions from landfilled food waste. U.S. Environmental Protection Agency. Link to source: https://www.epa.gov/land-research/quantifying-methane-emissions-landfilled-food-waste

Kumar, P., Kumar, S., & Joshi, L. (2015). The extent and management of crop stubble. In P. Kumar, S. Kumar, & L. Joshi (Eds), Socioeconomic and Environmental Implications of Agricultural Residue Burning: A Case Study of Punjab, India (pp. 13–34). Springer India. Link to source: https://doi.org/10.1007/978-81-322-2014-5_2

Lan, R., Eastham, S. D., Liu, T., Norford, L. K., & Barrett, S. R. H. (2022). Air quality impacts of crop residue burning in India and mitigation alternatives. Nature Communications, 13(1), Article 6537. Link to source: https://doi.org/10.1038/s41467-022-34093-z

Lefebvre, D., Fawzy, S., Aquije, C. A., Osman, A. I., Draper, K. T., & Trabold, T. A. (2023). Biomass residue to carbon dioxide removal: Quantifying the global impact of biochar. Biochar, 5(1). Link to source: https://doi.org/10.1007/s42773-023-00258-2

Lehmann, J., Cowie, A., Masiello, C. A., Kammann, C., Woolf, D., Amonette, J. E., Cayuela, M. L., Camps-Arbestain, M., & Whitman, T. (2021). Biochar in climate change mitigation. Nature Geoscience, 14, 883–892. Link to source: https://doi.org/10.1038/s41561-021-00852-8

Lenton, T. M. (2010). The potential for land-based biological CO2 removal to lower future atmospheric CO2 concentration. Carbon Management, 1(1), 145–160. Link to source: https://doi.org/10.4155/cmt.10.12

Liang, P.-C., & Chen, W.-H. (2025). Present and future prospects of biochar. ACS Sustainable Resource Management, 2(5), 684–686. Link to source: https://doi.org/10.1021/acssusresmgt.5c00139

NorthX. (2025). Biocarbon rising: From concept to commercialization. Link to source: https://northx.ca/intelligence/biocarbon-rising

Petersen, S. O., Blanchard, M., Chadwick, D., Del Prado, A., Edouard, N., Mosquera, J., & Sommer, S. G. (2013). Manure management for greenhouse gas mitigation. Animal, 7, 266–282. Link to source: https://doi.org/10.1017/S1751731113000736

Porter, E. M., Bowman, W. D., Clark, C. M., Compton, J. E., Pardo, L. H., & Soong, J. L. (2013). Interactive effects of anthropogenic nitrogen enrichment and climate change on terrestrial and aquatic biodiversity. Biogeochemistry, 114(1), 93–120. Link to source: https://doi.org/10.1007/s10533-012-9803-3

Porter, S. (2020). Manure overload: Manure plus fertilizer overwhelms Minnesota’s land and water. Environmental Working Group. Link to source: http://www.ewg.org/interactive-maps/2020-manure-overload/

Prateep Na Talang, R., Na Sorn, W., Polruang, S., & Sirivithayapakorn, S. (2024). Alternative crop residue management practices to mitigate the environmental and economic impacts of open burning of agricultural residues. Scientific Reports, 14(1), Article 14372. Link to source: https://doi.org/10.1038/s41598-024-65389-3

Ravi, S., Sharratt, B. S., Li, J., Olshevski, S., Meng, Z., & Zhang, J. (2016). Particulate matter emissions from biochar-amended soils as a potential tradeoff to the negative emission potential. Scientific Reports, 6(1), Article 35984. Link to source: https://doi.org/10.1038/srep35984

Raza, M. H., Abid, M., Faisal, M., Yan, T., Akhtar, S., & Adnan, K. M. M. (2022). Environmental and health impacts of crop residue burning: Scope of sustainable crop residue management practices. International Journal of Environmental Research and Public Health, 19(8). Link to source: https://doi.org/10.3390/ijerph19084753

Russell, P. (2025, September 1). Locating the sweet spot for biochar carbon removal. Counteract. Link to source: https://counteract.vc/perspectives/locating-the-sweet-spot-for-biochar-carbon-removal

Sanchez, D., & Belmont, E. (2025, July 2). What is biochar? A carbon removal solution gaining ground. Carbon Direct. Link to source: https://www.carbon-direct.com/insights/what-is-biochar-a-carbon-removal-solution-gaining-ground

Sayara, T., & Sánchez, A. (2021). Gaseous emissions from the composting process: Controlling parameters and strategies of mitigation. Processes, 9(10), Article 1844. Link to source: https://doi.org/10.3390/pr9101844

Searchinger, T., Peng, L., Zionts, J., & Waite, R. (2023). The global land squeeze: Managing the growing competition for land. Link to source: https://www.wri.org/research/global-land-squeeze-managing-growing-competition-land

Simon, M. (2024, August 22). This simple farming technique can capture carbon for thousands of years. Grist. Link to source: https://grist.org/climate/biochar-farming-capture-carbon-thousands-of-years/

Singh, G., Gupta, M. K., Chaurasiya, S., Sharma, V. S., & Pimenov, D. Y. (2021). Rice straw burning: A review on its global prevalence and the sustainable alternatives for its effective mitigation. Environmental Science and Pollution Research, 28(25), 32125–32155. Link to source: https://doi.org/10.1007/s11356-021-14163-3

Smith, P., Calvin, K., Nkem, J., Campbell, D., Cherubini, F., Grassi, G., Korotkov, V., Le Hoang, A., Lwasa, S., McElwee, P., Nkonya, E., Saigusa, N., Soussana, J.-F., Taboada, M. A., Manning, F. C., Nampanzira, D., Arias-Navarro, C., Vizzarri, M., House, J., … Arneth, A. (2019). Which practices co-deliver food security, climate change mitigation and adaptation, and combat land degradation and desertification? Global Change Biology, 26(3), 1532–1575. Link to source: https://doi.org/10.1111/gcb.14878

Spears, S. (2018, May 16). What is biochar? Regeneration International. Link to source: https://regenerationinternational.org/2018/05/16/what-is-biochar/

Steinfeld, H., Gerber, P., Wassenaar, T., Castel, V., Rosales, M., & de Haan, C. (2006). Livestock’s long shadow: Environmental issues and options. Food and Agriculture Organization of the United Nations. Link to source: https://www.fao.org/4/a0701e/a0701e00.htm

The Institute for Carbon Removal Law and Policy. (2020). Fact sheet: Biochar. American University. Link to source: https://www.american.edu/sis/centers/carbon-removal/fact-sheet-biochar.cfm

Viger, M., Hancock, R. D., Miglietta, F., & Taylor, G. (2014). More plant growth but less plant defence? First global gene expression data for plants grown in soil amended with biochar. GCB Bioenergy, 7(4), 658–672. Link to source: https://doi.org/10.1111/gcbb.12182

Weng, Z. H., & Cowie, A. L. (2025). Estimates vary but credible evidence points to gigaton-scale climate change mitigation potential of biochar. Communications Earth & Environment, 6(259). Link to source: https://doi.org/10.1038/s43247-025-02228-x

Woolf, D., Amonette, J. E., Street-Perrott, F. A., Lehmann, J., & Joseph, S. (2010). Sustainable biochar to mitigate global climate change. Nature Communications, 1(56). Link to source: https://doi.org/10.1038/ncomms1053

Woolf, D., Lehmann, J., Ogle, S., Kishimoto-Mo, A. W., McConkey, B., & Baldock, J. (2021). Greenhouse Gas Inventory Model for Biochar Additions to Soil. Environmental Science & Technology, 55(21), 14795–14805. Link to source: https://doi.org/10.1021/acs.est.1c02425

Woolley, S., & Hallowell, B. (2018). Biochar: An overview. Biomass Controls. Link to source: https://biomasscontrols.com/biochar-overview/

Xiao, L., Feng, L., Yuan, G., & Wei, J. (2020). Low-cost field production of biochars and their properties. Environmental Geochemistry and Health, 42(6), 1569–1578. Link to source: https://doi.org/10.1007/s10653-019-00458-5

Yang, J., Xia, L., van Groenigen, K. J., Zhao, X., Ti, C., Wang, W., Du, Z., Fan, M., Zhuang, M., Smith, P., Lal, R., Butterbach-Bahl, K., Han, X., Meng, J., Liu, J., Cai, H., Cheng, Y., Liu, X., Shu, X., … Yan, X. (2025). Sustained benefits of long-term biochar application for food security and climate change mitigation. Proceedings of the National Academy of Sciences, 122(33), Article e2509237122. Link to source: https://doi.org/10.1073/pnas.2509237122

Credits

Lead Fellow

  • Jason Lam

Contributors

  • Ruthie Burrows, Ph.D.

  • James Gerber, Ph.D.

  • Daniel Jasper

  • Megan Matthews, Ph.D.

  • Alex Sweeney

Internal Reviewers

  • Amanda D. Smith, Ph.D.

  • Emily Cassidy

Effectiveness

We estimated that 1 metric ton of biochar produced and incorporated into soil will remove 0.84 t CO₂‑eq (0.82 t CO₂‑eq , 20-yr), after subtracting production emissions (Table 1). This assumes the primary feedstock is agricultural waste and forestry residue. Due to very limited direct production emissions data, we estimated that any carbon not stabilized in biochar is emitted as CO₂ or methane.

Producing and using biochar may have various additional benefits after application in different soil types (Yang et al., 2025). Afshar & Mofatteh (2024) found biochar applied to soils can reduce the production of methane from rice paddies, and Kabir et al. (2023) observed decreased nitrous oxide emissions from some soils treated with biochar. Because these additional benefits of biochar are context specific, our analysis of effectiveness in reducing GHGs focused only on the amount of carbon sequestered with biochar.

Biochar's carbon sequestration potential depends in part on the feedstock used, because carbon content varies with type of organic waste. Woolf et al. (2021) examined several globally abundant feedstocks and found that the carbon content of biochar can also vary depending on how the biochar is produced, ranging from 10–81% of the carbon found in the dry mass feedstocks. 

Table 1. Effectiveness at sequestering carbon.

Unit: t CO₂‑eq /t biochar, 100-yr basis

25th percentile 0.81
Mean 0.63
Median (50th percentile) 0.84
75th percentile 1.30
Left Text Column Width
Cost

To sequester 1 t CO₂‑eq with biochar, a biochar production facility will have an initial cost of around US$200/t biochar, an operating cost of roughly US$510/t biochar, and revenue of US$120/t biochar. However, these values do not include potential costs for applying biochar to soils. Globally, the net cost of producing and using biochar is roughly US$190/t biochar, based on literature estimates of abatement costs. Table 2 shows the cost per unit climate impact, based on net cost.

Our cost data only include revenue from the sale of biochar for soil amendment and do not include revenue from increased crop yield, carbon credit systems, or other by-products such as the thermal energy, syngas or bio-oils, which can be used to reduce energy costs or sold as fuel (Amonette et al., 2021). We found limited capital cost and revenue data; many sources (Buss et al., 2022; British Columbia Centre for Innovation & Clean Energy [CICE] & Deloitte, 2023; Fuss et al., 2018; IPCC, 2018; Liang & Chen, 2025; Russel et al., 2025) focused on the overall costs of biochar production. Operating costs include labor, feedstocks, transportation, and application of biochar, and can vary significantly (Liang & Chen, 2025; Shackley et al., 2014; Xiao et al, 2019). Xiao et al. (2019) found that it is possible to achieve low-cost biochar production at small scales. Some facilities may have a feedstock cost near zero with local organic waste, while others may have a high cost due to transportation and processing (International Renewable Energy Agency [IRENA], 2018).

We considered the baseline scenario where biomass is left to naturally decompose or is collected and processed for conventional disposal. We assumed baseline initial costs, operational costs, and revenue to be 0.

Table 2. Cost per unit climate impact.

Unit: 2023 US$/t CO₂‑eq , 100-yr basis

Median 230
Left Text Column Width

Methods and Supporting Data

Learning Curve

The processes and technologies for producing biochar are mature, and we were unable to find literature suggesting the costs to implement these solutions will fall in the future (The Institute for Carbon Removal, 2020). Even if technology costs drop over time, competition for feedstocks with bioenergy producers or composters could also increase production costs.

Speed of Action

Speed of action refers to how quickly a climate solution physically affects the atmosphere after it is deployed. This is different from speed of deployment, which is the pace at which solutions are adopted.

At Project Drawdown, we define the speed of action for each climate solution as emergency brake, gradual, or delayed.

Producing biochar is a GRADUAL climate solution. It has a steady, linear impact on the atmosphere. 

Caveats

Biochar properties may vary depending on the feedstock and production process. The carbon content of biochar can range from 10–81% of the carbon found in the feedstock (Woolf et al., 2021). Production processes also affect what co-products are produced: Slow pyrolysis generates more biochar, while fast pyrolysis boosts bio-oil production, and producing biochar with gasification will have syngas as the largest output (Afshar & Mofatteh, 2024). 

While strong evidence suggests that biochar sequesters carbon for hundreds to thousands of years, some uncertainties about permanence remain. Short-duration experiments have shown carbon loss over years or decades due to exposure to oxygen, water, and ultraviolet light, but these might not reflect real-world soil and environmental factors (Belmont & Sanchez, 2025). There is also evidence that co-application of biochar with nitrogen fertilizer can mitigate methane emissions in rice paddies (Baek et al., 2025). 

Current Adoption

We estimated that 380,000 t of biochar were produced in 2023 (Table 3).

We found only one source for current global annual production of biochar (International Biochar Initiative, 2024). These data were based on voluntary surveys of biochar producers with more than 1,000 respondents in 2023; we assumed it is an underestimate because it likely doesn’t include all biochar production facilities. 

Table 3. Current adoption level (2023).

Unit: t biochar produced and added to soil/yr

25th percentile 370,000
Mean 380,000
Median (50th percentile) 380,000
75th percentile 400,000
Left Text Column Width
Adoption Trend

We were only able to find adoption trend data for 2013, 2014, 2015, 2021, and 2023, all from the International Biochar Initiative (2014, 2015, 2016, 2024). These data rely on voluntary surveys; the source noted that some companies did not respond to the survey every year and that some biochar producers did not respond to the survey.

These adoption data show that biochar production has increased over time; however, it’s not clear whether this is due to increasing biochar production or increasing response rates from producers. 

Adoption Ceiling

Producing biochar has an estimated adoption ceiling of 1.3 billion t/yr (Table 4) based on reports from Energy Transition Commission (2022), Fuss et al. (2018), International Biochar Initiative (2024), IPCC (2022), Lehmann et al. (2021), Lenton (2010), NorthX, (2025), Smith et al. (2019), and Woolf et al. (2010). 

The adoption ceiling for biochar is often stated in terms of CO₂‑eq/yr removed. To convert this into metric tons of biochar we used the value of 1.9 t CO₂‑eq removed per mewtric ton of biochar produced given by the International Biochar Initiative (2024). In practice, the amount of carbon sequestered will depend on the feedstock used as well as the method used for producing biochar.

We based our analysis on the current level of organic waste produced by agriculture and industry. Many projections (Energy Transition Commission, 2022; Fuss et al., 2018; International Biochar Initiative, 2024; IPCC 2022; Lehmann et al., 2021; Lenton, 2010; NorthX, 2025; Smith et al., 2019; Woolf et al., 2010) show the technical potential of biochar production using all available waste biomass from agriculture or industry feedstocks. If biochar production is increased, we would expect to see more waste feedstocks used for biochar and less available for other climate solutions that use organic waste feedstocks.

Table 4. Adoption ceiling.

Unit: t biochar produced and added to soil/yr

25th percentile 530,000,000
Mean 1,100,000,000
Median (50th percentile) 1,300,000,000
75th percentile 1,600,000,000
Left Text Column Width
Achievable Adoption

Biochar production depends on the source and volume of feedstock. We estimate an achievable adoption of 160–570 Mt of biochar (Table 5). The low value was based on the projected biochar ceiling from Griscom et al. (2017), which excludes avoided emissions and partially accounts for restrictions in biomass availability. The high value aligns with IPCC (2022)’s estimate for the mitigation potential of biochar based on a US$100/t CO₂‑eq carbon price. The US$100/t CO₂‑eq carbon price is an indicator that biochar production will require economic support for widespread adoption and assumes that achievable biochar production is constrained more by economics than by biomass availability.

Large-scale biochar production will likely be limited by biomass competition with other climate solutions. Many sources do not specify how they calculated the amount of biomass available for biochar production, making it difficult to determine where achievable adoption would fall between the current adoption and the full technical adoption ceiling. We have chosen to be conservative for the high achievable adoption to reduce the chance of biochar production being restricted by feedstock constraints.

Table 5. Range of achievable adoption levels.

Unit: t biochar produced and added to soil/yr

Current adoption 380,000
Achievable – low 160,000,000
Achievable – high 570,000,000
Adoption ceiling 1,300,000,000
Left Text Column Width

Producing and using biochar has the potential to sequester a large amount of carbon emissions. While biochar currently sequesters 0 Gt CO₂‑eq/yr, we estimated 0.13–0.47 Gt CO₂‑eq/yr on a 100-yr basis (0.13–0.46 Gt CO₂‑eq/yr, 20-yr) could be sequestered (Table 6). The economics of building, operating, and maintaining biochar production facilities, along with biomass feedstock availability, will greatly affect how biochar production and use grows in the future. 

Producing biochar requires the use of biomass as a feedstock. Multiple climate solutions require biomass, and projected demand across solutions greatly exceeds supply. The deforestation that would be required to meet demand would produce emissions far greater than any mitigation gains from full deployment of these solutions (Searchinger, 2024). In addition to deforestation, there would also be costs and emissions incurred to transport biomass from where it is produced to where it can be processed and used. Thus, the estimated climate impacts presented here are only possible if feedstocks are prioritized for this solution. If feedstocks are instead prioritized for other climate solutions (see Interactions for examples), adoption and impact will be lower for this solution. It is not possible to set all biomass-dependent solutions to high adoption levels, add up their impacts, and determine an accurate combined emissions impact.

Table 6. Climate impact at different levels of adoption.

Unit: Gt CO₂‑eq/yr, 100-yr basis

Current adoption 0.00
Achievable – low 0.13
Achievable – high 0.47
Adoption ceiling 1.10
Left Text Column Width
Additional Benefits

Food Security

When used as a soil amendment, biochar has been found to increase soil health and yields of a variety of staple crops (Agegnehu et al., 2016; Kabir et al., 2023; Yang et al., 2025).

Health

Producing biochar can benefit health by mitigating the impacts of crop residue burning. Poor air quality from crop residue burning is harmful to health and can lead to premature mortality, especially in Southeast Asia, where residue burning is more common (Lan et al. 2022). Air pollution from burning crop residue has been linked to eye irritation, headaches, nausea, skin irritation, allergies, respiratory infections, increased risk of lung cancer, and reduced lung function (Gupta, 2019; Huang et al., 2022; Raza et al., 2022). 

Nature Protection

Using biochar can reduce nutrient-rich runoff from manure that can lead to eutrophication and hypoxic zones in aquatic ecosystems (Bijay-Singh & Craswell, 2021). Nitrogen pollution also harms terrestrial biodiversity through soil acidification and increases the productivity of fast-growing species, including invasives, which can outcompete native species (Porter et al., 2013).

Land Resources

By using crop residues instead of burning them, producing biochar can improve soils that would otherwise be degraded from crop residue burning (Bhuvaneshwari et al., 2019). 

When used as a soil amendment, biochar has been found to increase soil quality (Agegnehu et al., 2016). Biochar can aid in nutrient retention, including nitrogen, phosphorus, and soil organic carbon, and can improve soil water content (Agegnehu et al., 2016; Kabir et al., 2023; Yang et al., 2025). Some benefits depend on soil type; for example, amending biochar to mineral soils can increase soil pH, organic matter, and nutrient availability, especially in sandy and acidic soils, but soils with high pH could see a reduction in micronutrient availability (Yang et al., 2025).

Water Resources

Amending soil with biochar can increase soil water content, which can improve plant growth (Agegnehu et al., 2016; Kabir et al., 2013). 

Water Quality

Producing biochar can mitigate the use of manure on agriculture fields, which can improve water quality. Manure contains nutrients such as nitrogen and phosphorus as well as drug residues, heavy metals, and pathogens (Steinfeld et al., 2006). Manure can also leach into water sources when used as a fertilizer on croplands (Porter & Cox, 2020).

Air Quality

Producing biochar can benefit air quality by mitigating crop residue burning and the use of manure as fertilizer. Reducing the amount of manure applied as a fertilizer on croplands can improve air quality by reducing nitrogen and ammonia emissions associated with manure application (Grossi et al., 2019; Peterson et al., 2013; Steinfeld et al., 2006).

Crop residue burning is a major source of air pollution, including fine particulate matter, CO₂, and carbon monoxide, in South and Southeast Asia (Lan et al., 2022; Na Talang et al., 2024; Singh et al., 2021). Because fine particulate matter and black carbon make up a large part of the pollution, crop residue burning can lead to poor air quality far from agricultural fields (Kaskaoutis et al., 2014). Poor air quality associated with burning crop residues could be improved by instead producing biochar. 

Risks

The environmental impact of high adoption of biochar application in soils is unknown. Feasibility, long-term mitigation potential, side effects, and trade-offs are uncertain. Resolving these uncertainties will require biochar application on different soil types, environments, and management conditions in real-world settings for long periods (Fuss et al., 2018; Belmont & Sanchez, 2025).

The application of biochar could potentially change the microbial composition of the soils or lower the ability of plants to defend against insects, pathogens, and environmental stresses (Viger et al., 2014). It also could darken the soil surface, altering the land surface radiation balance. Fine biochar particles could get released into the atmosphere during production, transportation, or handling, leading to poor air quality, disrupted local hydrological cycles, and potential health concerns (Genesio et al., 2016; Ravi et al., 2016). GHG emissions from producing biochar differ across scales and technologies. Strategies to minimize the potentially negative impacts of biochar will need to be developed in order to guarantee that biochar has an overall positive impact on global climate change.

Interactions with Other Solutions

Reinforcing

Sayara & Sánchez (2021) observed reduced nitrogen emissions when biochar was added to compost.

Competing

Biochar production can compete with solutions that use biomass, specifically wood and crop residues, in other processes. Because the total projected demand for biomass for climate solutions exceeds the supply, not all of these solutions will be able to achieve their potential adoption. This solution competes with the following solutions for raw material:

Dashboard

Solution Basics

t biochar produced and added to soil

t CO₂-eq (100-yr)/unit/yr
00.810.84median
units/yr
Current 380,000 01.6×10⁸5.7×10⁸
Achievable (Low to High)

Climate Impact

Gt CO₂-eq (100-yr)/yr
Current 0 0.130.47
US$ per t CO₂-eq
230
Gradual

CO₂

Trade-offs

To preserve soil health and nutrient recovery, some agricultural and industrial forestry waste must be left on the land. If revenues from biochar production are very high, producers may be incentivized to convert additional land to grow crops for biochar. This could affect food security and soil health (CICE & Innovative Breakthrough Energy Technologies [IBET], 2023). 

Pyrolytic production of biochar can generate heat and power. However, different processes produce different outputs, and it is important to understand the economic considerations for biochar production (Afshar & Mofatteh, 2024). 

Biochar can be used to replace a small amount of cement in concrete production or incorporated into other building materials (Aman et al., 2022), but this limits its usage as a soil amendment and potential for enhanced soil carbon sequestration. However, using biochar in durable building materials stores carbon for multiple decades, while some agricultural applications could involve further combustion or decomposition of biochar and so release stored carbon back into the atmosphere within a few years. 

Action Word
Produce
Solution Title
Biochar
Classification
Highly Recommended

Lawmakers and Policymakers

  • Create strong regulatory frameworks and streamline permitting processes; if necessary, revise classification schemes for biochar production systems from “incinerators” to “carbon stabilizers”; fund necessary scientific assessments and convenings to develop robust regulatory framework.
  • Provide financial incentives such as payment for ecosystem services (PES), tax breaks, subsidies, or tax exemptions to support production, infrastructure, and biomass collection and delivery; offer subsidies for equipment purchases, equipment rentals, and biochar products such as soil amendments, construction materials, and other local uses.
  • Limit incentives for eligible feedstocks and biochar production to avoid unintended consequences such as land grabbing, deforestation, and land conversion.
  • Institute a carbon tax to incentivize the production of biochar while also discouraging burning crop residue and biomass.
  • Create or improve robust certification schemes for biochar – include clear governance models, standards for testing, systems and timelines for evaluation, and enforcement and verification mechanisms. 
  • Work with industry to develop products, supply chains, and markets; use public procurement when possible to help stabilize biochar markets.
  • Offer or subsidize biomass collection services; seek to establish local production and supply chains, aiming to minimize transportation of biomass and biochar products.
  • Co-design biochar projects with the local community; ensure community engagement starts early and is transparent, inclusive, and ongoing; solicit feedback from the local community – including from opposition groups – on location, design, finance, and mitigation; ensure finalized projects address sociological, agriculture, and ecological considerations.
  • Ensure projects operating in or with Indigenous communities only do so under Free, prior, and informed consent (FPIC); codify FPIC into legal systems.
  • Invest in R&D to optimize feedstock collection, biochar production, and biochar application to meet needs of local soils and/or rice paddies.
  • Invest in R&D for other uses of biochar beyond soil amendments, such as building materials and water treatment; research other land use applications, such as flood mitigation in upstream soils.
  • Establish one-stop-shop educational programs that use online and in-person methods to educate the industry and public on regulations, benefits of biochar, best practices, and other relevant information; ensure the material is sufficient and appropriate for local contexts, paying close attention to language barriers. 
  • Offer demonstration projects at relevant events and venues; expand agricultural extension services and ensure farmers are aware of biochar options, benefits, and incentives.
  • Work with industry to create high-integrity carbon markets that do not allow for deforestation and/or incentivize growing trees or crops solely for the production of biochar.
  • Join, create, or participate in public-private partnerships dedicated to de-risking markets, deployment, technology transfers, education, and other relevant areas.

Further information:

Practitioners

  • Fuel pyrolysis with by-products such as syngas and bio-oils and low-emission fuels.
  • Work to achieve consistent product quality; experiment with different equipment designs, feedstocks, applications, and products to identify locally optimal processes. 
  • Produce and/or invest in R&D to develop a variety of products beyond soil amendments, such as building materials and water filtration systems.
  • Invest in short- and long-term market analyses on entry points and possible products to meet local needs; help coordinate long-term research between public and private stakeholder groups. 
  • Secure written contracts for biomass feedstocks from suppliers to ensure consistent delivery.
  • Create and promote technical workforce and professional development programs; develop the full range of capacity to address every step of the value chain, including engineering, collection, biochemical sciences, product design, and business development.
  • Foster consumer awareness of biochar’s use and benefits through advertising and professional relationships.
  • Rent equipment for onsite production; offer a range of products that can accommodate different budgets and needs; offer services or rent equipment for post-production treatment processes and application.
  • Co-design biochar projects with the local community; ensure community engagement starts early and is transparent, inclusive, and ongoing; solicit feedback from the local community – including from opposition groups – on location, design, finance, and mitigation; ensure finalized projects address sociological, agriculture, and ecological considerations.
  • Ensure projects operating in or with Indigenous communities only do so under FPIC; codify FPIC into legal systems.
  • Create or improve robust certification schemes for biochar – include clear governance models, standards for testing, systems and timelines for evaluation, and enforcement and verification mechanisms. 
  • Advocate for favorable regulatory frameworks and incentives such as PES, tax breaks, subsidies, or exemptions to support production, infrastructure, and biomass collection and delivery; advocate for subsidies for equipment purchases, equipment rentals, and biochar products such as soil amendments, construction materials, and other local uses.
  • Establish one-stop-shop educational programs that use online and in-person methods to educate the industry and public on regulations, the benefits of biochar, best practices, and other relevant information; ensure the material is sufficient and appropriate for local contexts, paying close attention to language barriers. 
  • Offer demonstration projects at relevant events and venues; work with or advocate to expand agricultural extension services to ensure stakeholders are aware of biochar options, benefits, and incentives.
  • Work with policymakers and other stakeholders to create high-integrity carbon markets that do not allow for deforestation and/or incentivize growing trees or crops solely for the production of biochar.
  • Seek to establish local production and supply chains, aiming to minimize transportation of biomass and biochar products.
  • Join, create, or participate in public-private partnerships dedicated to de-risking markets, deployment, technology transfers, education, and other relevant areas.

Further information:

Business Leaders

  • If relevant, establish long-term procurement contracts with biochar producers; work with local producers to develop products and services.
  • Take advantage of government incentives such as tax credits, if possible; seek to gradually reduce reliance on these incentives to create long-term market stability.
  • Participate in community engagement processes; help co-design biochar projects with the local community; ensure community engagement starts early and is transparent, inclusive, and ongoing; solicit feedback from the local community – including from opposition groups – on location, design, finance, and mitigation; ensure finalized projects address sociological, agriculture, and ecological considerations.
  • Offer financial services, including low-interest loans, microfinancing, and grants, to support biochar initiatives.
  • Only purchase carbon credits from high-integrity, verifiable carbon markets, and do not use them as replacements for reducing emissions.
  • Support workforce development programs, offer employee scholarships, and/or sponsor training for careers in biochar.
  • Offer pro bono business advice or general support for community biochar projects using structures such as cooperative business models.
  • Join, create, or participate in public-private partnerships dedicated to de-risking markets, deployment, technology transfers, education, and other relevant areas.

Further information:

Nonprofit Leaders

  • Help operate or establish biochar collection, distribution, production, and/or processing facilities; advocate for government support in these areas when necessary; help ensure production and supply chains remain local, aiming to minimize transportation of biomass and biochar products.
  • If relevant, establish long-term procurement contracts with biochar producers; work with local producers to develop products and services.
  • Advocate for and help develop strong regulatory frameworks and streamlined permitting processes; if necessary, suggest revising classification of biochar production systems from incinerators to carbon stabilizers; advocate for funding necessary scientific assessments and convenings to develop a robust regulatory framework.
  • Advocate for favorable regulatory frameworks and incentives, such as PES, tax breaks, subsidies, or exemptions to support production, infrastructure, and biomass collection and delivery; advocate for subsidies for equipment purchases, equipment rentals, and biochar products, such as soil amendments, construction materials, and other local uses.
  • Advocate for carbon taxes and for restrictions, taxes, or bans on burning crop residue and biomass.
  • Help create or improve robust certification schemes for biochar; include clear governance models, standards for testing, systems and timelines for evaluation, and enforcement and verification mechanisms. 
  • Work with industry to develop products, supply chains, and markets; help coordinate public procurement when possible to help stabilize biochar markets.
  • Participate in community engagement processes; help co-design biochar projects with the local community; ensure community engagement starts early and is transparent, inclusive, and ongoing; solicit feedback from the local community – including from opposition groups – on location, design, finance, and mitigation; ensure finalized projects address sociological, agriculture, and ecological considerations.
  • Ensure projects operating in or with Indigenous communities only do so under FPICt; advocate to codify FPIC into legal systems.
  • Conduct R&D to match biochar production and post-treatment processes that can produce the type of biochar that meet the needs of local soils and/or rice paddies; help collect and share optimal feedstock, production, methods, and application combinations for various soil types.
  • Research other uses for biochar, such as building materials and water treatment; research other land use applications such as flood mitigation in upstream soils.
  • Establish one-stop-shop educational programs that use online and in-person methods to educate the industry and public on regulations, the benefits of biochar, best practices, and other relevant information; ensure the material is sufficient and appropriate for local contexts, paying close attention to language barriers. 
  • Offer demonstration projects at relevant events and venues; work with or advocate to expand agricultural extension services to ensure stakeholders are aware of biochar options, benefits, and incentives.
  • Work with industry to create high-integrity carbon markets that do not allow for deforestation and/or incentivize growing trees or crops solely for the production of biochar.
  • Join, create, or participate in public-private partnerships dedicated to de-risking markets, deployment, technology transfers, education, and other relevant areas.

Further information:

Investors

  • Invest in companies involved in the production biochar; ensure projects include thorough community engagement. 
  • Offer low-interest loans and concessional financing for companies developing biochar production facilities.
  • Invest in green bonds and/or explore blended finance structures to mobilize capital for companies involved in the production of biochar.
  • Align investments with existing public-private partnerships, voluntary agreements, or voluntary guidance that may apply in the location of the investment (including those that apply to biodiversity).

Further information:

Philanthropists and International Aid Agencies

  • Award grants directly to companies involved in biochar production; ensure projects include thorough community engagement. 
  • Offer low-interest loans and concessional financing for companies developing biochar production facilities.
  • Invest in or offer green bonds and/or explore blended finance structures to mobilize capital for companies involved in biochar production.
  • Help operate or establish biochar collection, distribution, production, and/or processing facilities; advocate for government support in these areas when necessary; help ensure production and supply chains remain local to minimize transportation of biomass and biochar products.
  • If relevant, establish long-term procurement contracts with biochar producers; work with local producers to develop products and services.
  • Advocate for and help develop strong regulatory frameworks and streamlined permitting processes; if necessary, suggest revising classification of biochar production systems from incinerators to carbon stabilizers; advocate for funding scientific assessments and convenings needed to develop a robust regulatory framework.
  • Advocate for favorable regulatory frameworks and incentives, such as PES, tax breaks, subsidies, or exemptions to support production, infrastructure, and biomass collection and delivery; advocate for subsidies for equipment purchases, equipment rentals, and biochar products, such as soil amendments, construction materials, and other local uses.
  • Advocate for carbon taxes and for restrictions, taxes, or bans on burning crop residue and biomass.
  • Help create or improve robust certification schemes for biochar – include clear governance models, standards for testing, systems and timelines for evaluation, and enforcement and verification mechanisms. 
  • Work with industry to develop products, supply chains, and markets; help coordinate public procurement when possible to help stabilize biochar markets.
  • Participate in community engagement processes; help co-design biochar projects with the local community; ensure community engagement starts early and is transparent, inclusive, and ongoing; solicit feedback from the local community – including from opposition groups – on location, design, finance, and mitigation; ensure finalized projects address sociological, agriculture, and ecological considerations.
  • Ensure projects operating in or with Indigenous communities only do so under FPIC; advocate to codify FPIC into legal systems.
  • Conduct R&D to match biochar production and post-treatment processes that can produce the type of biochar that meet the needs of local soils and/or rice paddies; help collect and share optimal feedstock, production, methods, and application combinations for various soil types.
  • Research other uses for biochar, such as building materials and water treatment; research other land use applications, such as flood mitigation in upstream soils.
  • Establish one-stop-shop educational programs that use online and in-person methods to educate the industry and public on regulations, the benefits of biochar, best practices, and other relevant information; ensure the material is sufficient and appropriate for local contexts, paying close attention to language barriers. 
  • Offer demonstration projects at relevant events and venues; work with or advocate to expand agricultural extension services to ensure stakeholders are aware of biochar options, benefits, and incentives.
  • Work with industry to create high-integrity carbon markets that do not allow for deforestation and/or incentivize growing trees or crops solely for the production of biochar.
  • Join, create, or participate in public-private partnerships dedicated to de-risking markets, deployment, technology transfers, education, and other relevant areas.

Further information:

Thought Leaders

  • Help operate or establish biochar collection, distribution, production, and/or processing facilities; advocate for government support in these areas when necessary; help ensure production and supply chains remain local to minimize transportation of biomass and biochar products.
  • Advocate for and help develop strong regulatory frameworks and streamlined permitting processes; if necessary, suggest revising classification of biochar production systems from incinerators to carbon stabilizers; advocate for funding necessary scientific assessments and convenings to develop a robust regulatory framework.
  • Advocate for favorable regulatory frameworks and incentives such as PES, tax breaks, subsidies, or exemptions to support production, infrastructure, and biomass collection and delivery; advocate for subsidies for equipment purchases, equipment rentals, and biochar products such as soil amendments, construction materials, and other local uses.
  • Advocate for carbon taxes and for restrictions, taxes, or bans on burning crop residue and biomass.
  • Help create or improve robust certification schemes for biochar – include clear governance models, standards for testing, systems and timelines for evaluation, and enforcement and verification mechanisms. 
  • Work with industry to develop products, supply chains, and markets; help coordinate public procurement when possible to help stabilize biochar markets.
  • Participate in community engagement processes; help co-design biochar projects with the local community; ensure community engagement starts early and is transparent, inclusive, and ongoing; solicit feedback from the local community – including from opposition groups – on location, design, finance, and mitigation; ensure finalized projects address sociological, agriculture, and ecological considerations.
  • Ensure projects operating in or with Indigenous communities only do so under FPIC; advocate to codify FPIC into legal systems.
  • Conduct R&D to match biochar production and post-treatment processes that can produce the type of biochar that meet the needs of local soils and/or rice paddies; help collect and share optimal feedstock, production, methods, and application combinations for various soil types.
  • Research other uses for biochar, such as building materials and water treatment; research other land use applications, such as flood mitigation in upstream soils.
  • Establish one-stop-shop educational programs that use online and in-person methods to educate the industry and public on regulations, the benefits of biochar, best practices, and other relevant information; ensure the material is sufficient and appropriate for local contexts, paying close attention to language barriers. 
  • Offer demonstration projects at relevant events and venues; work with or advocate to expand agricultural extension services to ensure stakeholders are aware of biochar options, benefits, and incentives.
  • Work with industry to create high-integrity carbon markets that do not allow for deforestation and/or incentivize growing trees or crops solely for the production of biochar.
  • Join, create, or participate in public-private partnerships dedicated to de-risking markets, deployment, technology transfers, education, and other relevant areas.

Further information:

Technologists and Researchers

  • Help standardize production and post-treatment processes; identify feedstocks and processes that align with needs such as soil additives, construction material, and water filtration. 
  • Help measure pollutants and GHGs from the biochar production process, including black carbon, methane, and nitrous oxide.
  • Create publicly accessible databases of biochar production processes and products; help model production methods to identify optimal engineering. 
  • Collect and catalog data on biophysical processes, biochar properties, feedstock formulas, application procedures, and biochar supply chains and markets.
  • Investigate potential impacts of biochar use on crops yields and biomass production; impacts on soil carbon stocks; GHG emissions reductions and fluxes; competition for biomass availability; carbon permanence; effects on nature, air quality, and biodiversity; and changes in application of other agricultural inputs such as fertilizers and herbicides.
  • Improve understanding of the role biochar can play in regenerating soils and microbial life.
  • Research and seek to improve the ability of biochar to remove heavy metals, plastics, PFAS, and other contaminants from soils.
  • Run long-term field investigations on the performance of biochar in asphalt and concrete; examine impacts on the urban heat island effect.

Further information:

Communities, Households, and Individuals

  • Explore uses for biochar in your garden or lawn; use biochar building materials or other biochar products.
  • Advocate for and help develop strong regulatory frameworks and streamlined permitting processes; if necessary, suggest revising classification of biochar production systems from incinerators to carbon stabilizers; advocate for funding necessary scientific assessments and convenings to develop a robust regulatory framework.
  • Advocate for favorable regulatory frameworks and incentives such as PES, tax breaks, subsidies, or exemptions to support production, infrastructure, and biomass collection and delivery; advocate for subsidies for equipment purchases, equipment rentals, and biochar products such as soil amendments, construction materials, and other local uses.
  • Advocate for carbon taxes and for restrictions, taxes, or bans on burning crop residue and biomass.
  • Help ensure projects operating in or with Indigenous communities only do so under FPIC; advocate to codify FPIC into legal systems.
  • Participate in community engagement processes; help co-design biochar projects with the local community; ensure community engagement starts early and is transparent, inclusive, and ongoing; solicit feedback from the local community – including from opposition groups – on location, design, finance, and mitigation; ensure finalized projects address sociological, agriculture, and ecological considerations.

Further information:

Evidence Base

Consensus of effectiveness in sequestering carbon: High

A wide variety of organic feedstocks can be used to produce biochar, mainly from the agricultural and industrial forestry sectors. Converting biomass into biochar using pyrolysis converts a portion of the carbon into a stable form, thereby slowing its release into the atmosphere. When biochar is used as a soil amendmen,t it improves soil fertility by retaining water and nutrients (Woolley & Hallowell, 2018).

The process used to create biochar can have varying efficiencies because the conversion of organic carbon in the feedstock to biochar can range from 30–55% with slow pyrolysis or be as low as 3% with regular combustion (Amonette et al., 2021). In addition, different biomass feedstocks contain different amounts of carbon, which will affect the carbon content of the biochar (Joseph et al., 2021).

Using biochar can also have additional benefits. Biochar can be used as filter material for remediation of soil or water pollution, an additive for composting or anaerobic digestion (Alayaki et al., 2025), or a supplement to concrete and other building materials, packaging, and bio-oils (Russell, 2025).

The results presented in this document summarize findings from 21 reviews and meta-analyses and 17 original studies reflecting current evidence from two countries (the United States and Canada) and from sources examining global biochar production. We recognize this limited geographic scope creates bias, and we hope this work inspires research and data sharing on this topic in underrepresented regions.

Updated Date
Coming Soon Label
Coming Soon

Deploy Biomass Crops on Degraded Land

Image
Image
Tree plantation
Coming Soon
On
Description for Social and Search
The Deploy Biomass Crops on Degraded Land solution is coming soon.

Methods and Supporting Data

Action Word
Deploy
Solution Title
Biomass Crops on Degraded Land
Classification
Highly Recommended
Updated Date
Coming Soon Label
Coming Soon

Deploy Silvopasture

Image
Image
Cows grazing among trees
Coming Soon
Off
Summary

We define the Deploy Silvopasture solution as the adoption of agroforestry practices that add trees to grazing land, including planted pastures and natural rangelands. (Note that this solution does NOT include creating forested grazing land by thinning existing forest; this is a form of deforestation and not desirable in terms of climate.) Some silvopastures are open savannas, while others are dense, mature tree plantations. The trees may be planted or managed to naturally regenerate. Some silvopasture systems have been practiced for thousands of years, while others have been recently developed. All provide shade to livestock; in some systems, the trees feed livestock, produce timber or crops for human consumption, or provide other benefits. New adoption is estimated from the 2025 level as a baseline which is therefore set to zero.

Description for Social and Search
Deploy Silvopasture is a Highly Recommended climate solution. It enhances carbon storage by adding trees to grazing land, including planted pastures and natural rangelands.
Overview

In silvopasture systems, trees are planted or allowed to naturally regenerate on existing pasture or rangeland. Tree density is generally less than forest, allowing sunlight through for good forage growth.

Silvopasture has multiple climate impacts, though carbon sequestration is the only one which has been thoroughly studied across all climates and sub-practices.

Silvopasture sequesters carbon in both soil and woody biomass. Carbon sequestration rates are among the highest of any farming system (Toensmeier, 2017). The lifetime accumulation of carbon in both soils and biomass is higher than for managed grazing alone (Montagnini et al., 2019; Nair et al., 2012).

Silvopasture can also reduce GHG emissions, though not in every case. We do not include emissions reductions in this analysis.

Conversion from pasture to silvopasture slightly increases capture and storage of methane in soils (Bentrup and Shi, in press). In addition, in fodder subtypes of silvopasture systems, ruminant livestock consume tree leaves or pods. Many, but not all, of the tree species used in these systems have tannin content that reduces emissions of methane from enteric fermentation (Jacobsen et al., 2019). 

Some subtypes of silvopasture reduce nitrous oxide emissions from manure and urine, as grasses and trees capture nitrogen that microbes would otherwise convert to nitrous oxide. There are also reductions to nitrous oxide emissions from soils: 76–95% in temperate silvopastures and 16–89% in tropical-intensive silvopastures (Ansari et al., 2023; Murguietio et al., 2016).

Many silvopasture systems increase productivity of milk and meat. Yield increases can reduce emissions from deforestation by growing more food on existing farmland, but in some cases can actually worsen emissions if farmers clear forests to adopt the profitable practice (Intergovernmental Panel on Climate Change [IPCC], 2019). The yield impact of silvopasture varies with tree density, climate, system type, and whether the yields of other products (e.g., timber) are counted as well (Rojas et al., 2022). 

References

Ansari, J., Udawatta, R. P., & Anderson, S. H. (2022). Soil nitrous oxide emission from agroforestry, rowcrop, grassland and forests in North America: a review. Agroforestry Systems, 97(8), 1465–1479. Link to source: https://doi.org/10.1007/s10457-023-00870-y

Basche, A., Tully, K., Álvarez-Berríos, N. L., Reyes, J., Lengnick, L., Brown, T., Moore, J. M., Schattman, R. E., Johnson, L. K., & Roesch-McNally, G. (2020). Evaluating the untapped potential of US conservation investments to improve soil and environmental health. Frontiers in Sustainable Food Systems, 4, 547876. Link to source: https://doi.org/10.3389/fsufs.2020.547876 

Batcheler, M., Smith, M. M., Swanson, M. E., Ostrom, M., & Carpenter-Boggs, L. (2024). Assessing silvopasture management as a strategy to reduce fuel loads and mitigate wildfire risk. Scientific Reports, 14(1), 5954. Link to source: https://doi.org/10.1038/s41598-024-56104-3

Bentrup, G. & Shi, X. (in press). Multifunctional buffers: Design guidelines for buffers, corridors and greenways. USDA Forest Service. 

Bostedt, G., Hörnell, A., & Nyberg, G. (2016). Agroforestry extension and dietary diversity–an analysis of the importance of fruit and vegetable consumption in West Pokot, Kenya. Food Security, 8, 271–284. Link to source: https://doi.org/10.1007/s12571-015-0542-x

Briske, D. D., Vetter, S., Coetsee, C., & Turner, M. D. (2024). Rangeland afforestation is not a natural climate solution. Frontiers in Ecology and the Environment. Link to source: https://doi.org/10.1002/fee.2727

Cadavid, Z., & BE, S. T. (2020). Sistemas silvopastoriles: aspectos teóricos y prácticos. CIPAV. Link to source: https://cipav.org.co/sdm_downloads/sistemas-silvopastoriles-aspectos-teoricos-y-practicos/

Cardinael, R., Umulisa, V., Toudert, A., Olivier, A., Bockel, L., & Bernoux, M. (2019). Revisiting IPCC Tier 1 coefficients for soil organic and biomass carbon storage in agroforestry systems. Environmental Research Letters, 13(12), 124020. Link to source: https://doi.org/10.1088/1748-9326/aaeb5f

Chapman, M., Walker, W.S., Cook-Patton, S.C., Ellis, P.W., Farina, M., Griscom, B.W., & Baccani, A. (2019). Large climate mitigation potential from adding trees to agricultural lands Global Change Biology, 26(80), 4357–4365. Link to source: https://doi.org/10.1111/gcb.15121

Chatterjee, N., Nair, P. R., Chakraborty, S., & Nair, V. D. (2018). Changes in soil carbon stocks across the forest-agroforest-agriculture/pasture continuum in various agroecological regions: A meta-analysis. Agriculture, ecosystems & environment, 266, 55–67. Link to source: https://doi.org/10.1016/j.agee.2018.07.014

Damania, Richard; Polasky, Stephen; Ruckelshaus, Mary; Russ, Jason; Amann, Markus; Chaplin-Kramer, Rebecca; Gerber, James; Hawthorne, Peter; Heger, Martin Philipp; Mamun, Saleh; Ruta, Giovanni; Schmitt, Rafael; Smith, Jeffrey; Vogl, Adrian; Wagner, Fabian; Zaveri, Esha. (2023). Nature's Frontiers: Achieving Sustainability, Efficiency, and Prosperity with Natural Capital. Environment and Sustainable Development series. Washington, DC: World Bank Link to source: https://hdl.handle.net/10986/39453

de Sherbinin, A., VanWey, L. K., McSweeney, K., Aggarwal, R., Barbieri, A., Henry, S., Hunter, L. M., Twine, W., & Walker, R. (2008). Rural household demographics, livelihoods and the environment. Global Environmental Change, 18(1), 38–53. Link to source: https://doi.org/10.1016/j.gloenvcha.2007.05.005

Den Herder, M., Moreno, G., Mosquera-Losada, R. M., Palma, J. H., Sidiropoulou, A., Freijanes, J. J. S., & Burgess, P. J. (2017). Current extent and stratification of agroforestry in the European Union. Agriculture, Ecosystems & Environment, 241, 121–132. Link to source: https://doi.org/10.1016/j.agee.2017.03.005

Di Prima, S., Wright, E. P., Sharma, I. K., Syurina, E., & Broerse, J. E. W. (2022). Implementation and scale-up of nutrition-sensitive agriculture in low- and middle-income countries: A systematic review of what works, what doesn’t work and why. Global Food Security, 32, 100595. Link to source: https://doi.org/10.1016/j.gfs.2021.100595

deStefano, A, & Jacobson, M.G. (2018). Soil carbon sequestration in agroforestry systems: A review. Agroforestry Systems, 92, 285–299. Link to source: https://doi.org/10.1007/s13593-014-0212-y

Dudley, N., Eufemia, L., Fleckenstein, M., Periago, M. E., Petersen, I., & Timmers, J. F. (2020). Grasslands and savannahs in the UN Decade on Ecosystem Restoration. Restoration Ecology, 28(6), 1313–1317. Link to source: https://doi.org/10.1111/rec.13272

Dupraz, C, and Liagre, F.(2011). Agroforesterie: Des Arbres et des Cultures. Editions France Agricole. Link to source: https://agroboutique.com/agroecologie-catalogue/12-agroforesterie-des-arbres-et-des-cultures.html

FAO Statistical Service (2024). FAOStat. Link to source: https://www.fao.org/faostat/en/

Feliciano, D., Ledo, A., Hillier, J., & Nayak, D. R. (2018). Which agroforestry options give the greatest soil and above ground carbon benefits in different world regions?. Agriculture, ecosystems & environment, 254, 117–129. Link to source: https://doi.org/10.1016/j.agee.2017.11.032

Frelat, R., Lopez-Ridaura, S., Giller, K. E., Herrero, M., Douxchamps, S., Djurfeldt, A. A., Erenstein, O., Henderson, B., Kassie, M., Paul, B. K., Rigolot, C., Ritzema, R. S., Rodriguez, D., Van Asten, P. J. A., & Van Wijk, M. T. (2016). Drivers of household food availability in sub-Saharan Africa based on big data from small farms. Proceedings of the National Academy of Sciences of the United States of America, 113(2), 458–463. Link to source: https://doi.org/10.1073/pnas.1518384112

Garrett, H. E., Kerley, M. S., Ladyman, K. P., Walter, W. D., Godsey, L. D., Van Sambeek, J. W., & Brauer, D. K. (2004). Hardwood silvopasture management in North America. In New Vistas in Agroforestry: A Compendium for 1st World Congress of Agroforestry, 2004 (pp. 21–33). Springer Netherlands. Link to source: https://doi.org/10.1007/978-94-017-2424-1_2

Goracci, J., & Camilli, F. (2024). Agroforestry and animal husbandry. IntechOpen. Link to source: https://doi.org/10.5772/intechopen.1006711

Government of Colombia (2020). Actualización de la Contribución Determinada a Nivel Nacional de Colombia. Government of Colombia. Link to source: https://unfccc.int/sites/default/files/NDC/2022-06/NDC%20actualizada%20de%20Colombia.pdf

Greene, H., Kazanski, C. E., Kaufman, J., Steinberg, E., Johnson, K., Cook-Patton, S. C., & Fargione, J. (2023). Silvopasture offers climate change mitigation and profit potential for farmers in the eastern United States. Frontiers in Sustainable Food Systems, 7, 1158459. Link to source: https://doi.org/10.3389/fsufs.2023.1158459

Hart, D.R.T, Yeo, S, Almaraz, M, Beillouin, D, Cardinael, R, Garcia, E, Kay, S, Lovell, S.T., Rosenstock, T.S., Sprenkle-Hyppolite, S, Stolle, F, Suber, M, Thapa, B, Wood, S & Cook-Patton, S.C (2023). “Priority science can accelerate agroforestry as a natural climate solution”. Nature Climate Change. Link to source: https://doi.org/10.5281/zenodo.8209212

Husak, A. L., & Grado, S. C. (2002). Monetary benefits in a southern silvopastoral system. Southern Journal of Applied Forestry, 26(3), 159–164. Link to source: https://doi.org/10.1093/sjaf/26.3.159

IPCC (2019). Climate Change and Land: an IPCC special report on climate change, desertification, land degradation, sustainable land management, food security, and greenhouse gas fluxes in terrestrial ecosystems [P.R. Shukla, J. Skea, E. Calvo Buendia, V. Masson-Delmotte, H.-O. Pörtner, D. C. Roberts, P. Zhai, R. Slade, S. Connors, R. van Diemen, M. Ferrat, E. Haughey, S. Luz, S. Neogi, M. Pathak, J. Petzold, J. Portugal Pereira, P. Vyas, E. Huntley, K. Kissick, M. Belkacemi, J. Malley, (eds.)]. Link to source: https://www.ipcc.ch/srccl/

IPCC AR6 WG3 (2022). Climate Change 2022: Mitigation of Climate Change. Contribution of Working Group III to the Sixth Assessment Report of the Intergovernmental Panel on Climate Change [P.R. Shukla, J. Skea, R. Slade, A. Al Khourdajie, R. van Diemen, D. McCollum, M. Pathak, S. Some, P. Vyas, R. Fradera, M. Belkacemi, A. Hasija, G. Lisboa, S. Luz, J. Malley, (eds.)]. Cambridge University Press, Cambridge, UK and New York, NY, USA. Link to source: https://doi.org/10.1017/9781009157926

Jacobsen (2019). Secondary metabolites in leaf hay as a mitigation option for enteric methane production in ruminants. Aarhus University. Link to source: https://pure.au.dk/ws/portalfiles/portal/197235590/Secondary_Metabolites_in_Leaf_Hay_as_a_Mitigation_Option_for_Enteric_Methane_Production_in_Ruminants.pdf

Jose, S., & Dollinger, J. (2019). Silvopasture: a sustainable livestock production system. Agroforestry systems, 93, 1-9. Link to source: https://doi.org/10.1007/s10457-019-00366-8

Lal, R., Smith, P., Jungkunst, H. F., Mitsch, W. J., Lehmann, J., Nair, P. R., & Ravindranath, N. H. (2018). The carbon sequestration potential of terrestrial ecosystems. Journal of soil and water conservation, 73(6), 145A–152A. Link to source: https://doi.org/10.2489/jswc.73.6.145A

Lee, S., Bonatti, M, Löhe, K, Palacios, V., Lana, M.A., and Sieber, S (2020). Adoption potentials and barriers of silvopastoral systems in Colombia: Case of Cundinamarca region. Cogent Environmental Science 6(1). Link to source: https://doi.org/10.1080/23311843.2020.1823632

Lemes, A. P., Garcia, A. R., Pezzopane, J. R. M., Brandão, F. Z., Watanabe, Y. F., Cooke, R. F., Sponchiado, M., Paz, C. C. P., Camplesi, A. C., Binelli, M., & Gimenes, L. U. (2021). Silvopastoral system is an alternative to improve animal welfare and productive performance in meat production systems. Scientific Reports, 11(1), 14092. Link to source: https://doi.org/10.1038/s41598-021-93609-7

Lorenz, K., & Lal, R. (2018). Carbon sequestration in agricultural ecosystems. Springer, Cham. Link to source: https://link.springer.com/book/10.1007/978-3-319-92318-5

Mehrabi, Z., Tong, K., Fortin, J., Stanimirova, R., Friedl, M., & Ramankutty, N. (2024). Global agricultural lands in the year 2015. Earth System Science Data Discussions, 2024, 1–44. Link to source: https://doi.org/10.5194/essd-2024-279

Montagnini, F (2019). Función de los sistemas agroforestales en la adaptación y mitigación del cambio climático. Sistemas agroforestales: Funciones productivas, socioeconómicas y ambientales, 269-299. Link to source: https://cipav.org.co/wp-content/uploads/2020/08/sistemas-agroforestales-funciones-productivas-socioeconomicas-y-ambientales.pdf

Morena, G., & Rolo, V. (2019). Agroforestry practices: Silvopastoralism. In Agroforestry for sustainable agricultura (1st ed.). Burleigh Dodds Science Publishing. Link to source: https://doi.org/10.1201/9780429275500

Murgueitio, E., Uribe, F., Molina, C., Molina, E., Galindo, W., Chará, J., & González, J. (2016). Establecimiento y manejo de sistemas silvopastoriles intensivos con Leucaena. Editorial CIPAV, Cali, Colombia. Link to source: https://www.researchgate.net/profile/Juan-Naranjo-R/publication/310460876_Establecimiento_y_manejo_de_sistemas_silvopastoriles_intensivos_con_leucaena/links/582e30cb08ae138f1c01d8b9/Establecimiento-y-manejo-de-sistemas-silvopastoriles-intensivos-con-leucaena.pdf

Nair, P.K. R. (2012). Climate change mitigation: A low-hanging fruit of agroforestry. Agroforestry: The future of global land use, 31–69. Link to source: https://doi.org/10.1007/978-94-007-4676-3_7

Ortiz, J., Neira, P., Panichini, M., Curaqueo, G., Stolpe, N. B., Zagal, E., & Gupta, S. R. (2023). Silvopastoral systems on degraded lands for soil carbon sequestration and climate change mitigation. Agroforestry for Sustainable Intensification of Agriculture in Asia and Africa, 207–242. Link to source: https://doi.org/10.1007/978-981-19-4602-8_7

Pent, G. J. (2020). Over-yielding in temperate silvopastures: a meta-analysis. Agroforestry Systems, 94(5), 1741–1758. Link to source: https://doi.org/10.1007/s10457-020-00494-6

Pezo, D., Ríos, N., Ibrahim, M., & Gómez, M. (2018). Silvopastoral systems for intensifying cattle production and enhancing forest cover: the case of Costa Rica. Washington, DC: World Bank. Link to source: https://www.profor.info/sites/default/files/Silvopastoral%2520systems_Case%2520Study_LEAVES_2018.pdf

Poudel, S., Pent, G., & Fike, J. (2024). Silvopastures: Benefits, past efforts, challenges, and future prospects in the United States. Agronomy, 14(7), 1369. Link to source: https://doi.org/10.3390/agronomy14071369

Quandt, A, Neufeldt, G, & Gorman, K (2023). Climate change adaptation through agroforestry: Opportunities and gaps. Current Opinion in Environmental Sustainability. 60, 101244. Link to source: https://doi.org/10.1016/j.cosust.2022.101244

Rivera, J. E., Serna, L., Arango, J., Barahona, R., Murgueitio, E., Torres, C. F., & Chará, J. (2023). Silvopastoral systems and their role in climate change mitigation and Nationally Determined Contributions in Latin America. In Silvopastoral systems of Meso America and Northern South America (pp. 25–53). Cham: Springer International Publishing. Link to source: https://doi.org/10.1007/978-3-031-43063-3_2

Rojas, D, & Rodriguez Anido, N. (2022) Potential of silvopastoral systems for the mitigation of greenhouse gasses generated in the production of bovine meat. In Sistemas silvopastoriles: Hacia una diversificación sostenible. CIPAV. Link to source: https://cipav.org.co/sistemas-silvopastoriles-hacia-una-diversificacion-sostenible/

Riset, J.Å., Tømmervik, H. & Forbes, B.C. (2019). Sustainable and resilient reindeer herding. Reindeer Caribou Health Dis, (23–43). Link to source: https://www.researchgate.net/publication/344787755_Ch13_Sustainable_and_resilient_reindeer_herding

Shelton, M., Dalzell, S., Tomkins, N. and Buck, S. R. (2021). Leucaena: The productive and sustainable forage legume. University of Queensland. Link to source: https://era.dpi.qld.gov.au/id/eprint/9425/

Shi, L., Feng, W., Xu, J., & Kuzyakov, Y. (2018). Agroforestry systems: Meta‐analysis of soil carbon stocks, sequestration processes, and future potentials. Land Degradation & Development, 29(11), 3886–3897. Link to source: https://doi.org/10.1002/ldr.3136

Smith, M. M., Bentrup, G., Kellerman, T., MacFarland, K., Straight, R., Ameyaw, L., & Stein, S. (2022). Silvopasture in the USA: A systematic review of natural resource professional and producer-reported benefits, challenges, and management activities. Agriculture, Ecosystems & Environment, 326, 107818. Link to source: https://doi.org/10.1016/j.agee.2021.107818

Sprenkle-Hyppolite, S. Griscom, B., Griffey, V., Munshi, E., Chapman, M. (2024). Maximizing tree carbon in cropland and grazing lands while sustaining yields. Carbon Balance and Management 19:23. Link to source: https://doi.org/10.1186/s13021-024-00268-y

Toensmeier, E. (2017). Perennial staple crops and agroforestry for climate change mitigation. Integrating landscapes: Agroforestry for biodiversity conservation and food sovereignty, 439-451. Link to source: https://doi.org/10.1007/978-3-319-69371-2_18

U.S. Department of Agriculture Natural Resources Conservation Service [USDA NRCS]. (2025). Conservation Practice Physical Effects [Dataset]. Link to source: https://www.nrcs.usda.gov/resources/guides-and-instructions/conservation-practice-physical-effects

Udawatta, R. P., Walter, D., & Jose, S. (2022). Carbon sequestration by forests and agroforests: A reality check for the United States. Carbon footprints, 1(8). Link to source: https://doi.org/10.20517/cf.2022.06 

Zeppetello, L. R. V., Cook-Patton, S. C., Parsons, L. A., Wolff, N. H., Kroeger, T., Battisti, D. S., Bettles, J., Spector, J. T., Balakumar, A., & Masuda, Y. J. (2022). Consistent cooling benefits of silvopasture in the tropics. Nature communications, 13(1), 708. Link to source: https://doi.org/10.1038/s41467-022-28388-4

Zhu, X., Liu, W., Chen, J., Bruijnzeel, L. A., Mao, Z., Yang, X., Cardinael, R., Meng, F.-R., Sidle, R. C., Seitz, S., Nair, V. D., Nanko, K., Zou, X., Chen, C., & Jiang, X. J. (2020). Reductions in water, soil and nutrient losses and pesticide pollution in agroforestry practices: A review of evidence and processes. Plant and Soil, 453(1–2), 45–86. Link to source: https://doi.org/10.1007/s11104-019-04377-3

Credits

Lead Fellow

  • Eric Toensmeier

Contributors

  • Ruthie Burrows, Ph.D.

  • Yusuf Jameel, Ph.D.

  • Daniel Jasper

Internal Reviewers

  • Aiyana Bodi

  • Hannah Henkin

  • Ted Otte

  • Paul C. West, Ph.D.

Effectiveness

We found a median carbon sequestration rate of 9.81 t CO₂‑eq /ha/yr (Table 1). This is based on an above-ground biomass (tree trunks and branches) accumulation rate of 6.43 t CO₂‑eq /ha/yr and a below-ground biomass (roots) accumulation rate of 1.61 t CO₂‑eq /ha/yr using a root-to-shoot ratio of 0.25 (Cardinael et al., 2019). These are added to the soil organic carbon sequestration rate of 1.76 t CO₂‑eq /ha/yr to create the combined total.

Table 1. Effectiveness at carbon sequestration.

Unit: t CO₂-eq/ha/yr, 100-yr basis

25th percentile 4.91
Mean 14.70
Median (50th percentile) 9.81
75th percentile 20.45

100-yr basis

Left Text Column Width

Reductions in nitrous oxide and methane and sustainable intensification impacts are not yet quantifiable to the degree that they can be used in climate mitigation projections.

Cost

Because baseline grazing systems are already extensive and well established, we assumed there is no cost to establish new baseline grazing land. In the absence of global data sets on costs and revenues of grazing systems, we used a global average profit per hectare of grazing land of US$6.28 from Damania et al. (2023).

Establishment costs of silvopasture vary widely. We found the cost to establish one hectare of silvopasture to be US$1.06–4,825 (Dupraz & Liagre, 2011; Lee et al., 2011). Reasons for this wide range include the low cost of natural regeneration and the broad range in tree density depending on the type of system. We collected costs by region and used a weighted average to obtain a global net net cost value of US$424.20.

Cost and revenue data for silvopasture were insufficient. However, data on the impact on revenues per hectare are abundant. Our analysis found a median 8.7% increase in per-hectare profits from silvopasture compared with conventional grazing, which we applied to the average grazing value to obtain a net profit of US$6.82/ha. This does not reflect the very high revenues of silvopasture systems in some countries.

We calculated cost per t CO₂‑eq sequestered by dividing net net cost/ha by total CO₂‑eq sequestered/ha.

Table 2. Cost per unit of climate impact.

Unit: 2023 US$/t CO₂-eq

Median $43.25

100-yr basis & 20-yr basis are the same.

Left Text Column Width

Methods and Supporting Data

Learning Curve

There is not enough information available to determine a learning curve for silvopasture. However, anecdotal evidence showed establishment costs decreasing as techniques for broadscale mechanized establishment were developed in Australia and Colombia (Murguietio et al., 2016; Shelton et al., 2021).

Speed of Action

Speed of action refers to how quickly a climate solution physically affects the atmosphere after it is deployed. This is different from speed of deployment, which is the pace at which solutions are adopted.

At Project Drawdown, we define the speed of action for each climate solution as emergency brake, gradual, or delayed.

Deploy Silvopasture is a DELAYED climate solution. It works more slowly than gradual or emergency brake solutions. Delayed solutions can be robust climate solutions, but it’s important to recognize that they may not realize their full potential for some time.

Caveats

Permanence

Living biomass and soil organic matter only temporarily hold carbon (decades to centuries for soil organic matter, and for the life of the tree or any long-lived products made from its wood in the case of woody biomass). Sequestered carbon in both soils and biomass is vulnerable to fire, drought, long-term shifts to a drier precipitation regime, and other climate change impacts, as well as to a return to the previous farming or grazing practices. Such disturbances can cause carbon to be re-emitted to the atmosphere (Lorenz & Lal, 2018). 

Saturation

Like all upland, terrestrial agricultural systems, over the course of decades, silvopastures reach saturation and net sequestration slows to nearly nothing (Lorenz & Lal, 2018). 

Current Adoption

Lack of data on the current adoption of silvopasture is a major gap in our understanding of the potential of this solution. One satellite imaging study found 156 million ha of grazing land with more than 10 t C/ha in above-ground biomass, which is the amount that indicates more than grass alone (Chapman et al., 2019). However, this area includes natural savannas, which are not necessarily silvopastures, and undercounts the existing 15.1 million ha of silvopasture known to be present in Europe (den Herder et al., 2017).

Sprenkle-Hippolite et al. (2024) estimated a current adoption of 141.4 Mha, or 6.0% of grazing land (Table 3). We have chosen this more recent figure as the best available estimate of current adoption. Note that in Solution Basics in the dashboard above we set current adoption at zero. This is a conservative assumption to avoid counting carbon sequestration from land that has already ceased to sequester net carbon due to saturation, which takes place after 20–50 years (Lal et al., 2018).

Table 3. Current (2023) adoption level.

Unit: million ha

Mean 141.4
Left Text Column Width
Adoption Trend

There is little quantifiable information reported about silvopasture adoption trends.

Adoption Ceiling

Grazing is the world’s largest land use at 2,986 Mha (Mehrabi et al., 2024). Much grazing land is too dry for trees, while other grasslands that were not historically forest or savanna should not be planted with trees in order to minimize water use and protect grassland habitat (Dudley et al., 2020). Three studies estimated the total potential area suitable for silvopasture (including current adoption). 

Lal et al. (2018) estimated the technical potential for silvopasture adoption at 550 Mha.

Chapman et al. (2019) estimated the suitable area for increased woody biomass on grazing land as 1,890 Mha. 

Sprenkle-Hippolite (2024) assessed the maximum area of grazing land to which trees could be added without reducing livestock productivity. They calculated a total of 1,589 Mha, or 67% of global grazing land (Table 4). To our knowledge, this is the most accurate estimate available. 

Table 4. Adoption ceiling.

Unit: ha converted

25th percentile 1069000000
Mean 1343000000
Median (50th percentile) 1588000000
75th percentile 1739000000

Unit: % of grazing land

25th percentile 45
Mean 36
Median (50th percentile) 53
75th percentile 58
Left Text Column Width
Achievable Adoption

In our Achievable – High scenario, global silvopasture starts at 141.4 Mha and grows at the Colombian Nationally Determined Contribution growth rate of 6.5%/yr. This would provide the high end of the achievable potential at 206.3 Mha by 2030, of which 64.9 million ha are newly adopted (Table 5). For the Achievable – Low scenario, we chose 1/10 of Colombia’s projected growth rate. This would provide 147.0 Mha of adoption by 2030, of which 5.6 Mha are new.

Few estimates of the global adoption potential of silvopasture are available, and even those for the broader category of agroforestry are rare due to the lack of solid data on current adoption and growth rates (Shi et al., 2018; Hart et al., 2023). The IPCC estimates that, for agroforestry overall, 19.5% of the technical potential is economically achievable (IPCC AR6 WG3, 2022). Applying this rate to Sprenkle-Hippolite’s estimated 1,588 Mha technical potential yields an achievable potential of 310 Mha of convertible grazing land.

Our high adoption rate reaches 13% of the adoption ceiling by 2030. This suggests that silvopasture represents a large but relatively untapped potential that will require aggressive policy action and other incentives to spur scaling.

Table 5. Range of achievable adoption levels.

Unit: Mha

Current adoption 141.4
Achievable – low 147.0
Achievable – high 206.3
Adoption ceiling 1,588.0

Unit: Mha

Current adoption 0.00
Achievable – low 5.6
Achievable – high 64.9
Adoption ceiling 1,447.4
Left Text Column Width

Carbon sequestration continues only for a period of decades; because silvopasture is an ancient practice with some plantings centuries old, we could not assume that previously adopted hectares continue to sequester carbon indefinitely. Much of the current adoption of silvopasture has been in place for centuries and sequestration there has presumably already slowed down to almost zero. We apply an adoption adjustment factor of 0.25 to current adoption (see Methodology) to reflect that most current adoption is no longer sequestering significant carbon, yet there is substantial new adoption within the past 20–50 years.

For new adoption the calculation is effectiveness * new adoption = climate impact.

For current adoption the calculation is effectiveness * 0.25 * current adoption = climate impact

Climate impacts shown in Table 6 are the sum of current and new adoption impacts. Carbon sequestration impact is 0.35 Gt CO₂‑eq/yr for current adoption, 0.40 Gt CO₂‑eq/yr for Achievable – Low, 0.98 Gt CO₂‑eq/yr for Achievable – High, and 14.54 Gt CO₂‑eq/yr for our Adoption Ceiling. 

Table 6. Climate impact at different levels of adoption.

Unit: Gt CO₂‑eq/yr

Current adoption 0.35
Achievable – low 0.40
Achievable – high 0.98
Adoption ceiling 14.54

100-yr basis, New adoption only 

Left Text Column Width

Lal et al. (2018) estimated a technical global carbon sequestration potential of 0.3–1.0 Gt CO₂‑eq/yr. Sprenkle-Hyppolite et al. (2024) estimated a silvopasture technical potential of 1.4 Gt CO₂‑eq/yr ; this assumes a tree density of 2–6 trees/ha, which is substantially lower than typical silvopasture. For agroforestry overall (including silvopasture and other practices), the IPCC (2022) estimates an achievable potential of 0.8 Gt CO₂‑eq/yr and a technical potential of 4.0 Gt CO₂‑eq/yr.

Additional Benefits

Income and Work 

Silvopasture can also increase and diversify farmer income. Tree fruit and timber often provide income for ranchers. A study in the southern United States showed that silvopasture systems generated 10% more income than standalone cattle production (Husak & Grado, 2002). A more comprehensive analysis across the eastern United States (Greene et al., 2023) found that virtually all silvopasture systems assessed had a positive 20- and 30-yr internal rate of return (IRR). For some systems, the 30-yr IRR can be >15% (Greene et al., 2023).

Food Security

While evidence on the impact of silvopasture on yields is mixed, this practice can improve food security by diversifying food production and income sources (Bostedt et al., 2016; Smith et al., 2022). In pastoralists in Kenya, Bostedt et al. (2016) found that agroforestry practices were associated with increased dietary diversity, an important aspect of food and nutrition security. Diverse income streams can mediate household food security during adverse conditions, such as droughts or floods, especially in low- and middle-income countries (de Sherbinin et al., 2008; Di Prima et al., 2022; Frelat et al., 2016). 

Nature Protection

Trees boost habitat availability, enhance landscape connectivity, and aid in forest regeneration and restoration. In most climates they provide a major boost to biodiversity compared with pasture alone (Smith et al., 2022; Pezo et al., 2018). 

Animal Well-being

By providing shade, silvopasture systems reduce heat stress experienced by livestock. Heat stress for cattle begins at 30 °C or even lower in some circumstances (Garrett et al., 2004). In the tropics, the cooling effect of integrating trees into a pastoral system is 0.32–2.4 °C/t of woody carbon added/ha (Zeppetello et al., 2022). Heifers raised in silvopasture systems had higher body mass and more optimal body temperature than those raised in intensive rotational grazing systems (Lemes et al., 2021). Improvement in livestock physiological conditions probably results from access to additional forage, increased livestock comfort, and reduced heat stress in silvopastoral systems. Silvopasture is highly desirable for its improvements to animal welfare (Goracci & Camilli, 2024).

Land Resources

Silvopasture and agroforestry are important for ensuring soil health (Basche et al., 2020). These practices improve soil health by reducing erosion and may also contribute to soil organic matter retention (U.S. Department of Agriculture Natural Resource Conservation Service ([USDA NRCS], 2025). There is evidence that silvopasture may improve soil biodiversity by preventing soil organism habitat loss and degradation (USDA NRCS, 2025).

Water Quality

Perennials in silvopasture systems could reduce runoff and increase water infiltration rates relative to open rangelands (Smith et al., 2022; Pezo et al., 2018). This increases the resilience of the system during drought and high heat. Silvopasture can improve water quality by retaining soil sediments and filtering pollutants found in runoff (USDA NRCS, 2025). On average, silvopasture and agroforestry practices can reduce runoff of sediments and excess nutrients into water 42–47% (Zhu et al., 2020). The filtering benefits of silvopasture can also mitigate pollution of antibiotics from livestock operations from entering waterways (Moreno & Rolo, 2019). 

Risks

Some of the tree and forage species used in silvopastures are invasive in certain contexts. For example, river tamarind (Leucaena leucocephala) is a centerpiece in intensive silvopasture in Latin America, where it is native, but also in Australia, where it is not. Australian producers have developed practices to limit or prevent its spread (Shelton et al., 2021).

Livestock can damage or kill young trees during establishment. Protecting trees or excluding grazing animals during this period increases costs (Smith et al., 2022).

Poorly designed tree layout can make herding, haying, fencing, and other management activities more difficult. Tree densities that are too high can reduce livestock productivity (Cadavid et al., 2020).

Interactions with Other Solutions

Reinforcing

Silvopasture represents a way to produce some ruminant meat and dairy in a more climate-friendly way. This impact can contribute to addressing emissions from ruminant production, but only as part of a program that strongly emphasizes diet change and food waste reduction.

Forms of silvopasture that increase milk and meat yields can reduce pressure to convert undeveloped land to agriculture.

Silvopasture is a technique for restoring farmland.

Silvopasture is a form of savanna restoration.

Competing

Expanding silvopasture could restrict land availability for renewable energy or raw material and food production, since many technologies and practices could be sited on grazing lands. Silvopasture and forest restoration can also compete for the same land.

Silvopasture is a kind of agroforestry, though in this iteration of Project Drawdown “Deploy Agroforestry” refers to crop production systems only. With that said, some agroforestry systems integrate both crops and livestock with the trees, such as the widespread parkland systems of the African Sahel.

Dashboard

Solution Basics

ha converted from grazing land to silvopasture

t CO₂-eq (100-yr)/unit/yr
04.919.81median
units
Current 1.414×10⁸ 01.47×10⁸2.063×10⁸
Achievable (Low to High)

Climate Impact

Gt CO₂-eq (100-yr)/yr
Current 0.35 0.40.98
US$ per t CO₂-eq
43
Delayed

CO₂

Trade-offs

Solutions that improve ruminant production could undermine the argument for reducing ruminant protein consumption in wealthy countries. 

Certain silvopasture systems reduce per-hectare productivity of meat and milk, even if overall productivity increases when the yields of timber or food from the tree component are included. For example, silvopasture systems that are primarily focused on timber production, with high tree densities, will have lower livestock yields than pasture alone - though they will have high timber yields.

The costs of establishment are much higher than those of managed grazing. There is also a longer payback period (Smith et al., 2022). These limitations mean that secure land tenure is even more important than usual, to make adoption worthwhile (Poudel et al., 2024).

Maps Introduction

Silvopasture is primarily appropriate for grazing land that receives sufficient rainfall to support tree growth. While it can be implemented on both cropland and grassland, if adopted on cropland, it will reduce food yield because livestock produce much less food per hectare than crops. In the humid tropics, a particularly productive and high-carbon variation called intensive silvopasture is an option. Ideally, graziers will have secure land tenure, though pastoralist commons have been used successfully.

Areas too dry to establish trees (<450 mm annual precipitation) are not suitable for silvopasture by tree planting, but regions that can support natural savanna may be suitable for managed natural regeneration.

Most silvopasture today appears in sub-Saharan Africa (Chapman et al., 2019), though this may reflect grazed natural savannas rather than intentional silvopasture. This finding neglects well-known systems in Latin America and Southern Europe. 

Chapman et al. (2019) listed world grasslands by their potential to add woody biomass. According to their analysis, the countries with the greatest potential to increase woody biomass carbon in grazing land are, in order: Australia, Kazakhstan, China, the United States, Mongolia, Iran, Argentina, South Africa, Sudan, Afghanistan, Russia, and Mexico. Tropical grazing land accounts for 73% of the potential in one study. Brazil, China, and Australia have the highest areas, collectively accounting for 37% of the potential area (Sprenkle-Hippolite 2024).

We do not present any maps for the silvopasture solution due to the uncertainties in identifying current areas where silvopasture is practiced, and in identifying current grasslands that were historically forest or savanna. 

Action Word
Deploy
Solution Title
Silvopasture
Classification
Highly Recommended

Lawmakers and Policymakers

  • Lower the risk for farmers transitioning from other pastoral systems.
  • Increase understanding of silvopasture.
  • Reduce technical and bureaucratic complexity.
  • Establish or expand technical assistance programs.
  • Simplify incentive programs.
  • Ensure an appropriate and adequate selection of tree species are eligible for incentives.
  • Establish a silvopasture certification program.
  • Create demonstration farms.
  • Strengthen land tenure laws.
  • Incentivize lease structures to facilitate silvopasture transitions on rented land.

Practitioners

  • Seek support from technical assistance programs and extension services.
  • Seek out networks of adopters to share information, resources, best practices, and collective marketing.
  • If available, leverage incentive programs such as subsidies, tax rebates, grants, and carbon credits.
  • Negotiate new lease agreements to accommodate silvopasture techniques or advocate for public incentives to reform lease structures.

Business Leaders

  • Prioritize suppliers and source from farmers who use silvopasture.
  • Provide innovative financial mechanisms to encourage adoption.
  • Participate in and help create high-quality carbon credit programs.
  • Incentivize silvopasture transitions in lease agreements.
  • Support the creation of a certification system to increase the marketability of silvopasture products.
  • Join coalitions with other purchasers to grow demand.
  • Collaborate with public and private agricultural organizations on education and training programs. 

Nonprofit Leaders

  • Educate farmers and those who work in the food industry about the benefits of silvopasture.
  • Communicate any government incentives for farmers to transition to silvopasture.
  • Explain how to take advantage of incentives.
  • Provide training material and/or work with extension services to support farmers transitioning to silvopasture, such as administering certification programs.
  • Advocate to policymakers for improved incentives for farmers, stronger land tenure laws, and flexible lease agreements.

Investors

  • Use capital like low-interest or favorable loans to support farmers and farmer cooperatives exploring silvopasture projects.
  • Invest in credible, high-quality carbon reduction silvopasture projects.
  • Invest in silvopasture products (e.g., fruits, berries, and other tree products)
  • Encourage favorable lease agreements between landowners or offer favorable costs and benefit-sharing structures.
  • Consider banking through community development financial institutions or other institutions that support farmers. 

Philanthropists and International Aid Agencies

  • Provide grants and loans for establishing silvopasture and support farmland restoration projects that include silvopasture.
  • Support capacity-building, market access, education, and training opportunities for smallholder farmers – especially those historically underserved – through activities like farmer cooperatives, demonstration farms, and communal tree nurseries.
  • Consider banking through Community Development Financial Institutions or other institutions that support farmers. 

Thought Leaders

  • Use your platform to build awareness of silvopasture and its benefits, incentive programs, and regulatory standards.
  • Provide technical information to practitioners.
  • Host community dialogues such as Edible Connections to engage the public about silvopasture and other climate-friendly farming practices.

Technologists and Researchers

  • Improve the affordability and equipment needed to plant and manage trees.
  • Refine satellite tools to improve silvopasture detection.
  • Develop ways to monitor changes in soil and biomass.
  • Standardize data collection protocols.
  • Create a framework for transparent reporting and reliable verification.
  • Fill gaps in data, such as quantifying the global adoption potential of silvopasture and regional analysis of revenue and operating costs/hectare. 

Communities, Households, and Individuals

  • Purchase silvopasture products and support farmers who use the practice.
  • Request silvopasture products at local markets.
  • Encourage policymakers to help farmers transition.
  • Encourage livestock farmers to adopt the practice.
  • Host community dialogues such as Edible Connections to engage the public about silvopasture and other climate-friendly farming practices.
Evidence Base

Consensus of effectiveness in sequestering carbon: Mixed to High 

There is a high level of consensus about the carbon biosequestration impacts of silvopasture, including for the higher per-hectare sequestration rates relative to improved grazing systems alone. A handful of reviews, expert estimations, and meta-analyses have been published on the subject. These include:

Cardinael et al. (2018) assembled data by climate and region for use in the national calculations and reporting. 

Chatterjee et al. (2018) found that converting from pasture to silvopasture increases carbon stocks. 

Lal et al. ( 2018) estimated the technical adoption and mitigation potential of silvopasture and other practices.

Udawatta et al. (2022) provided an up-to-date meta-analysis for temperate North America. 

The results presented in this document summarize findings from two reviews, two meta-analyses, one expert opinion and three original studies reflecting current evidence from a global scale. We recognize this limited geographic scope creates bias, and hope this work inspires research and data sharing on this topic in underrepresented regions.

Consensus regarding other climate impacts: Low

There is low consensus on the reduction of methane from enteric emissions, nitrous oxide from manure, and CO₂ from avoided deforestation due to increased productivity. We do not include these climate impacts in our calculations.

Consensus regarding adoption potential: Low

Until recently there was little understanding of the current adoption of silvopasture. Sprenkle-Hyppolite et al. (2024) used Delphi expert estimation to determine current adoption and technical potential. Rates of adoption and achievable potential are still largely unreported or uninvestigated. See the Adoption section for details.

Updated Date
Coming Soon Label
Coming Soon

Deploy Agroforestry

Image
Image
Peatland
Coming Soon
On
Description for Social and Search
The Deploy Agroforestry solution is coming soon.

Methods and Supporting Data

Dashboard
Action Word
Deploy
Solution Title
Agroforestry
Classification
Highly Recommended
Updated Date
Coming Soon Label
Coming Soon
Subscribe to Highly Recommended