Adverse effects of extreme temperatures on humans, wildlife, ecosystems, and infrastructure.

Icon

Deploy Agrivoltaics

Sector
Electricity
Image
Image
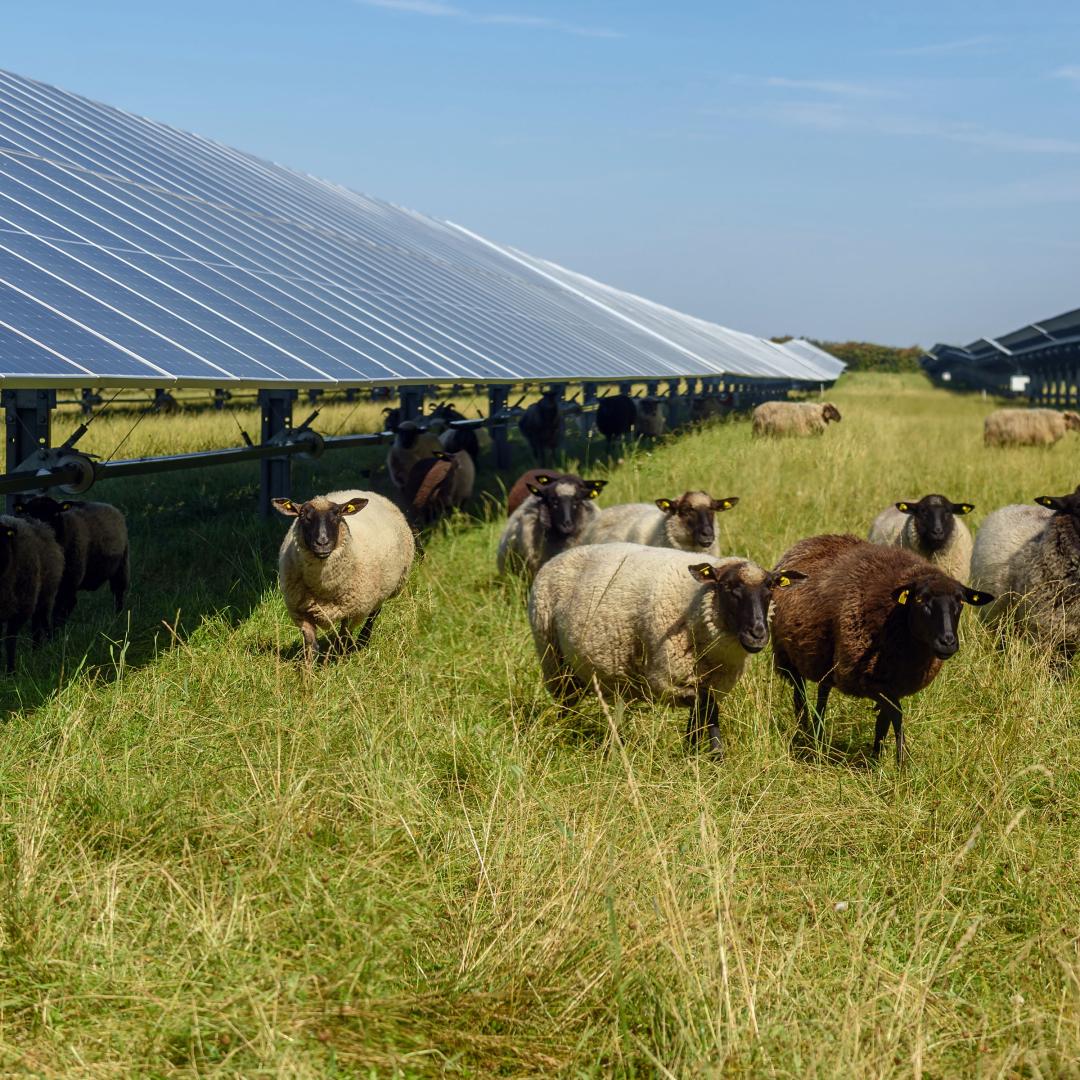
Sheep in a pasture with solar panels
Coming Soon
On

Key Takeaways

  • Deploying agrivoltaics on just 1% of global agricultural land could offset 21 PWh/yr of electricity demand, equivalent to total global electricity consumption in 2019.
  • Agrivoltaics systems generate clean, renewable electricity without displacing agricultural activities, potentially increasing overall land use efficiency up to 200%.
  • By shading crops and livestock, solar panels installed as part of an agrivoltaics system moderate soil temperatures and reduce evapotranspiration, improving agricultural water-use efficiency by 150–300% compared with conventional farming.
  • Agrivoltaics can diversify income sources for farmers and expand rural employment opportunities.
  • Agrivoltaic systems have the greatest adoption potential in arid, dry, and land-constrained regions – particularly Africa, the Asia-Pacific, and South and Central America – where solar resources are abundant and the crop-protection benefits of shading are most pronounced.
Summary

Agrivoltaics is the dual use of land for simultaneous solar photovoltaic (PV) power generation and agricultural production. It reduces GHG emissions by shifting electricity production from fossil fuels to renewables. Agrivoltaic systems can be categorized by system type, PV configuration, module tilt, and agricultural activity. These systems operate at both utility and distributed scales. We consider all combinations of system type, PV structure, module tilt, and agricultural activity in this solution.

Description for Social and Search
​​Agrivoltaics makes it possible to grow food and generate clean solar power on the same land. It can improve land-use efficiency, stabilize crop yields in suitable climates, and add new revenue for farmers.
Overview

Electricity generation accounts for an estimated 23% of GHG emissions on a 100-year basis (Clarke et al., 2022), with fossil fuel–based sources supplying more than 60% of electricity generated in 2023 (International Energy Agency [IEA], 2024b). Since solar PV is a clean and renewable resource, agrivoltaics produces electricity without contributing to GHG emissions or air pollution during operation. Unlike conventional utility-scale solar PV, which often competes with agriculture for space, agrivoltaics combines solar PV electricity generation and agricultural production without requiring additional land use change or sacrificing arable land (Trommsdorff et al., 2025).

The primary climate benefit is the reduction of CO₂ emissions and smaller amounts of methane and nitrous oxide from displacing fossil fuel–based electricity from the grid. This solution quantifies only emissions avoided through electricity generation and does not include emissions from agricultural activities beneath or between the solar panels.

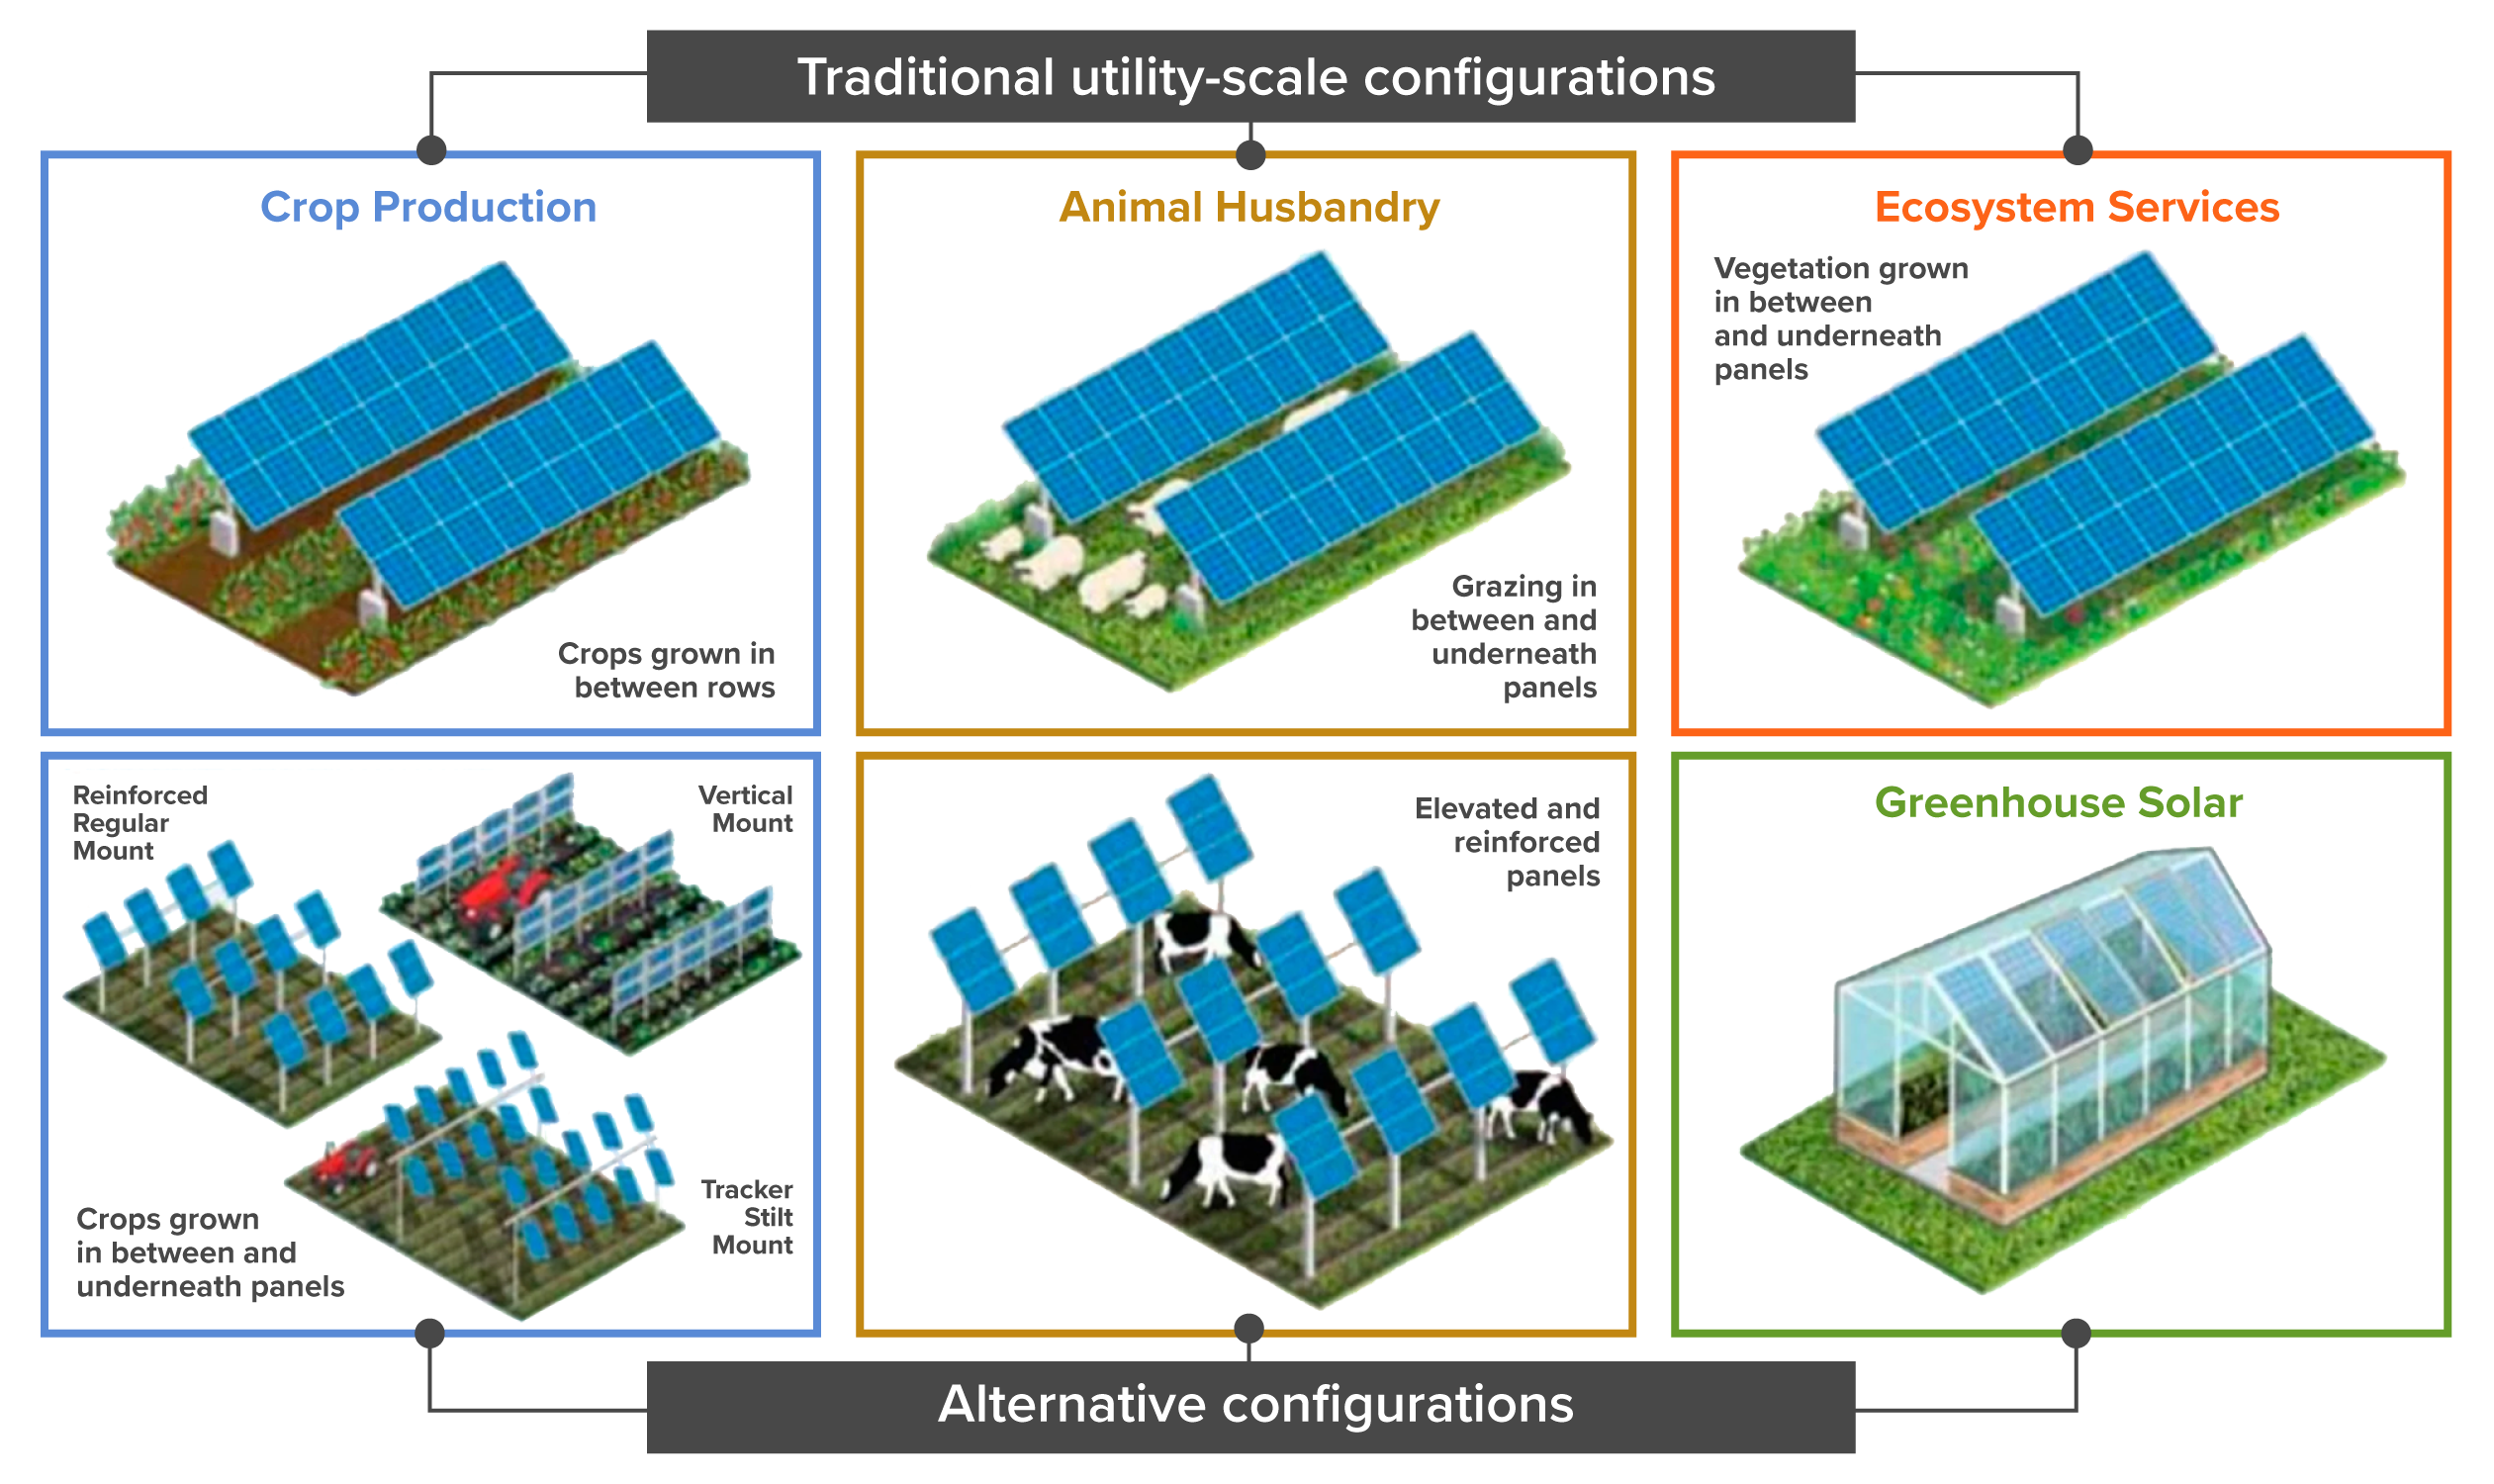
Agrivoltaic systems come in several configurations to coexist with different agricultural activities, including crop production, animal husbandry or grazing, ecosystem services, aquaculture, and pollinator habitat (Macknick et al., 2022). As shown in Figure 1, these systems range from standard ground-mounted arrangements – with crops growing between rows or livestock grazing underneath – to more specialized alternative designs such as elevated panels, vertical bifacial mounts, stilt-mounted trackers, and solar-integrated greenhouses. Overhead configurations elevate panels 2–6 meters above ground to allow standard farm operations while providing shade and weather protection for crops or livestock. Interspace (or interrow) configurations leave wide alleys between ground-mounted PV arrays for vegetation. Rooftop and structure-mounted configurations place panels on greenhouses, barns, or other farm infrastructure, using rigid or flexible panels (Campana et al., 2025; Macknick et al., 2022; Solar Power Europe, 2024a; Trommsdorff et al., 2021).

Each configuration involves different trade-offs between energy output, crop performance, land compatibility, and cost (Campana et al., 2025; Horowitz et al., 2020; Trommsdorff et al., 2025). Well-designed systems often achieve higher overall productivity with a land equivalent ratio exceeding 1 (Trommsdorff et al., 2025). Successful implementation typically requires partnerships among farmers, agricultural cooperatives, solar developers, and utilities, supported by government policies such as subsidies, tax credits, or zoning support (Trommsdorff et al., 2025). 

Figure 1. Agrivoltaic configurations range from standard ground-mounted arrangements (top row) to more specialized alternative designs (bottom row), including elevated overhead systems, vertical mounts, stilt-mounted trackers, and solar-integrated greenhouses. These systems can support agricultural activities – including crop production, grazing, ecosystem services, and habitats – on the same land. 

Image
Diagram demonstrating Agrivoltaic configurations

Source: Macknick, J., et al. (2022). The 5 Cs of agrivoltaic success factors in the United States: Lessons from the InSPIRE research study (No. NREL/TP-6A20-83566). National Renewable Energy Laboratory (NREL), Golden, Colo. (United States). Copyrighted.

Solution in Action

References

Abel, D., Holloway, T., Harkey, M., Rrushaj, A., Brinkman, G., Duran, P., Janssen, M., & Denholm, P. (2018). Potential air quality benefits from increased solar photovoltaic electricity generation in the Eastern United States. Atmospheric Environment, 175, 65–74. Link to source: https://doi.org/10.1016/j.atmosenv.2017.11.049

Adeh, E. H., Good, S. P., Calaf, M., & Higgins, C. W. (2019). Solar PV power potential is greatest over croplands. Scientific Reports, 9, Article 11442. Link to source: https://doi.org/10.1038/s41598-019-47803-3

Agostini, A., Colauzzi, M., & Amaducci, S. (2021). Innovative agrivoltaic systems to produce sustainable energy: An economic and environmental assessment. Applied Energy, 281, 116102. Link to source: https://doi.org/10.1016/j.apenergy.2020.116102

Agrivoltaics Map (National Laboratory of the Rockies). (n.d.). [Dataset]. InSPIRE. Retrieved April 13, 2026, from Link to source: https://openei.org/wiki/InSPIRE/Agrivoltaics_Map

Ahmad, M., Zeeshan, M., & Khan, J. A. (2023). Life cycle multi-objective (geospatial, techno-economic, and environmental) feasibility and potential assessment of utility scale photovoltaic power plants. Energy Conversion and Management, 291. https://doi.org/10.1016/j.enconman.2023.117260

Amaducci, S., Yin, X., & Colauzzi, M. (2018). Agrivoltaic systems to optimise land use for electric energy production. Applied Energy, 220, 545–561. Link to source: https://doi.org/10.1016/j.apenergy.2018.03.081

Andrew, A. C., Higgins, C. W., Smallman, M. A., Graham, M., & Ates, S. (2021). Herbage yield, lamb growth and foraging behavior in agrivoltaic production system. Frontiers in Sustainable Food Systems, Volume 5-2021. Link to source: https://www.frontiersin.org/journals/sustainable-food-systems/articles/10.3389/fsufs.2021.659175

Asa’a, S., Reher, T., Rongé, J., Diels, J., Poortmans, J., Radhakrishnan, H. S., van der Heide, A., Van de Poel, B., & Daenen, M. (2024). A multidisciplinary view on agrivoltaics: Future of energy and agriculture. Renewable and Sustainable Energy Reviews, 200, 114515. Link to source: https://doi.org/10.1016/j.rser.2024.114515

Badza, K., Soro, Y. M., & Sawadogo, M. (2023). Life cycle assessment of a 33.7 MW solar photovoltaic power plant in the context of a developing country. Sustainable Environment Research, 33(1), 1–15. https://doi.org/10.1186/S42834-023-00201-X

Baik, E., Chawla, K. P., Jenkins, J. D., Kolster, C., Patankar, N. S., Olson, A., Benson, S. M., & Long, J. C. S. (2021). What is different about different net-zero carbon electricity systems? Energy and Climate Change, 2, Article 100046. Link to source: https://doi.org/10.1016/j.egycc.2021.100046 

Barron-Gafford, G. A., Pavao-Zuckerman, M. A., Minor, R. L., Sutter, L. F., Barnett-Moreno, I., Blackett, D. T., Thompson, M., Dimond, K., Gerlak, A. K., Nabhan, G. P., & Macknick, J. E. (2019). Agrivoltaics provide mutual benefits across the food–energy–water nexus in drylands. Nature Sustainability, 2(9), 848–855. Link to source: https://doi.org/10.1038/s41893-019-0364-5

Beck, M., Bopp, G., Goetzberger, A., Obergfell, T., Reise, C., & Schindele, S. (2012). Combining PV and food crops to agrophotovoltaic – optimization of orientation and harvest [PDF]. 27th European Photovoltaic Solar Energy Conference and Exhibition; 4096-4100, 5 pages, 6000 kb. Link to source: https://doi.org/10.4229/27THEUPVSEC2012-5AV.2.25

Bhatta, G., Lohani, S. P., Kc, M., Bhandari, R., Palit, D., & Anderson, T. (2025). Harnessing solar PV potential for decarbonization in Nepal: A GIS based assessment of ground-mounted, rooftop, and agrivoltaic solar systems for Nepal. Energy for Sustainable Development, 85, 101618. Link to source: https://doi.org/10.1016/j.esd.2024.101618

Biswas, A., Qiu, M., Braun, D., Dominici, F., & Mork, D. (2025). Quantifying effects of solar power adoption on CO2 emissions reduction. Science Advances, 11, Article eadq5660. https://doi.org/10.1126/sciadv.adq5660

Brown, T. & Reichenberg, L. (2021). Decreasing market value of variable renewables can be avoided by policy action. Energy Economics, 100, Article 105354. Link to source: https://doi.org/10.1016/j.eneco.2021.105354 

Buonocore, J. J., Hughes, E. J., Michanowicz, D. R., Heo, J., Allen, J. G., & Williams, A. (2019). Climate and health benefits of increasing renewable energy deployment in the United States*. Environmental Research Letters, 14(11), 114010. Link to source: https://doi.org/10.1088/1748-9326/ab49bc

Busch, C., & Wydra, K. (2023). Life cycle assessment of an agrivoltaic system with conventional potato production. Journal of Renewable and Sustainable Energy, 15(4), 043501. Link to source: https://doi.org/10.1063/5.0156779

Campana, P. E., Macknick, J., Croci, M., Elkadeem, M. R., Gorjian, S., Pascaris, A., Cuppari, R. I., Amaducci, S., Liu, W., Trommsdorff, M., Sturchio, M. A., Muller, O., Agostini, A., Chatzipanagi, A., Scognamiglio, A., & Zhang, J. (2025). Scientific frontiers of agrivoltaic cropping systems. Nature Reviews Clean Technology, 1(11), 801–821. Link to source: https://doi.org/10.1038/s44359-025-00110-9

Carvalho Fonsêca, V. D. F., De Andrade Culhari, E., Moura, G. A. B., Nascimento, S. T., Milan, H. M., Neto, M. C., & Maia, A. S. C. (2023). Shade of solar panels relieves heat load of sheep. Applied Animal Behaviour Science, 265, 105998. Link to source: https://doi.org/10.1016/j.applanim.2023.105998

Chirinda, N., Leonard, S. A., Bierbaum, R., & Whaley, C. (2024). Agrivoltaics. STAP. Link to source: http://www.stapgef.org/resources/advisory-documents/agrivoltaics

Christ, M., & Wagner, M. (2025). Integrating solar energy into German vineyards: A geospatial framework for identifying agrivoltaic potential. Agronomy, 15(9), 2174. Link to source: https://doi.org/10.3390/agronomy15092174

Clarke, L., Wei, Y.-M., De La Vega Navarro, A., Garg, A., Hahmann, A. N., Khennas, S., Azevedo, I. M. L., Löschel, A., Singh, A. K., Steg, L., Strbac, G., & Wada, K. (2022). Energy systems. In P. R. Shukla, J. Skea, R. Slade, A. Al Khourdajie, R. van Diemen, D. McCollum, M. Pathak, S. Some, P. Vyas, R. Fradera, M. Belkacemi, A. Hasija, G. Lisboa, S. Luz, & J. Malley (Eds.), Climate change 2022: Mitigation of climate change. Contribution of Working Group III to the Sixth Assessment Report of the Intergovernmental Panel on Climate Change (pp. 613–746). Cambridge University Press. Link to source: https://doi.org/10.1017/9781009157926.008

Cuppari, R. I., Branscomb, A., Graham, M., Negash, F., Smith, A. K., Proctor, K., Rupp, D., Tilahun Ayalew, A., Getaneh Tilaye, G., Higgins, C. W., & Najm, M. A. (2024). Agrivoltaics: Synergies and trade-offs in achieving the sustainable development goals at the global and local scale. Applied Energy, 362, 122970. Link to source: https://doi.org/10.1016/j.apenergy.2024.122970

Daniels, T. L. (2023). The development of utility-scale solar projects on US agricultural land: Opportunities and obstacles. Socio-Ecological Practice Research, 5(2), 205–213. Link to source: https://doi.org/10.1007/s42532-023-00139-9

de Falco, M., Sarrica, M., Scognamiglio, A., & Fasanelli, R. (2025). What does agrivoltaics mean? A study on social representations shared by experts and the press in Italy. Energy Research & Social Science, 119, 103918. Link to source: https://doi.org/10.1016/j.erss.2024.103918

Dinesh, H., & Pearce, J. M. (2016). The potential of agrivoltaic systems. Renewable and Sustainable Energy Reviews, 54, 299–308. Link to source: https://doi.org/10.1016/j.rser.2015.10.02

DNV. (2024). Energy transition outlook 2024. Link to source: https://brandcentral.dnv.com/original/gallery/10651/files/original/5c2470ac-597c-43f9-87dd-4e6b238d7845.pdf

Dupraz, C., Marrou, H., Talbot, G., Dufour, L., Nogier, A., & Ferard, Y. (2011). Combining solar photovoltaic panels and food crops for optimising land use: Towards new agrivoltaic schemes. Renewable Energy, Renewable Energy: Generation & Application, 36(10), 2725–2732. Link to source: https://doi.org/10.1016/j.renene.2011.03.005

Ember. (n.d.). Global electricity trends. In Global Electricity Review 2024. Link to source: https://ember-energy.org/latest-insights/global-electricity-review-2024/global-electricity-trends/

Ember. (2024, August 29). Empowering farmers in Central Europe: The case for agri-PV. Link to source: https://ember-energy.org/latest-insights/empowering-farmers-in-central-europe-the-case-for-agri-pv

Fan, T., Trommsdorff, M., Gölz, S., & He, J. (2022, June 17). Agrivoltaics in China: A Study of the Current State of Agrivoltaics Development, Governmental Support Schemes, and Stakeholder Groups’ Perspectives and Acceptance based on Expert Interviews. 3rd Agrivoltaics Conference & Exhibition 2022. Agrivoltaics Conference 2022. Link to source: https://publica.fraunhofer.de/entities/publication/afa41072-9cc3-4ee1-97c9-f2027d6c7a2b

FAO. (2023). Land statistics and indicators 2000–2021 (Brief No. 71). Link to source: https://openknowledge.fao.org/server/api/core/bitstreams/5c8b2707-1bcf-4c29-90e2-3487e583f71e/content#:~:text=Page%203,over%20the%20past%20two%20decades.

Firoozi, A. A., Firoozi, A. A., & Maghami, M. R. (2025). Harnessing photovoltaic innovation: Advancements, challenges, and strategic pathways for sustainable global development. Energy Conversion and Management: X, 27, 101058. Link to source: https://doi.org/10.1016/J.ECMX.2025.101058 

Ferreira Junior, R. A., Torres, I. C., De Souza, L. F. L., Dos Santos, M. A., Cavalcante, M. A. A., Tiba, C., & De Souza, J. L. (2025). Agrophotovoltaic systems in sugarcane crop − A Brazilian case study. Energy Conversion and Management, 344, 120307. Link to source: https://doi.org/10.1016/j.enconman.2025.120307

Fraunhofer Institute of Solar Energy ISE. (2024, July). Study: Levelized cost of electricity - Renewable energy technologies [PDF]. Link to source: https://www.ise.fraunhofer.de/en/publications/studies/cost-of-electricity.html

Gadhiya, G. A., & Chakraborty, S. (2025). Agrivoltaics in the Andaman and Nicobar Islands: Assessing the geo-spatial potential for sustainable development. Energy for Sustainable Development, 88, 101807. Link to source: https://doi.org/10.1016/j.esd.2025.101807

Gagnon, P., & O’Shaughnessy, E. (2024). Consequential analysis of the greenhouse gas emissions impacts of actions that influence the electric grid: The theory and practice of using marginal emissions rates (Report No. TP-6A40-91580). National Renewable Energy Laboratory. Link to source: https://doi.org/10.2172/24816

Gallagher, C. L., & Holloway, T. (2020). Integrating air quality and public health benefits in U.S. decarbonization strategies. Frontiers in Public Health, Volume 8-2020. Link to source: https://www.frontiersin.org/journals/public-health/articles/10.3389/fpubh.2020.563358

Horowitz, K., Ramasamy, V., Macknick, J., & Margolis, R. (2020). Capital costs for dual-use photovoltaic installations: 2020 benchmark for ground-mounted PV systems with pollinator-friendly vegetation, grazing, and crops (Report No. TP-6A20-77811). National Renewable Energy Laboratory. Link to source: https://doi.org/10.2172/1756713

Hwang, K.-W., & Lee, C.-Y. (2024). Estimating the deterministic and stochastic levelized cost of the energy of fence-type agrivoltaics. Energies, 17(8), 1932. Link to source: https://doi.org/10.3390/en17081932

International Energy Agency. (2024a). World Energy Outlook 2024. Link to source: https://www.iea.org/reports/world-energy-outlook-2024

International Energy Agency. (2024b). World energy balances—Data product. Link to source: https://www.iea.org/data-and-statistics/data-product/world-energy-balance

International Renewable Energy Agency. (2025). Renewable power generation costs in 2024. Link to source: https://www.irena.org/-/media/Files/IRENA/Agency/Publication/2025/Jul/IRENA_TEC_RPGC_in_2024_2025.pdf 

International Renewable Energy Agency. (2026). Renewable power generation costs in 2025. Link to source: https://www.irena.org/-/media/Files/IRENA/Agency/Publication/2026/Jul/IRENA_TEC_RPGC_in_2025_2026.pdf

Intergovernmental Panel on Climate Change. (2023). Climate change 2023: Synthesis report. Contribution of Working Groups I, II and III to the Sixth Assessment Report of the Intergovernmental Panel on Climate Change (Core Writing Team, H. Lee, & J. Romero, Eds.). Link to source: https://doi.org/10.59327/IPCC/AR6-9789291691647. 

Jung, D., Gareis, G. H., Staiger, A., & Salmon, A. (2022). Effects of soiling on agrivoltaic systems: Results of a case study in Chile. AIP Conference Proceedings, 2635(1), 020001. Link to source: https://doi.org/10.1063/5.0107943

Keiner, D., Walter, L., Bogdanov, D., Peters, I. M., & Breyer, C. (2025). Assessing the impact of bifacial solar photovoltaics on future power systems based on capacity-density-optimised power plant yield modelling. Solar Energy, 295, 113543. Link to source: https://doi.org/10.1016/j.solener.2025.113543

Laub, M., Pataczek, L., Feuerbacher, A., Zikeli, S., & Högy, P. (2022). Contrasting yield responses at varying levels of shade suggest different suitability of crops for dual land-use systems: A meta-analysis. Agronomy for Sustainable Development, 42(3), 51. Link to source: https://doi.org/10.1007/s13593-022-00783-7

Lytle, W., Meyer, T. K., Tanikella, N. G., Burnham, L., Engel, J., Schelly, C., & Pearce, J. M. (2021). Conceptual design and rationale for a new agrivoltaics concept: Pasture-raised rabbits and solar farming. Journal of Cleaner Production, 282, 124476. Link to source: https://doi.org/10.1016/j.jclepro.2020.124476

Mamun, M. A. A., Dargusch, P., Wadley, D., Zulkarnain, N. A., & Aziz, A. A. (2022). A review of research on agrivoltaic systems. Renewable and Sustainable Energy Reviews, 161, 112351. Link to source: https://doi.org/10.1016/j.rser.2022.112351

Macknick, J., Hartmann, H., Barron-Gafford, G., Beatty, B., Burton, R., Seok-Choi, C., Davis, M., Davis, R., Figueroa, J., Garrett, A., Hain, L., Herbert, S., Janski, J., Kinzer, A., Knapp, A., Lehan, M., Losey, J., Marley, J., MacDonald, J., … Walston, L. (2022). The 5 Cs of agrivoltaic success factors in the United States: Lessons from the InSPIRE research study (Report No. TP-6A20-83566). National Renewable Energy Laboratory. Link to source: https://doi.org/10.2172/1882930

Mahim, T. M., Rahman, M. M., & Huda, A. S. N. (2026). Review of the challenges and prospects in agrivoltaics. Advanced Energy and Sustainability Research, 7(1), e202500227. Link to source: https://doi.org/10.1002/aesr.202500227

Maia, A. S. C., Culhari, E. D. A., Fonsêca, V. D. F. C., Milan, H. F. M., & Gebremedhin, K. G. (2020). Photovoltaic panels as shading resources for livestock. Journal of Cleaner Production, 258, 120551. Link to source: https://doi.org/10.1016/j.jclepro.2020.120551

Malu, P. R., Sharma, U. S., & Pearce, J. M. (2017). Agrivoltaic potential on grape farms in India. Sustainable Energy Technologies and Assessments, 23, 104–110. Link to source: https://doi.org/10.1016/j.seta.2017.08.004

Masson, G., l’Epine, M. de, & Kaizuka, I. (2024). Trends in PV applications 2024. IEA PVPS. Link to source: https://iea-pvps.org/trends_reports/trends-in-pv-applications-2024/

McCall, J., Staie, B., Carron, W., & Jamison, J. (2024). Initial feasibility assessment of agrivoltaics in Jackson County, IL (Report No. TP-6A20-88816). National Renewable Energy Laboratory. Link to source: https://doi.org/10.2172/2335896

Mehedi, T. H., Gemechu, E., & Kumar, A. (2022). Life cycle greenhouse gas emissions and energy footprints of utility-scale solar energy systems. Applied Energy, 314, 118918. Link to source: https://doi.org/10.1016/J.APENERGY.2022.118918

Millstein, D., Wiser, R., Bolinger, M., & Barbose, G. (2017). The climate and air-quality benefits of wind and solar power in the United States. Nature Energy, 2(9), Article 17134. Report #: ARTN 17134. Link to source: http://dx.doi.org/10.1038/nenergy.2017.134

Millstein, D., O’Shaughnessy, E., & Wiser, R. (2024). Climate and air quality benefits of wind and solar generation in the United States from 2019 to 2022. Cell Reports Sustainability, 1(6), 100105. Link to source: https://doi.org/10.1016/j.crsus.2024.100105

Montedonico, M., Pando, D., Santillán, V. A., Guevara, M. Á., Salazar, K. P., Mezzomo, W., Butrón, N., Solís, N., & Díaz, A. (2026). Perspectivas De La Energía Agrivoltaica En América Latina. Link to source: https://ideathinktank.org.mx/wp-content/uploads/2026/03/DocumentoTecnico_PerspectivasDeLaAgrovoltaicaEnAmericaLatina.pdf

 Morash, J. D., & Pavao-Zuckerman, M. (2026). Regional dynamics of agrivoltaics adoption: Stakeholder perceptions and barriers in Maryland, USA. Energy Policy, 210, 115066. Link to source: https://doi.org/10.1016/j.enpol.2025.115066

National Renewable Energy Laboratory. (2021). Life Cycle Greenhouse Gas Emissions from Electricity Generation: Update. Link to source: https://docs.nlr.gov/docs/fy21osti/80580.pdf

National Laboratory of the Rockies. (2024, November 21). Lighting the Way for Agrivoltaics: How NREL Empowers Communities To Capture the Benefits of Solar Energy, Agriculture, and Ecosystems | NLR. Link to source: https://www.nlr.gov/news/feature/2024/lighting-the-way-for-agrivoltaics

Pandey, G., Lyden, S., Franklin, E., Millar, B., & Harrison, M. T. (2025). A systematic review of agrivoltaics: Productivity, profitability, and environmental co-benefits. Sustainable Production and Consumption, 56, 13–36. Link to source: https://doi.org/10.1016/j.spc.2025.03.006

Pascaris, A. S., Schelly, C., Burnham, L., & Pearce, J. M. (2021). Integrating solar energy with agriculture: Industry perspectives on the market, community, and socio-political dimensions of agrivoltaics. Energy Research & Social Science, 75, 102023. Link to source: https://doi.org/10.1016/j.erss.2021.102023

Patel, U., Gadhiya, G., & Chauhan, P. (2023). Case Study on Power Generation from Agrivoltaic System in India. International Journal of Environment and Climate Change, 13, 1447–1454. Link to source: https://doi.org/10.9734/IJECC/2023/v13i92375

Pehl, M., Arvesen, A., Humpenöder, F., Popp, A., Hertwich, E. G., & Luderer, G. (2017). Understanding future emissions from low-carbon power systems by integration of life-cycle assessment and integrated energy modelling. Nature Energy 2017 2:12, 2(12), 939–945. Link to source: https://doi.org/10.1038/s41560-017-0032-9

Pincelli, I. P., Hinkley, J., & Brent, A. (2024). Carbon, materials and energy footprint of a utility-scale solar plant in Aotearoa New Zealand. Solar Energy, 273, 112535. Link to source: https://doi.org/10.1016/J.SOLENER.2024.112535

Scarano, A., Curci, L. M., Semeraro, T., Calisi, A., Lenucci, M. S., Santino, A., Basset, A., & De Caroli, M. (2025). Agrivoltaics as a sustainable strategy to enhance food security under water scarcity. Horticulturae, 11(4), 401. Link to source: https://doi.org/10.3390/horticulturae11040401 

Seay-Fleming, C., Swanson, T., Gerlak, A. K., Pavao-Zuckerman, M. A., Andrews, H., Moore, K., & Barron-Gafford, G. A. (2025). Cultivating engagement: Public participation in agrivoltaics planning and design. Energy Research & Social Science, 127, 104273. Link to source: https://doi.org/10.1016/j.erss.2025.104273

Smith, B. L., Sekar, A., Mirletz, H., Heath, G., & Margolis, R. (2024). An updated life cycle assessment of utility-scale solar photovoltaic systems installed in the United States. Link to source: https://www.nrel.gov/docs/fy24osti/87372.pdf

Smith, M. (2024). Dual-use solar photovoltaics: Emerging applications and issues for congress (No. R48197). Congressional Research Service. Link to source: https://www.congress.gov/crs-product/R48197

Sojib Ahmed, M., Rezwan Khan, M., Haque, A., & Ryyan Khan, M. (2022). Agrivoltaics analysis in a techno-economic framework: Understanding why agrivoltaics on rice will always be profitable. Applied Energy, 323, 119560. Link to source: https://doi.org/10.1016/j.apenergy.2022.119560

Solar Power Europe. (2024a). Agrisolar handbook. Link to source: https://www.solarpowereurope.org/insights/thematic-reports/agrisolar-handbook-1

Solar Power Europe. (2024b). New agrisolar digital map presents over 200 projects across Europe—SolarPower Europe. Link to source: https://www.solarpowereurope.org/press-releases/new-agrisolar-digital-map-presents-over-200-projects-across-europe

Sorensen, A., Nogeire, T., & Hunter, M. (2022). Potential placement of utility-scale solar installations on agricultural lands in the U.S. to 2040. American Farmland Trust. Link to source: https://farmlandinfo.org/wp-content/uploads/sites/2/2023/03/AFT_FUT2040-solar-white-paper.pdf

Suri, D., de Chalendar, J. & Azevedo, I.M.L. (2025). Assessing the real implications for CO2 as generation from renewables increases. Nature Communications, 16, Article 7124. Link to source: https://doi.org/10.1038/s41467-025-59800-4

Swanson, T., Seay-Fleming, C., Gerlak, A. K., & Barron-Gafford, G. A. (2025). “Enough is enough, we like our farms”: The role of landscape ideology in shaping perceptions of solar energy and agrivoltaics in the rural American Southwest. Journal of Rural Studies, 114, 103572. Link to source: https://doi.org/10.1016/j.jrurstud.2025.103572

Trommsdorff, M., Kang, J., Reise, C., Schindele, S., Bopp, G., Ehmann, A., Weselek, A., Högy, P., & Obergfell, T. (2021). Combining food and energy production: Design of an agrivoltaic system applied in arable and vegetable farming in Germany. Renewable and Sustainable Energy Reviews, 140, 110694. Link to source: https://doi.org/10.1016/j.rser.2020.110694

Trommsdorff, M., Campana, P. E., Macknick, J., Fernández Solas, A., Gorjian, S., & Tsanakas, I. (2025). Dual Land Use for Agriculture and Solar Power Production: Overview and Performance of Agrivoltaic Systems. International Energy Agency Photovoltaic Power Systems Programme. Link to source: https://doi.org/10.69766/XAEU5008

United Nations Conference on Trade and Development UNCTAD. (2023, October 4). Italy—Adopts €2.61 billion schemes to support agrivoltaic energy production and agro-industrial development | Investment Policy Monitor | UNCTAD Investment Policy Hub. Link to source: https://investmentpolicy.unctad.org/investment-policy-monitor/measures/4543/italy-adopts-2-61-billion-schemes-to-support-agrivoltaic-energy-production-and-agro-industrial-development

U.S. Department of Energy. (n.d.). Solar photovoltaic system cost benchmarks. Energy.Gov. Retrieved March 11, 2026, from  Link to source: https://www.energy.gov/eere/solar/solar-photovoltaic-system-cost-benchmarks

Walsh, K. B., Stedman, R., & Kay, D. (2026). Imagining agrivoltaics: Farmer expectations for co-locating solar energy and agricultural production in Western New York. Energy Research & Social Science, 137, 104789. Link to source: https://doi.org/10.1016/j.erss.2026.104789

Walston, L. J., Mishra, S. K., Hartmann, H. M., Hlohowskyj, I., McCall, J., & Macknick, J. (2018). Examining the potential for agricultural benefits from pollinator habitat at solar facilities in the United States. Environmental Science & Technology, 52(13), 7566–7576. Link to source: https://doi.org/10.1021/acs.est.8b00020

Williams, H. J., Wang, Y., Yuan, B., Wang, H., & Zhang, K. M. (2025). Rethinking agrivoltaic incentive programs: A science-based approach to encourage practical design solutions. Applied Energy, 377, 124272. Link to source: https://doi.org/10.1016/j.apenergy.2024.124272

Williams, H. J., Wang, Y., & Zhang, K. M. (2024, June). Advantages and disadvantages of vertical solar racking for agrivoltaic systems. World Agrivoltaics Conference. Link to source: https://www.osti.gov/biblio/25305

Yeligeti, M., Hu, W., Scholz, Y., Stegen, R., & von Krbek, K. (2023). Cropland and rooftops: The global undertapped potential for solar photovoltaics. Environmental Research Letters, 18(5), 054027. Link to source: https://doi.org/10.1088/1748-9326/accc47

Zhang, X., & Ma, X. (2026). Vectorized agrivoltaics dataset in China from 2010 to 2022. Scientific Data, 13(1), 116. Link to source: https://doi.org/10.1038/s41597-025-06305-w

Zubi, G., Parag, Y., & Wald, S. (2024). Implications of large-scale PV integration on grid operation, costs, and emissions: Challenges and proposed solutions. Energies 2025, Vol. 18, Page 130, 18(1), 130. Link to source: https://doi.org/10.3390/EN18010130 

Credits

Lead Fellow

  • Al-Amin Bugaje, Ph.D.

Contributors

  • Ruthie Burrows, Ph.D.

  • James Gerber, Ph.D.

  • Daniel Jasper

  • Alex Sweeney

Internal Reviewers

  • Amanda D. Smith, Ph.D.

  • Christina Swanson, Ph.D.

  • Megan Matthews, Ph.D.

Effectiveness

We estimate that agrivoltaics reduces GHG emissions by 720 t CO₂‑eq /MW/yr (730 t CO₂‑eq /MW/yr, 20-year basis) (Table 1). This assumes that newly installed agrivoltaics displace an equivalent MWh of the 2023 global electricity grid mix (estimated at 530 kg CO₂‑eq /MWh (540 kg CO₂‑eq /MWh, 20-year basis; IEA, 2024b; see Methodology: Appendix A for calculation details). We used a median capacity factor of 15% based on country-level estimates (Ember, 2024; Ferreira Junior et al., 2025; McCall et al., 2024; Patel et al., 2023; Williams et al., 2024) to convert annual emissions reductions from per MWh to per MW installed capacity. 

Actual avoided emissions will depend on local grid conditions and the specific power sources displaced (see Methodology: Appendix A). Studies in the U.S. show that from 2007–2015, solar deployment avoided approximately 0.5 t CO₂ /MWh (613 t CO₂ /MW/yr; Millstein et al., 2017) emissions, and a 15% increase in deployment avoided 8.54 Mt CO₂ /yr (Biswas et al., 2025). 

Although solar PV emits negligible GHGs during operations, emissions arise during manufacturing, transportation, installation, maintenance, and decommissioning. However, these embodied emissions are paid back in approximately 1–2 yr (Badza et al., 2023; M. Ahmad et al., 2023; Mehedi et al., 2022; Pincelli et al., 2024; Smith et al., 2024). While total life-cycle emissions remain far below those of fossil fuels (National Renewable Energy Laboratory [NREL], 2021; Smith et al., 2024), decarbonizing industrial supply chains is essential to maximize climate impact (Pehl et al., 2017). In our analysis, we focused solely on emissions avoided during electricity generation. Carbon payback time, embodied life-cycle emissions, and on-farm agricultural emissions from ruminant grazing were excluded from the effectiveness and climate impact estimates. 

Table 1. Effectiveness at reducing emissions. 

Unit: t CO₂‑eq /MW/yr, 100-yr basis

Estimate 720
Left Text Column Width
Cost

We estimated a mean levelized cost of electricity (LCOE) for agrivoltaics of US$69/MWh based on industry reports and journal articles (Bhatta et al., 2025; Fraunhofer ISE, 2024; Gadhiya & Chakraborty, 2025; Hwang & Lee, 2024; Sojib Ahmed et al., 2022; U.S. Department of Energy [U.S. DOE], n.d.; see Methodology: Appendix A for details). LCOE values represent the average cost of producing one MWh of electricity over the operational lifetime of a power plant, allowing investors to compare their expected revenue to a standard set of costs. This cost metric has been used by international agencies for cost comparison across generation technologies, incorporating installed capital costs, operation and maintenance, project lifespan, and energy output. The agrivoltaics LCOE describes costs to utility-scale generators and does not include agricultural output.

The LCOE for agrivoltaics is generally higher than that for utility-scale solar PV (Trommsdorff et al., 2025), due to higher capital expenditure requirements for overhead configurations and specialized partially see-through PV modules. However, agrivoltaics has a lower LCOE than distributed solar PV. For instance, a study conducted by the U.S. DOE (n.d.) showed that the LCOE of distributed solar PV was US$142/MWh (0.006 MWdc system) compared to agrivoltaics’ US$75/MWh (3 MWdc system). In the same study, a 100 MWdc utility-scale solar PV had an LCOE of US$47/MWh. These costs do not consider any subsidies or revenue. 

In practice, revenues and costs will vary based on the ownership model structure. In developer-owned models, farmers receive fixed lease payments of US$250–2,500 per acre, while the solar provider bears the up-front cost (Daniels, 2022; Trommsdorff et al., 2025). In farmer-owned models, the farmers incur the initial investment burden and generate revenue by selling power to the grid or reducing their on-farm energy bills (Pandey et al., 2025).

Methods and Supporting Data

Learning Curve

Agrivoltaics does not have an empirically derived learning rate. The technology has only scaled meaningfully since the early 2010s, and its configurations vary too widely for a clean cost reduction curve to be fitted to the data. However, agrivoltaics is built from several existing technologies with well-understood learning dynamics. 

We estimated the current global learning rate for module costs at about 34% (DNV, 2024; Masson, 2024). This high rate is heavily influenced by the accelerated growth of solar PV from 2012–2022; however, this number comes down over a longer period of time. Projections suggest it will slow to around 17% by 2050 as cost components stabilize and the largest gains from scaling are realized (DNV, 2024). Because agrivoltaic systems draw their modules from the same global supply chain as any other solar PV project, we expect that they inherit this curve directly.

What distinguishes agrivoltaics economically from utility-scale solar PV is the cost premium of its elevated or specialized mounting structures, more complex permitting, dual-use legal frameworks, and crop-specific engineering (Trommsdorff et al., 2025). These components follow slower learning curves than electronics, constrained by manufacturing scale-up and standardization of elevated racking/tracking systems. However, hardware innovations such as vertical bifacial or open-source designs, module reuse from decommissioned plants, and policy incentives (feed-in tariffs, grants, regulatory clarity) have potential to accelerate deployment and cross-sector learning (Pandey et al., 2025). 

Speed of Action

Speed of action refers to how quickly a climate solution physically affects the atmosphere after it is deployed. This is different from speed of deployment, which is the pace at which solutions are adopted.

At Project Drawdown, we define the speed of action for each climate solution as emergency brake, gradual, or delayed.

Deploy Agrivoltaics is a GRADUAL climate solution. It has a steady, linear impact on the atmosphere. As installed capacity of agrivoltaics increases over time, emissions from electricity generation are expected to decrease assuming solar PV displaces fossil fuel sources.

Caveats

Implementing agrivoltaics requires careful site and crop selection to avoid unintended consequences. In temperate climates, excessive shading can reduce yields of shade-intolerant crops such as wheat, corn, and tomatoes (Pandey et al., 2025). Significant yield declines may displace food production to other land, triggering land conversion and emissions that offset climate gains (Agostini et al., 2021; Wagner et al., 2023). The greatest benefits occur when agrivoltaics is deployed on marginal or low-productivity farmland, where dual-use systems can improve efficiency up to 200% without compromising high yield agriculture (Pandey et al., 2025). 

Farming activities also increase panel soiling from dust, pollen, or harvest residue, necessitating frequent maintenance to prevent energy losses, especially in arid or high-wind regions (Campana et al., 2025; Chirinda et al., 2024; Jung et al., 2022).

We acknowledge the partial overlap of agrivoltaics with utility-scale and distributed solar PV estimates; to avoid double-counting capacity, we treat it as a complementary pathway that expands solar adoption while mitigating land-use competition (Sorensen et al., 2022; Smith, 2024). Policy frameworks that differentiate dual-use systems through incentives, performance standards, or land-use regulations will determine the extent of overlap (Pandey et al., 2025). While proximity to the grid is essential, deployment is limited by transmission capacity and interconnection queue delays (Campana et al., 2025). Large utility-scale projects often face multi-year queues to connect to regional grids, with transmission costs sometimes approaching 50–100% of total project costs (Daniels, 2023; Macknick et al., 2022)

Our assessment assumed that each additional MWh from agrivoltaics displaces an equivalent MWh of the existing grid mix. In reality, avoided emissions vary by regional grid dynamics, marginal generation sources, and the timing and location of production. New solar generation can sometimes displace other renewables rather than fossil-based sources, especially in grids with high existing renewable, nuclear, or geothermal capacity (Baik et al., 2021; Suri et al., 2025). Because agrivoltaics is constrained to agriculturally suitable land – which is unevenly distributed globally – the degree to which these dynamics affect emissions reductions will vary by region. 

Current Adoption

As of 2023, the global installed capacity for agrivoltaics reached approximately 140,000 MW (Table 2). China leads global adoption, accounting for roughly 91% of this estimated total. The U.S. represents 8.4%, while Europe accounts for the remainder (Masson et al., 2024; Solar Power Europe, 2024b; Zhang & Ma, 2026). 

Table 2. Current adoption level (2023).

Unit: MW installed capacity

Estimate 140,000
Left Text Column Width

We estimated this global capacity by aggregating data from industry reports, journal papers, and public datasets across these three regions. However, tracking remains challenging because agrivoltaics deployment estimates partially overlap with utility-scale and distributed solar PV totals. Existing databases often count dual-use projects within broader solar capacity figures, particularly when configurations resemble conventional solar PV systems (Daniels, 2023; Smith, 2024; Sorensen et al., 2022; Trommsdorff et al., 2025). The precise degree of overlap cannot yet be quantified, but developers increasingly adopt dual-use designs to minimize land-use conflict (Campana et al., 2025; Masson et al., 2024; Trommsdorff et al., 2025). While agrivoltaics adoption is present in other regions (e.g., Japan, South Korea, and India), consistent and credible datasets to estimate accurate current adoption and growth trends are limited. Consequently, this estimate likely underestimates current global adoption. 

Adoption Trend

We estimated the median global adoption trend for agrivoltaics at 9,800 MW/yr of additional installed capacity (Table 3) by summing regional adoption values for each year from 2010–2023 and taking the year-to-year difference. Because this analysis relied primarily on data from China and the U.S., the results reflect a geographic distribution skewed toward these leading markets. 

Table 3. Adoption trend (2010–2023).

Unit: MW installed capacity/yr

25th percentile 2300
Mean 9400
Median (50th percentile) 9800
75th percentile 15000
Left Text Column Width

Estimated global agrivoltaics capacity grew roughly 200-fold from 580 MW in 2010 to approximately 140,000 MW in 2023 (Figure 2). While agrivoltaics adoption is still in its early stages – with global installed capacity roughly five times lower than distributed solar PV and seven times lower than utility-scale solar PV – growth is expected to accelerate. Supportive policies in pioneer regions such as Europe, China, Japan, and Korea have driven recent expansion. These policies address both the need for clean energy and the rising climate stresses on farmlands, including heat and drought (Trommsdorff et al., 2025). 

Figure 2. Estimated global adoption of agrivoltaics, 2010–2023.

Sources: Zhang & Ma, 2026; Agrivoltaics Map, n.d.

Enable Download
On

Market momentum has also strengthened over the past decade. From 2010–2015, global agrivoltaics added an average of about 4,100 MW/yr. Post 2015, that rate jumped to around 14,000 MW/yr, fueled by targeted incentives. For instance, agrivoltaics capacity in the United States. more than doubled from 2020–2024 (National Laboratory of the Rockies [NLR], 2024). In Italy, the government launched a competitive bidding process in 2023 to award contracts and funding for 500 MW of agrivoltaics projects (Masson et al., 2024); the country aims to reach 1,000 MW of capacity by 2026 (United Nations Conference on Trade and Development [UNCTAD], 2023). We expect that continued cost declines of elevated structures and bifacial modules and improved profitability (Pandey et al., 2025; Keiner et al., 2025) will drive future adoption.

Adoption Ceiling

We estimated the median technical potential for agrivoltaics to arrive at an adoption ceiling of 250 million MW of installed capacity (Table 4). We determined the adoption ceiling for agrivoltaics by considering the global technical potential of solar PV and the availability of cropland or grazing land suited to shading (Yeligeti et al., 2023).

Table 4. Adoption ceiling.

Unit: MW installed capacity

25th percentile 230,000,000
Mean 250,000,000
Median (50th percentile) 250,000,000
75th percentile 270,000,000
Left Text Column Width

Cropland accounts for only one-third of total agricultural land (Food and Agricultural Organization [FAO], 2023) and global estimates for agrivoltaics across cropland vary depending on assumptions about crop suitability, panel density, and grid access. A global suitability assessment of 18 major crops found approximately 4.64 million km² (464 million ha) of cropland suitable for agrivoltaics in an optimistic scenario, corresponding to a maximum installable capacity of around 217 million MW (Yeligeti et al., 2023). This technological ceiling aligns closely with the analysis of Campana et al. (2025), which projects annual electricity output of 385 PWh (≈ 284 million MW/yr). These optimistic figures assume favorable policy environments, technological advancement in panel design, financing, grid proximity and availability, and adoption of shade-tolerant crop varieties.

Despite the abundant 1.6 billion ha of global arable land (Chirinda et al., 2024), the adoption ceiling is unlikely to be reached due to other constraints (Yeligeti et al., 2023). Considerations for technoeconomic, political, and social effects, including land use changes, economic value of land, and shading effect, determine the actual upper limit for adoption. 

Achievable Adoption

In the low achievable scenario, agrivoltaics is projected to grow more than 20-fold, from 140,000 MW in 2023 to 2.5 million MW in 2050 (Table 5). This scenario accounts for real-world constraints, including fragmented land tenure, uneven grid access, regulatory barriers, and high up-front costs.

Table 5. Range of achievable adoption levels.

Unit: MW installed capacity

Current adoption 140,000
Achievable – low 2,500,000
Achievable – high 5,600,000
Adoption ceiling 250,000,000
Left Text Column Width

In the high achievable scenario, agrivoltaics is projected to grow more than 40-fold, from 140,000 MW in 2023 to 5.6 million MW in 2050 (Table 5). This scenario assumes the continuation of supportive government policies, with adoption primarily constrained by transmission availability. 

We estimated the achievable adoption ranges from scenarios reflecting technical limits (Campana et al., 2025; Yeligeti et al., 2023). These scenarios combine crop suitability and geospatial analysis to estimate annual potential electricity supply from agrivoltaics, constrained by electricity infrastructure. We then applied a mean scaling factor of 9.2% from previous work (Beck et al., 2012; Christ & Wagner, 2025; Trommsdorff et al., 2024) to convert these potential estimates to realizable scenarios. This scaling aligns with historical patterns and complementary international assessments.

Our low and high achievable scenarios fall within the observed market trends, reflecting a still nascent industry with significant but unevenly distributed growth potential.

Beyond the technical and financial considerations, achievable adoption is shaped and often superseded by non-quantitative social forces, where cultural norms, agricultural heritage, and local traditions fundamentally shape stakeholder acceptance (Asa’a et al., 2024; Walsh et al., 2026). Rural residents can perceive solar infrastructure as an industrial intrusion that is incompatible with the pastoral identity and landscape ideology of their communities (de Falco et al., 2025; Mahim et al., 2026; Morash & Pavao-Zuckerman, 2026; Swanson et al., 2025;). If agrivoltaics is framed merely as a technological fix without regard for these cultural values, it can lead to a social gap where broad societal approval for renewables fails to translate into local project success (Pascaris et al., 2021; Walsh et al., 2026).

The achievable adoption range of 2.5–5.6 million MW represents approximately 1–2.3% of the adoption ceiling of 250 million MW. The current adoption is roughly 0.06% of that ceiling. 

The current estimated climate impact of agrivoltaics is approximately 0.1 Gt CO₂‑eq/yr of reduced emissions (Table 6), based on 140,000 MW of global installed capacity and effectiveness of 720 t CO₂‑eq /MW/yr.

Table 6. Climate impact at different levels of adoption.

Unit: Gt CO₂‑eq/yr, 100-yr basis

Current adoption 0.1
Achievable – low 1.80
Achievable – high 4.10
Adoption ceiling 180
Left Text Column Width

Under the low achievable adoption scenario (2.5 million MW), annual emissions reductions could grow to about 1.8 Gt CO₂‑eq/yr.  

In the high achievable scenario (5.6 million MW), reductions could reach approximately 4.1 Gt CO₂‑eq/yr.  

We based the adoption ceiling solely on the technical potential of agrivoltaics, while neglecting social and economic constraints and realistic scenarios of future power demand. The electricity sector in 2023 emitted 15.6 Gt CO₂ ‑eq (International Energy Agency [IEA], 2024b); therefore, even if agrivoltaics could meet all current electricity demand, emissions reductions could not surpass this value without increased demand. Consequently, agrivoltaic systems are unlikely to reach 250 million MW of installed capacity in the next 100 years. But if current grid emissions were to remain constant while capacity increases, GHG emission reductions would be approximately 180 Gt CO₂ ‑eq/yr. This maximum is unrealistic as a forward-looking climate impact because it treats grid carbon intensity as permanently fixed at 2023 levels and ignores future decarbonization and corresponding decreases in marginal avoided emissions. Real-world climate impacts will depend on not only grid decarbonization and policy support, but also on system design choices and regional agricultural contexts.

By using only 1% of global agricultural land, agrivoltaics could offset 21 PWh/yr of electricity demand, equivalent to global electricity consumption in 2019 (Adeh et al., 2019). Even as demand grows, reaching ~29 PWh in 2023 (Ember, n.d.), the opportunity remains massive. 

Additional Benefits

Heat Stress

Daytime air temperatures surrounding agrivoltaics are lower than traditional utility PV systems that are usually installed over gravel (Pandey et al., 2025). This cooling effect is mostly attributed to evapotranspiration from the crops underneath PV panels (Barron-Gafford et al., 2019). 

Income and Work

Agrivoltaics can diversify income sources for farmers (Campana et al., 2025) by allowing them to export excess power to the grid to generate revenue (Dinesh & Pearce, 2016; Trommsdorff et al., 2025). PV revenue often outweighs revenue from agriculture (Malu et al., 2017; Lytle et al., 2021). Because agrivoltaics are more expensive to install than traditional PV systems, they are often installed at larger scales on larger farms (Campana et al., 2025). In these cases, the income and revenue benefits may be shared between the farmer and a third-party investor. 

New roles in installation, maintenance, and agrivoltaics management also create rural employment opportunities, particularly in regions where energy poverty and food insecurity overlap (Chirinda et al., 2024).

Food Security

Because agrivoltaics lower daytime temperatures, they can increase yields of crops that are sensitive to high temperatures, such as fruits and seed-bearing vegetables (Scarano et al., 2025). This is especially pertinent to drought-prone areas, where agrivoltaics have been shown to increase crop yields in water-stressed systems. For example, a study of crop yields in semi-arid southwestern United States found that yields of peppers and cherry tomatoes were double in agrivoltaic systems relative to those under traditional agriculture (Barron-Gafford, 2019). In addition to shade, agrivoltaic systems can protect crops from weather events such as hail and wind (Pandey et al., 2025). Agrivoltaic fields can also be used for livestock grazing, such as cattle and sheep, maintaining meat and dairy production on solar land while panel shading relieves animal heat stress and improves forage digestibility (Andrew et al., 2021).

Energy Availability

The efficiency of PV panels starts to decrease as cell temperatures rise above 25 °C (Chirinda et al., 2024). The cooler temperatures surrounding agrivoltaic systems can increase electricity production per panel (Adeh et al., 2019). In many environments, vegetation below the PV panels provides a cooling effect that boosts annual electricity output by 1–3% (Barron-Gafford et al., 2019).

Health

Solar PV reduces the emission of pollutants such as nitrogen oxides, sulfur dioxide, and PM2.5 from fossil-fuel energy generation (Abel et al., 2018; Millstein et al., 2024; Millstein et al., 2017; Wiser et al., 2016). This offers health benefits, including reduced premature mortality. The magnitude and distribution of these benefits depend on the local electricity grid mix, the fuels used to generate electricity, and atmospheric conditions that determine how far pollutants travel (Buonocore et al., 2019). Regions with a higher proportion of coal-powered electricity generation will often see more health benefits (Buonocore et al., 2019). Pollutants can travel long distances after they are emitted, so air pollution benefits can be widespread (Millstein et al., 2024).

These health benefits often translate into cost savings associated with reductions in hospital admissions, improved respiratory and cardiovascular conditions, and work and school days that might have otherwise been missed due to illness (Millstein et al., 2017; Wiser et al., 2016).

Nature Protection

Agrivoltaic systems that integrate pollinator-friendly habitats can increase pollination and may even increase crop yields in surrounding farmland (Macknick 2022; Walston et al., 2018).

Animal Well-being

Shade from the panels can relieve heat stress for livestock when temperatures are high (Maia et al., 2020; Carvalho Fonsêca et al., 2023) 

Land Resources

Agrivoltaics can help avoid land use conflicts because the PV panels are placed on land already used for agriculture (Swanson et a., 2025). 

Water Resources

Agrivoltaics may reduce water use up to 50% compared to traditional agricultural systems (Scarano et al., 2025). Reduced solar radiation from shading can reduce soil evaporation rates and enhance water savings for crops (Amaducci et al., 2018). Additionally, water used to clean panels and suppress dust can be reused for irrigation (Patel et al., 2019 ).

Air Quality

For air quality benefits, please refer to the “health” section. 

Risks

Large-scale rollout of agrivoltaics carries several risks. Rapid deployment without adequate storage, grid flexibility, or transmission can elevate curtailment rates. This undermines financial returns and emissions reductions, creating financial risks from high solar deployment and integration (Firoozi et al., 2025; Zubi et al., 2024). Higher up-front capital requirements also expose farmers and developers to revenue risk if crop yields decrease or electricity prices fluctuate (Campana et al., 2025). These financial risks can be mitigated with policy levers, including carbon taxes, though different levers are needed at different adoption levels (Brown & Reichenberg, 2021). 

Lack of regulatory clarity regarding dual-use land may stall adoption (Campana et al., 2025). This lack of legal status often leads to reclassification of agricultural land to energy or industrial use, creating ambiguity over property-tax rates and potentially triggering farmland occupation taxes (Chirinda et al., 2024). Furthermore, reclassification can result in the loss of agricultural subsidies, such as the European Union’s Common Agricultural Policy (CAP) payments, and jeopardize eligibility for crop insurance programs (Smith, 2024; Trommsdorff et al., 2025). Without a clear regulatory framework to differentiate agrivoltaics from standard ground-mounted solar, conflicting goals between energy and agricultural ministries can cause substantial administrative delays and financial uncertainty (Chirinda et al., 2024). 

Agricultural and environmental risks include soil compaction from construction and machinery traffic, reducing infiltration, root growth, and long-term soil fertility. This effect is amplified where heavy equipment must navigate under elevated panels (Campana et al., 2025; Chirinda et al., 2024). Poorly managed end-of-life PV components also risk chemical pollution (Chirinda et al., 2024). 

Finally, social and distributive justice risks can impede adoption. Visual landscape impacts and inequitable benefit-sharing between energy developers and tenant farmers can spark opposition and erode community support. The potential displacement of tenant farmers is a major socioeconomic risk (Campana et al., 2025; Chirinda et al., 2024). Because solar developers offer lease rates that significantly outbid traditional agricultural rents, landowners are increasingly incentivized to prioritize energy production over farming (Morash & Pavao-Zuckerman, 2026 Sorensen et al., 2022; Swanson et al., 2025). Furthermore, high solar leases can drive up overall land prices, making it difficult for new or disadvantaged farmers to access land (Morash & Pavao-Zuckerman, 2026). Without inclusive participatory processes and clear land use agreements, agrivoltaics expansion risks eroding social cohesion and economic viability of the farming communities it is intended to sustain (Campana et al., 2025; Trommsdorff et al., 2025). Ensuring that projects reflect local values, such as community stewardship over simple ownership, is crucial to mitigating the risk of eroding social cohesion of agricultural communities (Seay-Fleming et al., 2025; Trommsdorff et al., 2025).

Interactions with Other Solutions

Reinforcing

The microclimate effects of agrivoltaics can reduce the volume of water required to achieve equivalent crop yields, amplifying the impact of farm-level irrigation efficiency improvements. Electricity generated by solar PV can power irrigation pumps.

By reducing evapotranspiration and moderating temperate and water stress on crops, agrivoltaic systems can reduce agricultural water demand. In water-stressed and arid regions, this interaction can improve food system resilience.

Increased availability of renewable energy from agrivoltaics helps reduce emissions from the electricity grid as a whole. Reduced emissions from the electricity grid lead to lower downstream emissions for solutions that rely on electricity use. Deploying agrivoltaics also supports increased integration of wind power technologies by diversifying the renewable energy mix and reducing exposure to wind variability.

Electrification of transportation systems will be more beneficial in reducing global emissions if the underlying grid includes a higher proportion of non-emitting power sources. Electric transportation systems can also reduce curtailment of solar energy through controlled-time charging and other load-shifting technologies.

Competing

Since wind and solar can generate electricity at the same times of day, deploying agrivoltaics could create competition for grid connections, lower daytime electricity revenues, and suppress adoption of additional wind power.

Use of agricultural land for dedicated bioenergy crop production represents a competing land use, albeit agrivoltaics may offer higher combined energy and food productivity per hectare.

Widespread agrivoltaic deployment on high irradiance agricultural land could reduce the land base available for utility-scale concentrated solar in regions where both are technically viable, albeit the two solutions target different land type and scales.

Consensus
Dashboard

Solution Basics

MW installed capacity

t CO₂-eq (100-yr)/unit/yr
720
units
Current 140,000 02.5×10⁶5.6×10⁶
Achievable (Low to High)

Climate Impact

Gt CO₂-eq (100-yr)/yr
Current 0.1 1.84.1
Gradual

CO₂ , CH₄, N₂O

Trade-offs

Agrivoltaics may involve an inherent trade-off between agricultural productivity and energy conversion efficiency. Well-sited and properly designed systems typically cause no significant declines in agricultural productivity and can even stabilize or increase biomass production in certain conditions (Pandey et al., 2025). Poorly designed systems, however, can underperform both stand-alone agriculture and stand-alone PV on key sustainability metrics (Campana et al., 2025; Trommsdorff et al., 2025).

Elevated panels require extra steel and aluminum, increasing embodied emissions by roughly 20% compared with utility-scale solar PV (Busch & Wydra, 2023). These embodied emissions are modest, up to 100 times lower than the operational savings from displacing fossil fuel–based electricity (Pandey et al., 2025). 

The net climate benefit is greatest in carbon-intensive grids. It diminishes, however, where grid decarbonization is already rapid or where yield losses on prime farmland shift food production to other land, triggering indirect land use change emissions (Agostini et al., 2021; Campana et al., 2025). Water-use efficiency and microclimate cooling can partially offset yield penalties in hot, dry climates, but gains may be small or negative in temperate or wet climates (Campana et al., 2025; Pandey et al., 2025). Overall benefits depend on careful siting, crop selection, and policies that offset higher installation costs while avoiding land-use competition.

Action Word
Deploy
Solution Title
Agrivoltaics
Classification
Highly Recommended

Lawmakers and Policymakers

  • Set ambitious long-term renewable energy goals in national climate plans and multilateral agreements; incorporate agrivoltaics into national climate, energy, and agriculture plans. 
  • Create clear and easy-to-understand regulations that support agrivoltaics deployment and attract investment; use flexible definitions to encourage innovation; ground policies in scientific evidence, incorporating the latest data on the impacts to grid stability, microgrids development, soil carbon, biodiversity, and water management; avoid rigid annual yield requirements; allow flexibility in subsidy programs and regulations to give farmers using agrivoltaics greater choice in crop selection.
  • Create clear guidelines for installing and operating agrivoltaics to optimize land productivity while minimizing soil compaction and other environmental impacts.
  • Coordinate agrivoltaic policies horizontally (e.g., across agencies) and vertically (e.g., across subnational, national, and international efforts); align social and environmental safeguards with agrivoltaic policies.
  • Provide financial incentives to developers and farmers, such as subsidies (especially to reduce up-front cost), feed-in tariffs, tax credits, grants, green bonds, waived grid connection fees, and forgivable or concessional loans; gradually reduce subsidies as markets mature; offer farmers increased incentives for farmer-owned systems; prioritize smallholder and low- to middle-income farmers.
  • Streamline permitting procedures for agrivoltaic projects; standardize documents such as templates for power purchase agreements (PPAs).
  • Develop long-term, flexible partnership frameworks with industry, including adaptable or aggregated PPAs, aligned with national decarbonization targets and timelines.
  • Implement or strengthen renewable portfolio standards, clean energy standards, or other similar policy mechanisms with carve-outs for agrivoltaics.
  • Implement carbon taxes and redirect fossil-fuel subsidy savings into agrivoltaics and renewables.
  • Invest in grid-enhancing technologies, flexibility, storage, and transmission infrastructure to manage variable generation.
  • Work with industry to diversify solar panel supply chains; design incentives and policies to stimulate local or regional production, and advance R&D for solar and related equipment, such as batteries.
  • Strengthen labor and human rights laws and standards around solar PV supply chains; invest in enforcement mechanisms – particularly for the extraction and use of critical minerals and panel manufacturing.
  • Strengthen land tenure rights; clarify rules allowing agrivoltaics on agricultural land; differentiate agrivoltaics from conventional ground-mounted solar panels; create supportive policies to deploy agrivoltaic systems for restoring abandoned or contaminated land.
  • Require environmental and health impact assessments before installation and during operation.
  • Co-design agrivoltaic projects with relevant stakeholders; ensure the stakeholder engagement process starts early and is transparent, inclusive, and ongoing; solicit feedback from the local community on location, design, and finance; ensure finalized projects address relevant sociological, agriculture, and ecological considerations.
  • Ensure regulations support diverse development and ownership models (e.g., build-own-operate, public-private partnerships, energy communities, and cooperatives).
  • Establish strong quality control requirements for all stages of deployment, including resource extraction, manufacturing, installation, maintenance, and end-of-life service for solar panels used in agrivoltaics; create certification programs for each stage of the process.
  • Require or encourage manufacturers to provide minimum warranties; establish independent grievance mechanisms to resolve customer disputes and help foster trust in the industry.
  • Work with the private sector on workforce training programs, professional certifications, and capacity development for all project phases.
  • Partner with insurance agencies to develop tailored products for farmers adopting agrivoltaics.
  • Implement strong end-of-life regulations for solar panels, including extended producer responsibility (EPR) for manufacturers; support markets for reuse, refurbishment, and recycling.
  • Join, create, or participate in public-private partnerships dedicated to de-risking markets, deployment, technology transfers, education, and other relevant areas.
  • Expand extension services with agrivoltaics-specific guidance, demonstration projects, and peer learning; work with energy agencies to raise awareness; create accessible one-stop-shop educational programs (online and in-person) on regulations, benefits, and best practices, tailored to local contexts. 

Further information:

Practitioners

  • Farmer / Solar Provider: Take advantage of government incentives such as subsidies, grants, tax credits, or waived-connection fees; as the market matures, gradually reduce reliance on these incentives to create long-term market stability.
  • Solar Provider: Conduct careful planning and thorough consultation with farmers to determine the best installation practices; minimize disruption to farming operations and customize configurations to each farmer’s needs and planting schedules.
  • Farmer / Solar Provider: AMinimize soil compaction during installation and servicing with techniques such as scheduling installations during farming off seasons or using specialized equipment.
  • Solar Provider: Use a variety of panel systems, including vertical, single-axis, and dual-axis tracking systems in addition to fixed-tilt systems; improve optimization strategies for single-axis and dual-axis systems and integrate sun-tracking with agricultural strategies, crop selectivity, and soil and weather monitoring systems.
  • Solar Provider: Offer tools or services to help farmers navigate solar arrays more easily, such as geospatial navigation systems, remote sensors, and vision-assisted navigation systems.
  • Solar Provider: Avoid the use of concrete and permanent structures when installing PV systems on farmland.
  • Solar Provider: Offer a variety of business arrangements for farmers, such as pay-as-you-go build-own-operate models, revenue-sharing agreements, and flat lease payments.
  • Solar Provider: Provide options and guidance to improve visual attractiveness of agrivoltaic systems, such as hedges, strategic spacing, and panel coloring.
  • Solar Provider: Standardize agrivoltaic system designs for different geographies and agriculture applications.
  • Farmer / Solar Provider: Consult on maintenance and cleaning protocols, accounting for food safety, the need to reduce soil compaction, and other relevant environmental or health regulations.
  • Solar Provider: Use geospatial and satellite data to assess landscape, market dynamics, and potential customer base.
  • Solar Provider: Design agrivoltaic minigrid systems for compatibility with the main grid to enable future connection. 
  • Solar Provider: Reduce customer acquisition costs using machine learning models to identify potential customers and eligible sites.
  • Solar Provider / Regulator: Collaborate with the public sector to diversify solar panel supply chains; leverage incentives and policies that stimulate local or regional production and advance R&D.
  • Solar Provider: Ensure supply chains comply with international labor and human rights laws and standards, particularly for the extraction of critical minerals and panel manufacturing.
  • Solar Provider: Work to decarbonize the full life cycle, including supply chains, production, installation, recycling, and disposal.
  • Solar Provider / Regulator: Partner with the public sector and private organizations to develop workforce training programs; ensure capacity development for all stages of deployment, including installation best practices and end-of-life services.
  • Farmer / Solar Provider: Stay abreast of and engage with changing policies, regulations, zoning laws, tax incentives, and related developments to help remove commercial barriers.
  • Farmer / Solar Provider: Join, create, or participate in public-private partnerships dedicated to de-risking markets, deployment, technology transfers, education, and other relevant areas.
  • [Farmer / Solar Provider] Help expand extension services and create educational opportunities, including demonstration projects and peer-to-peer learning, in agrivoltaics; work with energy agencies to raise awareness.

Further information:

Business Leaders

  • Set ambitious long-term renewable energy goals; incorporate agrivoltaics, where feasible, into corporate net-zero strategies.
  • Support long-term, stable contracts (e.g., PPAs) that de-risk investment in agrivoltaic technologies and incentivize local supply chain development.
  • Invest in companies that produce, deploy, or provide end-of-life servicing for solar panels used for agrivoltaic systems; seek to diversify and localize supply chains.
  • Invest in R&D and related technology, such as batteries, navigation systems for farmers, and software to manage agrivoltaic systems.
  • Support workforce development programs, offer employee scholarships, and/or sponsor training for careers in agrivoltaics; help ensure capacity development for all stages of deployment, including installation and end-of-life services.
  • Offer pro bono business advice or general support for community and cooperative agrivoltaic projects.
  • Join, create, or participate in public-private partnerships dedicated to de-risking markets, deployment, technology transfers, education, and other relevant areas.

Further information:

Nonprofit Leaders

  • Advocate for ambitious long-term renewable energy goals in national climate plans and multilateral agreements; help incorporate agrivoltaics into national climate, energy, and agriculture plans. 
  • Operate or support agrivoltaic demonstration projects, equipment testing, certification, market information disclosures, and onsite supervision.
  • Conduct open-access research to improve the performance of solar PVs in agrivoltaic systems; research optimal crops and panel arrangements, forecasting, and related technologies; help standardize models across geographies and agricultural applications. 
  • Advocate for clear and easy-to-understand regulations that enable agrivoltaics deployment and investment; promote flexible definitions to allow for innovation; provide scientific evidence on the impacts to grid stability, microgrids, soil carbon, biodiversity, and water management; recommend avoiding rigid annual yield requirements and allowing farmers flexibility in crop selection in subsidy and insurance programs.
  • Contribute to clear guidelines for installing and operating agrivoltaics to optimize land productivity while minimizing soil compaction and other environmental impacts.
  • Urge governments to coordinate agrivoltaic policies horizontally (e.g., across agencies) and vertically (e.g., across subnational, national, and international efforts); help align social and environmental safeguards with agrivoltaic policies.
  • Advocate for streamlined permitting procedures and standardize documents such as templates for PPAs.
  • Offer financial assistance to farmers, cooperatives, or communities seeking to deploy agrivoltaics; advocate for targeted incentives to developers and farmers, such as subsidies (especially to reduce up-front cost), feed-in tariffs, tax credits, grants, green bonds, waived grid connection fees, and forgivable or concessional loans; recommend subsidies be gradually reduced as the market stabilizes; earmark funds and/or urge governments to earmark incentives for smallholder and low- and middle-income farmers.
  • Advocate for carbon taxes and redirection of fossil fuel subsidies into agrivoltaics and renewables.
  • Urge policymakers to invest in and subsidize grid-enhancing technologies, flexibility, storage, and transmission infrastructure to manage variable generation.
  • Work with policymakers and industry to diversify solar panel supply chains; help design incentives and policies to stimulate local or regional production; urge policymakers to invest in R&D for solar panels and related equipment such as batteries.
  • Help strengthen labor and human rights laws and standards around solar PV supply chains; invest in enforcement mechanisms – particularly for the extraction and use of critical minerals and panel manufacturing.
  • Help strengthen land tenure rights through documentation and advocacy; help policymakers clarify and allow agrivoltaics on agricultural land; differentiate agrivoltaics from conventional ground-mounted solar panels; create supportive policies to deploy agrivoltaic systems for restoring abandoned or contaminated land.
  • Offer services to conduct environmental and health impact assessments before installation and during operations of agrivoltaics.
  • Participate in community feedback sessions and co-design agrivoltaic projects with farmers, developers, and other relevant stakeholders.
  • Help create or support community agrivoltaics using a variety of development models and benefit-sharing arrangements (e.g., build-own-operate, publicly owned businesses, developer-owned businesses, public-private partnerships, energy communities, and cooperatives).
  • Create certification programs for all stages of deployment, including resource extraction, manufacturing, installation, maintenance, and end-of-life service for solar panels used in agrivoltaic systems.
  • Work with policymakers and the private sector to develop workforce training programs; ensure capacity development for all stages of deployment, including end-of-life services; create professional certifications for the full spectrum of roles.
  • Help create strong regulations for end-of-life services for solar panels; advocate for EPR for manufacturers; work with industry to foster a market for used, refurbished, and recycled panels.
  • Join, create, or participate in public-private partnerships dedicated to de-risking markets, deployment, technology transfers, education, and other relevant areas.
  • Help expand extension services and create educational opportunities, including demonstration projects and peer-to-peer learning in agrivoltaics; work with energy agencies to raise awareness.

Further information:

Investors

  • Offer low-interest loans and concessional financing to farmers, panel manufacturers, developers, operators, recyclers, and others involved in agrivoltaics.
  • Invest directly in agrivoltaics projects.
  • Invest in companies that produce, deploy, or provide end-of-life servicing for solar panels used in agrivoltaics; support supply chain localization and diversification.
  • Invest in supportive infrastructures, such as utility companies and grid development.
  • Invest in green bonds and/or explore blended finance structures to mobilize capital for agrivoltaics and enabling infrastructure.
  • Invest in solar panel recycling infrastructure and circular supply chains.
  • Invest in R&D for component technology and related equipment, such as batteries.
  • Help de-risk agrivoltaics adoption in low- and middle-income communities through low-interest loans, concessional financing, and/or favorable terms.
  • Align investments with existing public-private partnerships, voluntary agreements, or voluntary guidance that may apply in the location of the investment.

Further information:

Philanthropists and International Aid Agencies

  • Advocate for ambitious long-term renewable energy goals in national climate plans and multilateral agreements; help incorporate agrivoltaics into national climate, energy, and agriculture plans. 
  • Operate agrivoltaic demonstration projects, equipment testing, certification systems, market information disclosures, and onsite supervision.
  • Offer low-interest loans and concessional financing for farmers, panel manufacturers, developers, operators, recyclers, and others involved in agrivoltaics.
  • Award grants for the development of agrivoltaics projects and/or adjacent areas such as mini-grids.
  • Award grants to or invest in companies that produce, deploy, or provide end-of-life servicing for solar panels used in agrivoltaics; seek to diversify and localize supply chains.
  • Provide financing for supportive infrastructures, such as utility companies and grid development.
  • Invest in green bonds and/or explore blended finance structures to mobilize capital for companies developing or deploying agrivoltaics and supportive infrastructure.
  • Finance recycling infrastructure for solar panels and circular supply chains.
  • Help de-risk transitions to agrivoltaic systems in low- and middle-income communities by earmarking a percentage of grant funds and/or offering low-interest loans, concessional financing, and/or favorable terms.
  • Conduct open-access research to improve the performance of solar PVs in agrivoltaic systems; research optimal crops and panel arrangements, forecasting, and related technologies; help standardize models across geographies and agricultural applications. 
  • Help create clear and easy-to-understand regulations that enable agrivoltaics deployment and investment; promote flexible definitions to allow for innovation; provide scientific evidence for the impacts to grid stability, microgrids, soil carbon, biodiversity, and water management; recommend avoiding rigid annual yield requirements and allowing farmers flexibility in crop selection in subsidy and insurance programs.
  • Contribute to clear guidelines for installing and operating agrivoltaics to optimize land productivity while minimizing soil compaction and other environmental impacts.
  • Urge governments to coordinate agrivoltaic policies horizontally (e.g., across agencies) and vertically (e.g., across subnational, national, and international efforts); help align social and environmental safeguards with agrivoltaic policies.
  • Advocate for streamlined permitting procedures and standardize documents such as templates for PPAs.
  • Call on governments to provide financial incentives to developers and farmers, such as subsidies (especially to reduce up-front cost), feed-in tariffs, tax credits, grants, green bonds, waived grid connection fees, and forgivable or concessional loans; recommend subsidies be gradually reduced as the market stabilizes; urge governments to earmark incentives for smallholder, low- and middle-income farmers.
  • Advocate for carbon taxes and redirection of fossil fuel subsidies into agrivoltaics and renewables.
  • Urge policymakers to invest in and subsidize grid enhancing technologies, flexibility, storage, and transmission infrastructure to manage variable generation.
  • Work with policymakers and industry to diversify solar panel supply chains; help design incentives and policies to stimulate local or regional production and advance R&D for solar panels and related equipment such as batteries.
  • Help strengthen labor and human rights laws and standards around solar PV supply chains; invest in enforcement mechanisms – particularly for the extraction and use of critical minerals and panel manufacturing.
  • Help strengthen land tenure rights through documentation and advocacy; help policymakers clarify and allow agrivoltaics on agricultural land; differentiate agrivoltaics from conventional ground-mounted solar panels; create supportive policies to deploy agrivoltaic systems for restoring abandoned or contaminated land.
  • Offer or support services to conduct environmental and health impact assessments before installation and during operations of agrivoltaics.
  • Participate in community feedback sessions and co-design agrivoltaic projects with farmers, developers, and other relevant stakeholders.
  • Help create or support community agrivoltaics using a variety of development models and benefit-sharing arrangements (e.g., build-own-operate, publicly owned businesses, developer-owned businesses, public-private partnerships, energy communities, and cooperatives).
  • Finance or create certification programs for all stages of deployment, including resource extraction, manufacturing, installation, maintenance, and end-of-life service for agrivoltaic systems. 
  • Work with policymakers and the private sector to develop workforce training programs; ensure capacity development for all stages of deployment, including end-of-life services; create professional certifications for the full spectrum of roles.
  • Help create strong regulations for end-of-life services for solar panels; advocate for EPR for manufacturers; work with industry to foster a market for used, refurbished, and recycled panels.
  • Join, create, or participate in public-private partnerships dedicated to de-risking markets, deployment, technology transfers, education, and other relevant areas.
  • Help expand extension services or create educational opportunities that offer options for deployment, technical guidance, demonstration projects, and peer-to-peer learning opportunities in agrivoltaics; work with energy agencies to raise awareness.

Further information:

Thought Leaders

  • Advocate for ambitious long-term renewable energy goals in national climate plans and multilateral agreements; help incorporate agrivoltaics into national climate, energy, and agriculture plans. 
  • Operate agrivoltaic demonstration projects, equipment testing, certification systems, market information disclosures, and onsite supervision.
  • Conduct open-access research to improve the performance of solar PV in agrivoltaic systems; research optimal crops and panel arrangements, forecasting, and related technologies; help standardize models across geographies and agricultural applications. 
  • Help create clear and easy-to-understand regulations that enable agrivoltaics deployment and investment; promote flexible definitions to allow for innovation; provide scientific evidence on the impacts to grid stability, microgrids, soil carbon, biodiversity, and water management; recommend avoiding rigid annual yield requirements and allowing farmers flexibility in crop selection in subsidy and insurance programs. 
  • Contribute to clear guidelines for installing and operating agrivoltaics to optimize land productivity while minimizing soil compaction and other environmental impacts.
  • Urge governments to coordinate agrivoltaic policies horizontally (e.g., across agencies) and vertically (e.g., across subnational, national, and international efforts); help align social and environmental safeguards with agrivoltaic policies.
  • Advocate for streamlined permitting procedures and standardize documents such as templates for PPAs.
  • Call on governments to provide financial incentives to developers and farmers, such as subsidies (especially to reduce up-front cost), feed-in tariffs, tax credits, grants, green bonds, waived grid connection fees, and forgivable or concessional loans; recommend subsidies be gradually reduced as the market stabilizes; urge policymakers to earmark incentives for smallholder, low- and middle-income farmers.
  • Advocate for carbon taxes and redirection of fossil fuel subsidies into agrivoltaics and renewables.
  • Urge policymakers to invest in and subsidize grid-enhancing technologies, flexibility, storage, and transmission infrastructure to manage variable generation.
  • Help strengthen labor and human rights laws and standards around solar PV supply chains; invest in enforcement mechanisms –particularly, for the extraction and use of critical minerals and panel manufacturing.
  • Help strengthen land tenure rights through documentation and advocacy; help policymakers clarify and allow agrivoltaics on agricultural land; differentiate agrivoltaics from conventional ground-mounted solar panels; create supportive policies to deploy agrivoltaic systems for restoring abandoned or contaminated land.
  • Offer services to conduct environmental and health impact assessments before installation and during operations of agrivoltaics.
  • Participate in community feedback sessions and co-design agrivoltaic projects with farmers, developers, and other relevant stakeholders.
  • Help create certification programs for all stages of deployment, including resource extraction, manufacturing, installation, maintenance, and end-of-life service for agrivoltaic systems.
  • Work with policymakers and the private sector to develop workforce training programs; ensure capacity development for all stages of deployment, including end-of-life services; create professional certifications for the full spectrum of roles.
  • Help create strong regulations for end-of-life services for solar panels; advocate for EPR for manufacturers; work with industry to foster a market for used, refurbished, and recycled panels.
  • Join, create, or participate in public-private partnerships dedicated to de-risking markets, deployment, technology transfers, education, and other relevant areas.
  • Help expand extension services or create educational opportunities that offer options for deployment, technical guidance, demonstration projects, and peer-to-peer learning opportunities in agrivoltaics; work with energy agencies to raise awareness.

Further information:

Technologists and Researchers

  • Design solar panels and mounting systems that reduce material requirements and overall system weight.
  • Research lighter-weight materials for agrivoltaic systems and evaluate their technical, economic, and environmental feasibility. 
  • Advance scientific understanding of optimal crop selection for agrivoltaic systems; improve solar panel wavelength selectivity; develop standardized system configurations for specific geographies and agricultural applications; identify optimal spacing requirements for various arrangements.
  • Research soil compaction impacts in agrivoltaic systems, ways to prevent or minimize it during site preparation and installation, and ways to alleviate or reverse it post-installation – with priority on approaches compatible with ongoing PV operations and long-term soil health.
  • Identify ways to reduce the impact of agrivoltaic systems on satellite signals to improve navigation technology.
  • Improve semi-transparent photovoltaic panels to increase efficiency and reduce costs for agrivoltaic systems.
  • Examine the impacts of agrivoltaics on soil health, water management, biodiversity, and other environmental factors.
  • Create publicly accessible databases of agrivoltaic models, performance data, and best practices.
  • Assess policy frameworks and regulations that enable or inhibit agrivoltaics adoption. 
  • Identify barriers to adoption for farmers; research impacts of agrivoltaics on property value and land classification.
  • Improve and update spatial data on power grid locations and available transmission capacities, especially in rural and underserved areas.
  • Examine the impacts of agrivoltaics on food security, energy access, and rural communities.
  • Advance the use of AI or other technological tools for predictive analytics, yield forecasting, and power system control.
  • Improve recycling infrastructure and scalable technologies to repair, reuse, or recover materials from solar panels.
  • Improve related mining technologies for critical minerals, making the extraction process safer, less disruptive to local communities and ecosystems, and less energy intensive.
  • Develop ways of eliminating, reducing, reusing, and/or safely disposing of hazardous by-products of PV manufacturing.
  • Research social factors that drive community acceptance and the role of agrivoltaics in a fair and just energy transition. 

Further information:

Communities, Households, and Individuals

  • Help create or support community agrivoltaic projects using models such as build-own-operate, public-private partnerships, energy communities, and cooperatives.
  • Take advantage of available government incentives such as subsidies, tax breaks, and forgivable or concessional loans for community agrivoltaic projects.
  • Advocate for ambitious long-term renewable energy goals in national climate plans and multilateral agreements.
  • Call on governments to provide financial incentives to developers and farmers, such as subsidies (especially to reduce up-front cost), feed-in tariffs, tax credits, grants, green bonds, waived grid connection fees, and forgivable or concessional loans; recommend subsidies be gradually reduced as the market stabilizes; urge policymakers to earmark incentives for smallholder, low- and middle-income farmers.
  • Advocate for carbon taxes and the redirection of fossil fuel subsidies into agrivoltaics and renewables.
  • Urge policymakers to invest in and subsidize improvements to grid integration and flexibility, storage, and infrastructure to manage variable generation.
  • Participate in community feedback sessions and co-design agrivoltaic projects with farmers, developers, and other relevant stakeholders.
  • Join, create, or participate in public-private partnerships dedicated to de-risking markets, deployment, technology transfers, education, and other relevant areas.
  • Volunteer with community agrivoltaic projects; participate in public awareness campaigns; share information with your community and networks regarding the benefits of agrivoltaic systems.

Further information:

Evidence Base

Consensus of overall effectiveness of agrivoltaics: High

A wide range of peer-reviewed studies, meta-analyses, and life-cycle assessments provide strong evidence that agrivoltaics reduce GHG emissions. International organizations such as the Intergovernmental Panel on Climate Change (IPCC) and IEA identify rapid solar PV deployment as a critical component in mitigation pathways and net-zero scenarios. Life-cycle assessments show that, despite 20% higher embodied emissions from elevated structures compared with conventional solar PV, agrivoltaic systems deliver significant net emissions reductions by displacing fossil generation while maintaining agricultural output on the same footprint (Agostini et al., 2021; Barron-Gafford et al., 2019; Campana et al., 2025).

There is sufficient evidence that well-sited agrivoltaic systems increase land-use efficiency, and can provide additional benefits including reduced water stress, avoided land-use conflict, and improved solar PV performance in suitable climates (Barron-Gafford et al., 2019; Campana et al., 2025; Dupraz et al., 2011; Trommsdorff et al., 2025). Meta-analyses show manageable yield responses for shade-tolerant or neutral crops, especially in arid and semi-arid regions (Chirinda et al., 2024; Mamun et al., 2022); however yields for shade-intolerant crops or in temperate and humid climates are less consistent. Higher capital costs, site-specific challenges, and limited long-term data beyond two to three growing seasons create economic uncertainty. 

Consensus is mixed regarding net emissions savings of solar PV, given the diurnal nature of solar energy and the need for storage or other energy resources to meet peak evening demand. There is also a lack of global scientific or regulatory consensus regarding the definition of agrivoltaics, with qualification thresholds for which agricultural activities and what level of activity constitutes dual-use land varying substantially across jurisdictions (Trommsdorff et al., 2025).

This summary draws from 5 reviews and meta-analyses, 25 institutional reports, 6 market reports, and 32 original studies covering more than 25 countries, with strongest evidence from Europe, North America, East Asia, and select arid regions. We recognize this limited geographic scope creates bias toward higher-income and temperate-to-arid settings. Further research and data sharing in underrepresented low-income regions is required, where land, water, and energy pressures makes agrivoltaic systems potentially most impactful.

Updated Date
Coming Soon Label
Coming Soon

Restore Forests

Image
Image
person planting trees
Coming Soon
Off
Summary

Forest restoration is the process of returning previously forested land to a forested state. As forests regrow, they remove carbon from the atmosphere and sequester it in biomass.

Description for Social and Search
Restore Forests is a Highly Recommended climate solution. Diverse, healthy forests sequester carbon as biomass.
Overview

We define forest restoration as planting new trees or allowing trees to naturally regrow on previously forested land that has been cleared. Through photosynthesis, forests take carbon from the atmosphere and store it in biomass. On net, forests currently take up an estimated 11.4–14.7 Gt CO₂‑eq/yr  (Friedlingstein et al., 2023; Gibbs et al., 2025; Pan et al., 2024), equal to approximately 19–25% of total global anthropogenic GHG emissions (Dhakal et al., 2022). Restoring forests increases the size of the forest carbon sink, sequestering additional CO₂.  

As commonly defined, restoration ranges from improving management of existing ecosystems, to re-establishing cleared ecosystems, to maintaining the health of functional ecosystems. Forest restoration includes activities such as exclusion of non-native grazing animals from a regenerating site, weed management, assisted seed dispersal, controlled burning, stand thinning, direct seeding, soil amendment, tree planting, and modification of topography or hydrology and other activities (Chazdon et al., 2024; Gann et al., 2022; Kübler & Günter 2024). While acknowledging that all restoration occurs along a spectrum of intervention intensity, we report effectiveness, cost, and adoption data for “low intensity” and “high intensity” restoration separately, with “low intensity” restoration including all interventions up to, but not including, tree planting, and “high intensity” restoration referring to direct seeding or seedling planting. To account for variability in carbon sequestration rates and area available for forest restoration, this analysis also evaluates forest restoration in boreal, temperate, subtropical, and tropical regions separately where possible.

Our definition of forest restoration is more limited than that used by many other sources. First, we only include reforestation of previously forested land with an element of direct human intervention, and therefore exclude entirely passive tree regrowth on abandoned land (i.e., unassisted natural regeneration) and afforestation of native grasslands and savannas. We also exclude areas currently used for crop production. To avoid double counting, we also do not include activities covered in other Project Drawdown solutions, including increasing carbon stocks in existing forests and establishing timber plantations, agroforestry, or silvopasture (see Improve Forest Management, Deploy Biomass Crops on Degraded Land, Deploy Agroforestry, and Deploy Silvopasture, respectively). Restoration of mangroves and forests on peat soils is also excluded, as this is covered in the Restore Coastal Wetlands and Restore Peatlands solutions. Because the scope of this solution is narrower than that of many other studies, the estimated impacts are correspondingly lower as well. 

Intact and regenerating forests take up carbon, but human clearing of forests for logging, agriculture, and other activities emits carbon. Humans clear an estimated 15.5 Mha of forests annually, emitting ~7.4 Gt CO₂‑eq/yr (2001–2024; Harris et al., 2021; Gibbs et al., 2025; Sims et al., 2025). Protecting existing forests reduces emissions from deforestation (see Protect Forests) and is an essential complement to forest restoration. 

References

Adams, C., Rodrigues, S. T., Calmon, M., & Kumar, C. (2016). Impacts of large-scale forest restoration on socioeconomic status and local livelihoods: What we know and do not know. Biotropica, 48(6), 731–744. Link to source: https://doi.org/10.1111/btp.12385

Ager, A. A., Vogler, K. C., Day, M. A., & Bailey, J. D. (2017). Economic opportunities and trade-offs in collaborative forest landscape restoration. Ecological Economics, 136, 226–239. Link to source: https://doi.org/10.1016/j.ecolecon.2017.01.001

Andres, S. E., Standish, R. J., Lieurance, P. E., Mills, C. H., Harper, R. J., Butler, D. W., Adams, V. M., Lehmann, C., Tetu, S. G., Cuneo, P., Offord, C. A., & Gallagher, R. V. (2023). Defining biodiverse reforestation: Why it matters for climate change mitigation and biodiversity. Plants, People, Planet, 5(1), 27–38. Link to source: https://doi.org/10.1002/ppp3.10329

Austin, K. G., Baker, J. S., Sohngen, B. L., Wade, C. M., Daigneault, A., Ohrel, S. B., Ragnauth, S., & Bean, A. (2020). The economic costs of planting, preserving, and managing the world’s forests to mitigate climate change. Nature Communications, 11(1), Article 5946. Link to source: https://doi.org/10.1038/s41467-020-19578-z

Bastin, J.-F., Finegold, Y., Garcia, C., Mollicone, D., Rezende, M., Routh, D., Zohner, C. M., & Crowther, T. W. (2019). The global tree restoration potential. Science, 365(6448), 76–79. Link to source: https://doi.org/10.1126/science.aax0848

Begliomini, F. N., & Brancalion, P. H. S. (2024). Are state-of-the-art LULC maps able to track ecological restoration efforts in Brazilian Atlantic forest? IGARSS 2024 - 2024 IEEE International Geoscience and Remote Sensing Symposium, 4748–4752. Link to source: https://doi.org/10.1109/IGARSS53475.2024.10641177

Beltrão, M. G., Gonçalves, C. F., Brancalion, P. H. S., Carmignotto, A. P., Silveira, L. F., Galetti, P. M., & Galetti, M. (2024). Priority areas and implementation of ecological corridor through forest restoration to safeguard biodiversity. Scientific Reports, 14(1), Article 30837. Link to source: https://doi.org/10.1038/s41598-024-81483-y

Bernal, B., Murray, L. T., & Pearson, T. R. H. (2018). Global carbon dioxide removal rates from forest landscape restoration activities. Carbon Balance and Management, 13(1), Article 22. Link to source: https://doi.org/10.1186/s13021-018-0110-8

Betts, R. A. (2000). Offset of the potential carbon sink from boreal forestation by decreases in surface albedo. Nature, 408(6809), 187–190. Link to source: https://doi.org/10.1038/35041545

Bialic-Murphy, L., McElderry, R. M., Esquivel-Muelbert, A., van den Hoogen, J., Zuidema, P. A., Phillips, O. L., de Oliveira, E. A., Loayza, P. A., Alvarez-Davila, E., Alves, L. F., Maia, V. A., Vieira, S. A., Arantes da Silva, L. C., Araujo-Murakami, A., Arets, E., Astigarraga, J., Baccaro, F., Baker, T., Banki, O., … Crowther, T. W. (2024). The pace of life for forest trees. Science, 386(6717), 92–98. Link to source: https://doi.org/10.1126/science.adk9616

Bliege Bird, R., & Nimmo, D. (2018). Restore the lost ecological functions of people. Nature Ecology & Evolution, 2(7), 1050–1052. Link to source: https://doi.org/10.1038/s41559-018-0576-5

Brancalion, P. H. S., de Siqueira, L. P., Amazonas, N. T., Rizek, M. B., Mendes, A. F., Santiami, E. L., Rodrigues, R. R., Calmon, M., Benini, R., Tymus, J. R. C., Holl, K. D., & Chaves, R. B. (2022). Ecosystem restoration job creation potential in Brazil. People and Nature, 4(6), 1426–1434. Link to source: https://doi.org/10.1002/pan3.10370

Brancalion, P. H. S., Hua, F., Joyce, F. H., Antonelli, A., & Holl, K. D. (2025). Moving biodiversity from an afterthought to a key outcome of forest restoration. Nature Reviews Biodiversity, 1(4), 248–261.  https://doi.org/10.1038/s44358-025-00032-1

Brumberg, H., Margaret Hegwood, Eichhorst, W., LoPresti, A., Erbaugh, J. T., & Kroeger, T. (2025). Global analysis of constraints to natural climate solution implementation. PNAS Nexus, 4(6), Article pgaf173. Link to source: https://doi.org/10.1093/pnasnexus/pgaf173

Bukoski, J. J., Cook-Patton, S. C., Melikov, C., Ban, H., Chen, J. L., Goldman, E. D., Harris, N. L., & Potts, M. D. (2022). Rates and drivers of aboveground carbon accumulation in global monoculture plantation forests. Nature Communications, 13(1), Article 4206. Link to source: https://doi.org/10.1038/s41467-022-31380-7

Busch, J., Bukoski, J. J., Cook-Patton, S. C., Griscom, B., Kaczan, D., Potts, M. D., Yi, Y., & Vincent, J. R. (2024). Cost-effectiveness of natural forest regeneration and plantations for climate mitigation. Nature Climate Change, 14(9), 996–1002. Link to source: https://doi.org/10.1038/s41558-024-02068-1

Chaplin-Kramer, R., Ramler, I., Sharp, R., Haddad, N. M., Gerber, J. S., West, P. C., Mandle, L., Engstrom, P., Baccini, A., Sim, S., Mueller, C., & King, H. (2015). Degradation in carbon stocks near tropical forest edges. Nature Communications, 6(1), Article 10158. Link to source: https://doi.org/10.1038/ncomms10158

Chazdon, R. L., Falk, D. A., Banin, L. F., Wagner, M., J. Wilson, S., Grabowski, R. C., & Suding, K. N. (2024). The intervention continuum in restoration ecology: Rethinking the active–passive dichotomy. Restoration Ecology, 32(8), Article e13535. Link to source: https://doi.org/10.1111/rec.13535

Chazdon, R. L., & Guariguata, M. R. (2016). Natural regeneration as a tool for large-scale forest restoration in the tropics: Prospects and challenges. Biotropica, 48(6), 716–730. Link to source: https://doi.org/10.1111/btp.12381

Chazdon, R. L., Wilson, S. J., Brondizio, E., Guariguata, M. R., & Herbohn, J. (2021). Key challenges for governing forest and landscape restoration across different contexts. Land Use Policy, 104, Article 104854. Link to source: https://doi.org/10.1016/j.landusepol.2020.104854

Cook-Patton, S. C., Leavitt, S. M., Gibbs, D., Harris, N. L., Lister, K., Anderson-Teixeira, K. J., Briggs, R. D., Chazdon, R. L., Crowther, T. W., Ellis, P. W., Griscom, H. P., Herrmann, V., Holl, K. D., Houghton, R. A., Larrosa, C., Lomax, G., Lucas, R., Madsen, P., Malhi, Y., … Griscom, B. W. (2020). Mapping carbon accumulation potential from global natural forest regrowth. Nature, 585(7826), 545–550. Link to source: https://doi.org/10.1038/s41586-020-2686-x

Crouzeilles, R., Barros, F. S. M., Molin, P. G., Ferreira, M. S., Junqueira, A. B., Chazdon, R. L., Lindenmayer, D. B., Tymus, J. R. C., Strassburg, B. B. N., & Brancalion, P. H. S. (2019). A new approach to map landscape variation in forest restoration success in tropical and temperate forest biomes. Journal of Applied Ecology, 56(12), 2675–2686. Link to source: https://doi.org/10.1111/1365-2664.13501

Crouzeilles, R., Curran, M., Ferreira, M. S., Lindenmayer, D. B., Grelle, C. E. V., & Rey Benayas, J. M. (2016). A global meta-analysis on the ecological drivers of forest restoration success. Nature Communications, 7(1), Article 11666. Link to source: https://doi.org/10.1038/ncomms11666

Curtis, P. G., Slay, C. M., Harris, N. L., Tyukavina, A., & Hansen, M. C. (2018). Classifying drivers of global forest loss. Science, 361(6407), 1108–1111. Link to source: https://doi.org/10.1126/science.aau3445

Dhakal, S., J.C. Minx, F.L. Toth, A. Abdel-Aziz, M.J. Figueroa Meza, K. Hubacek, I.G.C. Jonckheere, Yong-Gun Kim, G.F. Nemet, S. Pachauri, X.C. Tan, T. Wiedmann, 2022: Emissions Trends and Drivers. In IPCC, 2022: Climate Change 2022: Mitigation of Climate Change. Contribution of Working Group III to the Sixth Assessment Report of the Intergovernmental Panel on Climate Change [P.R. Shukla, J. Skea, R. Slade, A. Al Khourdajie, R. van Diemen, D. McCollum, M. Pathak, S. Some, P. Vyas, R. Fradera, M. Belkacemi, A. Hasija, G. Lisboa, S. Luz, J. Malley, (eds.)]. Cambridge University Press, Cambridge, UK and New York, NY, USA. Link to source: https://doi.org/10.1017/9781009157926.004

De Groot, R. S., Blignaut, J., Van Der Ploeg, S., Aronson, J., Elmqvist, T., & Farley, J. (2013). Benefits of investing in ecosystem restoration. Conservation Biology, 27(6), 1286–1293. Link to source: https://doi.org/10.1111/cobi.12158

de Souza, S. E. X. F., Vidal, E., Chagas, G. de F., Elgar, A. T., & Brancalion, P. H. S. (2016). Ecological outcomes and livelihood benefits of community-managed agroforests and second growth forests in Southeast Brazil. Biotropica, 48(6), 868–881. Link to source: https://doi.org/10.1111/btp.12388

Di Sacco, A., Hardwick, K. A., Blakesley, D., Brancalion, P. H. S., Breman, E., Cecilio Rebola, L., Chomba, S., Dixon, K., Elliott, S., Ruyonga, G., Shaw, K., Smith, P., Smith, R. J., & Antonelli, A. (2021). Ten golden rules for reforestation to optimize carbon sequestration, biodiversity recovery and livelihood benefits. Global Change Biology, 27(7), 1328–1348. Link to source: https://doi.org/10.1111/gcb.15498

Dib, V., Brancalion, P. H. S., Chan Chou, S., Cooper, M., Ellison, D., Farjalla, V. F., Filoso, S., Meli, P., Pires, A. P. F., Rodriguez, D. A., Iribarrem, A., Latawiec, A. E., Scarano, F. R., Vogl, A. L., de Viveiros Grelle, C. E., & Strassburg, B. (2023). Shedding light on the complex relationship between forest restoration and water services. Restoration Ecology, 31(5), Article e13890. Link to source: https://doi.org/10.1111/rec.13890

dos Reis Oliveira, P. C., Gualda, G. A. F., Rossi, G. F., Camargo, A. F. M., Filoso, S., Brancalion, P. H., & Ferraz, S. F. de B. (2025). Forest restoration improves habitat and water quality in tropical streams: A multiscale landscape assessment. Science of The Total Environment, 963, Article 178256. Link to source: https://doi.org/10.1016/j.scitotenv.2024.178256

Fargione, J., Haase, D. L., Burney, O. T., Kildisheva, O. A., Edge, G., Cook-Patton, S. C., Chapman, T., Rempel, A., Hurteau, M. D., Davis, K. T., Dobrowski, S., Enebak, S., De La Torre, R., Bhuta, A. A. R., Cubbage, F., Kittler, B., Zhang, D., & Guldin, R. W. (2021). Challenges to the reforestation pipeline in the United States. Frontiers in Forests and Global Change, 4, Article 629198. https://doi.org/10.3389/ffgc.2021.629198

Fesenmyer, K. A., Poor, E. E., Terasaki Hart, D. E., Veldman, J. W., Fleischman, F., Choksi, P., Archibald, S., Armani, M., Fagan, M. E., Fricke, E. C., Terrer, C., Hasler, N., Williams, C. A., Ellis, P. W., & Cook-Patton, S. C. (2025). Addressing critiques refines global estimates of reforestation potential for climate change mitigation. Nature Communications, 16(1), Article 4572. Link to source: https://doi.org/10.1038/s41467-025-59799-8

Fletcher, M.-S., Hamilton, R., Dressler, W., & Palmer, L. (2021). Indigenous knowledge and the shackles of wilderness. Proceedings of the National Academy of Sciences, 118(40), Article e2022218118. Link to source: https://doi.org/10.1073/pnas.2022218118

Friedlingstein, P., O’Sullivan, M., Jones, M. W., Andrew, R. M., Bakker, D. C. E., Hauck, J., Landschützer, P., Le Quéré, C., Luijkx, I. T., Peters, G. P., Peters, W., Pongratz, J., Schwingshackl, C., Sitch, S., Canadell, J. G., Ciais, P., Jackson, R. B., Alin, S. R., Anthoni, P., … Zheng, B. (2023). Global carbon budget 2023. Earth System Science Data, 15(12), 5301–5369. Link to source: https://doi.org/10.5194/essd-15-5301-2023

Gann, G. D., Walder, B., Gladstone, J., Manirajah, S. M., & Roe, S. (2022). Restoration project information sharing framework. Climate Focus and The Society for Ecological Restoration. Link to source: https://globalrestorationobservatory.com/restoration-project-information-sharing-framework/

Gardon, F. R., Toledo, R. M. de, Brentan, B. M., & Santos, R. F. dos. (2020). Rainfall interception and plant community in young forest restorations. Ecological Indicators, 109, Article 105779. Link to source: https://doi.org/10.1016/j.ecolind.2019.105779

Garnett, S. T., Burgess, N. D., Fa, J. E., Fernández-Llamazares, Á., Molnár, Z., Robinson, C. J., Watson, J. E. M., Zander, K. K., Austin, B., Brondizio, E. S., Collier, N. F., Duncan, T., Ellis, E., Geyle, H., Jackson, M. V., Jonas, H., Malmer, P., McGowan, B., Sivongxay, A., & Leiper, I. (2018). A spatial overview of the global importance of Indigenous lands for conservation. Nature Sustainability, 1(7), 369–374. Link to source: https://doi.org/10.1038/s41893-018-0100-6

Gibbs, D. A., Rose, M., Grassi, G., Melo, J., Rossi, S., Heinrich, V., & Harris, N. L. (2024). Revised and updated geospatial monitoring of twenty-first century forest carbon fluxes. Earth System Science Data Discussions, 17(3), 1217-1243. Link to source: https://doi.org/10.5194/essd-2024-397

Griscom, B. W., Adams, J., Ellis, P. W., Houghton, R. A., Lomax, G., Miteva, D. A., Schlesinger, W. H., Shoch, D., Siikamäki, J. V., Smith, P., Woodbury, P., Zganjar, C., Blackman, A., Campari, J., Conant, R. T., Delgado, C., Elias, P., Gopalakrishna, T., Hamsik, M. R., … Fargione, J. (2017). Natural climate solutions. Proceedings of the National Academy of Sciences, 114(44), 11645–11650. Link to source: https://doi.org/10.1073/pnas.1710465114

Hansen, M. C., Potapov, P. V., Moore, R., Hancher, M., Turubanova, S. A., Tyukavina, A., Thau, D., Stehman, S. V., Goetz, S. J., Loveland, T. R., Kommareddy, A., Egorov, A., Chini, L., Justice, C. O., & Townshend, J. R. G. (2013). High-resolution global maps of 21st-century forest cover change. Science, 342(6160), 850–853. Link to source: https://doi.org/10.1126/science.1244693

Harris, N. L., Gibbs, D. A., Baccini, A., Birdsey, R. A., de Bruin, S., Farina, M., Fatoyinbo, L., Hansen, M. C., Herold, M., Houghton, R. A., Potapov, P. V., Suarez, D. R., Roman-Cuesta, R. M., Saatchi, S. S., Slay, C. M., Turubanova, S. A., & Tyukavina, A. (2021). Global maps of twenty-first century forest carbon fluxes. Nature Climate Change, 11(3), 234–240. Link to source: https://doi.org/10.1038/s41558-020-00976-6

Hasler, N., Williams, C. A., Denney, V. C., Ellis, P. W., Shrestha, S., Terasaki Hart, D. E., Wolff, N. H., Yeo, S., Crowther, T. W., Werden, L. K., & Cook-Patton, S. C. (2024). Accounting for albedo change to identify climate-positive tree cover restoration. Nature Communications, 15(1), Article 2275. Link to source: https://doi.org/10.1038/s41467-024-46577-1

Herrera, D., Ellis, A., Fisher, B., Golden, C. D., Johnson, K., Mulligan, M., Pfaff, A., Treuer, T., & Ricketts, T. H. (2017). Upstream watershed condition predicts rural children’s health across 35 developing countries. Nature Communications, 8(1), Article 811. Link to source: https://doi.org/10.1038/s41467-017-00775-2

Hua, F., Bruijnzeel, L. A., Meli, P., Martin, P. A., Zhang, J., Nakagawa, S., Miao, X., Wang, W., McEvoy, C., Peña-Arancibia, J. L., Brancalion, P. H. S., Smith, P., Edwards, D. P., & Balmford, A. (2022). The biodiversity and ecosystem service contributions and trade-offs of forest restoration approaches. Science, 376(6595), 839–844. Link to source: https://doi.org/10.1126/science.abl4649

Kabeja, C., Li, R., Guo, J., Rwatangabo, D. E. R., Manyifika, M., Gao, Z., Wang, Y., & Zhang, Y. (2020). The impact of reforestation induced land cover change (1990–2017) on flood peak discharge using HEC-HMS hydrological model and satellite observations: A study in two mountain basins, China. Water, 12(5), Article 1347. Link to source: https://doi.org/10.3390/w12051347

Keesing, F., & Ostfeld, R. S. (2021). Impacts of biodiversity and biodiversity loss on zoonotic diseases. Proceedings of the National Academy of Sciences, 118(17), Article e2023540118. Link to source: https://doi.org/10.1073/pnas.2023540118

Kroeger, T., Erbaugh, J., Luo, Z., Brumberg, H., Eichhorst, W., Hegwood, M., LoPresti, A., Shyamsundar, P., Ellis, P., Oakes, L., Martin, D., Brancalion, P., Bourne, M., Jagadish, A., Austin, K., Kinzer, A., Sanjuán, M., McCullough, L., & Echavarria, M. (2025). Implementation constraints on natural climate solutions: A global literature review and survey. Research Square. Link to source: https://doi.org/10.21203/rs.3.rs-6890465/v1

Kübler, D., & Günter, S. (2024). Forest restoration for climate change mitigation and adaptation. In P. Katila, C. J. Pierce Colfer, W. de Jong, G. Galloway, P. Pacheco, & G. Winkel (Eds.), Restoring Forests and Trees for Sustainable Development: Policies, Practices, Impacts, and Ways Forward (p. 135-159). Oxford University Press. Link to source: https://doi.org/10.1093/9780197683958.003.0006

Kumar, C., Calmon, M., & Saint-Laurent, C. (Eds.) (with Begeladze, S.). (2015). Enhancing food security through forest landscape restoration: Lessons from Burkina Faso, Brazil, Guatemala, Viet Nam, Ghana, Ethiopia and Philippines. IUCN International Union for Conservation of Nature. Link to source: https://doi.org/10.2305/IUCN.CH.2015.FR.2.en

Lawrence, D., Coe, M., Walker, W., Verchot, L., & Vandecar, K. (2022). The unseen effects of deforestation: Biophysical effects on climate. Frontiers in Forests and Global Change, 5, Article 756115. Link to source: https://doi.org/10.3389/ffgc.2022.756115

Löfqvist, S., Kleinschroth, F., Bey, A., de Bremond, A., DeFries, R., Dong, J., Fleischman, F., Lele, S., Martin, D. A., Messerli, P., Meyfroidt, P., Pfeifer, M., Rakotonarivo, S. O., Ramankutty, N., Ramprasad, V., Rana, P., Rhemtulla, J. M., Ryan, C. M., Vieira, I. C. G., … Garrett, R. D. (2023). How social considerations improve the equity and effectiveness of ecosystem restoration. BioScience, 73(2), 134–148. Link to source: https://doi.org/10.1093/biosci/biac099

Mariappan, M., & Zumbado, A. R. (2024). Global Restoration Commitments and Pledges: 2024 Report. International Union for the Conservation of Nature.

Melo, F. P. L., Parry, L., Brancalion, P. H. S., Pinto, S. R. R., Freitas, J., Manhães, A. P., Meli, P., Ganade, G., & Chazdon, R. L. (2021). Adding forests to the water–energy–food nexus. Nature Sustainability, 4(2), 85–92. Link to source: https://doi.org/10.1038/s41893-020-00608-z

Nabuurs, G.-J., Mrabet, R., Hatab, A. A., Bustamante, M., Clark, H., Havlík, P., House, J. I., Mbow, C., Ninan, K. N., Popp, A., Roe, S., Sohngen, B., & Towprayoon, S. (2022). Agriculture, forestry and other land uses (AFOLU). In P. R. Shukla, J. Skea, R. Slade, A. Al Khourdajie, R. van Diemen, D. McCollum, M. Pathak, S. Some, P. Vyas, R. Fradera, M. Belkacemi, A. Hasija, G. Lisboa, S. Luz, & J. Malley (Eds.), Climate change 2022: Mitigation of climate change. Contribution of working group III to the sixth assessment report of the intergovernmental panel on climate change (pp. 747–860). Cambridge University Press. Link to source: https://doi.org/10.1017/9781009157926.009 

Naidoo, R., Gerkey, D., Hole, D., Pfaff, A., Ellis, A. M., Golden, C. D., Herrera, D., Johnson, K., Mulligan, M., Ricketts, T. H., & Fisher, B. (2019). Evaluating the impacts of protected areas on human well-being across the developing world. Science Advances, 5(4), Article eaav3006. Link to source: https://doi.org/10.1126/sciadv.aav3006

North, M. P., Stevens, J. T., Greene, D. F., Coppoletta, M., Knapp, E. E., Latimer, A. M., Restaino, C. M., Tompkins, R. E., Welch, K. R., York, R. A., Young, D. J. N., Axelson, J. N., Buckley, T. N., Estes, B. L., Hager, R. N., Long, J. W., Meyer, M. D., Ostoja, S. M., Safford, H. D., … Wyrsch, P. (2019). Tamm review: Reforestation for resilience in dry western U.S. forests. Forest Ecology and Management, 432, 209–224. Link to source: https://doi.org/10.1016/j.foreco.2018.09.007

Pan, Y., Birdsey, R. A., Phillips, O. L., Houghton, R. A., Fang, J., Kauppi, P. E., Keith, H., Kurz, W. A., Ito, A., Lewis, S. L., Nabuurs, G.-J., Shvidenko, A., Hashimoto, S., Lerink, B., Schepaschenko, D., Castanho, A., & Murdiyarso, D. (2024). The enduring world forest carbon sink. Nature, 631(8021), 563–569. Link to source: https://doi.org/10.1038/s41586-024-07602-x

Piffer, P. R., Rosa, M. R., Tambosi, L. R., Metzger, J. P., & Uriarte, M. (2022). Turnover rates of regenerated forests challenge restoration efforts in the Brazilian Atlantic forest. Environmental Research Letters, 17(4), Article 045009. Link to source: https://doi.org/10.1088/1748-9326/ac5ae1

Poorter, L., van der Sande, M. T., Thompson, J., Arets, E. J. M. M., Alarcón, A., Álvarez-Sánchez, J., Ascarrunz, N., Balvanera, P., Barajas-Guzmán, G., Boit, A., Bongers, F., Carvalho, F. A., Casanoves, F., Cornejo-Tenorio, G., Costa, F. R. C., de Castilho, C. V., Duivenvoorden, J. F., Dutrieux, L. P., Enquist, B. J., … Peña-Claros, M. (2015). Diversity enhances carbon storage in tropical forests. Global Ecology and Biogeography, 24(11), 1314–1328. Link to source: https://doi.org/10.1111/geb.12364

Reddington, C. L., Butt, E. W., Ridley, D. A., Artaxo, P., Morgan, W. T., Coe, H., & Spracklen, D. V. (2015). Air quality and human health improvements from reductions in deforestation-related fire in Brazil. Nature Geoscience, 8(10), 768–771. Link to source: https://doi.org/10.1038/ngeo2535

Reddington, C. L., Smith, C., Butt, E. W., Baker, J. C. A., Oliveira, B. F. A., Yamba, E. I., & Spracklen, D. V. (2025). Tropical deforestation is associated with considerable heat-related mortality. Nature Climate Change, 15(9), 992–999. Link to source: https://doi.org/10.1038/s41558-025-02411-0

Reytar, K., Ferreira-Ferreira, J., Alves, L., Oliveira Cordeiro, C. L. de, & Calmon, M. (2024, December 19). What can tree cover gain data tell us about restoration? Brazil case studies. Global Forest Watch. Link to source: https://www.globalforestwatch.org/blog/forest-insights/tree-cover-gain-restoration-brazil

Robinson, N., Drever, C. R., Gibbs, D. A., Lister, K., Esquivel-Muelbert, A., Heinrich, V., Ciais, P., Silva-Junior, C. H. L., Liu, Z., Pugh, T. A. M., Saatchi, S., Xu, Y., & Cook-Patton, S. C. (2025). Protect young secondary forests for optimum carbon removal. Nature Climate Change, 15, 793–800. Link to source: https://doi.org/10.1038/s41558-025-02355-5

Roe, S., Streck, C., Beach, R., Busch, J., Chapman, M., Daioglou, V., Deppermann, A., Doelman, J., Emmet-Booth, J., Engelmann, J., Fricko, O., Frischmann, C., Funk, J., Grassi, G., Griscom, B., Havlik, P., Hanssen, S., Humpenöder, F., Landholm, D., … Lawrence, D. (2021). Land-based measures to mitigate climate change: Potential and feasibility by country. Global Change Biology, 27(23), 6025–6058. Link to source: https://doi.org/10.1111/gcb.15873

Sankey, T., Belmonte, A., Massey, R., & Leonard, J. (2021). Regional-scale forest restoration effects on ecosystem resiliency to drought: A synthesis of vegetation and moisture trends on Google Earth Engine. Remote Sensing in Ecology and Conservation, 7(2), 259–274. Link to source: https://doi.org/10.1002/rse2.186

Schimetka, L. R., Ruggiero, P. G. C., Carvalho, R. L., Behagel, J., Metzger, J. P., Nascimento, N., Chaves, R. B., Brancalion, P. H. S., Rodrigues, R. R., & Krainovic, P. M. (2024). Costs and benefits of restoration are still poorly quantified: Evidence from a systematic literature review on the Brazilian Atlantic Forest. Restoration Ecology, 32(5), Article e14161. Link to source: https://doi.org/10.1111/rec.14161

Seymour, F., Wolosin, M., & Gray, E. (2022, October 23). Policies underestimate forests’ full effect on the climate. World Resources Institute. Link to source: https://www.wri.org/insights/how-forests-affect-climate

Sims, M. J., Stanimirova, R., Raichuk, A., Neumann, M., Richter, J., Follett, F., MacCarthy, J., Lister, K., Randle, C., Sloat, L., Esipova, E., Jupiter, J., Stanton, C., Morris, D., Melhart Slay, C., Purves, D., & Harris, N. (2025). Global drivers of forest loss at 1 km resolution. Environmental Research Letters, 20(7), Article 074027. Link to source: https://doi.org/10.1088/1748-9326/add606

Stanturf, J. A., Kleine, M., Mansourian, S., Parrotta, J., Madsen, P., Kant, P., Burns, J., & Bolte, A. (2019). Implementing forest landscape restoration under the Bonn Challenge: A systematic approach. Annals of Forest Science, 76(2), 1–21. Link to source: https://doi.org/10.1007/s13595-019-0833-z

Teo, H. C., Raghavan, S. V., He, X., Zeng, Z., Cheng, Y., Luo, X., Lechner, A. M., Ashfold, M. J., Lamba, A., Sreekar, R., Zheng, Q., Chen, A., & Koh, L. P. (2022). Large-scale reforestation can increase water yield and reduce drought risk for water-insecure regions in the Asia-Pacific. Global Change Biology, 28(21), 6385–6403. Link to source: https://doi.org/10.1111/gcb.16404

van der Sande, M. T., Poorter, L., Kooistra, L., Balvanera, P., Thonicke, K., Thompson, J., Arets, E. J. M. M., Garcia Alaniz, N., Jones, L., Mora, F., Mwampamba, T. H., Parr, T., & Peña-Claros, M. (2017). Biodiversity in species, traits, and structure determines carbon stocks and uptake in tropical forests. Biotropica, 49(5), 593–603. Link to source: https://doi.org/10.1111/btp.12453

Veldman, J. W., Overbeck, G. E., Negreiros, D., Mahy, G., Le Stradic, S., Fernandes, G. W., Durigan, G., Buisson, E., Putz, F. E., & Bond, W. J. (2015a). Tyranny of trees in grassy biomes. Science, 347(6221), 484–485. Link to source: https://doi.org/10.1126/science.347.6221.484-c

Veldman, J. W., Overbeck, G. E., Negreiros, D., Mahy, G., Le Stradic, S., Fernandes, G. W., Durigan, G., Buisson, E., Putz, F. E., & Bond, W. J. (2015b). Where Tree Planting and Forest Expansion are Bad for Biodiversity and Ecosystem Services. BioScience, 65(10), 1011–1018. Link to source: https://doi.org/10.1093/biosci/biv118

Verhoeven, D., Berkhout, E., Sewell, A., & van der Esch, S. (2024). The global cost of international commitments on land restoration. Land Degradation & Development, 35(16), 4864–4874. Link to source: https://doi.org/10.1002/ldr.5263

Walker, W. S., Gorelik, S. R., Cook-Patton, S. C., Baccini, A., Farina, M. K., Solvik, K. K., Ellis, P. W., Sanderman, J., Houghton, R. A., Leavitt, S. M., Schwalm, C. R., & Griscom, B. W. (2022). The global potential for increased storage of carbon on land. Proceedings of the National Academy of Sciences, 119(23), Article e2111312119. Link to source: https://doi.org/10.1073/pnas.2111312119

Walton, Z. L., Poudyal, N. C., Hepinstall-Cymerman, J., Johnson Gaither, C., & Boley, B. B. (2016). Exploring the role of forest resources in reducing community vulnerability to the heat effects of climate change. Forest Policy and Economics, 71, 94–102. Link to source: https://doi.org/10.1016/j.forpol.2015.09.001 

Wang, Y., Zhu, Y., Cook-Patton, S. C., Sun, W., Zhang, W., Ciais, P., Li, T., Smith, P., Yuan, W., Zhu, X., Canadell, J. G., Deng, X., Xu, Y., Xu, H., Yue, C., & Qin, Z. (2025). Land availability and policy commitments limit global climate mitigation from forestation. Science, 389(6763), 931–934. Link to source: https://doi.org/10.1126/science.adj6841

Williams, B. A., Beyer, H. L., Fagan, M. E., Chazdon, R. L., Schmoeller, M., Sprenkle-Hyppolite, S., Griscom, B. W., Watson, J. E. M., Tedesco, A. M., Gonzalez-Roglich, M., Daldegan, G. A., Bodin, B., Celentano, D., Wilson, S. J., Rhodes, J. R., Alexandre, N. S., Kim, D.-H., Bastos, D., & Crouzeilles, R. (2024). Global potential for natural regeneration in deforested tropical regions. Nature, 636(8041), 131–137. Link to source: https://doi.org/10.1038/s41586-024-08106-4

Zhang, Q., Barnes, M., Benson, M., Burakowski, E., Oishi, A. C., Ouimette, A., Sanders-DeMott, R., Stoy, P. C., Wenzel, M., Xiong, L., Yi, K., & Novick, K. A. (2020). Reforestation and surface cooling in temperate zones: Mechanisms and implications. Global Change Biology, 26(6), 3384–3401. Link to source: https://doi.org/10.1111/gcb.15069

Credits

Lead Fellow

  • Avery Driscoll, Ph.D.

Contributors

  • Ruthie Burrows, Ph.D.

  • James Gerber, Ph.D.

  • Daniel Jasper

  • Alex Sweeney

Internal Reviewers

  • James Gerber, Ph.D.

  • Megan Matthews, Ph.D.

  • Paul C. West, Ph.D.

Effectiveness

We estimated that forest restoration can sequester 5.86–18.19 t CO₂‑eq /ha/yr (Table 1), depending on the climate zone and type of intervention, as growing trees take up carbon through photosynthesis and store it in above- and below-ground biomass. Sequestration rates are highly variable globally; much of this variability is driven by climate, soil properties, forest type, and the type of restoration. 

For this solution, we used modeled carbon sequestration rates from natural regeneration to represent low-intensity restoration (Robinson et al., 2025) and modeled carbon sequestration rates from plantation forests to represent high-intensity carbon restoration, which we define as initiatives that include tree planting (Bukoski et al., 2022; Busch et al., 2024). We calculated carbon sequestration rates at the climate zone level (boreal, temperate, subtropical, and tropical) across the potential extent for each reforestation type.

Generally, high-intensity restoration has higher sequestration rates (median values 12.02–18.19 t CO₂‑eq /ha/yr) than low-intensity restoration (median values 5.86–17.06 t CO₂‑eq /ha/yr). Median effectiveness is also higher in tropical areas, where forest growth often continues year-round, than it is in other climate zones. These estimates reflect average sequestration rates over the first 30 years of forest growth. Carbon sequestration rates are also influenced by non-climatic factors. For example, higher tree species diversity is often associated with higher forest carbon storage and uptake (Bialic-Murphy et al., 2024; Poorter et al., 2015; van der Sande et al., 2017).

Table 1. Effectiveness of forest restoration at sequestering carbon.

Unit: t CO₂‑eq /ha/yr, 100-yr basis

Boreal 5.86
Temperate 11.49
Subtropical 11.53
Tropical 17.06

Unit: t CO₂‑eq /ha/yr, 100-yr basis

Boreal 14.57
Temperate 12.74
Subtropical 12.02
Tropical 18.19
Left Text Column Width
Cost

We estimated the median cost of low-intensity forest restoration at US$23/t CO₂‑eq (2023 US$) and the median cost of high-intensity forest restoration at US$83/t CO₂‑eq (Table 2). The value given in the dashboard above is the average of the low- and high-intensity cost estimates (US$53/t CO₂‑eq). 

On a per-hectare basis, the estimated cost of low-intensity restoration ranges from US$213/ha (25th percentile) to US$739/ha (75th percentile), with a median cost of US$304/ha. The estimated cost of high-intensity restoration ranges from US$811/ha (25th percentile) to US$1,914/ha (75th percentile), with a median of US$1,348/ha. We derived these estimates from compilations of global restoration project cost data by Verhoeven et al. (2024) and Busch et al. (2024), supplemented with estimates from five additional publications, representing a total of 50 unique projects.

Estimates of restoration costs remain very uncertain, as data are scarce, costs and revenues are highly variable across geographies and projects, and costs are nonlinear, tending to increase under higher adoption scenarios (Austin et al., 2020; Schimetka et al., 2024). Moreover, the success of a project at establishing new forests drives the cost per metric ton of CO₂‑eq , but such success rates are rarely reported alongside costs. Because of data limitations, we did not separate cost estimates into climate zones. 

Our estimates do not account for any new revenues associated with forest restoration, such as carbon credits or provisioning of timber and non-timber forest products (Adams et al. 2016; Ager et al., 2017; Busch et al., 2024). They also do not account for the economic value of ecosystem services, such as increased biodiversity, improved water quality, local cooling, and reduced soil erosion, which have been estimated to outweigh the costs of forest restoration (De Groot et al., 2013).

Table 2. Cost per unit of climate impact.

Unit: 2023 US$/t CO₂‑eq , 100-yr basis

Median 23

Unit: 2023 US$/t CO₂‑eq , 100-yr basis

Median 83
Left Text Column Width

Methods and Supporting Data

Learning Curve

We define a learning curve as falling costs with increased adoption. Reforestation has been practiced for many decades, and there is no evidence of a decrease in costs associated with increasing adoption. Therefore, there is no learning curve for this solution.

Speed of Action

Speed of action refers to how quickly a climate solution physically affects the atmosphere after it is deployed. This is different from speed of deployment, which is the pace at which solutions are adopted.

At Project Drawdown, we define the speed of action for each climate solution as emergency brake, gradual, or delayed.

Restore Forests is a DELAYED climate solution. It works more slowly than gradual or emergency brake solutions. Delayed solutions can be robust climate solutions, but it’s important to recognize that they may not realize their full potential for some time.

Caveats

Barriers to effective forest restoration include challenges around governance, financing, technical capacity (including seed and seedling supply), labor availability, and site-specific knowledge for initial restoration and long-term management (Brumberg et al., 2024; Chazdon et al., 2016; Chazdon et al., 2021; Fargione et al., 2021; Kroeger et al., 2025). Additional research and monitoring are needed to identify locally relevant restoration strategies, reduce barriers, and evaluate the success of restoration projects (Crouzeilles et al., 2019).

Forest restoration also faces challenges around permanence and additionality. Carbon stored in vegetation and soils through forest restoration can be lost to climatic and environmental stressors like wildfire, drought, heat waves, pests, or disease. Young, regenerating forests can be particularly susceptible to these types of stressors. Restored forests are also at risk of clearing (e.g., Piffer et al., 2022), so forest restoration must be coupled with long-term, effective protections against clearing. Additionality refers to the degree to which carbon uptake associated with forest restoration would have occurred in the absence of a project, policy, or incentive. Evaluating additionality is challenging in the context of natural forest regeneration, some of which simply arises from land abandonment without any intervention.

Current Adoption

Data on current adoption of forest restoration are very limited. While there are extensive compilations of restoration pledges, estimates of the actual area being restored are noncentralized, typically rely on self-reporting without validation, do not have global coverage, use inconsistent definitions, often include establishment of plantations and agroforestry, and rarely separate estimates by ecosystem. Satellite-based data on tree cover gain are occasionally used as a proxy for restoration, but these do not differentiate among restoration, establishment of timber plantations, regeneration in the absence of human intervention, and plantation regrowth after timber harvest (Reytar et al., 2024). Moreover, they can fail to capture actual restoration areas (Begliomini & Brancalion, 2024).

Due to these limitations, we do not provide an estimate of the global area currently under forest restoration. However, we did compile current restoration estimates from three databases: The Mongabay Reforestation Catalog, The Restoration Initiative, and The Restoration Barometer. These databases are subject to the limitations discussed above. Assuming that there is no overlap in projects reported across these databases, including projects with an agroforestry component, and including projects across all ecosystems, we found 40.6 Mha currently being restored. Under more conservative assumptions, including removing projects with an agroforestry component, removing projects from countries that are reported across multiple databases, and discounting estimates to account for restoration in other ecosystems, we estimated that 9.2 Mha are currently being restored. These estimates provide context, but should not be interpreted as representative of the global area under forest restoration.

Adoption Trend

Despite extensive data on restoration pledges, comprehensive data on the actual implementation of restoration efforts are very limited and not often temporally resolved. The available data are insufficient to calculate an adoption trend for this solution.

Adoption Ceiling

We estimated that there are 96.8 Mha available for forest restoration, with 19.4 Mha in boreal regions, 19.0 Mha in temperate regions, 3.5 Mha in the subtropics, and 54.8 Mha in the tropics (Table 3a–e). In this solution, we only included cleared areas that were previously forests in the calculation of the adoption ceiling. To calculate the adoption ceiling, we started with a recent, conservative map of potential forest restoration areas (Fesenmeyer et al., 2025), which we masked to exclude areas classified as other ecosystems in other solutions (peatlands, grasslands and savannahs, and coastal wetlands). We then used a map of the cost-effectiveness of natural regeneration versus plantation establishment (Busch et al., 2024) to remove areas more suitable for plantation establishment from this solution, and assigned them instead to the Deploy Biomass Crops on Degraded Land solution.

Estimates of the area available for forest restoration vary widely due to differing definitions, ranging from 195 Mha (Fesenmeyer et al., 2025) to 900 Mha (Bastin et al., 2019), for example. Using base maps of forest restoration potential from Griscom et al. (2017) and Walker et al. (2022) gave an estimated global adoption ceiling of 426–434 Mha, after applying the same data processing approach to exclude other ecosystems and plantations. 

Because of the constrained scope of this solution, we find a smaller adoption ceiling relative to other studies, which often include plantation establishment, agroforestry, densification of existing forests, afforestation on grasslands, restoration of forests on peat soils, reforestation of croplands, and other activities sometimes classified as forest restoration. We leveraged the map from Fesenmeyer et al. (2025) for the estimates reported in Table 3 because its scope aligns most closely with our relatively narrow definition of forest restoration, is one of the most recent studies, includes a review of 89 other forest restoration maps, and incorporates safeguards against conflicts between restoration and biodiversity loss, water scarcity, albedo effects, and land use. However, we note that this estimate is lower than other published estimates of potential forest restoration area and that differences across studies are driven by subjective judgments on land suitability for restoration.

Table 3. Adoption ceiling.

Unit: ha available for restoration

Estimate 19,400,000

Unit: ha available for restoration

Estimate 19,000,000

Unit: ha available for restoration

Estimate 3,500,000

Unit: ha available for restoration

Estimate 54,800,000

Unit: ha available for restoration

Estimate 96,800,000
Left Text Column Width
Achievable Adoption

We assumed an achievable range of 50–75% of the adoption ceiling, equal to 48.4–72.6 Mha of forest restoration (Table 4a–e). Much of the adoption potential is located in the tropics, which we estimated to contain 27.4 Mha under the Achievable – Low Scenario and 41.1 Mha under the Achievable – High Scenario. We estimated similar achievable ranges of forest restoration area in boreal and temperate regions (9.7–14.6 Mha and 9.5–14.3 Mha, respectively), and an additional 1.7–2.6 Mha in subtropical regions.

Additional research is needed to determine more realistic estimates of the achievable adoption range, particularly differentiated across different restoration activities. National commitments to restoration, as with studies on the potential restoration area, include many activities that are beyond the scope of this solution, such as plantation establishment, agroforestry, and densification. Because of the inconsistency in definitions, we were unable to rely on restoration commitments to quantify the adoption achievable range. For context, the Global Restoration Commitments database (Mariappan & Zumbado, 2024) reports that, under the Rio Conventions, countries have committed to increasing forestland by 122 Mha, with an additional 154 Mha of commitments to restoring or improving forestland. Similarly, 210.1 Mha of land have been pledged for restoration across all ecosystems under the Bonn Challenge (Mariappan & Zumbado, 2024).

Table 4. Range of achievable adoption levels.

Unit: ha

Current adoption NA
Achievable – low 9,700,000
Achievable – high 14,600,000
Adoption ceiling 19,400,000

Unit: ha

Current adoption NA
Achievable – low 9,500,000
Achievable – high 14,300,000
Adoption ceiling 19,000,000

Unit: ha

Current adoption NA
Achievable – low 1,700,000
Achievable – high 2,600,000
Adoption ceiling 3,500,000

Unit: ha

Current adoption NA
Achievable – low 27,400,000
Achievable – high 41,100,000
Adoption ceiling 54,800,000

Unit: ha

Current adoption NA
Achievable – low 48,400,000
Achievable – high 72,600,000
Adoption ceiling 96,800,000
Left Text Column Width

We estimated that forest restoration could sequester 0.718 Gt CO₂‑eq/yr at the low-achievable adoption scenario, 1.077 Gt CO₂‑eq/yr at the high-achievable adoption scenario, and 1.437 Gt CO₂‑eq/yr at the adoption ceiling (Table 5a–e). Nearly 70% of the total climate impacts under these scenarios occur in tropical regions, where much of the current investment in restoration is focused.

Our climate impact estimates are lower than existing literature estimates due to our more constrained definition of this solution. Existing estimates also vary widely. For example, Cook-Patton et al. (2020) estimated that fully implemented national forest restoration commitments as of 2020 would take up 5.9 Gt CO₂‑eq/yr, while the Intergovernmental Panel on Climate Change (IPCC) reported an economically feasible mitigation potential of 1.6 Gt CO₂‑eq/yr (Nabuurs et al., 2022), and Griscom et al. (2017) reported a technical mitigation potential of 10.1 Gt CO₂‑eq/yr. Recently, Wang et al. (2025) estimated an upper-end mitigation potential of 5.85 Gt CO₂‑eq/yr (including afforestation and plantation establishment), with current commitments across all of these activities projected to take up 1.8 Gt CO₂‑eq/yr. Discrepancies between estimates are driven by the area considered suitable for restoration, types of restoration activities considered and their associated carbon uptake rates, and inclusion of cost constraints. Each of these individual estimates is also associated with substantial uncertainty, and further work is needed to standardize definitions of forest restoration and constrain the range of impact estimates.

Table 5. Climate impact at different levels of adoption.

Unit: Gt CO₂‑eq/yr, 100-year basis

Current adoption NA
Achievable – low 0.099
Achievable – high 0.149
Adoption ceiling 0.198

Unit: Gt CO₂‑eq/yr, 100-year basis

Current adoption NA
Achievable – low 0.115
Achievable – high 0.173
Adoption ceiling 0.230

Unit: Gt CO₂‑eq/yr, 100-year basis

Current adoption NA
Achievable – low 0.020
Achievable – high 0.031
Adoption ceiling 0.041

Unit: Gt CO₂‑eq/yr, 100-year basis

Current adoption NA
Achievable – low 0.483
Achievable – high 0.725
Adoption ceiling 0.966

Unit: Gt CO₂‑eq/yr, 100-year basis

Current adoption NA
Achievable – low 0.718
Achievable – high 1.077
Adoption ceiling 1.437
Left Text Column Width
Additional Benefits

Heat Stress

Forests help regulate local climate by reducing temperature extremes (Lawrence et al., 2022; Walton et al., 2016). Zhang et al. (2020) found the land surfaces of restored forests were 1–2 °C cooler than grasslands.

Extreme Weather Events

Forest restoration can improve biodiversity and health of the ecosystem, leading to more ecological resilience (DeGroot et al., 2013; Hua et al., 2022). Restored forests can intercept rainfall and attenuate flood risk during extreme rainfall events (Kabeja et al., 2020; Gardon et al., 2020). In some climates, certain reforestation methods could increase ecosystem resilience to wildfires (North et al., 2019).

Floods

For a description of the flood benefits, please refer to the “Extreme Weather Events” subsection. 

Droughts

Forest restoration may increase or decrease the ecosystem’s resilience to drought, depending on changes in factors such as evapotranspiration, precipitation, and water storage in vegetation (Andres et al., 2022; Sankey et al., 2020; Teo et al., 2022). For example, Teo et al. (2022) found that reforestation of degraded lands reduced the probability of experiencing extremely dry conditions in water-insecure regions of East Asia.

Income and Work

Forest restoration creates both temporary and permanent job opportunities, especially in rural areas (DeGroot et al., 2013). A study in Brazil found that restoration can generate about 0.42 jobs per hectare of forest undergoing restoration (Brancalion et al., 2022). Restoration of forests may also improve livelihoods and income opportunities based on the ecosystem services the forest provides. While these benefits vary substantially with household and community characteristics, in general, they include income diversification and the availability of food and fiber from forests (Adams et al., 2016). For example, in Burkina Faso, smallholders who restored lands through assisted regeneration diversified their income by harvesting resources such as fodder for livestock and small wildlife (Kumar et al., 2015). 

Food Security

Forests provide income and livelihoods for subsistence households and individuals (de Souza et al., 2016; Herrera et al., 2017; Naidoo et al., 2019). Forest restoration may improve food security for some households by improving incomes and livelihoods.

Health

Reforestation may promote the health of nearby communities. Herrera et al. (2017) found that in rural areas of low- and middle-income countries, household members living downstream of higher tree cover had a lower probability of diarrheal disease. Biodiverse forests are linked to a reduced risk of animal-to-human infections because zoonotic hosts tend to be less abundant in less disturbed ecosystems (Keesing & Ostfeld, 2021; Reddington et al., 2015).

Equality

Indigenous peoples have a long history of caring for and shaping landscapes that are rich with biodiversity (Fletcher et al., 2021), and restoring the health and function of forests is essential for protecting indigenous cultural values and practices. Indigenous communities provide vital ecological functions for preserving landscape health, such as seed dispersal and predation (Bliege Bird & Nimmo, 2018). Indigenous peoples also have spiritual and cultural ties to their lands (Garnett et al., 2018). Restoration must be implemented using an equity-centered approach that reduces power imbalances between stakeholders, ensures people are not displaced, and involves local actors (Löfqvist et al., 2023).

Nature Protection

Forests are home to a wide range of species and habitats and are essential for safeguarding biodiversity. Reforestation of native forests increases the biodiversity of an ecosystem relative to its previous cleared state (Brancalion et al., 2025; Hua et al., 2022). While many factors, such as the restoration method, time since restoration, and biophysical conditions, can impact restoration, studies of reforestation report increases in biodiversity and more species abundance after restoration, though the biodiversity typically remains below that of intact forests (Crouzeilles et al., 2016; Hua et al., 2022).

Water Quality

The impacts of reforestation on water quality vary based on factors such as geography and time since undergoing restoration (Dib et al., 2023). In general, forests act as natural water filters, maintaining and improving water quality (Dib et al., 2023; Melo et al., 2021). Restoration of forests is associated with improved water quality in streams compared with their previously degraded state (dos Reis Oliveira et al., 2025).

Risks

Forest restoration initiatives that are not responsive to local socioeconomic conditions risk displacing community land access and compromising local livelihoods. Effective forest restoration activities can be highly diverse, but must be targeted towards local environmental, sociopolitical, and economic conditions (Stanturf et al., 2019). 

If forest restoration encroaches on agricultural lands, it can trigger clearing of forests elsewhere to replace lost agricultural production. 

Planting trees in areas where they do not naturally occur, such as in grasslands and savannas, can alter hydrologic cycles and harm biodiversity (Veldman et al., 2015a; Veldman et al., 2015b). The estimates of potential forest restoration area that we use in this analysis are constrained to minimize these risks by including only land that was once forested and not allowing for forest restoration on croplands or in urban areas.

Interactions with Other Solutions

Reinforcing

Forest restoration can improve the health and function of adjacent ecosystems that are being protected or restored.

Competing

These solutions are all suitable to implement on degraded land, and thus are in competition for the available degraded land.

Dashboard

Solution Basics

ha under restoration

t CO₂-eq (100-yr)/unit/yr
09.4410.21median
units
Current Not Determined 09.7×10⁶1.46×10⁷
Achievable (Low to High)

Climate Impact

Gt CO₂-eq (100-yr)/yr
Current Not Determined 0.0990.149
US$ per t CO₂-eq
53
Delayed

CO₂

Solution Basics

ha under restoration

t CO₂-eq (100-yr)/unit/yr
010.1612.11median
units
Current Not Determined 09.5×10⁶1.43×10⁷
Achievable (Low to High)

Climate Impact

Gt CO₂-eq (100-yr)/yr
Current Not Determined 0.1150.173
US$ per t CO₂-eq
53
Delayed

CO₂

Solution Basics

ha under restoration

t CO₂-eq (100-yr)/unit/yr
09.6811.78median
units
Current Not Determined 01.7×10⁶2.6×10⁶
Achievable (Low to High)

Climate Impact

Gt CO₂-eq (100-yr)/yr
Current Not Determined 0.0210.031
US$ per t CO₂-eq
53
Delayed

CO₂

Solution Basics

ha under restoration

t CO₂-eq (100-yr)/unit/yr
014.6717.63median
units
Current Not Determined 02.74×10⁷4.11×10⁷
Achievable (Low to High)

Climate Impact

Gt CO₂-eq (100-yr)/yr
Current Not Determined 0.4830.725
US$ per t CO₂-eq
53
Delayed

CO₂

Trade-offs

Forest restoration can divert resources from other climate solutions, including protecting intact forests. Humans clear approximately 0.4% of forests annually (Curtis et al., 2018; Hansen et al., 2013; Sims et al., 2025), and halting further deforestation is an urgent priority with huge benefits for the climate, biodiversity, and other ecosystem services (see Protect Forests). While restoration provides carbon sequestration over a period of decades, preventing deforestation reduces emissions immediately and is typically more cost-effective. Restoration should therefore complement, rather than compete with, efforts to reduce deforestation.

Forest restoration can also decrease the albedo, or reflectivity, of Earth’s surface. This can increase temperatures as more of the sun’s energy is absorbed and reradiated as thermal energy. Albedo effects are most pronounced in boreal and dryland regions, where they reduce the net climate benefits of forest restoration (Hasler et al., 2024).

t CO2-eq/ha/yr
025

CO2 sequestration potential from low-intensity forest restoration on suitable lands

Regrowth of deforested areas can sequester carbon in biomass. Here we show potential annual carbon sequestration by natural regrowth in areas where at least 5% of the landscape is deforested and where forest restoration would not adversely impact food production or existing communities. Green shaded areas indicate locations where this solution is effective; zoom in for details.

Fesenmyer, K. A., Poor, E. E., Terasaki Hart, D. E., Veldman, J. W., Fleischman, F., Choksi, P., Archibald, S., Armani, M., Fagan, M. E., Fricke, E. C., Terrer, C., Hasler, N., Williams, C. A., Ellis, P. W., & Cook-Patton, S. C. (2025). Addressing critiques refines global estimates of reforestation potential for climate change mitigation. Nature Communications, 16(1), Article 4572. Link to source: https://doi.org/10.1038/s41467-025-59799-8 

Global Forest Watch (2023). Global peatlands [Data set]. Retrieved December 6, 2024, from Link to source: https://data.globalforestwatch.org/datasets/gfw::global-peatlands/about 

Robinson, N., Drever, C. R., Gibbs, D. A., Lister, K., Esquivel-Muelbert, A., Heinrich, V., Ciais, P., Silva-Junior, C. H. L., Liu, Z., Pugh, T. A. M., Saatchi, S., Xu, Y., & Cook-Patton, S. C. (2025). Protect young secondary forests for optimum carbon removal. Nature Climate Change, 15, 793–800. Link to source: https://doi.org/10.1038/s41558-025-02355-5 

Spawn, S. A., Sullivan, C.C., Lark, T.J., & Gibbs, H.K. (2020). Harmonized global maps of above and belowground biomass carbon density in the year 2010. Scientific Data, 7, 112 Link to source: https://doi.org/10.1038/s41597-020-0444-4 

UNEP-WCMC (2025). Ocean+ habitats (version 1.3) [Data set]. Retrieved November 2024, from habitats.oceanplus.org

t CO2-eq/ha/yr
025

CO2 sequestration potential from low-intensity forest restoration on suitable lands

Regrowth of deforested areas can sequester carbon in biomass. Here we show potential annual carbon sequestration by natural regrowth in areas where at least 5% of the landscape is deforested and where forest restoration would not adversely impact food production or existing communities. Green shaded areas indicate locations where this solution is effective; zoom in for details.

Fesenmyer, K. A., Poor, E. E., Terasaki Hart, D. E., Veldman, J. W., Fleischman, F., Choksi, P., Archibald, S., Armani, M., Fagan, M. E., Fricke, E. C., Terrer, C., Hasler, N., Williams, C. A., Ellis, P. W., & Cook-Patton, S. C. (2025). Addressing critiques refines global estimates of reforestation potential for climate change mitigation. Nature Communications, 16(1), Article 4572. Link to source: https://doi.org/10.1038/s41467-025-59799-8 

Global Forest Watch (2023). Global peatlands [Data set]. Retrieved December 6, 2024, from Link to source: https://data.globalforestwatch.org/datasets/gfw::global-peatlands/about 

Robinson, N., Drever, C. R., Gibbs, D. A., Lister, K., Esquivel-Muelbert, A., Heinrich, V., Ciais, P., Silva-Junior, C. H. L., Liu, Z., Pugh, T. A. M., Saatchi, S., Xu, Y., & Cook-Patton, S. C. (2025). Protect young secondary forests for optimum carbon removal. Nature Climate Change, 15, 793–800. Link to source: https://doi.org/10.1038/s41558-025-02355-5 

Spawn, S. A., Sullivan, C.C., Lark, T.J., & Gibbs, H.K. (2020). Harmonized global maps of above and belowground biomass carbon density in the year 2010. Scientific Data, 7, 112 Link to source: https://doi.org/10.1038/s41597-020-0444-4 

UNEP-WCMC (2025). Ocean+ habitats (version 1.3) [Data set]. Retrieved November 2024, from habitats.oceanplus.org

Maps Introduction

Tropical regions have particularly large potential for forest restoration. Regrowing forests tend to have higher rates of carbon uptake in the tropics, particularly in humid areas, than in regions where shorter growing seasons and water limitations can constrain growth (e.g., Cook-Patton et al., 2020, Bernal et al., 2018). Our estimates of effectiveness suggest that carbon uptake rates in the tropics are almost 20% higher than those in temperate and subtropical regions. 

There are also large areas of recently deforested land in the tropics that are suitable for restoration. Recently deforested lands tend to have larger seed stocks in the soil and may be in proximity to intact forest patches, conditions that can improve the success of low-intensity restoration efforts (Chazon et al., 2016). Using three existing maps of potential forest restoration extent, our estimates suggest that ~43% of the adoption ceiling for forest restoration is located in tropical regions. 

Temperate regions, which have historically experienced widespread and severe deforestation, have the second-most area available for forest restoration. Some deforested areas have already been returned to forest cover, and some have been converted to permanent cropland or urban development, land-cover classes that are excluded from this analysis because they are typically not considered suitable for restoration in large-scale studies (Fesenmeyer et al., 2025). Temperate regions contain an additional ~28% of the area suitable for forest restoration.

Locally, forest restoration efforts that are targeted towards expanding and improving connectivity of existing forests may provide the largest carbon benefits by reducing edge effects (Chaplin-Kramer et al., 2015). Forest connectivity and patch size are also important predictors of the benefits for biodiversity and other ecosystem services (Beltrão et al., 2024; Di Sacco et al., 2020). Additionally, areas close to existing forests are often more suitable for natural regeneration, which can be cheaper and more efficient to implement than tree planting (Busch et al., 2024; Di Sacco et al., 2020; Williams et al., 2024).

In addition to sequestering carbon, forest restoration can influence the climate by changing albedo, or the reflectivity of Earth’s surface. In places where increasing tree cover makes the surface less reflective, the resultant biophysical warming can offset the climate benefits of carbon sequestration (Betts, 2000; Hasler et al., 2024). These effects tend to be particularly large in drylands, which have low native vegetation cover, and boreal regions, which have persistent snow cover. Therefore, some studies omit boreal regions from their estimates of potential forest restoration (Griscom et al., 2017).

Action Word
Restore
Solution Title
Forests
Classification
Highly Recommended

Lawmakers and Policymakers

  • Set achievable targets and pledges for forest restoration with clear effectiveness goals; regularly measure and report on restoration progress, area under restoration, challenges, and related data points.
  • Help develop definitions at the international level for forest restoration and degradation along with frameworks for measurement and monitoring; design indicators to capture long-term impacts, including metrics to capture social and biodiversity impacts.
  • Ensure public procurement uses deforestation-free products and sustainable products from reforested areas.
  • Create strong regulatory frameworks with clear definitions for active and passive restoration and/or related terms such as reforestation, regeneration, improving forest functionality, and increasing forest cover; ensure the framework is gender responsive and seeks to include women throughout the restoration process.
  • Coordinate forest protection and restoration policies horizontally (e.g., across agencies) and vertically (e.g., across subnational, national, and international efforts); seek to align social and environmental safeguards with protection and reforestation policies and goals.
  • Develop regional and transboundary coordination mechanisms for protection and restoring forests, especially, when working across international borders; consider using coordination methods from adjacent issue areas such as water management and/or working closely with existing coordination bodies for relevant watersheds.
  • Prioritize forest protection first and restoring forests second; ensure areas under restoration are classified as protected lands.
  • Create financial incentives for both active and passive restoration techniques, such as direct payments, payment for ecosystem services (PES), property tax breaks, rebates, subsidies, and cash prizes for meeting tree and/or vegetative growth metrics; ensure incentives allow for long timelines; provide similar incentives to reduce fertilizer use; ensure equitable access to incentives for low- and middle-income communities.
  • Provide financial incentives for businesses that support restoration by developing sustainable products.
  • Create disincentives by taxing or fining land clearance, deforestation, poor land management, and agricultural pollution.
  • Remove harmful agriculture and logging subsidies, particularly those that incentivize livestock, biofuels, land encroachment, and overuse of fertilizers.
  • Seek to designate lands for reforestation that are adjacent to or connect with already protected areas, intact lands, and/or watersheds.
  • Delegate the authority to allocate direct payments for fiscal incentives to local governments.
  • Use tax revenues from extractive industries to pay for restoration.
  • Use taxes from beneficiaries of forest services to pay for nearby restoration (e.g., use taxes from downstream users to improve practices upstream); before instituting such a tax regime, consult with stakeholders, clearly define tax arrangements, and put into place strict enforcement measures.
  • Create an ongoing, equity-centered community engagement process; ensure local communities help shape local projects and receive benefits.
  • Strengthen land and tree tenure rights; grant Indigenous communities’ full property rights and autonomy.
  • Ensure projects operating in or with Indigenous communities only do so under free, prior, and informed consent (FPIC); codify FPIC into legal systems.
  • Ensure regulations allow and encourage a variety of legal models for reforestation efforts, such as cooperatives.
  • Prioritize reducing food loss and waste and improving diets.
  • Invest in R&D to identify best practices, where reforestation is viable, and how to improve the local enabling environment(s).
  • When possible, use social science research to determine the best interventions, incentives, and community engagement models before beginning restoration projects.
  • Create programs to monitor for activity and market leakage from reforestation sites; adjust enforcement and policies to reduce leakage, if necessary.
  • Foster national pride for the natural landscape and reforestation efforts through communication campaigns.
  • Work with public universities and other educational institutions to develop degree and certification programs in forest restoration; encourage them to offer subspecialities, such as protected lands governance, management, policy, and finance.
  • Create educational programs that work with schools, universities, NGOs, and the general public to inform communities how to participate in restoration efforts, benefits, and opportunities; expand extension services to develop local capacity in forest restoration, especially in community-led monitoring and evaluation; establish knowledge-sharing initiatives with Indigenous peoples.
  • Join, create, or participate in public-private partnerships dedicated to mobilizing financing, restoration activities, knowledge transfers, general education, and other relevant areas.
  • Join, support, or create certification schemes that verify restoration activity and sustainable use of forest products.

Further information:

Practitioners

  • Set achievable targets and pledges for forest restoration with clear effectiveness goals.
  • Help develop regulatory frameworks with clear definitions for active and passive restoration and/or related terms such as reforestation, regeneration, improving forest functionality, and increasing forest cover; ensure the framework is gender responsive and seeks to include women throughout the restoration process.
  • Help develop definitions at the international level for forest restoration and degradation along with frameworks for measurement and monitoring; design indicators to capture long term impacts, including metrics to capture social and biodiversity impacts.
  • Help develop or advocate for regional and transboundary coordination mechanisms for restoring forests, especially, when working across international borders; consider using coordination methods from adjacent issue areas such as water management and/or working closely with existing coordination bodies for relevant watersheds.
  • Offer or take advantage of financial incentives such as direct payments or PES; if necessary, advocate for public incentives for both active and passive restoration, such as property tax breaks, rebates, subsidies, and cash prizes for meeting tree and/or vegetative growth metrics; help ensure incentives allow for long timelines; help ensure equitable access to incentives for low- and middle-income communities.
  • Seek to designate lands for reforestation that are adjacent to or connect with already protected areas, intact lands, and/or watersheds.
  • Create an ongoing, equity-centered community engagement process; ensure local communities help shape local projects and receive benefits.
  • Advocate for strong land and tree tenure rights; support Indigenous property rights and autonomy.
  • Ensure projects operating in or with Indigenous communities only do so under FPIC; help codify FPICinto legal systems.
  • Help create high-integrity carbon markets with long durations; use dynamic baselines for more accurate additionality assessments.
  • Create programs to monitor for activity and market leakage from reforestation sites; advocate for adjustments to enforcement and policies to reduce leakage, if necessary.
  • Develop markets for native species products and other sustainable uses of reforested lands.
  • Develop or support opportunities for ecotourism industries in locally restored forests.
  • Explore and use alternative legal models for reforestation, such as cooperatives.
  • Invest in R&D to identify best practices, where reforestation is viable, and how to improve the local enabling environment(s).
  • When possible, use social science research to determine the best interventions, incentives, and community engagement models before beginning restoration projects.
  • Help foster pride for natural landscape and reforestation efforts through communication campaigns.
  • Work with educational institutions to develop degree and certification programs in forest restoration; encourage them to offer subspecialities such as protected lands governance, management, policy, and finance.
  • Create educational programs that work with schools, NGOs, and the general public to inform communities how to participate in restoration efforts, benefits, and opportunities; advocate for expanded extension services to develop local capacity in forest restoration, especially in community-led monitoring and evaluation; establish knowledge-sharing initiatives with Indigenous peoples.
  • Join, create, or participate in public-private partnerships dedicated to mobilizing financing, restoration activities, knowledge transfers, general education, and other relevant areas.
  • Join, support, or create certification schemes that verify restoration activity and sustainable use of forest products.

Further information:

Business Leaders

  • Create deforestation-free supply chains, using data, information, and the latest technology to inform product sourcing.
  • Develop markets and supply chains for native species products; innovate other sustainable uses for resources from reforested lands.
  • Integrate deforestation-free business and investment policies and practices into your net-zero strategies.
  • Develop or support opportunities for ecotourism in restored forests.
  • Offer company grants to suppliers or others to improve resource management and support reforestation within your supply chain.
  • Offer incubator services for those restoring forests; offer pro bono business advice or general support for community restoration projects.
  • Enter into outgrower schemes to support smallholder farmers restoring their land; make long-term commitments to help stabilize projects.
  • Contribute to local restoration efforts; use an internal carbon fee or set aside a percentage of revenue to fund reforestation.
  • Only purchase carbon credits from high-integrity, verifiable carbon markets, and do not use them as replacements for reducing emissions.
  • Help create high-integrity carbon markets with long durations; use dynamic baselines for additionality assessments.
  • Help shift the public narrative around carbon markets as integrity increases to boost education, dialogue, and awareness.
  • Develop financial instruments to invest in reforestation, focusing on supporting Indigenous communities.
  • Amplify the voices of local communities and civil society to promote robust media coverage.
  • Offer employee professional development funds to be used for certification in reforestation or related fields such as curricular economies.
  • Create company volunteer opportunities such as annual-tree planting days; consider partnering with a relevant local non-profit.
  • Join, create, or participate in public-private partnerships dedicated to mobilizing financing, restoration activities, knowledge transfers, general education, and other relevant areas.
  • Join, support, or create certification schemes that verify restoration activity and sustainable use of forest products.

Further information:

Nonprofit Leaders

  • Use deforestation-free products and sustainable products from reforested areas.
  • Help manage restoration projects; consider using alternatives to corporate business structures such as cooperatives to facilitate management and legal structures.
  • Advocate for achievable public targets and pledges for forest restoration with clear effectiveness goals.
  • Help develop regulatory frameworks with clear definitions for active and passive restoration and/or related terms such as reforestation, regeneration, improving forest functionality, and increasing forest cover; ensure the framework is gender responsive and seeks to include women throughout the restoration process.
  • Help develop definitions at the international level for forest restoration and degradation along with frameworks for measurement and monitoring; design indicators to capture long-term impacts, including social and biodiversity impacts.
  • Help develop or advocate for regional and transboundary coordination mechanisms for restoring forests, especially, when working across international borders; consider using coordination methods from adjacent issue areas such as water management and/or working closely with existing coordination bodies for relevant watersheds.
  • Offer or take advantage of financial incentives such as direct payments or PES; if necessary, advocate for public incentives such as property tax breaks, rebates, subsidies, and cash prizes for meeting tree and/or vegetative growth metrics; help ensure incentives allow for long timelines; help ensure equitable access to incentives.
  • Seek to designate lands for reforestation that are adjacent to or connect with already protected areas, intact lands, and/or watersheds.
  • Advocate to remove harmful agriculture and logging subsidies, particularly those that incentivize livestock, biofuels, land encroachment, and overuse of fertilizers.
  • Call on governments and administrators of reforestation projects to use transparent, inclusive, and ongoing community engagement processes to co-design restoration projects; help solicit community feedback on area designations, finance, monitoring, and distribution of benefits; help ensure projects address relevant sociological, agricultural, and ecological considerations.
  • Advocate for strong land and tree tenure rights; support Indigenous property rights and autonomy.
  • Ensure projects operating in or with Indigenous communities only do so under FIPC; help codify FIPC into legal systems.
  • Help create high-integrity, long-lasting carbon markets; use dynamic baselines for more accurate additionality assessments.
  • Help monitor reforestation projects for success metrics such as vegetative growth, biodiversity, and water quality using high-resolution data and active remote sensing if possible.
  • Help translate reforestation materials into locally relevant languages.
  • Conduct cost-benefit analyses of potential local interventions to identify optimal strategies.
  • Develop markets and supply chains for native species products; innovate other sustainable uses for resources from reforested lands.
  • Develop or support opportunities for ecotourism in restored forests.
  • Facilitate investment in reforestation; create economic models to help maintain long-term financing; identify priorities for financing and help distribute incentives.
  • Help identify local sources of degradation and distribute findings to policymakers and the public; document and share best practices for reforestation.
  • Help establish outgrower schemes and negotiate favorable contracts for smallholder farmers.
  • Create programs to monitor for activity and market leakage from reforestation sites; advocate for adjustments to enforcement and policies to reduce leakage, if necessary.
  • Support high-integrity carbon markets, institutions, rules, and norms to cultivate demand for high-quality carbon credits.
  • Help shift the public narrative around carbon markets as integrity increases to boost education, dialogue, and awareness.
  • Amplify the voices of local communities and civil society to promote robust media coverage.
  • Invest in and support Indigenous and local communities’ capacity for legal protection, administration, and public relations.
  • When possible, use social science research to determine the best interventions, incentives, and community engagement models before beginning restoration projects.
  • Help foster national pride for the natural landscape and reforestation efforts through communication campaigns.
  • Work with educational institutions to develop degree and certification programs in forest restoration; encourage them to offer subspecialities such as protected lands governance, management, policy, and finance.
  • Create educational programs that work with schools, NGOs, and the general public to inform communities how to participate in restoration efforts, benefits, and opportunities; advocate for expanded extension services to develop local capacity in forest restoration, especially in community-led monitoring and evaluation; establish knowledge-sharing initiatives with Indigenous peoples.
  • Join, create, or participate in public-private partnerships dedicated to mobilizing financing, restoration activities, knowledge transfers, general education, and other relevant areas.
  • Join, support, or create certification schemes that verify restoration activity and sustainable use of forest products.

Further information:

Investors

  • Create deforestation-free investment portfolios.
  • Apply environmental and social standards to existing investments; divest from destructive industries and/or work with portfolio companies to improve practices.
  • Offer specific credit lines for reforestation projects with long-term timelines; offer low-interest loans, microfinancing, and specific financial products for medium-sized projects.
  • Own equity in sustainable projects that manage or support reforestation, especially during the early and middle phases.
  • Offer incubator services for those working on forest restoration projects; offer pro bono business advice or general support for community restoration projects.
  • Offer insurance and risk mitigation products for reforestation projects, especially, to farmers transitioning their lands.
  • Provide catalytic financing for businesses developing sustainable products made from native species, ecotourism, or other sustainable uses of reforested lands.
  • Invest in green bonds or high-integrity carbon credits for reforestation.
  • Support reforestation, other investors, and NGOs by sharing data, information, and investment frameworks that successfully avoid investments that drive deforestation.
  • Join, create, or participate in public-private partnerships dedicated to mobilizing financing, restoration activities, knowledge transfers, general education, and other relevant areas.

Further information:

Philanthropists and International Aid Agencies

  • Use deforestation-free products and sustainable products from reforested areas.
  • Offer grants or credit lines for reforestation projects with long-term timelines; offer low-interest loans, microfinancing options, and favorable financial products for medium-sized projects.
  • Own equity in sustainable projects that manage or support reforestation, especially during the early and middle phases.
  • Offer incubator services for those working on forest restoration; offer pro bono business advice or general support for community restoration projects.
  • Offer insurance and risk mitigation products for reforestation projects, especially, to farmers transitioning their lands.
  • Provide catalytic financing for businesses developing sustainable products made from native species, local ecotourism, or other sustainable uses of reforested lands.
  • Advocate for achievable public targets and pledges for forest restoration with clear effectiveness goals.
  • Help develop regulatory frameworks with clear definitions for active and passive restoration and/or related terms such as reforestation, regeneration, improving forest functionality, and increasing forest cover; ensure the framework is gender responsive and seeks to include women throughout the restoration process.
  • Help develop definitions at the international level for forest restoration and degradation along with frameworks for measurement and monitoring; design indicators to capture long-term impacts, including metrics to capture social and biodiversity impacts.
  • Help develop or advocate for regional and transboundary coordination mechanisms for restoring forests, especially, when working across international borders; consider using coordination methods from adjacent issue areas such as water management and/or working closely with existing coordination bodies for relevant watersheds.
  • Offer or take advantage of financial incentives such as PES; if necessary, advocate for public incentives for both active and passive restoration techniques such as property tax breaks, rebates, subsidies, and cash prizes for meeting tree and/or vegetative growth metrics; help ensure incentives allow for long timelines; help ensure equitable access to incentives.
  • Seek to designate lands for reforestation that are adjacent to or connect with already protected areas, intact lands, and/or watersheds.
  • Advocate to remove harmful agriculture and logging subsidies, particularly those that incentivize livestock, biofuels, land encroachment, and overuse of fertilizers.
  • Call on governments and administrators to use transparent, inclusive, and ongoing community engagement to co-design restoration projects; help solicit community feedback on area designations, finance, monitoring, and distribution of benefits; help ensure projects address relevant sociological, agricultural, and ecological considerations.
  • Advocate for strong land and tree tenure rights; support Indigenous property rights and autonomy.
  • Ensure projects operating in or with Indigenous communities only do so under FPIC; help codify FPIC into legal systems.
  • Help create high-integrity carbon markets with long durations; use dynamic baselines for more accurate additionality assessments.
  • Help monitor reforestation projects using high-resolution data and active remote sensing if possible.
  • Help translate reforestation materials into local relevant languages.
  • Conduct cost-benefit analysis of potential local interventions to identify optimal reforestation strategies.
  • Develop markets and supply chains for native species products; innovate other sustainable uses for resources from reforested lands.
  • Develop or support opportunities for ecotourism industries in locally restored forests.
  • Facilitate investment strategies among stakeholders; create economic models to help maintain long-term financing; identify priorities for financing and help to distribute both financial and nonfinancial incentives to stakeholders.
  • Help identify local sources of degradation and distribute findings to policymakers and the public; document and share best practices for reforestation.
  • Help establish outgrower schemes and negotiate contracts for smallholder farmers to ensure they receive the most favorable terms possible.
  • Create programs to monitor for activity and market leakage from reforestation sites; advocate for adjustments to enforcement and policies to reduce leakage if necessary.
  • Support high-integrity carbon markets, institutions, rules, and norms to cultivate the demand for high-quality carbon credits.
  • Help shift the public narrative around carbon markets as integrity increases to boost education, dialogue, and awareness.
  • Amplify the voices of local communities and civil society to promote robust media coverage.
  • Invest in and support Indigenous and local communities' capacity for legal protection, administration, and public relations.
  • When possible, use social science research to determine the best interventions, incentives, and community engagement models before beginning restoration projects.
  • Work with educational institutions to develop degree and certification programs in forest restoration; encourage them to offer subspecialities such as protected lands governance, management, policy, and finance.
  • Create educational programs that work with schools, NGOs, and the general public to inform communities of how to participate in restoration efforts, benefits, and opportunities; advocate for expanded extension services to develop local capacity in forest restoration, especially in community-led monitoring and evaluation; establish knowledge-sharing initiatives with Indigenous peoples.
  • Join, create, or participate in public-private partnerships dedicated to mobilizing financing, restoration activities, knowledge transfers, general education, and other relevant areas.
  • Join, support, or create certification schemes that verify restoration activity and sustainable use of forest products.

Further information:

Thought Leaders

  • If possible, conduct restoration projects on your property; work with local experts, share your experience, and document your progress.
  • Advocate for achievable public targets and pledges for forest restoration with clear effectiveness goals.
  • Help develop regulatory frameworks with clear definitions for active and passive restoration and/or related terms such as reforestation, regeneration, improving forest functionality, and increasing forest cover; ensure the framework is gender responsive and seeks to include women throughout the restoration process.
  • Help develop definitions at the international level for forest restoration and degradation along with frameworks for measurement and monitoring; design indicators to capture long-term impacts, including metrics to capture social and biodiversity impacts.
  • Help develop or advocate for regional and transboundary coordination mechanisms for restoring forests, especially, when working across international borders; consider using coordination methods from adjacent issue areas such as water management and/or working closely with existing coordination bodies for relevant watersheds.
  • Take advantage of and/or advocate for public incentives for both active and passive restoration techniques such as direct payments, PES, property tax breaks, rebates, subsidies, and cash prizes for meeting tree and/or vegetative growth metrics; help ensure incentives allow for long timelines; help ensure equitable access to incentives.
  • Seek to designate lands for reforestation that are adjacent to or connect with already protected areas, intact lands, and/or watersheds.
  • Advocate to remove harmful agriculture and logging subsidies, particularly those that incentivize livestock, biofuels, land encroachment, and overuse of fertilizers.
  • Call on governments and administrators to use transparent, inclusive, and ongoing community engagement processes to co-design restoration projects; help solicit community feedback on area designations, finance, monitoring, and distribution of benefits; help ensure projects address relevant sociological, agricultural, and ecological considerations.
  • Advocate for strong land and tree tenure rights; support Indigenous property rights and autonomy.
  • Ensure projects operating in or with Indigenous communities only do so under FPIC; help codify FPIC into legal systems.
  • Help create high-integrity carbon markets with long durations; use dynamic baselines for more accurate additionality assessments.
  • Help identify local sources of degradation and distribute findings to policymakers and the public; document and share best practices for reforestation.
  • Support high-integrity carbon markets, institutions, rules, and norms to cultivate the demand for high-quality carbon credits.
  • Help shift the public narrative around carbon markets as integrity increases to boost education, dialogue, and awareness.
  • Amplify the voices of local communities and civil society to promote robust media coverage.
  • Work with educational institutions to develop degree and certification programs in forest restoration; encourage them to offer subspecialities such as protected lands governance, management, policy, and finance.
  • Create educational programs that work with schools, NGOs, and the general public to inform communities of how to participate in restoration efforts, benefits, and opportunities; advocate for expanded extension services to develop local capacity in forest restoration, especially in community-led monitoring and evaluation; establish knowledge-sharing initiatives with Indigenous peoples.
  • Join, create, or participate in public-private partnerships dedicated to mobilizing financing, restoration activities, knowledge transfers, general education, and other relevant areas.
  • Join, support, or create certification schemes that verify restoration activity and sustainable use of forest products.

Further information:

Technologists and Researchers

  • Examine and compare a wide range of interventions, ideally in local sites, to inform reforestation.
  • Help document and examine local knowledge as it relates to reforestation; help integrate Indigenous and local knowledge into restoration science and technology.
  • Help develop local spatial models to identify sites suitable for restoration with low risk of being recleared.
  • Use or improve Artificial Intelligence models and satellite imagery to help develop early warning systems and predictive models for degraded forests and illegal deforestation.
  • Use AI and satellite data to monitor and evaluate restoration activities; map practices and identify locally relevant interventions.
  • Develop web-based platforms and applications to support large-scale forest restoration; include peer-reviewed studies that map risks and amounts of buffer pools available for each disturbance.
  • Research locally viable risk management strategies in restoration; study and identify social risks and related mitigation strategies.
  • Create a database to measure reforestation progress against global commitments.
  • Develop or improve techniques to monitor for activity and market leakage from reforestation sites.
  • Examine and compare a wide range of local incentive structures to identify optimal policies.
  • Conduct long-term documentation of socioeconomic and biodiversity outcomes for restoration projects; identify challenges and opportunities; distill best practices for a global audience.
  • Conduct social ground truthing for local restoration projects to gather data, test models, and develop potential interventions.
  • Conduct research on native species found in restored forests and potential uses for sustainable commercial development.
  • Evaluate the relationships among large-scale forest restoration, food security, and wood demand; develop recommendations for land and resource allocation among these activities.
  • Improve understanding of forest dynamics, including how they relate to cloud feedbacks, volatile organic compounds, aerosol effects, and black carbon.

Further information:

Communities, Households, and Individuals

  • If possible, restore forests on your property; work with local experts, share your experience, and document your progress.
  • Help establish and participate in local restoration efforts; volunteer with a local nonprofit or establish one if none exists.
  • If degraded forests are in your area and no action is being taken, speak to local officials, hand out fliers, or otherwise advocate for restoration.
  • Reduce and/or eliminate use of chemicals on your lawn and/or property; set up a sign that indicates your lawn is chemical-free.
  • Prioritizing reducing your household’s food waste and improving your diet to incorporate more plant-rich meals.
  • Have community conversations about local forests, agriculture, and lawn maintenance practices; seek to reduce harmful practices such as overuse of fertilizers and pesticides and to initiate restoration efforts; educate friends and neighbors about local degraded forests and potential solutions.
  • Contribute to local restoration efforts.
  • When traveling, look for opportunities to support reforestation projects and ecotourism.
  • Help document and develop knowledge-sharing opportunities for Indigenous and local knowledge.
  • Help identify local sources of degradation and distribute findings to policymakers and the public; document and share best practices for reforestation.
  • Try to purchase sustainable forest products that support local reforestation.
  • Take advantage of and/or advocate for public incentives for restoration techniques such as direct payments, PES, property tax breaks, rebates, subsidies, and cash prizes for meeting tree and/or vegetative growth metrics; help ensure incentives allow for long timelines; help ensure equitable access to incentives.
  • Seek to designate lands for reforestation that are adjacent to or connect with already protected areas, intact lands, and/or watersheds.
  • Advocate to remove harmful agriculture and logging subsidies, particularly those that incentivize livestock, biofuels, land encroachment, and overuse of fertilizers.
  • Call on governments and administrators to use transparent, inclusive, and ongoing community engagement processes to co-design restoration projects; help solicit community feedback on area designations, finance, monitoring, and distribution of benefits; help ensure projects address relevant sociological, agricultural, and ecological considerations.
  • Advocate for strong land and tree tenure rights; support Indigenous property rights and autonomy.
  • Ensure projects operating in or with Indigenous communities only do so under FPIC; help codify FPIC into legal systems.
  • Create educational programs that work with schools, NGOs, and the general public to inform communities how to participate in restoration efforts, benefits, and opportunities; advocate for expanded extension services to develop local capacity in forest restoration, especially in community-led monitoring and evaluation; establish knowledge-sharing initiatives with Indigenous peoples.
  • Join, create, or participate in public-private partnerships dedicated to mobilizing financing, restoration activities, knowledge transfers, general education, and other relevant areas.
  • Join, support, or create certification schemes that verify restoration activity and sustainable use of forest products.

Further information:

“Take Action” Sources

Evidence Base

Consensus of effectiveness in enhancing carbon removal: High

Many scientific studies have evaluated the potential for forest restoration, consistently reporting that forest restoration has potential to provide substantial carbon removal. The effectiveness of forest restoration in terms of carbon uptake per hectare is highly spatially variable, with over 100-fold variability in uptake rates globally (Cook-Patton et al., 2020). These uptake rates have been extensively modeled, though estimates vary with respect to restoration activity (e.g., natural regeneration or plantation establishment) and carbon pools included (e.g., above-ground biomass only, above- and below-ground biomass, or total biomass and soil carbon). For forests undergoing natural regeneration, estimates of effectiveness ranged from 1.0 t CO₂‑eq /ha/yr for biomass in boreal forests (Cook-Patton et al., 2020) to 18.8 t CO₂‑eq /ha/yr for biomass and soils in humid tropical forests in South America (Bernal et al., 2018).

Estimates of the potential climate impacts of forest restoration vary widely, with differences driven largely by variability in the estimates of land area available for forest restoration. The IPCC reported a global technical mitigation potential of 3.9 Gt CO₂‑eq/yr with an uncertainty range of 0.5–10.1 Gt CO₂‑eq/yr, and an economically feasible mitigation potential of 1.6 Gt CO₂‑eq/yr with an uncertainty range of 0.5–3.0 Gt CO₂‑eq/yr (Nabuurs et al., 2022). Cook-Patton et al. (2020) estimated a maximum mitigation potential of 8.91 Gt CO₂‑eq/yr and a mitigation potential of 5.87 Gt CO₂‑eq/yr under existing national commitments. Roe et al. (2021) estimated a technical mitigation potential of 8.47 Gt CO₂‑eq/yr and a cost-effective mitigation potential of 1.53 Gt CO₂‑eq/yr. Griscom et al. (2017) reported a technical mitigation potential of 10.1 Gt CO₂‑eq/yr, though the uncertainty estimates spanned 2.7–17.9 Gt CO₂‑eq/yr. Using a more conservative estimate of the area available for forest restoration than previous studies, Fesenmeyer et al. (2025) estimated that sequestration of 2.2 Gt CO₂‑eq/yr is feasible.

The quantitative results presented in this assessment synthesize findings from 16 global datasets supplemented by four national-scale studies. We recognize that geographic bias in the information underlying global data products creates bias and hope this work inspires research and data sharing on this topic in underrepresented regions.

Updated Date
Coming Soon Label
Coming Soon

Protect Forests

Image
Image
Fog sitting among trees of a dense forest canopy
Coming Soon
Off

Key Takeaways

  • Forests store a huge amount of carbon in vegetation and soils, much of which is released when trees are cut.
  • On average, more than 16 million ha of forest are cleared each year, producing 7 Gt CO₂‑eq of GHGs.
  • At a high achievable adoption level, protecting forests could prevent the release of 3.62 Gt CO₂‑eq/yr, making it one of the most powerful nature-based climate solutions available.
  • Protecting forests also has huge benefits for biodiversity, local cooling, water quality, human health, food provisioning, tourism income for local communities, and cultural and recreational value.
Summary

We define the Protect Forests solution as the long-term protection of tree-dominated ecosystems through establishment of protected areas (PAs), managed with the primary goal of conserving nature, and land tenure for Indigenous peoples. These protections reduce forest degradation, avoiding GHG emissions and ensuring continued carbon sequestration by healthy forests. This solution addresses protection of forests on mineral soils. The Protect Peatlands and Protect Coastal Wetlands solutions address protection of forested peatlands and mangrove forests, respectively, and the Restore Forests solution addresses restoring degraded forests.

Description for Social and Search
Protect Forests is a Highly Recommended climate solution. Forest protection ensures that intact forests stay standing, avoiding GHG emissions, maintaining their ability to absorb carbon, and providing numerous other environmental benefits.
Overview

Forests store carbon in biomass and soils and serve as carbon sinks, taking up an estimated 12.8 Gt CO₂‑eq/yr  (including mangroves and forested peatlands; Pan et al., 2024). Carbon stored in forests is released into the atmosphere through deforestation and degradation, which refer to forest clearing or reductions in ecosystem integrity from human influence (DellaSala et al., 2025). Humans cleared an average of 0.4% (16.3 Mha) of global forest area annually from 2001–2019 (excluding wildfire but including mangroves and forested peatlands; Hansen et al., 2013, updated 2024). This produced a gross flux of 7.4 Gt CO₂‑eq/yr (Harris et al., 2021), equivalent to ~14% of total global GHG emissions over that period (Dhakal et al., 2022). Different forest types store varying amounts of carbon and experience different rates of clearing; in this analysis, we individually evaluate forest protection in boreal, temperate, subtropical, and tropical regions. We included woodlands in our definition of forests because they are not differentiated in the satellite-based data used in this analysis.

We consider forests to be protected if they 1) are formally designated as protected areas (PAs) (UNEP-WCMC and IUCN, 2024), or 2) are mapped as Indigenous peoples’ lands in the global study by Garnett et al. (2018). The International Union for Conservation of Nature defines PAs as areas managed primarily for the long-term conservation of nature and ecosystem services. They are disaggregated into six levels of protection, ranging from strict wilderness preserves to sustainable-use areas that allow for some natural resource extraction, including logging. We included all levels of protection in this analysis, primarily because not all PAs have been classified into these categories. We rely on existing maps of Indigenous peoples’ lands but emphasize that much of their extent has not been fully mapped nor recognized for its conservation benefits (Garnett et al., 2018). Innovative and equity-driven strategies for forest protection that recognize the land rights, sovereignty, and stewardship of Indigenous peoples and local communities are critical for achieving just and effective forest protection globally (Dawson et al., 2024; Fa et al., 2020; FAO, 2024; Garnett et al., 2018; Tran et al., 2020; Zafra-Calvo et al., 2017).

Indigenous peoples’ lands and PAs reduce, but do not eliminate, forest clearing relative to unprotected areas (Baragwanath et al., 2020; Blackman & Viet 2018; Li et al., 2024; McNicol et al., 2023; Sze et al. 2022; Wolf et al., 2023; Wade et al., 2020). We rely on estimates of how effective PA are currently for this analysis but highlight that improving management to further reduce land use change within PAs is a critical component of forest protection (Jones et al., 2018; Meng et al., 2023; Vijay et al., 2018; Visconti et al., 2019; Watson et al., 2014).

Market-based strategies and other policies can complement legal protections by increasing the value of intact forests and reducing incentives for clearing (e.g., Garett et al., 2019; Golub et al., 2021; Heilmayr et al., 2020; Lambin et al., 2018; Levy et al., 2023; Macdonald et al., 2024; Marin et al., 2022; Villoria et al., 2022; West et al., 2023). The estimates in this report are based on legal protection alone because the effectiveness of market-based strategies is difficult to quantify, but strategies such as sustainable commodities programs, reducing or redirecting agricultural subsidies, and strategic infrastructure planning will be further discussed in a future update. 

References

Adams, V. M., Iacona, G. D., & Possingham, H. P. (2019). Weighing the benefits of expanding protected areas versus managing existing ones. Nature Sustainability, 2(5), 404–411. Link to source: https://doi.org/10.1038/s41893-019-0275-5

Anderegg, W. R. L., Trugman, A. T., Badgley, G., Anderson, C. M., Bartuska, A., Ciais, P., Cullenward, D., Field, C. B., Freeman, J., Goetz, S. J., Hicke, J. A., Huntzinger, D., Jackson, R. B., Nickerson, J., Pacala, S., & Randerson, J. T. (2020). Climate-driven risks to the climate mitigation potential of forests. Science, 368(6497), eaaz7005. Link to source: https://doi.org/10.1126/science.aaz7005

Arneth, A., Leadley, P., Claudet, J., Coll, M., Rondinini, C., Rounsevell, M. D. A., Shin, Y.-J., Alexander, P., & Fuchs, R. (2023). Making protected areas effective for biodiversity, climate and food. Global Change Biology, 29(14), 3883–3894. Link to source: https://doi.org/10.1111/gcb.16664

Baragwanath, K., & Bayi, E. (2020). Collective property rights reduce deforestation in the Brazilian Amazon. Proceedings of the National Academy of Sciences, 117(34), 20495–20502. Link to source: https://doi.org/10.1073/pnas.1917874117

Barnes, M. D., Glew, L., Wyborn, C., & Craigie, I. D. (2018). Prevent perverse outcomes from global protected area policy. Nature Ecology & Evolution, 2(5), 759–762. Link to source: https://doi.org/10.1038/s41559-018-0501-y

Bliege Bird, R., & Nimmo, D. (2018). Restore the lost ecological functions of people. Nature Ecology & Evolution, 2(7), 1050–1052. Link to source: https://doi.org/10.1038/s41559-018-0576-5

Blackman, A., & Veit, P. (2018). Titled Amazon Indigenous Communities Cut Forest Carbon Emissions. Ecological Economics, 153, 56–67. Link to source: https://doi.org/10.1016/j.ecolecon.2018.06.016

Brennan, A., Naidoo, R., Greenstreet, L., Mehrabi, Z., Ramankutty, N., & Kremen, C. (2022). Functional connectivity of the world’s protected areas. Science, 376(6597), 1101–1104. Link to source: https://doi.org/10.1126/science.abl8974

Brinck, K., Fischer, R., Groeneveld, J., Lehmann, S., Dantas De Paula, M., Pütz, S., Sexton, J. O., Song, D., & Huth, A. (2017). High resolution analysis of tropical forest fragmentation and its impact on the global carbon cycle. Nature Communications, 8(1), 14855. Link to source: https://doi.org/10.1038/ncomms14855

Bruner, A. G., Gullison, R. E., & Balmford, A. (2004). Financial Costs and Shortfalls of Managing and Expanding Protected-Area Systems in Developing Countries. BioScience, 54(12), 1119–1126. Link to source: https://doi.org/10.1641/0006-3568(2004)054[1119:FCASOM]2.0.CO;2

Buotte, P. C., Law, B. E., Ripple, W. J., & Berner, L. T. (2020). Carbon sequestration and biodiversity co-benefits of preserving forests in the western United States. Ecological Applications, 30(2), e02039. Link to source: https://doi.org/10.1002/eap.2039

Curtis, P. G., Slay, C. M., Harris, N. L., Tyukavina, A., & Hansen, M. C. (2018). Classifying drivers of global forest loss. Science, 361(6407), 1108–1111. Link to source: https://doi.org/10.1126/science.aau3445

Dawson, N. M., Coolsaet, B., Bhardwaj, A., Booker, F., Brown, D., Lliso, B., Loos, J., Martin, A., Oliva, M., Pascual, U., Sherpa, P., & Worsdell, T. (2024). Is it just conservation? A typology of Indigenous peoples’ and local communities’ roles in conserving biodiversity. One Earth, 7(6), 1007–1021. Link to source: https://doi.org/10.1016/j.oneear.2024.05.001

de Souza, S. E. X. F., Vidal, E., Chagas, G. de F., Elgar, A. T., & Brancalion, P. H. S. (2016). Ecological outcomes and livelihood benefits of community-managed agroforests and second growth forests in Southeast Brazil. Biotropica, 48(6), 868–881. Link to source: https://doi.org/10.1111/btp.12388

Delacote, P., Le Velly, G., & Simonet, G. (2022). Revisiting the location bias and additionality of REDD+ projects: The role of project proponents status and certification. Resource and Energy Economics, 67, 101277. Link to source: https://doi.org/10.1016/j.reseneeco.2021.101277

Delacote, P., Velly, G. L., & Simonet, G. (2024). Distinguishing potential and effective additionality of forest conservation interventions. Environment and Development Economics, 1–21. Link to source: https://doi.org/10.1017/S1355770X24000202

DellaSala, D. A., Mackey, B., Kormos, C. F., Young, V., Boan, J. J., Skene, J. L., Lindenmayer, D. B., Kun, Z., Selva, N., Malcolm, J. R., & Laurance, W. F. (2025). Measuring forest degradation via ecological-integrity indicators at multiple spatial scales. Biological Conservation, 302, 110939. Link to source: https://doi.org/10.1016/j.biocon.2024.110939

Dhakal, S., J.C. Minx, F.L. Toth, A. Abdel-Aziz, M.J. Figueroa Meza, K. Hubacek, I.G.C. Jonckheere, Yong-Gun Kim, G.F. Nemet, S. Pachauri, X.C. Tan, T. Wiedmann, 2022: Emissions Trends and Drivers. In IPCC, 2022: Climate Change 2022: Mitigation of Climate Change. Contribution of Working Group III to the Sixth Assessment Report of the Intergovernmental Panel on Climate Change [P.R. Shukla, J. Skea, R. Slade, A. Al Khourdajie, R. van Diemen, D. McCollum, M. Pathak, S. Some, P. Vyas, R. Fradera, M. Belkacemi, A. Hasija, G. Lisboa, S. Luz, J. Malley, (eds.)]. Cambridge University Press, Cambridge, UK and New York, NY, USA. Link to source: https://doi.org/10.1017/9781009157926.004

Dinerstein, E., Joshi, A. R., Hahn, N. R., Lee, A. T. L., Vynne, C., Burkart, K., Asner, G. P., Beckham, C., Ceballos, G., Cuthbert, R., Dirzo, R., Fankem, O., Hertel, S., Li, B. V., Mellin, H., Pharand-Deschênes, F., Olson, D., Pandav, B., Peres, C. A., … Zolli, A. (2024). Conservation Imperatives: Securing the last unprotected terrestrial sites harboring irreplaceable biodiversity. Frontiers in Science, 2. Link to source: https://doi.org/10.3389/fsci.2024.1349350

Dye, A. W., Houtman, R. M., Gao, P., Anderegg, W. R. L., Fettig, C. J., Hicke, J. A., Kim, J. B., Still, C. J., Young, K., & Riley, K. L. (2024). Carbon, climate, and natural disturbance: A review of mechanisms, challenges, and tools for understanding forest carbon stability in an uncertain future. Carbon Balance and Management, 19(1), 35. Link to source: https://doi.org/10.1186/s13021-024-00282-0

Ellison, D., N. Futter, M., & Bishop, K. (2012). On the forest cover–water yield debate: From demand- to supply-side thinking. Global Change Biology, 18(3), 806–820. Link to source: https://doi.org/10.1111/j.1365-2486.2011.02589.x

ESA CCI (2019). Copernicus Climate Change Service, Climate Data Store: Land cover classification gridded maps from 1992 to present derived from satellite observation. Copernicus Climate Change Service (C3S) Climate Data Store (CDS). Accessed November 2024. Link to source: https://doi.org/10.24381/cds.006f2c9a

Fa, J. E., Watson, J. E., Leiper, I., Potapov, P., Evans, T. D., Burgess, N. D., Molnár, Z., Fernández-Llamazares, Á., Duncan, T., Wang, S., Austin, B. J., Jonas, H., Robinson, C. J., Malmer, P., Zander, K. K., Jackson, M. V., Ellis, E., Brondizio, E. S., & Garnett, S. T. (2020). Importance of Indigenous Peoples’ lands for the conservation of Intact Forest Landscapes. Frontiers in Ecology and the Environment, 18(3), 135–140. Link to source: https://doi.org/10.1002/fee.2148

FAO. 2024. The State of the World’s Forests 2024 – Forest-sector innovations towards a more sustainable future. Rome. Link to source: https://doi.org/10.4060/cd1211en

Filoso, S., Bezerra, M. O., Weiss, K. C. B., & Palmer, M. A. (2017). Impacts of forest restoration on water yield: A systematic review. PLOS ONE, 12(8), e0183210. Link to source: https://doi.org/10.1371/journal.pone.0183210

Fletcher, M.-S., Hamilton, R., Dressler, W., & Palmer, L. (2021). Indigenous knowledge and the shackles of wilderness. Proceedings of the National Academy of Sciences, 118(40), e2022218118. Link to source: https://doi.org/10.1073/pnas.2022218118

Fuller, C., Ondei, S., Brook, B. W., & Buettel, J. C. (2020). Protected-area planning in the Brazilian Amazon should prioritize additionality and permanence, not leakage mitigation. Biological Conservation, 248, 108673. Link to source: https://doi.org/10.1016/j.biocon.2020.108673

Gallemore, C., Bowsher, A., Atheeque, A., Groff, E., & Furtado, J. (n.d.). The geography of avoided deforestation and sustainable forest management offsets: The enduring question of additionality. Climate Policy, 0(0), 1–17. Link to source: https://doi.org/10.1080/14693062.2024.2383418

Gallemore, C., Bowsher, A., Atheeque, A., Groff, E., & Furtado, J. (2023). The geography of avoided deforestation and sustainable forest management offsets: The enduring question of additionality. Climate Policy, 0(0), 1–17. Link to source: https://doi.org/10.1080/14693062.2024.2383418

Garnett, S. T., Burgess, N. D., Fa, J. E., Fernández-Llamazares, Á., Molnár, Z., Robinson, C. J., Watson, J. E. M., Zander, K. K., Austin, B., Brondizio, E. S., Collier, N. F., Duncan, T., Ellis, E., Geyle, H., Jackson, M. V., Jonas, H., Malmer, P., McGowan, B., Sivongxay, A., & Leiper, I. (2018). A spatial overview of the global importance of Indigenous lands for conservation. Nature Sustainability, 1(7), 369–374. Link to source: https://doi.org/10.1038/s41893-018-0100-6

Garrett, R. D., Levy, S., Carlson, K. M., Gardner, T. A., Godar, J., Clapp, J., Dauvergne, P., Heilmayr, R., le Polain de Waroux, Y., Ayre, B., Barr, R., Døvre, B., Gibbs, H. K., Hall, S., Lake, S., Milder, J. C., Rausch, L. L., Rivero, R., Rueda, X., … Villoria, N. (2019). Criteria for effective zero-deforestation commitments. Global Environmental Change, 54, 135–147. Link to source: https://doi.org/10.1016/j.gloenvcha.2018.11.003

Gibbs, H. K., Ruesch, A. S., Achard, F., Clayton, M. K., Holmgren, P., Ramankutty, N., & Foley, J. A. (2010). Tropical forests were the primary sources of new agricultural land in the 1980s and 1990s. Proceedings of the National Academy of Sciences, 107(38), 16732–16737. Link to source: https://doi.org/10.1073/pnas.0910275107

Golub, A., Herrera, D., Leslie, G., Pietracci, B., & Lubowski, R. (2021). A real options framework for reducing emissions from deforestation: Reconciling short-term incentives with long-term benefits from conservation and agricultural intensification. Ecosystem Services, 49, 101275. Link to source: https://doi.org/10.1016/j.ecoser.2021.101275

Graham, V., Geldmann, J., Adams, V. M., Negret, P. J., Sinovas, P., & Chang, H.-C. (2021). Southeast Asian protected areas are effective in conserving forest cover and forest carbon stocks compared to unprotected areas. Scientific Reports, 11(1), 23760. Link to source: https://doi.org/10.1038/s41598-021-03188-w

Grantham, H. S., Duncan, A., Evans, T. D., Jones, K. R., Beyer, H. L., Schuster, R., Walston, J., Ray, J. C., Robinson, J. G., Callow, M., Clements, T., Costa, H. M., DeGemmis, A., Elsen, P. R., Ervin, J., Franco, P., Goldman, E., Goetz, S., Hansen, A., … Watson, J. E. M. (2020). Anthropogenic modification of forests means only 40% of remaining forests have high ecosystem integrity. Nature Communications, 11(1), 5978. Link to source: https://doi.org/10.1038/s41467-020-19493-3

Gray, C. L., Hill, S. L. L., Newbold, T., Hudson, L. N., Börger, L., Contu, S., Hoskins, A. J., Ferrier, S., Purvis, A., & Scharlemann, J. P. W. (2016). Local biodiversity is higher inside than outside terrestrial protected areas worldwide. Nature Communications, 7(1), 12306. Link to source: https://doi.org/10.1038/ncomms12306

Griscom, B. W., Adams, J., Ellis, P. W., Houghton, R. A., Lomax, G., Miteva, D. A., Schlesinger, W. H., Shoch, D., Siikamäki, J. V., Smith, P., Woodbury, P., Zganjar, C., Blackman, A., Campari, J., Conant, R. T., Delgado, C., Elias, P., Gopalakrishna, T., Hamsik, M. R., … Fargione, J. (2017). Natural climate solutions. Proceedings of the National Academy of Sciences, 114(44), 11645–11650. Link to source: https://doi.org/10.1073/pnas.1710465114

Hansen, M. C., Potapov, P. V., Moore, R., Hancher, M., Turubanova, S. A., Tyukavina, A., Thau, D., Stehman, S. V., Goetz, S. J., Loveland, T. R., Kommareddy, A., Egorov, A., Chini, L., Justice, C. O., & Townshend, J. R. G. (2013). High-Resolution Global Maps of 21st-Century Forest Cover Change. Science, 342(6160), 850–853. Link to source: https://doi.org/10.1126/science.1244693. Data available on-line from: Link to source: http://earthenginepartners.appspot.com/science-2013-global-forest. Accessed through Global Forest Watch on 01/12/2024. www.globalforestwatch.org

Harris, N. L., Gibbs, D. A., Baccini, A., Birdsey, R. A., de Bruin, S., Farina, M., Fatoyinbo, L., Hansen, M. C., Herold, M., Houghton, R. A., Potapov, P. V., Suarez, D. R., Roman-Cuesta, R. M., Saatchi, S. S., Slay, C. M., Turubanova, S. A., & Tyukavina, A. (2021). Global maps of twenty-first century forest carbon fluxes. Nature Climate Change, 11(3), 234–240. Link to source: https://doi.org/10.1038/s41558-020-00976-6

Heilmayr, R., Rausch, L. L., Munger, J., & Gibbs, H. K. (2020). Brazil’s Amazon Soy Moratorium reduced deforestation. Nature Food, 1(12), 801–810. Link to source: https://doi.org/10.1038/s43016-020-00194-5

Herrera, D., Ellis, A., Fisher, B., Golden, C. D., Johnson, K., Mulligan, M., Pfaff, A., Treuer, T., & Ricketts, T. H. (2017). Upstream watershed condition predicts rural children’s health across 35 developing countries. Nature Communications, 8(1), 811. Link to source: https://doi.org/10.1038/s41467-017-00775-2

Herrera, D., Pfaff, A., & Robalino, J. (2019). Impacts of protected areas vary with the level of government: Comparing avoided deforestation across agencies in the Brazilian Amazon. Proceedings of the National Academy of Sciences, 116(30), 14916–14925. Link to source: https://doi.org/10.1073/pnas.1802877116

Jones, K. R., Venter, O., Fuller, R. A., Allan, J. R., Maxwell, S. L., Negret, P. J., & Watson, J. E. M. (2018). One-third of global protected land is under intense human pressure. Science, 360(6390), 788–791. Link to source: https://doi.org/10.1126/science.aap9565

Kolden, C. A., Abatzoglou, J. T., Jones, M. W., & Jain, P. (2024). Wildfires in 2023. Nature Reviews Earth & Environment, 5(4), 238–240. Link to source: https://doi.org/10.1038/s43017-024-00544-y

Kreye, M. M., Adams, D. C., & Escobedo, F. J. (2014). The Value of Forest Conservation for Water Quality Protection. Forests, 5(5), Article 5. Link to source: https://doi.org/10.3390/f5050862

Lambin, E. F., Gibbs, H. K., Heilmayr, R., Carlson, K. M., Fleck, L. C., Garrett, R. D., le Polain de Waroux, Y., McDermott, C. L., McLaughlin, D., Newton, P., Nolte, C., Pacheco, P., Rausch, L. L., Streck, C., Thorlakson, T., & Walker, N. F. (2018). The role of supply-chain initiatives in reducing deforestation. Nature Climate Change, 8(2), 109–116. Link to source: https://doi.org/10.1038/s41558-017-0061-1

Lawrence, D., Coe, M., Walker, W., Verchot, L., & Vandecar, K. (2022). The unseen effects of deforestation: biophysical effects on climate. Frontiers in Forests and Global Change, 5. Link to source: https://doi.org/10.3389/ffgc.2022.756115

Levy, S. A., Cammelli, F., Munger, J., Gibbs, H. K., & Garrett, R. D. (2023). Deforestation in the Brazilian Amazon could be halved by scaling up the implementation of zero-deforestation cattle commitments. Global Environmental Change, 80, 102671. Link to source: https://doi.org/10.1016/j.gloenvcha.2023.102671

Li, G., Fang, C., Watson, J. E. M., Sun, S., Qi, W., Wang, Z., & Liu, J. (2024). Mixed effectiveness of global protected areas in resisting habitat loss. Nature Communications, 15(1), 8389. Link to source: https://doi.org/10.1038/s41467-024-52693-9

Lindenmayer, D. (2024). Key steps toward expanding protected areas to conserve global biodiversity. Frontiers in Science, 2. Link to source: https://doi.org/10.3389/fsci.2024.1426480

Lutz, J. A., Furniss, T. J., Johnson, D. J., Davies, S. J., Allen, D., Alonso, A., Anderson-Teixeira, K. J., Andrade, A., Baltzer, J., Becker, K. M. L., Blomdahl, E. M., Bourg, N. A., Bunyavejchewin, S., Burslem, D. F. R. P., Cansler, C. A., Cao, K., Cao, M., Cárdenas, D., Chang, L.-W., … Zimmerman, J. K. (2018). Global importance of large-diameter trees. Global Ecology and Biogeography, 27(7), 849–864. Link to source: https://doi.org/10.1111/geb.12747

Macdonald, K., Diprose, R., Grabs, J., Schleifer, P., Alger, J., Bahruddin, Brandao, J., Cashore, B., Chandra, A., Cisneros, P., Delgado, D., Garrett, R., & Hopkinson, W. (2024). Jurisdictional approaches to sustainable agro-commodity governance: The state of knowledge and future research directions. Earth System Governance, 22, 100227. Link to source: https://doi.org/10.1016/j.esg.2024.100227

McCallister, M., Krasovskiy, A., Platov, A., Pietracci, B., Golub, A., Lubowski, R., & Leslie, G. (2022). Forest protection and permanence of reduced emissions. Frontiers in Forests and Global Change, 5. Link to source: https://doi.org/10.3389/ffgc.2022.928518

Marin, F. R., Zanon, A. J., Monzon, J. P., Andrade, J. F., Silva, E. H. F. M., Richter, G. L., Antolin, L. A. S., Ribeiro, B. S. M. R., Ribas, G. G., Battisti, R., Heinemann, A. B., & Grassini, P. (2022). Protecting the Amazon forest and reducing global warming via agricultural intensification. Nature Sustainability, 5(12), 1018–1026. Link to source: https://doi.org/10.1038/s41893-022-00968-8

McNicol, I. M., Keane, A., Burgess, N. D., Bowers, S. J., Mitchard, E. T. A., & Ryan, C. M. (2023). Protected areas reduce deforestation and degradation and enhance woody growth across African woodlands. Communications Earth & Environment, 4(1), 1–14. Link to source: https://doi.org/10.1038/s43247-023-01053-4

Melo, F. P. L., Parry, L., Brancalion, P. H. S., Pinto, S. R. R., Freitas, J., Manhães, A. P., Meli, P., Ganade, G., & Chazdon, R. L. (2021). Adding forests to the water–energy–food nexus. Nature Sustainability, 4(2), 85–92. Link to source: https://doi.org/10.1038/s41893-020-00608-z

Meng, Z., Dong, J., Ellis, E. C., Metternicht, G., Qin, Y., Song, X.-P., Löfqvist, S., Garrett, R. D., Jia, X., & Xiao, X. (2023). Post-2020 biodiversity framework challenged by cropland expansion in protected areas. Nature Sustainability, 6(7), 758–768. Link to source: https://doi.org/10.1038/s41893-023-01093-w

Morales-Hidalgo, D., Oswalt, S. N., & Somanathan, E. (2015). Status and trends in global primary forest, protected areas, and areas designated for conservation of biodiversity from the Global Forest Resources Assessment 2015. Forest Ecology and Management, 352, 68–77. Link to source: https://doi.org/10.1016/j.foreco.2015.06.011

Mykleby, P. M., Snyder, P. K., & Twine, T. E. (2017). Quantifying the trade-off between carbon sequestration and albedo in midlatitude and high-latitude North American forests. Geophysical Research Letters, 44(5), 2493–2501. Link to source: https://doi.org/10.1002/2016GL071459

Nabuurs, G-J., R. Mrabet, A. Abu Hatab, M. Bustamante, H. Clark, P. Havlík, J. House, C. Mbow, K.N. Ninan, A. Popp, S. Roe, B. Sohngen, S. Towprayoon, 2022: Agriculture, Forestry and Other Land Uses (AFOLU). In IPCC, 2022: Climate Change 2022: Mitigation of Climate Change. Contribution of Working Group III to the Sixth Assessment Report of the Intergovernmental Panel on Climate Change [P.R. Shukla, J. Skea, R. Slade, A. Al Khourdajie, R. van Diemen, D. McCollum, M. Pathak, S. Some, P. Vyas, R. Fradera, M. Belkacemi, A. Hasija, G. Lisboa, S. Luz, J. Malley, (eds.)]. Cambridge University Press, Cambridge, UK and New York, NY, USA. Link to source: https://doi.org/10.1017/9781009157926.009

Naidoo, R., Gerkey, D., Hole, D., Pfaff, A., Ellis, A. M., Golden, C. D., Herrera, D., Johnson, K., Mulligan, M., Ricketts, T. H., & Fisher, B. (2019). Evaluating the impacts of protected areas on human well-being across the developing world. Science Advances, 5(4), eaav3006. Link to source: https://doi.org/10.1126/sciadv.aav3006

Oldekop, J. A., Rasmussen, L. V., Agrawal, A., Bebbington, A. J., Meyfroidt, P., Bengston, D. N., Blackman, A., Brooks, S., Davidson-Hunt, I., Davies, P., Dinsi, S. C., Fontana, L. B., Gumucio, T., Kumar, C., Kumar, K., Moran, D., Mwampamba, T. H., Nasi, R., Nilsson, M., … Wilson, S. J. (2020). Forest-linked livelihoods in a globalized world. Nature Plants, 6(12), 1400–1407. Link to source: https://doi.org/10.1038/s41477-020-00814-9

Pan, Y., Birdsey, R. A., Phillips, O. L., Houghton, R. A., Fang, J., Kauppi, P. E., Keith, H., Kurz, W. A., Ito, A., Lewis, S. L., Nabuurs, G.-J., Shvidenko, A., Hashimoto, S., Lerink, B., Schepaschenko, D., Castanho, A., & Murdiyarso, D. (2024). The enduring world forest carbon sink. Nature, 631(8021), 563–569. Link to source: https://doi.org/10.1038/s41586-024-07602-x

Phillips, C. A., Rogers, B. M., Elder, M., Cooperdock, S., Moubarak, M., Randerson, J. T., & Frumhoff, P. C. (2022). Escalating carbon emissions from North American boreal forest wildfires and the climate mitigation potential of fire management. Science Advances, 8(17), eabl7161. Link to source: https://doi.org/10.1126/sciadv.abl7161

Reddington, C. L., Butt, E. W., Ridley, D. A., Artaxo, P., Morgan, W. T., Coe, H., & Spracklen, D. V. (2015). Air quality and human health improvements from reductions in deforestation-related fire in Brazil. Nature Geoscience, 8(10), 768–771. Link to source: https://doi.org/10.1038/ngeo2535

Reek, J. E., Zohner, C. M., Smith, G. R., Cook-Patton, S. C., Frenne, P. D., D’Odorico, P., Floriancic, M. G., Jackson, R. B., Jones, J. A., Kirchner, J. W., Laguë, M., Liang, Y., Masuda, Y. J., McDonald, R. I., Parsons, L. A., Probst, B. S., Spector, J. T., West, T. A. P., Wolff, N. H., … Crowther, T. W. (2026). More than mitigation: The role of forests in climate adaptation. Science, 391(6786), 669–678. Link to source: https://doi.org/10.1126/science.ads4361

Richter, J., Goldman, E., Harris, N., Gibbs, D., Rose, M., Peyer, S., Richardson, S., & Velappan, H. (2024). Spatial Database of Planted Trees (SDPT Version 2.0) [Dataset]. Link to source: https://doi.org/10.46830/writn.23.00073

Rogers, B. M., Mackey, B., Shestakova, T. A., Keith, H., Young, V., Kormos, C. F., DellaSala, D. A., Dean, J., Birdsey, R., Bush, G., Houghton, R. A., & Moomaw, W. R. (2022). Using ecosystem integrity to maximize climate mitigation and minimize risk in international forest policy. Frontiers in Forests and Global Change, 5. Link to source: https://doi.org/10.3389/ffgc.2022.929281

Ruseva, T., Marland, E., Szymanski, C., Hoyle, J., Marland, G., & Kowalczyk, T. (2017). Additionality and permanence standards in California’s Forest Offset Protocol: A review of project and program level implications. Journal of Environmental Management, 198, 277–288. Link to source: https://doi.org/10.1016/j.jenvman.2017.04.082

Sarira, T. V., Zeng, Y., Neugarten, R., Chaplin-Kramer, R., & Koh, L. P. (2022). Co-benefits of forest carbon projects in Southeast Asia. Nature Sustainability, 5(5), 393–396. Link to source: https://doi.org/10.1038/s41893-022-00849-0

Seymour, F., Wolosin, M., & Gray, E. (2022, October 23). Policies underestimate forests’ full effect on the climate. World Resources Institute. Link to source: https://www.wri.org/insights/how-forests-affect-climate

Smith, C., Baker, J. C. A., & Spracklen, D. V. (2023). Tropical deforestation causes large reductions in observed precipitation. Nature, 615(7951), 270–275. Link to source: https://doi.org/10.1038/s41586-022-05690-1

Soto-Navarro, C., Ravilious, C., Arnell, A., de Lamo, X., Harfoot, M., Hill, S. L. L., Wearn, O. R., Santoro, M., Bouvet, A., Mermoz, S., Le Toan, T., Xia, J., Liu, S., Yuan, W., Spawn, S. A., Gibbs, H. K., Ferrier, S., Harwood, T., Alkemade, R., … Kapos, V. (2020). Mapping co-benefits for carbon storage and biodiversity to inform conservation policy and action. Philosophical Transactions of the Royal Society B: Biological Sciences, 375(1794), 20190128. Link to source: https://doi.org/10.1098/rstb.2019.0128

Sunderlin, W. D., Angelsen, A., Belcher, B., Burgers, P., Nasi, R., Santoso, L., & Wunder, S. (2005). Livelihoods, forests, and conservation in developing countries: An Overview. World Development, 33(9), 1383–1402. Link to source: https://doi.org/10.1016/j.worlddev.2004.10.004

Sweeney, B. W., Bott, T. L., Jackson, J. K., Kaplan, L. A., Newbold, J. D., Standley, L. J., Hession, W. C., & Horwitz, R. J. (2004). Riparian deforestation, stream narrowing, and loss of stream ecosystem services. Proceedings of the National Academy of Sciences, 101(39), 14132–14137. Link to source: https://doi.org/10.1073/pnas.0405895101

Sze, J. S., Carrasco, L. R., Childs, D., & Edwards, D. P. (2022). Reduced deforestation and degradation in Indigenous Lands pan-tropically. Nature Sustainability, 5(2), 123–130. Link to source: https://doi.org/10.1038/s41893-021-00815-2

Tauli-Corpuz, V., Alcorn, J., Molnar, A., Healy, C., & Barrow, E. (2020). Cornered by PAs: Adopting rights-based approaches to enable cost-effective conservation and climate action. World Development, 130, 104923. Link to source: https://doi.org/10.1016/j.worlddev.2020.104923

Tran, T. C., Ban, N. C., & Bhattacharyya, J. (2020). A review of successes, challenges, and lessons from Indigenous protected and conserved areas. Biological Conservation, 241, 108271. Link to source: https://doi.org/10.1016/j.biocon.2019.108271

UNEP-WCMC and IUCN (2024), Protected Planet: The World Database on Protected Areas (WDPA) and World Database on Other Effective Area-based Conservation Measures (WD-OECM) [Online], Accessed November 2024, Cambridge, UK: UNEP-WCMC and IUCN. Available at: www.protectedplanet.net

Vijay, V., Fisher, J. R. B., & Armsworth, P. R. (2022). Co-benefits for terrestrial biodiversity and ecosystem services available from contrasting land protection policies in the contiguous United States. Conservation Letters, 15(5), e12907. Link to source: https://doi.org/10.1111/conl.12907

Villoria, N., Garrett, R., Gollnow, F., & Carlson, K. (2022). Leakage does not fully offset soy supply-chain efforts to reduce deforestation in Brazil. Nature Communications, 13(1), 5476. Link to source: https://doi.org/10.1038/s41467-022-33213-z

Visconti, P., Butchart, S. H. M., Brooks, T. M., Langhammer, P. F., Marnewick, D., Vergara, S., Yanosky, A., & Watson, J. E. M. (2019). Protected area targets post-2020. Science, 364(6437), 239–241. Link to source: https://doi.org/10.1126/science.aav6886

Wade, C. M., Austin, K. G., Cajka, J., Lapidus, D., Everett, K. H., Galperin, D., Maynard, R., & Sobel, A. (2020). What Is Threatening Forests in Protected Areas? A Global Assessment of Deforestation in Protected Areas, 2001–2018. Forests, 11(5), Article 5. Link to source: https://doi.org/10.3390/f11050539

Waldron, A., Adams, V., Allan, J., Arnell, A., Asner, G., Atkinson, S., Baccini, A., Baillie, J., Balmford, A., & Austin Beau, J. (2020). Protecting 30% of the planet for nature: Costs, benefits and economic implications. Link to source: https://pure.iiasa.ac.at/id/eprint/16560/1/Waldron_Report_FINAL_sml.pdf

Walton, Z. L., Poudyal, N. C., Hepinstall-Cymerman, J., Johnson Gaither, C., & Boley, B. B. (2016). Exploring the role of forest resources in reducing community vulnerability to the heat effects of climate change. Forest Policy and Economics, 71, 94–102. Link to source: https://doi.org/10.1016/j.forpol.2015.09.001

Watson, J. E. M., Dudley, N., Segan, D. B., & Hockings, M. (2014). The performance and potential of protected areas. Nature, 515(7525), 67–73. Link to source: https://doi.org/10.1038/nature13947

West, T. A. P., Wunder, S., Sills, E. O., Börner, J., Rifai, S. W., Neidermeier, A. N., Frey, G. P., & Kontoleon, A. (2023). Action needed to make carbon offsets from forest conservation work for climate change mitigation. Science, 381(6660), 873–877. Link to source: https://doi.org/10.1126/science.ade3535

Wolf, C., Levi, T., Ripple, W. J., Zárrate-Charry, D. A., & Betts, M. G. (2021). A forest loss report card for the world’s protected areas. Nature Ecology & Evolution, 5(4), 520–529. Link to source: https://doi.org/10.1038/s41559-021-01389-0

Zafra-Calvo, N., Pascual, U., Brockington, D., Coolsaet, B., Cortes-Vazquez, J. A., Gross-Camp, N., Palomo, I., & Burgess, N. D. (2017). Towards an indicator system to assess equitable management in protected areas. Biological Conservation, 211, 134–141. Link to source: https://doi.org/10.1016/j.biocon.2017.05.014

Credits

Lead Fellow

  • Avery Driscoll

Contributors

  • Ruthie Burrows, Ph.D.

  • James Gerber, Ph.D.

  • Yusuf Jameel, Ph.D. 

  • Daniel Jasper

  • Alex Sweeney

Internal Reviewers

  • Hannah Henkin

  • Megan Matthews, Ph.D.

  • Ted Otte

  • Christina Swanson, Ph.D.

  • Paul C. West, Ph.D.

Effectiveness

We estimated that one ha of forest protection provides total carbon benefits of 0.299–2.204 t CO₂‑eq/yr depending on the biome (Table 1a–d; Appendix). This effectiveness estimate includes avoided emissions and preserved sequestration capacity attributable to the reduction in forest loss conferred by protection (Equation 1). First, we calculated the difference between the rate of human-caused forest loss outside of PAs (Forest lossbaseline) and the rate inside of PAs (Forest lossprotected). We then multiplied the annual rate of avoided forest loss by the sum of the carbon stored in one hectare of forest (Carbonstock) and the amount of carbon that one hectare of intact forest takes up over a 30-yr timeframe (Carbonsequestration).

Equation 1.

\[ Effectiveness = (Forest\text{ }loss_{baseline} - Forest\text{ }loss_{protected})\times(Carbon_{stock} + Carbon_{sequestration}) \]

Each of these factors varies across biomes. Based on our definition, for instance, the effectiveness of forest protection in boreal forests is lower than that in tropical and subtropical forests primarily because the former face lower rates of human-caused forest loss (though greater wildfire impacts). Importantly, the effectiveness of forest protection as defined here reflects only a small percentage of the carbon stored (394 t CO₂‑eq ) and absorbed (4.25 t CO₂‑eq/yr ) per hectare of forest (Harris et al., 2021). This is because humans clear ~0.4% of forest area annually, and forest protection is estimated to reduce human-caused forest loss by an average of 40.5% (Curtis et al., 2018; Wolf et al., 2023). 

Table 1. Effectiveness at reducing emissions and sequestering carbon, with carbon sequestration calculated over a 30-yr time frame. Differences in values between biomes are driven by variation in forest carbon stocks and sequestration rates, baseline rates of forest loss, and effectiveness of PAs at reducing forest loss. See the Appendix for source data and calculation details. Emissions and sequestration values may not sum to total effectiveness due to rounding.

Unit: t CO₂‑eq/ha/yr, 100-yr basis

Avoided emissions 0.207
Sequestration 0.091
Total effectiveness 0.299

Unit: t CO₂‑eq/ha/yr, 100-yr basis

Avoided emissions 0.832
Sequestration 0.572
Total effectiveness 1.403

Unit: t CO₂‑eq/ha/yr, 100-yr basis

Avoided emissions 1.860
Sequestration 0.344
Total effectiveness 2.204

Unit: t CO₂‑eq/ha/yr, 100-yr basis

Avoided emissions 1.190
Sequestration 0.300
Total effectiveness 1.489
Left Text Column Width
Cost

We estimated that forest protection costs approximately US$2/t CO₂‑eq (Table 2). Data related to the costs of forest protection are limited, and these estimates are uncertain. The costs of forest protection include up-front costs of land acquisition and ongoing costs of management and enforcement. The market price of land reflects the opportunity cost of not using the land for other purposes (e.g., agriculture or logging). Protecting forests also generates revenue, notably through increased tourism. Costs and revenues vary across regions, depending on the costs of land and enforcement and potential for tourism. 

The cost of land acquisition for ecosystem protection was estimated by Dienerstein et al. (2024), who found a median cost of US$988/ha (range: US$59–6,616/ha), which we amortized over 30 years. Costs of PA maintenance were estimated at US$9–17/ha/yr (Bruner et al., 2004; Waldron et al., 2020). These estimates reflect the costs of effective enforcement and management, but many existing PAs do not have adequate funds for effective enforcement (Adams et al., 2019; Barnes et al., 2018; Burner et al., 2004). Tourism revenues directly attributable to forest protection were estimated to be US$43/ha/yr (Waldron et al., 2020), not including downstream revenues from industries that benefit from increased tourism. Inclusion of a tourism multiplier would substantially increase the estimated economic benefits of forest protection.

Table 2. Cost per unit of climate impact.

Unit: 2023 US$/t CO₂‑eq, 100-yr basis

Median 2
Left Text Column Width

Methods and Supporting Data

Learning Curve

A learning curve is defined here as falling costs with increased adoption. The costs of forest protection do not fall with increasing adoption, so there is no learning curve for this solution.

Speed of Action

Speed of action refers to how quickly a climate solution physically affects the atmosphere after it is deployed. This is different from speed of deployment, which is the pace at which solutions are adopted.

At Project Drawdown, we define the speed of action for each climate solution as emergency brake, gradual, or delayed.

Protect Forests is an EMERGENCY BRAKE climate solution. It has the potential to deliver a more rapid impact than gradual and delayed solutions. Because emergency brake solutions can deliver their climate benefits quickly, they can help accelerate our efforts to address dangerous levels of climate change. For this reason, they are a high priority.

Caveats

Additionality, or the degree to which emissions reductions are above and beyond a baseline, is a key caveat for emissions avoided through forest protection (e.g., Fuller et al., 2020; Ruseva et al., 2017). Emissions avoided via forest protection are only considered additional if that forest would have been cleared or degraded without protection (Delacote et al., 2022; Delacote et al., 2024; Gallemore et al., 2020). In this analysis, additionality is addressed by using baseline rates of forest loss outside of PAs in the effectiveness calculation. Additionality is particularly important when forest protection is used to generate carbon offsets. However, the likelihood of forest removal in the absence of protection is often difficult to determine at the local level.

Permanence, or the durability of stored carbon over long timescales, is another important consideration not directly addressed in this solution. Carbon stored in forests can be compromised by natural factors, like drought, heat, flooding, wildfire, pests, and diseases, which are further exacerbated by climate change (Anderegg et al., 2020; Dye et al., 2024). Forest losses via wildfire in particular can create very large pulses of emissions (e.g., Kolden et al. 2024; Phillips et al. 2022) that negate accumulated carbon benefits of forest protection. Reversal of legal protections, illegal forest clearing, biodiversity loss, edge effects from roads, and disturbance from permitted uses can also cause forest losses directly or reduce ecosystem integrity, further increasing vulnerability to other stressors (McCallister et al., 2022).

Current Adoption

We estimated that approximately 1,673 Mha of forests are currently recognized as PAs or Indigenous peoples’ lands (Table 3e; Garnett et al., 2018; UNEP-WCMC and IUCN, 2024). Using two different maps of global forests that differ in their methodologies and definitions (ESA CCI, 2019; Hansen et al., 2013), we found an upper-end estimate of 1,943 Mha protected and a lower-end estimate of 1,404 Mha protected. These two maps classify forests using different thresholds for canopy cover and vegetation height, different satellite data, and different classification algorithms (see the Appendix for details). 

Based on our calculations, tropical forests make up the majority of forested PAs, with approximately 936 Mha under protection (Table 3d), followed by boreal forests (467 Mha, Table 3a), temperate forests (159 Mha, Table 3b), and subtropical forests (112 Mha, Table 3c). We estimate that 49% of all forests have some legal protection, though only 7% of forests are under strict protection (IUCN class I or II), with the remaining area protected under other IUCN levels, as OECMs, or as Indigenous peoples’ lands.

Table 3. Current (circa 2023) forest and woodland area under legal protection by biome (Mha). The low and high values are calculated using two different maps of global forest cover that differ in methodology for defining a forest (ESA CCI, 2019; Hansen et al., 2013). Biome-level values may not sum to global totals due to rounding.

Unit: Mha

Low 313
Mean 467
High 621

Unit: Mha

Low 135
Mean 159
High 183

Unit: Mha

Low 85
Mean 112
High 138

Unit: Mha

Low 872
Mean 936
High 1,000

Unit: Mha

Low 1,404
Mean 1,673
High 1,943
Left Text Column Width
Adoption Trend

We calculated the rate of PA expansion based on the year the PA was established. We do not have data on the expansion rate of Indigenous peoples’ lands, so the calculated adoption trend reflects only PAs. An average of 19 Mha of additional forests were protected each year between 2000 and 2020 (Table 4a–e; Figure 1), representing a roughly 2% increase in PAs per year (excluding Indigenous peoples’ lands that are not located in PAs). There were large year-to-year differences in how much new forest area was protected over this period, ranging from only 6.4 Mha in 2020 to over 38 Mha in both 2000 and 2006. Generally, the rate at which forest protection is increasing has been decreasing, with an average increase of 27 Mha/yr between 2000–2010 declining to 11 Mha/yr between 2010–2020. Recent rates of forest protection (2010–2020) are highest in the tropics (5.6 Mha/yr), followed by temperate regions (2.4 Mha/yr) and the boreal (2.0 Mha/yr), and lowest in the subtropics (0.7 Mha/yr).

Figure 1. Trend in forest protection by climate zone. These values reflect only the area located within PAs; Indigenous peoples’ lands, which were not included in the calculation of the adoption trend, are excluded.

Enable Download
On

Table 4. 2000–2020 adoption trend.

Unit: Mha protected/yr

25th percentile 1.3
Mean 2.8
Median (50th percentile) 2.0
75th percentile 3.4

Unit: Mha protected/yr

25th percentile 1.9
Mean 2.8
Median (50th percentile) 2.5
75th percentile 3.1

Unit: Mha protected/yr

25th percentile 0.5
Mean 1.0
Median (50th percentile) 0.7
75th percentile 1.1

Unit: Mha protected/yr

25th percentile 5.4
Mean 12.5
Median (50th percentile) 7.7
75th percentile 17.8

Unit: Mha protected/yr

25th percentile 9.1
Mean 19.0
Median (50th percentile) 12.9
75th percentile 25.4
Left Text Column Width
Adoption Ceiling

We estimated an adoption ceiling of 3,370 Mha of forests globally (Table 5e), defined as all existing forest areas, excluding peatlands and mangroves. Of the calculated adoption ceiling, 469 Mha of boreal forests (Table 5a), 282 Mha of temperate forests (Table 5b), 211 Mha of subtropical forests (Table 5c), and 734 Mha of tropical forests (Table 5d) are currently unprotected. The high and low values represent estimates of currently forested areas from two different maps of forest cover that use different methodologies and definitions (ESA CCI, 2019; Hansen et al., 2013). While it is not socially, politically, or economically realistic that all existing forests could be protected, these values represent the technical upper limit to adoption of this solution. Additionally, some PAs allow for ongoing sustainable use of resources, enabling some demand for wood products to be met via sustainable use of trees in PAs.

Table 5. Adoption ceiling.

Unit: Mha protected

Low 686
Mean 936
High 1,186

Unit: Mha protected

Low 385
Mean 441
High 498

Unit: Mha protected

Low 260
Mean 323
High 385

Unit: Mha protected

Low 1,557
Mean 1,669
High 1,782

Unit: Mha protected

Low 2,889
Mean 3,370
High 3,851
Left Text Column Width
Achievable Adoption

We defined the lower end of the achievable range for forest protection as all high integrity forests in addition to forests in existing PAs and Indigenous peoples’ lands, totaling 2,297 Mha (Table 6a–e). We estimated that there are 624 Mha of unprotected high integrity forests, based on maps of forest integrity developed by Grantham et al. (2020). High integrity forests have experienced little disturbance from human pressures (i.e., logging, agriculture, and buildings), are located further away from areas of human disturbance, and are well-connected to other forests. High integrity forests are a top priority for protection as they have particularly high value with respect to biodiversity and ecosystem service provisioning. These forests are also not currently being used to meet human demand for land or forest-derived products, and thus their protection may be more feasible. 

To estimate the upper end of the achievable range, we excluded the global areas of planted trees and tree crops from the adoption ceiling (Richter et al., 2024), comprising approximately 335 Mha globally (Table 6a–e). Planted trees include tree stands established for crops such as oil palm, products such as timber and fiber production, and those established as windbreaks or for ecosystem services such as erosion control. These stands are often actively managed and are unlikely to be protected.

Table 6. Range of achievable adoption levels. 

Unit: Mha protected

Current adoption 467
Achievable – low 847
Achievable – high 861
Adoption ceiling 936

Unit: Mha protected

Current adoption 159
Achievable – low 204
Achievable – high 378
Adoption ceiling 441

Unit: Mha protected

Current adoption 112
Achievable – low 126
Achievable – high 219
Adoption ceiling 323

Unit: Mha protected

Current adoption 936
Achievable – low 1,120
Achievable – high 1,577
Adoption ceiling 1,669

Unit: Mha protected

Current adoption 1,673
Achievable – low 2,297
Achievable – high 3,035
Adoption ceiling 3,370
Left Text Column Width

We estimated that forest protection currently avoids approximately 2.00 Gt CO₂‑eq/yr, with potential impacts of 2.49 Gt CO₂‑eq/yr at the low-achievable scenario, 3.62 Gt CO₂‑eq/yr  at the high-achievable scenario, and 4.10 Gt CO₂‑eq/yr at the adoption ceiling (Table 7a–e). Although not directly comparable due to the inclusion of different land covers, these values are aligned with Griscom et al. (2017) estimates that forest protection could avoid 3.6 Gt CO₂‑eq/yr and the IPCC estimate that protection of all ecosystems could avoid 6.2 Gt CO₂‑eq/yr (Nabuurs et al., 2022).

Note that the four adoption scenarios vary only with respect to the area under protection. Increases in either the rate of forest loss that would have occurred if the area had not been protected or in the effectiveness of PAs at avoiding forest loss would substantially increase the climate impacts of forest protection. For instance, a hypothetical 50% increase in the rate of forest loss outside of PAs would increase the carbon impacts of the current adoption, low achievable, high achievable, and adoption ceiling scenarios to 3.0, 3.7, 5.4, and 6.1 Gt CO₂‑eq/yr, respectively. Similarly, if legal forest protection reduced forest loss twice as much as it currently does, the climate impacts of the four scenarios would increase to 3.9, 4.8, 7.0, and 7.8 Gt CO₂‑eq/yr, respectively.

Table 7. Climate impact at different levels of adoption.

Unit: Gt CO₂‑eq/yr, 100-yr basis

Current adoption 0.14
Achievable – low 0.25
Achievable – high 0.26
Adoption ceiling 0.28

Unit: Gt CO₂‑eq/yr, 100-yr basis

Current adoption 0.22
Achievable – low 0.29
Achievable – high 0.53
Adoption ceiling 0.62

Unit: Gt CO₂‑eq/yr, 100-yr basis

Current adoption 0.25
Achievable – low 0.28
Achievable – high 0.48
Adoption ceiling 0.71

Unit: Gt CO₂‑eq/yr, 100-yr basis

Current adoption 1.39
Achievable – low 1.67
Achievable – high 2.35
Adoption ceiling 2.49

Unit: Gt CO₂‑eq/yr, 100-yr basis

Current adoption 2.00
Achievable – low 2.49
Achievable – high 3.62
Adoption ceiling 4.10
Left Text Column Width
Additional Benefits

Heat Stress

See Extreme Weather Events for details. 

Extreme Weather Events

Protected forests are more biodiverse and therefore more resilient and adaptable, providing higher-quality ecosystem services to surrounding communities (Gray et al., 2016). Protected forests can also buffer surrounding areas from the effects of extreme weather events. By increasing plant species richness, forest preservation can contribute to drought and fire tolerance (Buotte et al., 2020). Forests help regulate local climate by reducing daytime temperatures and temperature extremes (Lawrence et al., 2022; Reek et al., 2026). Studies have shown that the extent of forest coverage helps to alleviate vulnerability associated with heat effects (Walton et al., 2016). Tropical deforestation threatens human well-being by removing critical local cooling effects provided by tropical forests, exacerbating extreme heat conditions in already vulnerable regions (Seymour et al., 2022).

Income and Work

For a description of the Income and Work benefits, please refer to Food Security and Health sections below. 

Food Security

Protecting forests in predominantly natural areas can improve food security by supporting crop pollination of nearby agriculture. Sarira et al. (2022) found that protecting 58% of threatened forests in Southeast Asia could support the dietary needs of about 305,000–342,000 people annually. Forests also provide a key source of income and livelihoods for subsistence households and individuals (de Souza et al., 2016; Herrera et al., 2017; Naidoo et al., 2019). By maintaining this source of income through forest protection, households can earn sufficient income that contributes to food security. 

Health

Protected forests can benefit the health and well-being of surrounding communities through impacts on the environment and local economies. Herrera et al. (2017) found that in rural areas of low- and middle-income countries, household members living downstream of higher tree cover had a lower probability of diarrheal disease. Proximity to PAs can benefit local tourism, which may provide more economic resources to surrounding households. Naidoo et al. (2019) found that households near PAs in low- and middle-income countries were more likely to have higher levels of wealth and were less likely to have children who were stunted. Reducing deforestation can improve health by lowering vector-borne diseases, mitigating extreme weather impacts, and improving air quality (Reddington et al., 2015). 

Equality

Indigenous peoples have a long history of caring for and shaping landscapes that are rich with biodiversity (Fletcher et al., 2021). Indigenous communities provide vital ecological functions for preserving biodiversity, like seed dispersal and predation (Bliege Bird & Nimmo, 2018). Indigenous peoples also have spiritual and cultural ties to their lands (Garnett et al., 2018). Establishing protected areas must prioritize the return of landscapes to Indigenous peoples so traditional owners can feel the benefits of biodiversity. However, the burden of conservation should not be placed on Indigenous communities without legal recognition or support (Fa et al., 2020). In fact, land grabs and encroachments on Indigenous lands have led to greater deforestation pressure (Sze et al., 2022). Efforts to protect these lands must include legal recognition of Indigenous ownership to support a just and sustainable conservation process (Fletcher et al., 2021).

Nature Protection

Forests are home to a wide range of species and habitats and are essential for safeguarding biodiversity. Forests have high above- and below-ground carbon density, high tree species richness, and often provide habitat to threatened and endangered species (Buotte et al., 2020). PAs can aid in avoiding extinctions by protecting rare and threatened species (Dinerstein et al. 2024). In Southeast Asia, protecting 58% of threatened forests could safeguard about half of the key biodiversity areas in the region (Sarira et al., 2022). 

Water Quality

Forests act as a natural water filter and can maintain and improve water quality (Melo et al., 2021). Forests can also retain nutrients from polluting the larger watershed (Sweeney et al., 2004). For example, forests can uptake excess nutrients like nitrogen, reducing their flow into surrounding water (Sarira et al., 2022). These excessive nutrients can cause eutrophication and algal blooms that negatively impact water quality and aquatic life. 

Risks

Ecosystem protection initiatives that are not led by or undertaken in close collaboration with local communities can compromise community sovereignty and create injustice and inequity (Baragwanath et al., 2020; Blackman & Viet 2018; Dawson et al., 2024; Fa et al., 2020; FAO, 2024; Garnett et al. 2018; Sze et al. 2022; Tauli-Corpuz et al., 2020). Forest protection has the potential to be a win-win for climate and communities, but only if PAs are established with respect to livelihoods and other socio-ecological impacts, ensuring equity in procedures, recognition, and the distribution of benefits (Zafra-Calvo et al., 2017).

Leakage is a key risk of relying on forest protection as a climate solution. Leakage occurs when deforestation-related activities move outside of PA boundaries, resulting in the relocation of, rather than a reduction in, emissions from forest loss. If forest protection efforts are not coupled with policies to reduce incentives for forest clearing, leakage will likely offset some of the emissions avoided through forest protection. Additional research is needed to comprehensively quantify the magnitude of leakage effects, though two regional-scale studies found only small negative effects (Fuller et al., 2020; Herrera et al., 2019).

Interactions with Other Solutions

Reinforcing

Other intact and degraded ecosystems often occur within areas of forest protection. Therefore, forest protection can facilitate natural restoration of these other degraded ecosystems, and increase the health of adjacent ecosystems.

Forest protection helps restored ecosystems avoid future degradation and can also accelerate the adoption of improved forest management practices

Competing

Protecting forests could limit land availability for renewable energy technologies and raw material and food production. Protect Forests competes with the following solutions for land

This solution reduces the supply of wood. This limits the wood available as raw material to the following solutions that use it.

Dashboard

Solution Basics

ha protected

t CO₂-eq (100-yr)/unit/yr
0.299
units
Current 4.67×10⁸ 08.47×10⁸8.61×10⁸
Achievable (Low to High)

Climate Impact

Gt CO₂-eq (100-yr)/yr
Current 0.14 0.250.26
US$ per t CO₂-eq
2
Emergency Brake

CO₂

Solution Basics

ha protected

t CO₂-eq (100-yr)/unit/yr
1.403
units
Current 1.59×10⁸ 02.04×10⁸3.78×10⁸
Achievable (Low to High)

Climate Impact

Gt CO₂-eq (100-yr)/yr
Current 0.22 0.290.53
US$ per t CO₂-eq
2
Emergency Brake

CO₂

Solution Basics

ha protected

t CO₂-eq (100-yr)/unit/yr
2.204
units
Current 1.12×10⁸ 01.26×10⁸2.19×10⁸
Achievable (Low to High)

Climate Impact

Gt CO₂-eq (100-yr)/yr
Current 0.25 0.280.48
US$ per t CO₂-eq
2
Emergency Brake

CO₂

Solution Basics

ha protected

t CO₂-eq (100-yr)/unit/yr
1.489
units
Current 9.36×10⁸ 01.12×10⁹1.577×10⁹
Achievable (Low to High)

Climate Impact

Gt CO₂-eq (100-yr)/yr
Current 1.39 1.672.35
US$ per t CO₂-eq
2
Emergency Brake

CO₂

% tree cover
0100

Tree cover, 2000 (excluding mangroves and peatlands)

We exclude mangroves and peatlands because they are addressed in other solutions.

Global Forest Watch (2023). Global peatlands [Data set]. Retrieved December 6, 2024 from Link to source: https://data.globalforestwatch.org/datasets/gfw::global-peatlands/about

Hansen, M.C., Potapov, P.V., Moore, R., Hancher, M., Turubanova, S.A., Tyukavina, A., Thau, D., Stehman, S.V., Goetz, S.J., Loveland, T.R., Kommareddy, A., Egorov, A., Chini, L., Justice, C.O., and Townshend, J.R.G. (2013). High-resolution global maps of 21st-century forest cover change [Data set]. Science 342 (15 November): 850-53. Link to source: https://glad.earthengine.app/view/global-forest-change

UNEP-WCMC (2025). Ocean+ habitats (version 1.3) [Data set]. Retrieved November 2024 from habitats.oceanplus.org

% tree cover
0100

Tree cover, 2000 (excluding mangroves and peatlands)

We exclude mangroves and peatlands because they are addressed in other solutions.

Global Forest Watch (2023). Global peatlands [Data set]. Retrieved December 6, 2024 from Link to source: https://data.globalforestwatch.org/datasets/gfw::global-peatlands/about

Hansen, M.C., Potapov, P.V., Moore, R., Hancher, M., Turubanova, S.A., Tyukavina, A., Thau, D., Stehman, S.V., Goetz, S.J., Loveland, T.R., Kommareddy, A., Egorov, A., Chini, L., Justice, C.O., and Townshend, J.R.G. (2013). High-resolution global maps of 21st-century forest cover change [Data set]. Science 342 (15 November): 850-53. Link to source: https://glad.earthengine.app/view/global-forest-change

UNEP-WCMC (2025). Ocean+ habitats (version 1.3) [Data set]. Retrieved November 2024 from habitats.oceanplus.org

Maps Introduction

The adoption, potential adoption, and effectiveness of forest protection are highly geographically variable. While forest protection can help avoid emissions anywhere that forests occur, areas with high rates of forest loss from human drivers and particularly carbon-rich forests have the greatest potential for avoiding emissions via forest protection. The tropics and subtropics are high-priority areas for forest protection as they contain 55% of currently unprotected forest area, forest loss due to agricultural expansion is particularly concentrated in these regions (Curtis et al., 2018; West et al., 2014; Gibbs et al., 2010), and tend to have larger biomass carbon stocks than boreal forests (Harris et al., 2021). 

Developed countries also have significant potential to protect remaining old and long unlogged forests and foster recovery in secondary natural forests. The top 10 forested countries include Canada, the USA, Russia and even Australia, with the latter moving towards ending commodity production in its natural forests and increasing formal protection. Restoration of degraded forests is addressed in the Forest Restoration solution, but including regenerating forests in well designed protected areas is well within the capacity of every developed country.

Buffering and reconnecting existing high integrity forests is a low risk climate solution that increases current and future forest ecosystem resilience and adaptive capacity (Brennan et al., 2022; Brink et al., 2017; Grantham et al., 2020; Rogers et al., 2022). Forests with high ecological integrity provide outsized benefits for carbon storage and biodiversity and have greater resilience, making them top priorities for protection (Grantham et al., 2020; Rogers et al., 2022). Within a given forest, large-diameter trees similarly provide outsized carbon storage and biodiversity benefits, comprising only 1% of trees globally but storing 50% of the above ground forest carbon (Lutz et al., 2018). Additionally, forests that improve protected area connectivity (Brennan et al., 2022; Brink et al., 2017), areas at high risk of loss (particularly to expansion of commodity agriculture; Curtis et al., 2018; Hansen et al., 2013), and areas with particularly large or specialized benefits for biodiversity, ecosystem services, and human well-being (Dinerstein et al., 2024; Sarira et al., 2022; Soto-Navarro et al., 2020) may be key targets for forest protection.

Action Word
Protect
Solution Title
Forests
Classification
Highly Recommended

Lawmakers and Policymakers

  • Set achievable targets and pledges for PA designation and set clear effectiveness goals for PAs, emphasizing the effectiveness of current PAs before seeking to expand designations.
  • Use a variety of indicators to measure effectiveness, such as estimated avoided deforestation.
  • Ensure public procurement utilizes deforestation-free products and supply chains.
  • Grant Indigenous communities full property rights and autonomy and support them in monitoring, managing, and enforcing PAs.
  • Ensure PAs do not displace, violate rights, or reduce access to vital resources for local and Indigenous communities.
  • Invest in PA infrastructure, monitoring, management, and enforcement mechanisms.
  • Utilize real-time monitoring and satellite data such as the “Real-Time System for Detection of Deforestation” (DETER).
  • Join, support, or create certification schemes like the Forest Stewardship Council for sustainable logging practices.
  • Conduct proactive land-use planning to avoid roads and other development projects that may interfere with PAs or incentivize deforestation.
  • Create processes for legal grievances, dispute resolution, and restitution.
  • Remove harmful agricultural and logging subsidies.
  • Prioritize reducing food loss and waste.
  • Create education programs that educate the public on PA regulations, the benefits of the regulations, and how to use forest resources sustainably.

Practitioners

  • Set achievable targets and pledges for PA designation and set clear effectiveness goals for PAs, emphasizing the effectiveness of current PAs before seeking to expand designations
  • Use a variety of indicators to measure effectiveness, such as estimated avoided deforestation.
  • Ensure PAs do not displace, violate rights, or reduce access to vital resources for local and Indigenous communities.
  • Utilize real-time monitoring and satellite data such as the “Real-Time System for Detection of Deforestation” (DETER).
  • Create sustainable use regulations for PA areas that provide resources to the local community.
  • Conduct proactive land-use planning to avoid infrastructure or development projects that may interfere with PAs or incentivize deforestation.
  • Grant Indigenous communities full property rights and autonomy and support them in monitoring, managing, and enforcing PAs.
  • Join, support, or create certification schemes like the Forest Stewardship Council for sustainable logging practices.
  • Create processes for legal grievances, dispute resolution, and restitution.
  • Create education programs that educate the public on PA regulations, the benefits of the regulations, and how to use forest resources sustainably.

Business Leaders

  • Create deforestation-free supply chains, utilizing data, information, and the latest technology to inform product sourcing.
  • Integrate deforestation-free business and investment policies and practices in Net-Zero strategies.
  • Only purchase carbon credits from high-integrity, verifiable carbon markets and do not use them as replacements for reducing emissions.
  • Help shift the public narrative around carbon markets as integrity increases to boost education, dialogue, and awareness.
  • Develop financial instruments to invest in PA jurisdictions, focusing on supporting Indigenous communities.
  • Join or create public-private partnerships, alliances, or coalitions of stakeholders and rightsholders to support PAs and advance deforestation-free markets.
  • Join, support, or create certification schemes like the Forest Stewardship Council for sustainable logging practices.
  • Conduct proactive land-use planning to avoid infrastructure or development projects that may interfere with PAs or incentivize deforestation.
  • Amplify the voices of local communities and civil society to promote robust media coverage.
  • Invest in and support Indigenous and local communities' capacity for public relations and communications.
  • Support education programs that educate the public on PA regulations, the benefits of the regulations, and how to use forest resources sustainably.
  • Leverage political influence to advocate for stronger PA policies at national and international levels, especially policies that reduce deforestation pressure. 

Nonprofit Leaders

  • Ensure operations utilize deforestation-free products and supply chains.
  • Advocate for PAs and for public investments and evaluation indicators to strengthen the effectiveness of PAs.
  • Assist in managing and monitoring PAs, utilizing real-time monitoring and satellite data such as the “Real-Time System for Detection of Deforestation” (DETER).
  • Provide financial support for PAs management, monitoring, and enforcement.
  • Assist in conducting proactive land-use planning to avoid infrastructure or development projects that may interfere with PAs or incentivize deforestation.
  • Advocate for creating legal grievance processes, dispute resolution mechanisms, and restitution procedures for violations or disagreements over PAs.
  • Support high-integrity carbon markets, institutions, rules, and norms to cultivate the demand for high-quality carbon credits.
  • Help shift the public narrative around carbon markets as integrity increases to boost education, dialogue, and awareness.
  • Support PAs, businesses, and investors by sharing data, information, and investment frameworks that successfully avoid deforestation.
  • Help shift public narratives to mobilize public action and build political will for PAs by creating educational campaigns and strengthening networks of stakeholders and rightsholders.
  • Join, support, or create certification schemes like the Forest Stewardship Council for sustainable logging practices.
  • Amplify the voices of local communities and civil society to promote robust media coverage.
  • Invest in and support Indigenous and local communities' capacity for legal protection and public relations.
  • Advocate for non-timber forest products to support local and Indigenous communities.
  • Advocate to remove harmful agricultural subsidies and prioritize reducing food loss and waste.

Investors

  • Create deforestation-free investment portfolios, utilizing data, information, and the latest technology to inform investments.
  • Invest in PA infrastructure, monitoring, management, and enforcement mechanisms.
  • Invest in green bonds or high-integrity carbon credits for forest conservation efforts.
  • Develop financial instruments to invest in PA jurisdictions, focusing on supporting Indigenous communities.
  • Support PAs, other investors, and NGOs by sharing data, information, and investment frameworks that successfully avoid investments that drive deforestation.
  • Join, support, or create science-based certification schemes like the Forest Stewardship Council for sustainable logging practices.
  • Help shift public narratives to mobilize public action and build political will for PAs by creating educational campaigns and strengthening networks of stakeholders and rightsholders.
  • Require portfolio companies to eliminate deforestation from their supply chains and ask that they demonstrate strong PA practices.
  • Consider opportunities to invest in forest monitoring technologies or bioeconomy products derived from standing forests (e.g., nuts, berries, or other derivatives)

Philanthropists and International Aid Agencies

  • Ensure operations utilize deforestation-free products and supply chains.
  • Provide financial support for PAs management, monitoring, and enforcement.
  • Assist in monitoring PAs, utilizing real-time monitoring and satellite data such as the “Real-Time System for Detection of Deforestation” (DETER).
  • Assist in conducting proactive land-use planning to avoid infrastructure or development projects that may interfere with PAs or incentivize deforestation.
  • Support and finance high-integrity carbon markets, institutions, rules, and norms to cultivate the demand for high-quality carbon credits.
  • Help shift the public narrative around carbon markets as integrity increases to boost education, dialogue, and awareness.
  • Support PAs, businesses, and investors by sharing data, information, and investment frameworks that successfully avoid deforestation.
  • Help shift public narratives to mobilize public action and build political will for PAs by creating educational campaigns and strengthening networks of stakeholders and rightsholders.
  • Amplify the voices of local communities and civil society to promote robust media coverage.
  • Invest in and support Indigenous and local communities' capacity for public relations and communications.
  • Financially support Indigenous land tenure.
  • Join, support, or create certification schemes like the Forest Stewardship Council for sustainable logging practices.
  • Advocate for PAs and for public investments and evaluation indicators to strengthen the effectiveness of PAs.
  • Advocate for legal grievances, dispute resolution, and restitution processes.

Thought Leaders

  • Advocate for PAs and for public investments and evaluation indicators to strengthen the effectiveness of PAs.
  • Assist in monitoring PAs, utilizing real-time monitoring and satellite data such as the “Real-Time System for Detection of Deforestation” (DETER).
  • Assist in conducting proactive land-use planning to avoid infrastructure or development projects that may interfere with PAs or incentivize deforestation.
  • Advocate for legal grievances, dispute resolution, and restitution processes.
  • Support high-integrity carbon markets, institutions, rules, and norms to cultivate the demand for high-quality carbon credits.
  • Help shift the public narrative around carbon markets as integrity increases to boost education, dialogue, and awareness.
  • Support PAs, businesses, and investors by sharing data, information, and investment frameworks that successfully avoid deforestation.
  • Help shift public narratives to mobilize public action and build political will for PAs by creating educational campaigns and strengthening networks of stakeholders and rightsholders.
  • Amplify the voices of local communities and civil society to promote robust media coverage.
  • Support Indigenous and local communities' capacity for public relations and communications.

Technologists and Researchers

  • Improving PA monitoring methods and data collection, utilizing satellite imagery and GIS tools.
  • Develop land-use planning tools that help avoid infrastructure or development projects that may interfere with PAs or incentivize deforestation.
  • Create tools for local communities to monitor PAs, such as mobile apps, e-learning platforms, and mapping tools.
  • Conduct evaluations of the species richness of potential PAs and recommend areas of high biodiversity to be designated as PAs.
  • Develop verifiable carbon credits using technology such as blockchain to improve the integrity of carbon markets.
  • Develop supply chain tracking software for investors and businesses seeking to create deforestation-free portfolios and products.

Communities, Households, and Individuals

  • Ensure purchases and investments utilize deforestation-free products and supply chains.
  • Advocate for PAs and for public investments and evaluation indicators to strengthen the effectiveness of PAs.
  • Assist in monitoring PAs, utilizing real-time monitoring and satellite data such as the “Real-Time System for Detection of Deforestation” (DETER).
  • Assist in conducting proactive land-use planning to avoid infrastructure or development projects that may interfere with PAs or incentivize deforestation.
  • Advocate for legal grievances, dispute resolution, and restitution processes.
  • Support Indigenous and local communities' capacity for public relations and communications.
  • Assist with evaluations of the species richness of potential PAs and advocate for PAs in areas of high biodiversity that are threatened.
  • Help shift public narratives to mobilize public action and build political will for PAs by creating educational campaigns and strengthening networks of stakeholders and rightsholders.
  • Undertake forest protection and expansion initiatives locally by working to preserve existing forests and restore degraded forest areas.
  • Engage in citizen science initiatives by partnering with researchers or conservation groups to monitor PAs and document threats. 
Evidence Base

Consensus of effectiveness in reducing emissions and maintaining carbon removal: High

There is high scientific consensus that forest protection is a key strategy for reducing forest loss and addressing climate change. Rates of forest loss are lower inside of PAs and Indigenous peoples’ lands than outside of them. Globally, Wolf et al. (2021) found that rates of forest loss inside PAs are 40.5% lower on average than in unprotected areas, and Li et al. (2024) estimated that overall forest loss is 14% lower in PAs relative to unprotected areas. Regional studies find similar average effects of PAs on deforestation rates. For instance, McNichol et al. (2023) reported 39% lower deforestation rates in African woodlands in PAs relative to unprotected areas, and Graham et al. (2021) reported 69% lower deforestation rates in PAs relative to unprotected areas in Southeast Asia. In the tropics, Sze et al. (2022) found that rates of forest loss were similar between Indigenous lands and PAs, with forest loss rates reduced 17–29% relative to unprotected areas. Baragwanath & Bayi (2020) reported a 75% decline in deforestation in the Brazilian Amazon when Indigenous peoples are granted full property rights.

Reductions in forest loss lead to proportionate reductions in CO₂ emissions. The Intergovernmental Panel on Climate Change (IPCC) estimated that ecosystem protection, including forests, peatlands, grasslands, and coastal wetlands, has a technical mitigation potential of 6.2 Gt CO₂‑eq/yr, 4.0 Gt of which are available at a carbon price less than US$100 tCO₂‑eq/yr  (Nabuurs et al., 2022). Similarly, Griscom et al. (2017) found that avoiding human-caused forest loss is among the most effective natural climate solutions, with a potential impact of 3.6 Gt CO₂‑eq/yr (including forests on peatlands), nearly 2 Gt CO₂‑eq/yr of which is achievable at a cost below US$10/t CO₂‑eq/yr.

The results presented in this document were produced through analysis of 12 global datasets. We recognize that geographic biases can influence the development of global datasets and hope this work inspires research and data sharing on this topic in underrepresented regions.

Appendix

In this analysis, we integrated global land cover data, maps of forest loss rates, shapefiles of PAs and Indigenous people’s lands, country-scale data on reductions in forest loss inside of PAs, and biome-scale data on forest carbon stocks and sequestration rates to calculate currently protected forest area, total global forest area, and avoided emissions from forest protection. Forested peatlands and mangroves are excluded from this analysis and addressed in the Protect Peatlands and Protect Coastal Wetlands solutions, respectively.

Land cover data

We used two land cover data products to estimate forest extent inside and outside of PAs and Indigenous people’s lands, including: 1) the Global Forest Watch (GFW) tree cover dataset (Hansen et al., 2013), resampled to 30 second resolution, and 2) the 2022 European Space Agency Climate Change Initiative (ESA CCI) land cover dataset at native resolution (300 m). For the ESA CCI dataset, all non-flooded tree cover classes (50, 60, 70, 80, 90) and the “mosaic tree and shrub (>50%)/herbaceous cover (<50%)” class (100) and associated subclasses were included as forests. Both products are associated with uncertainty, which we did not address directly in our calculations. We include estimates from both products in order to provide readers with a sense of the variability in values that can stem from different land cover classification methods, which are discussed in more detail below.

These two datasets have methodological differences that result in substantially different classifications of forest extent, including their thresholds for defining forests, their underlying satellite data, and the algorithms used to classify forests based on the satellite information. For example, the ESA CCI product classifies 300-meter pixels with >15% tree cover as forests (based on our included classes), attempts to differentiate tree crops, relies on a 2003–2012 baseline land cover map coupled with a change-detection algorithm, and primarily uses imagery from MERIS, PROBA-V, and Sentinel missions (ESA CCI 2019). In contrast, the Global Forest Watch product generally requires >30% tree cover at 30-meter resolution, does not exclude tree crops, relies on a regression tree model for development of a baseline tree cover map circa 2010, and primarily uses Landsat ETM+ satellite imagery (Hansen et al., 2013). We recommend that interested readers refer to the respective user guides for each data product for a comprehensive discussion of the complex methods used for their development.

We used the Forest Landscape Integrity Index map developed by Grantham et al. (2020), which classifies forests with integrity indices ≥9.6 as high integrity. These forests are characterized by minimal human disturbance and high connectivity. Mangroves and peatlands were excluded from this analysis. We used a map of mangroves from Giri et al. (2011) and a map of peatlands compiled by Global Forest Watch to define mangrove and peatland extent (accessed at https://data.globalforestwatch.org/datasets/gfw::global-peatlands/about). The peatlands map is a composite of maps from five publications: Crezee et al. (2022), Gumbricht et al. (2017), Hastie et al. (2022), Miettinen et al. (2016), and Xu et al. (2018). For each compiled dataset, the data were resampled to 30-second resolution by calculating the area of each grid cell occupied by mangroves or peatlands. For each grid cell containing forests, the “eligible” forest area was calculated by subtracting the mangrove and peatland area from the total forest area for each forest cover dataset (GFW, ESA CCI, and high-integrity forests).

Protected forest areas

We identified protected forest areas using the World Database on Protected Areas (WDPA, 2024), which contains boundaries for each PA and additional information, including their establishment year and IUCN management category (Ia to VI, not applicable, not reported, and not assigned). For each PA polygon, we extracted the forest area from the GFW, ESA CCI, and high-integrity dataset (after removing the peatland and mangrove areas).

Each protected area was classified into a climate zone based on the midpoint between its minimum and maximum latitude. Zones included tropical (23.4°N–23.4°S), subtropical (23.4°–35° latitude), temperate (35°–50° latitude), and boreal (>50° latitude) in order to retain some spatial variability in emissions factors. We aggregated protected forest cover areas (from each of the two forest cover datasets and the high-integrity forest data) by IUCN class and climate zone. To evaluate trends in adoption over time, we also aggregated protected areas by establishment year. We used the same method to calculate the forest area that could be protected, extracting the total area of each land cover type by climate zone (inside and outside of existing PAs). 

We used maps from Garnett et al. (2018) to identify Indigenous people’s lands that were not inside established PAs. We calculated the total forest area within Indigenous people’s lands (excluding PAs, mangroves, and peatlands) using the same three forest area data sources. 

Forest loss and emissions factors

Forest loss rates were calculated for unprotected areas using the GFW forest loss dataset for 2001–2022, resampled to 1 km resolution. Forest losses were reclassified according to their dominant drivers based on the maps originally developed by Curtis et al. (2018), with updates accessible through GFW. Dominant drivers of forest loss include commodity agriculture, shifting agriculture, urbanization, forestry, and wildfire. We classified all drivers except wildfire as human-caused forest loss for this analysis. We calculated the area of forest loss attributable to each driver within each climate zone, which represented the “baseline” rate of forest loss outside of PAs. 

To calculate the difference in forest loss rates attributable to protection, we used country-level data from Wolf et al. (2021) on the ratio of forest loss in unprotected areas versus PAs, controlling for a suite of socio-environmental characteristics. We classified countries into climate zones based on their median latitude and averaged the ratios within climate zones. We defined the avoided forest loss attributable to protection as the product of the baseline forest loss rate and the ratio of forest loss outside versus inside of PAs.

We calculated the carbon benefits of avoided forest loss by multiplying avoided forest loss by average forest carbon stocks and sequestration rates. Harris et al. (2021) reported carbon stocks and sequestration rates by climate zone (boreal, temperate, subtropical, and tropical), and forest type. Carbon stocks and sequestration rates for primary and old secondary (>20 years old) forests were averaged for this analysis. We calculated carbon sequestration over a 20-yr period to provide values commensurate with the one-time loss of biomass carbon stocks.

Source data

Crezee, B. et al. Mapping peat thickness and carbon stocks of the central Congo Basin using field data. Nature Geoscience 15: 639-644 (2022). https://www.nature.com/articles/s41561-022-00966-7. Data downloaded from https://congopeat.net/maps/, using classes 4 and 5 only (peat classes). 

Curtis, P. G., Slay, C. M., Harris, N. L., Tyukavina, A., & Hansen, M. C. (2018). Classifying drivers of global forest loss. Science, 361(6407), 1108–1111. https://doi.org/10.1126/science.aau3445

ESA CCI (2019). Copernicus Climate Change Service, Climate Data Store: Land cover classification gridded maps from 1992 to present derived from satellite observation. Copernicus Climate Change Service (C3S) Climate Data Store (CDS). Accessed November 2024. doi: 10.24381/cds.006f2c9a

Garnett, S. T., Burgess, N. D., Fa, J. E., Fernández-Llamazares, Á., Molnár, Z., Robinson, C. J., Watson, J. E. M., Zander, K. K., Austin, B., Brondizio, E. S., Collier, N. F., Duncan, T., Ellis, E., Geyle, H., Jackson, M. V., Jonas, H., Malmer, P., McGowan, B., Sivongxay, A., & Leiper, I. (2018). A spatial overview of the global importance of Indigenous lands for conservation. Nature Sustainability, 1(7), 369–374. https://doi.org/10.1038/s41893-018-0100-6

Giri C, Ochieng E, Tieszen LL, Zhu Z, Singh A, Loveland T, Masek J, Duke N (2011). Status and distribution of mangrove forests of the world using earth observation satellite data (version 1.3, updated by UNEP-WCMC). Global Ecology and Biogeography 20: 154-159. doi: 10.1111/j.1466-8238.2010.00584.x . Data URL: http://data.unep-wcmc.org/datasets/4

Gumbricht, T. et al. An expert system model for mapping tropical wetlands and peatlands reveals South America as the largest contributor. Global Change Biology 23, 3581–3599 (2017). https://onlinelibrary.wiley.com/doi/full/10.1111/gcb.13689 

Hansen, M. C., Potapov, P. V., Moore, R., Hancher, M., Turubanova, S. A., Tyukavina, A., Thau, D., Stehman, S. V., Goetz, S. J., Loveland, T. R., Kommareddy, A., Egorov, A., Chini, L., Justice, C. O., & Townshend, J. R. G. (2013). High-Resolution Global Maps of 21st-Century Forest Cover Change. Science, 342(6160), 850–853. https://doi.org/10.1126/science.1244693. Data available on-line from: http://earthenginepartners.appspot.com/science-2013-global-forest. Accessed through Global Forest Watch on 01/12/2024. www.globalforestwatch.org

Harris, N. L., Gibbs, D. A., Baccini, A., Birdsey, R. A., de Bruin, S., Farina, M., Fatoyinbo, L., Hansen, M. C., Herold, M., Houghton, R. A., Potapov, P. V., Suarez, D. R., Roman-Cuesta, R. M., Saatchi, S. S., Slay, C. M., Turubanova, S. A., & Tyukavina, A. (2021). Global maps of twenty-first century forest carbon fluxes. Nature Climate Change, 11(3), 234–240. https://doi.org/10.1038/s41558-020-00976-6

Hastie, A. et al. Risks to carbon storage from land-use change revealed by peat thickness maps of Peru. Nature Geoscience 15: 369-374 (2022). https://www.nature.com/articles/s41561-022-00923-4

Miettinen, J., Shi, C. & Liew, S. C. Land cover distribution in the peatlands of Peninsular Malaysia, Sumatra and Borneo in 2015 with changes since 1990. Global Ecological Conservation. 6, 67– 78 (2016). https://www.sciencedirect.com/science/article/pii/S2351989415300470

UNEP-WCMC and IUCN (2024), Protected Planet: The World Database on Protected Areas (WDPA) and World Database on Other Effective Area-based Conservation Measures (WD-OECM) [Online], Accessed November 2024, Cambridge, UK: UNEP-WCMC and IUCN. Available at: www.protectedplanet.net.

Wolf, C., Levi, T., Ripple, W. J., Zárrate-Charry, D. A., & Betts, M. G. (2021). A forest loss report card for the world’s protected areas. Nature Ecology & Evolution, 5(4), 520–529. https://doi.org/10.1038/s41559-021-01389-0

Xu et al. PEATMAP: Refining estimates of global peatland distribution based on a meta-analysis. CATENA 160: 134-140 (2018). https://www.sciencedirect.com/science/article/pii/S0341816217303004 

Updated Date
Coming Soon Label
Coming Soon

Use Heat Pumps

Image
Image
Heat pumps
Coming Soon
Off

Key Takeaways

  • A single all-electric residential heat pump for space heating reduces GHG emissions an average of 0.95 t CO₂‑eq/yr.
  • A heat pump’s potential to reduce GHG emissions depends on the heating source it replaces and the emissions intensity of the electricity used to run it.
  • Roughly 130 million heat pumps are currently used for space heating, largely in Europe, Canada, the United States, China, and Japan. 
  • We estimated that 600–960 million heat pumps could be in operation by 2050, reducing GHG emissions 0.57–0.91 Gt CO₂‑eq/yr.  
  • Because heat pumps often provide cooling as well as heating, adoption can increase resilience to heat stress. 
Summary

Heat pumps use electricity to efficiently move heat from one place to another. This solution focuses on the replacement of fossil fuel–based heating systems with electric heat pumps. Heat pumps are remarkably efficient because they collect heat from the outside air, ground, or water using a refrigerant and use a pump to move the heat into buildings to keep them warm in colder months. Heat pumps typically replace heating systems such as boilers, furnaces, and electric resistance heaters. Many will also replace air conditioners, because the same pump can move heat out of a building in warmer months (see Five ways heat pumps are more awesome than you think). 

Description for Social and Search
Heat pumps are a Highly Recommended climate solution. They replace heating systems that burn fossil fuels; many can also provide cooling in hotter months.
Overview

Heat pumps use a refrigerant cycle to move heat. When the liquid refrigerant enters a low pressure environment, it absorbs heat from the surrounding air (air-source heat pumps), water, or ground (ground-source heat pumps) as it evaporates. When the refrigerant vapor is compressed, it condenses back into a liquid, releasing the stored heat into the building. By passing the refrigerant through this cycle, a heat pump can move heat from outside to inside a building. 

Absorbing heat from the outside gets more difficult as temperatures drop. However, modern cold-climate heat pumps are designed to work effectively at temperatures approaching –30 °C (–22 °F) (Gibb et al., 2023). The freezer in your home uses the same technology, moving heat out of the cold box into the warm room to keep your food frozen. In most systems, the refrigerant cycle in a heat pump can be reversed in warmer months, moving heat out of a building to ensure its occupants are comfortable year-round. 

Heat pumps are very efficient at using electricity for heating. This is because they move heat rather than generating heat (e.g., by combustion). For example, a heat pump may have a seasonal coefficient of performance (SCOP) of 3, meaning it can move an average of three units of heat energy for every unit of electrical energy that it consumes. Conventional combustion and electric resistance heaters cannot produce more than one unit of heat energy for every unit of fuel energy or electrical energy provided. 

Heat pump systems may be all-electric or hybrid, where a secondary fossil fuel-based heating system takes over in colder weather. 

A heat pump’s potential to reduce GHG emissions depends on the heating source it replaces and the emissions intensity of the electricity used to run it. When heat pumps replace fossil fuel-based heating, they displace the GHG emissions – primarily CO₂ – generated when the fuel is burned. When replacing electric resistance heaters, heat pumps reduce the GHG emissions from the electricity to power the system because heat pumps are much more energy efficient. As electrical grids decarbonize, the GHG emissions from operating heat pumps will decrease. 

All-electric heat pumps provide the most climate benefit because they can be powered with clean energy, but hybrid heat pumps also play an important emissions-reduction role. Hybrids consist of a smaller electric heat pump system that switches to fuel-based heating systems in colder weather. They may be attractive due to lower up-front costs and because they have lower peak power demand on cold days, but hybrids also have a smaller emissions impact. Our cost and emissions analyses assumed all-electric air-source heat pumps, while the data used in the adoption analysis included all types of heat pumps with the expectation that all-electric versions will dominate in the longer term. 

In this analysis, we calculated effectiveness and cost outcomes from specific countries with high heat-pump adoption (European countries, Canada, the United States, Japan, and China) to avoid comparing research studies that use different assumptions. The analysis used global assumptions for heating system efficiency: 90% for fueled systems (International Gas Union, 2019), 100% for electric resistance (U.S. Department of Energy [U.S. DOE], n.d.), and SCOP of 3 for heat pumps (Crownhart, 2023). We also assumed all existing fueled systems use natural gas, which is currently the dominant fossil fuel used for space heating globally (International Energy Agency [IEA], 2023b). The analysis did not include emissions or costs from cooling but did assume the heat pump is replacing both a heating and cooling system. 

The cost and effectiveness analyses focused on residential heating systems due to availability of data and also because large variations in the cost and size of commercial systems make it more challenging to estimate their global impacts. Commercial heating systems are typically larger than residential systems, and their emissions impacts are expected to be proportionally greater per unit. Cost savings may be different due the greater complexity of heating and cooling systems (Tejani & Toshniwal, 2023). Available data on heat pump adoption, on the other hand, typically include both residential and commercial units. Our adoption analysis therefore included both residential and commercial buildings, with greater adoption assumed in the residential sector. 

References

Air-Conditioning, Heating, and Refrigeration Institute. (2025). AHRI releases November 2024 U.S. heating and cooling equipment shipment data. Link to source: https://www.ahrinet.org/sites/default/files/Stat%20Release%20Nov%2024/November%202024%20Statistical%20Release.pdf 

Asahi, T. (2023, July 3). The role of heat pumps toward decarbonization [PowerPoint slides]. Japan Refrigeration and Air Conditioning Industry Association. Link to source: https://www.jraia.or.jp/english/relations/file/2023_July_OEWG45_JRAIA_side_event_Presentation_4.pdf 

Benz, S. A., & Burney, J. A. (2021). Widespread race and class disparities in surface urban heat extremes across the United States. Earth’s Future, 9(7), Article e2021EF002016. Link to source: https://doi.org/10.1029/2021EF002016 

Bloess, A., Schill, W.-P., & Zerrahn, A. (2018). Power-to-heat for renewable energy integration: A review of technologies, modeling approaches, and flexibility potentials. Applied Energy, 212, 1611–1626. Link to source: https://doi.org/10.1016/j.apenergy.2017.12.073 

Canadian Climate Institute. (2023). Heat pumps pay off [Report]. Link to source: https://climateinstitute.ca/wp-content/uploads/2023/09/Heat-Pumps-Pay-Off-Unlocking-lower-cost-heating-and-cooling-in-Canada-Canadian-Climate-Institute.pdf 

Carella, A., & D’Orazio, A. (2021). The heat pumps for better urban air quality. Sustainable Cities and Society, 75, Article 103314. Link to source: https://doi.org/10.1016/j.scs.2021.103314 

City of Vancouver. (n.d.). Climate change adaptation strategy [Report]. Retrieved September 2, 2025, from Link to source: https://vancouver.ca/files/cov/vancouver-climate-change-adaptation-strategy-2024-25.pdf 

Congedo, P. M., Baglivo, C., D’Agostino, D., & Mazzeo, D. (2023). The impact of climate change on air source heat pumps. Energy Conversion and Management, 276, Article 116554. Link to source: https://doi.org/10.1016/j.enconman.2022.116554 

Cooper, S. J. G., Hammond, G. P., McManus, M. C., & Pudjianto, D. (2016). Detailed simulation of electrical demands due to nationwide adoption of heat pumps, taking account of renewable generation and mitigation. IET Renewable Power Generation, 10(3), 380–387. Link to source: https://doi.org/10.1049/iet-rpg.2015.0127 

Crownhart, C. (2023, February 14). Everything you need to know about the wild world of heat pumps. MIT Technology Review. Link to source: https://www.technologyreview.com/2023/02/14/1068582/everything-you-need-to-know-about-heat-pumps/ 

Davis, L. W., & Hausman, C. (2022). Who will pay for legacy utility costs? Journal of the Association of Environmental and Resource Economists, 9(6), 1047-1085. Link to source: https://doi.org/10.1086/719793 

European Commission. (2022). REPowerEU: Joint European action for more affordable, secure and sustainable energy. Link to source: https://build-up.ec.europa.eu/en/resources-and-tools/publications/repowereu-joint-european-action-more-affordable-secure-and 

European Heat Pump Association. (2024, February 27). Heat pump sales fall by 5% while EU delays action. Link to source: https://www.ehpa.org/news-and-resources/news/heat-pump-sales-fall-by-5-while-eu-delays-action/ 

Gaur, A. S., Fitiwi, D. Z., & Curtis, J. (2021). Heat pumps and our low-carbon future: A comprehensive review. Energy Research & Social Science, 71, Article 101764. Link to source: https://doi.org/10.1016/j.erss.2020.101764 

Gibb, D., Rosenow, J., Lowes, R., & Hewitt, N. J. (2023). Coming in from the cold: Heat pump efficiency at low temperatures. Joule, 7(9), 1939–1942. Link to source: https://doi.org/10.1016/j.joule.2023.08.005 

Global Petrol Prices. (2024). Retail energy price data. Retrieved Feb 2, 2024, from Link to source: https://www.globalpetrolprices.com/ 

Intergovernmental Panel On Climate Change (Ed.). (2023). Climate change 2022: Mitigation of climate change. Working group III contribution to the sixth assessment report of the intergovernmental panel on climate change (1st ed.). Cambridge University Press. Link to source: https://doi.org/10.1017/9781009157926 

International Energy Agency. (2020). Sustainable recovery—World energy outlook special report (revised version). Link to source: https://iea.blob.core.windows.net/assets/c3de5e13-26e8-4e52-8a67-b97aba17f0a2/Sustainable_Recovery.pdf 

International Energy Agency. (2022). The future of heat pumps. Link to source: https://iea.blob.core.windows.net/assets/4713780d-c0ae-4686-8c9b-29e782452695/TheFutureofHeatPumps.pdf 

International Energy Agency. (2023a). Net zero roadmap: A global pathway to keep the 1.5 °C goal in reach—2023 update (revised version). Link to source: https://iea.blob.core.windows.net/assets/8ad619b9-17aa-473d-8a2f-4b90846f5c19/NetZeroRoadmap_AGlobalPathwaytoKeepthe1.5CGoalinReach-2023Update.pdf 

International Energy Agency. (2023b, June 15). Buildings-related energy demand for heating and share by fuel in the Net Zero Scenario 2022-2030. Link to source: https://www.iea.org/data-and-statistics/charts/buildings-related-energy-demand-for-heating-and-share-by-fuel-in-the-net-zero-scenario-2022-2030 

International Energy Agency. (2024). Clean energy market monitor. Link to source: https://iea.blob.core.windows.net/assets/d718c314-c916-47c9-a368-9f8bb38fd9d0/CleanEnergyMarketMonitorMarch2024.pdf 

International Energy Agency. (2025). Electricity 2025 (revised version). Link to source: https://iea.blob.core.windows.net/assets/0f028d5f-26b1-47ca-ad2a-5ca3103d070a/Electricity2025.pdf 

International Gas Union. (2019). Global gas insights 2019 gas & efficiency. Link to source: https://www.igu.org/advocacy/graphics-data/ggi-energy-efficiency 

International Renewable Energy Agency. (2022). Renewable solutions in end-uses: Heat pump costs and markets [Report]. Link to source: https://www.irena.org/-/media/Files/IRENA/Agency/Publication/2022/Nov/IRENA_Heat_Pumps_Costs_Markets_2022.pdf 

International Renewable Energy Agency. (2024). World energy transitions outlook 2024: 1.5°C pathway [Report]. Link to source: https://www.irena.org/-/media/Files/IRENA/Agency/Publication/2024/Nov/IRENA_World_energy_transitions_outlook_2024.pdf 

Jakob, M., Reiter, U., Krishnan, S., Louwen, A., & Junginger, M. (2020). Chapter 11 - Heating and cooling in the built environment. In M. Junginger & A. Louwen (Eds.), Technological learning in the transition to a low-carbon energy system (pp. 189–219). Academic Press. Link to source: https://doi.org/10.1016/B978-0-12-818762-3.00011-X  

Knobloch, F., Hanssen, S. V., Lam, A., Pollitt, H., Salas, P., Chewpreecha, U., Huijbregts, M. A. J., & Mercure, J.-F. (2020). Net emission reductions from electric cars and heat pumps in 59 world regions over time. Nature Sustainability, 3(6), 437–447. Link to source: https://doi.org/10.1038/s41893-020-0488-7 

Malmquist, A., Hjerpe, M., Glaas, E., Karlsson-Larsson, H., & Lassi, T. (2022). Elderly people’s perceptions of heat stress and adaptation to heat: An interview study. International Journal of Environmental Research and Public Health, 19(7), Article 3775. Link to source: https://doi.org/10.3390/ijerph19073775 

Mattiuzzi, C., & Lippi, G. (2020). Worldwide epidemiology of carbon monoxide poisoning. Human & Experimental Toxicology, 39(4), 387-392. Link to source: https://doi.org/10.1177/0960327119891214 

McDiarmid, H. (2023). An analysis of the impacts of all-electric heat pumps and peak mitigation technologies on peak power demand in Ontario [Report]. Ontario Clean Air Alliance. Link to source: https://www.cleanairalliance.org/wp-content/uploads/2023/12/Heat-Pump-Peak-Report-ONLINE-dec-11.pdf 

McDiarmid, H., & Parker, P. (2024). Retrofitting homes in Ontario entails significant embodied emissions: New policies needed. Climate Policy, 25(3), 388–400. Link to source: https://doi.org/10.1080/14693062.2024.2390520 

Renaldi, R., Hall, R., Jamasb, T., & Roskilly, A. P. (2021). Experience rates of low-carbon domestic heating technologies in the United Kingdom. Energy Policy, 156, Article 112387. Link to source: https://doi.org/10.1016/j.enpol.2021.112387 

Romanello, M., Walawender, M., Hsu, S.-C., Moskeland, A., Palmeiro-Silva, Y., Scamman, D., Ali, Z., Ameli, N., Angelova, D., Ayeb-Karlsson, S., Basart, S., Beagley, J., Beggs, P. J., Blanco-Villafuerte, L., Cai, W., Callaghan, M., Campbell-Lendrum, D., Chambers, J. D., Chicmana-Zapata, V., … Costello, A. (2024). The 2024 report of the Lancet Countdown on health and climate change: Facing record-breaking threats from delayed action. The Lancet, 404(10465), 1847–1896. Link to source: https://doi.org/10.1016/S0140-6736(24)01822-1 

Sandoval, N., Harris, C., Reyna, J. L., Fontanini, A. D., Liu, L., Stenger, K., White, P. R., & Landis, A. E. (2024). Achieving equitable space heating electrification: A case study of Los Angeles. Energy and Buildings, 317, Article 114422. Link to source: https://doi.org/10.1016/j.enbuild.2024.114422 

Sovacool, B. K., Evensen, D., Kwan, T. A., & Petit, V. (2023). Building a green future: Examining the job creation potential of electricity, heating, and storage in low-carbon buildings. The Electricity Journal, 36(5), Article 107274. Link to source: https://doi.org/10.1016/j.tej.2023.107274 

Tejani, A., & Toshniwal, V. (2023). Differential energy consumption patterns of HVAC systems in residential and commercial structures: A comparative study. International Journal of Advancements in Science & Technology, 1(3), 47–58. 

U.S. Department of Energy. (2022). Residential cold-climate heat pump technology challenge. Link to source: https://www.energy.gov/eere/buildings/articles/residential-cold-climate-heat-pump-technology-challenge-fact-sheet 

U.S. Department of Energy. (n.d.). Electric resistance heating. Retrieved September 2, 2025, from Link to source: https://www.energy.gov/energysaver/electric-resistance-heating 

U.S. Energy Information Administration. (2023). Updated buildings sector appliance and equipment costs and efficiencies [Report]. Link to source: https://www.eia.gov/analysis/studies/buildings/equipcosts/pdf/full.pdf 

Van Someren, C., Visser, M., & Slootweg, H. (2021). Impacts of electric heat pumps and rooftop solar panels on residential electricity distribution grids. 2021 IEEE PES Innovative Smart Grid Technologies Europe (ISGT Europe), 01–06. Link to source: https://doi.org/10.1109/ISGTEurope52324.2021.9640090 

Wilson, E. J. H., Munankarmi, P., Less, B. D., Reyna, J. L., & Rothgeb, S. (2024). Heat pumps for all? Distributions of the costs and benefits of residential air-source heat pumps in the United States. Joule, 8(4), 1000–1035. Link to source: https://doi.org/10.1016/j.joule.2024.01.022 

Zahiri, S., & Gupta, R. (2023). Examining the risk of summertime overheating in UK social housing dwellings retrofitted with heat pumps. Atmosphere, 14(11), Article 1617. Link to source: https://doi.org/10.3390/atmos14111617 

Zhang, Q., Zhang, L., Nie, J., & Li, Y. (2017). Techno-economic analysis of air source heat pump applied for space heating in northern China. Applied Energy, 207, 533–542. Link to source: https://doi.org/10.1016/j.apenergy.2017.06.083 

Zhou, M., Liu, H., Peng, L., Qin, Y., Chen, D., Zhang, L., & Mauzerall, D. L. (2022). Environmental benefits and household costs of clean heating options in northern China. Nature Sustainability, 5(4), 329–338. Link to source: https://doi.org/10.1038/s41893-021-00837-w 

Credits

Lead Fellow

  • Heather McDiarmid, Ph.D.

Contributors

  • Stephen Agyeman, Ph.D.

  • Ruthie Burrows, Ph.D.

  • James Gerber, Ph.D.

  • Sarah Gleeson, Ph.D.

  • Yusuf Jameel, Ph.D.

  • Daniel Jasper

  • Jason Lam

  • Cameron Roberts, Ph.D.

  • Alex Sweeney

  • Eric Wilczynski

Internal Reviewers

  • Aiyana Bodi

  • Hannah Henkin

  • Jason Lam

  • Zoltan Nagy, Ph.D.

  • Ted Otte

  • Amanda D. Smith, Ph.D.

Effectiveness

Our analysis showed that each all-electric residential heat pump for space heating reduces emissions by an average of 0.97 t CO₂‑eq /heat pump system/yr (20-yr and 100-yr basis, Table 1). 

Heat pumps reduce emissions by reducing the amount of fossil fuels burned for space heating or by reducing the use of less efficient electric resistance heating. Operating a heat pump generates no on-site emissions except refrigerant leaks, which are addressed by the Improve Refrigerant Management solution. Our analysis included the emissions from the electricity used to power heat pumps. Thus, the emissions reduction from heat pump adoption is expected to improve as electricity generation incorporates more renewable energy (Knobloch et al., 2020). 

There are significant regional differences in heat pump effectiveness due to the electricity mix, climate, and types of heating systems used today (Knobloch et al., 2020). The global average is weighted based on regional heating requirements and existing heating technologies. 

We did not quantify the reduction in pollutants such as nitrogen oxides, sulfur oxides, and particulate matter, which are released when fossil fuels are burned for space heating. We also refrained from estimating the global warming impacts of refrigerant leaks associated with the use of heat pumps, which is addressed by our Improve Refrigerant Management solution, or natural gas leaks associated with the use of fossil fuels for heating. 

Table 1. Effectiveness at reducing emissions from space heating.

Unit: t CO₂‑eq/heat pump system/yr, 100-yr basis

Mean 0.97
Left Text Column Width
Cost

A residential air-source heat pump has a mean initial installed cost of US$6,800 and an estimated US$540/yr operational cost for heating. Over a 15-year lifespan, this results in a net cost of US$990/yr. A heat pump generally replaces both a heating and cooling system with a combined mean installed cost of US$5,300. Operating a baseline heating system costs US$830/yr (operational cooling cost was not included in this analysis). Over a 15-year lifespan, the baseline case has a net cost of US$1,180/yr. This results in a net US$190 savings for households that switch to a heat pump. This translates to US$200 savings/t CO₂‑eq reduced (Table 2).

These values include the average annual cost to operate the equipment for heating and the annualized up-front cost of a heat pump relative to both a heating and cooling system that it replaces. There can be significant variability in the up-front cost of equipment based on the type of heat pump installed, the size of the building, and the climate in which it is designed to operate. We assumed the cost to operate the equipment for cooling to be the same with heat pumps and the air conditioners they replace. 

There are significant regional differences in the operational cost of heating systems due to climate, utility rates, and the heating systems in use today. The global average outcomes described here are weighted averages from Europe, Canada, the United States, China, and Japan based on regional heating requirements and existing heating technologies. 

Utility cost estimates are from June 2023 (Global Petrol Prices, 2024) and may vary substantially over time due to factors such as volatile fossil fuel prices, changing carbon prices, and heat pump incentives. Additional installation costs, such as upgrades to electrical systems, ductwork, or radiators, are not included. 

Table 2. Cost per unit climate impact. Negative values reflect cost savings.

Unit: 2023 US$/t CO₂‑eq , 100-yr basis

Mean –200
Left Text Column Width

Methods and Supporting Data

Learning Curve

Insufficient data exist to quantify the learning curve for heat pumps. 

The cost of installing a heat pump includes both equipment costs and the labor cost of installation. According to the U.S. Energy Information Administration ([U.S. EIA] 2023), retail equipment costs are 60–80% of the total installed cost of residential air-source heat pumps (central and ductless). 

Equipment costs can decrease with economies of scale and as local markets mature, but may be confounded by technological advances as well as equipment and/or refrigerant regulations that can also increase costs (IEA, 2022). European estimated learning rates for heat pump equipment costs range from 3.3% for ground-source heat pumps (Renaldi et al., 2021) to 18% for air-source heat pumps (Jakob et al., 2020). Ease and cost of installation is a research and development goal for manufacturers (IEA, 2022). 

The installed cost is also affected by rising labor costs and projected labor shortages (IEA, 2022). Renaldi et al. (2021) showed negative learning rates for the total installed costs in the United Kingdom due to increasing installation costs: –2.3% and –0.8% for air-source and ground-source heat pumps, respectively.

Heat pump manufacturer efforts to improve the performance of the technology may impact learning curves as well. In North America, the Residential Heat Pump Technology Challenge has supported the development of heat pumps with improved cold-climate performance (U.S. DOE, 2022). 

Speed of Action

Speed of action refers to how quickly a climate solution physically affects the atmosphere after it is deployed. This is different from speed of deployment, which is the pace at which solutions are adopted.

At Project Drawdown, we define the speed of action for each climate solution as emergency brake, gradual, or delayed.

Use Heat Pumps is a GRADUAL climate solution. It has a steady, linear impact on the atmosphere. The cumulative effect over time builds as a straight line.

Caveats

Heat pumps can increase demand for electricity and can therefore increase demand for fossil fuel-based power generation. In areas where power generation relies heavily on fossil fuels, heat pumps may generate more emissions than gas heating systems. As the electricity sector adopts more renewables and phases out fossil fuel-based generation, the emissions impact of heat pumps will decrease. Once a building has been designed or retrofitted to accommodate a heat pump it is likely that new heat pumps will be installed at the end of equipment life, perpetuating the benefit.

Efforts are underway to retrofit buildings by improving insulation, air-sealing, and upgrading windows. When done alongside heat pump adoption, retrofits can reduce the size of heat pump needed and increase total energy, emissions, and cost savings. 

As heat pump adoption grows, so too will the manufacture of refrigerants, some of which have high global warming potentials when they escape to the atmosphere. See Deploy Alternative Refrigerants and Improve Refrigerant Management solutions for more on accelerating change in this sector.

Current Adoption

Our analysis suggests that 130 million heat pumps for heating are currently in operation primarily based on data in Europe, Canada, the United States, China, and Japan (Table 3). These include both all-electric heat pumps and hybrid heat pumps. The IEA (2023a) estimated that 12% of global space heating demand was met by heat pumps in 2022. 

This value is based on market reports and national data sources plus IEA (2022) estimates of total GW of installed capacity. To convert installed capacity to the number of heat pumps, we used the median from the range of suggested average capacities (7.5 kW for Europe and North America, 4 kW in Japan and China, 5 kW global average). In Japan, where heat pump units typically heat only one room, we assumed 2.4 units per heat pump (International Renewable Energy Agency [IRENA], 2022).

Table 3. Current heat pump adoption level (2020–2022).

Unit: Heat pump systems in operation

Mean 130,000,000
Left Text Column Width
Adoption Trend

Our estimates put the median adoption trend at 17 million new all-electric and hybrid heat pumps in operation per year (Table 4). This analysis is based on product shipment data (used as a proxy for installed heat pumps), market reports, national statistics, and IEA data for growth in installed capacity. For the IEA data (2010–2023), we assumed a global average of 5 kW of heat capacity per heat pump unit (IEA, 2024).

Shipment and market analysis reports consistently show growing markets for heat pumps in much of the world (Asahi, 2023; European Heat Pump Association, 2024; IEA, 2024). In the United States, shipments of heat pumps have outnumbered gas furnaces since at least 2022 (Air-Conditioning, Heating, and Refrigeration Institute, 2025).

Table 4. Heat pump adoption trend (2010–2023).

Unit: Heat pump systems in operation/yr

25th percentile 12,000,000
Mean 15,000,000
Median (50th percentile) 17,000,000
75th percentile 18,000,000
Left Text Column Width
Adoption Ceiling

Our adoption ceiling is set at 1.200 billion heat pumps for space heating by 2050 (Table 5), most of which are expected to be in residential buildings. This is based on the IEA’s Net Zero Roadmap projection that heat pumps will represent 6,500 GW of heating capacity globally by 2050, covering 55% of space heating demand (IEA, 2023a). Our adoption ceiling assumes all-electric heat pumps cover all space heating demand. 

We assumed that average heat pump sizes (capacities) will increase over time as heat pumps cover a greater portion of a building’s heating load and as more commercial buildings with larger heating loads install heat pumps. Using a global average of 10 kW per heat pump, the IEA projections imply 650 million heat pumps will be in operation by 2050 with the technical adoption ceiling for 1,200 million heat pumps if all heating demand were met by heat pumps.

Table 5. Heat pump adoption ceiling: upper limit for adoption level.

Unit: Heat pump systems in operation by 2050

Mean 1,200,000,000
Left Text Column Width
Achievable Adoption

We estimate the achievable range for heat pump adoption to be 600–960 million heat pumps in operation by 2050 (Table 6).

Most existing space heating systems will be replaced at least once between now and 2050 because this equipment typically has lifetimes of 15–30 years (U.S. EIA, 2023). Policies that encourage high efficiency heat pumps alongside insulation upgrades have the potential to provide lifetime savings, greater comfort, and energy efficiency benefits (Wilson et al., 2024). Given the available timelines and potential benefits, near full adoption is technically feasible. 

We have set the Achievable – High heat pump adoption at 80% of the adoption ceiling to account for systems that are difficult to electrify due to very cold climates, policy, economic barriers, and grid constraints. This high achievable value assumes that some systems may be replaced before their end of life to meet climate and/or financial goals. 

We have set the Achievable – Low heat pump adoption at 50% of the adoption ceiling. This is roughly consistent with the current adoption trend continuing out to 2050. 

Our heat pump units adopted include both all-electric and hybrid heat pumps. This analysis assumes that hybrid heat pumps will become less common as fuels are phased out and that all-electric heat pumps will dominate by 2050. 

Table 6. Range of achievable adoption levels.

Unit: Heat pump systems installed

Current adoption 130,000,000
Achievable – low 600,000,000
Achievable – high 960,000,000
Adoption ceiling 1,200,000,000
Left Text Column Width

Our estimates show the global impact of existing heat pumps for space heating to be a reduction of 0.13 Gt CO₂‑eq/yr (100- and 20-yr basis) based on current adoption and today’s electricity grid emissions (Table 7). Because electricity grid emissions are decreasing for each kWh of electricity generated (IEA, 2025), the actual impact will be greater than our estimates when future electricity generation emissions are lower.

For the adoption ceiling, assuming heat pumps supply all of the IEA’s projected global heating demand in 2050 (IEA, 2023a), 1.2 Gt CO₂‑eq/yr (100- and 20-yr basis) could be avoided per year with today’s electricity grid emissions.

A high-end achievable target is 80% of the adoption ceiling, accounting for systems that might continue to use fossil fuels for heating due to factors such as cold climates, economic barriers, and grid constraints. This would result in avoiding 0.93 Gt CO₂‑eq/yr (100- and 20-yr basis) with today’s electricity grid emissions. 

A low-end achievable target is 50% of the adoption ceiling, roughly equivalent to heat pump adoption continuing at today’s rate. This would result in avoiding 0.58 Gt CO₂‑eq/yr (100- and 20-yr basis) with today’s electricity grid emissions. 

Table 7. Climate impact at different levels of heat pump systems adoption.

Unit: Gt CO₂‑eq/yr, 100-yr basis

Current adoption 0.13
Achievable – low 0.58
Achievable – high 0.93
Adoption ceiling 1.2
Left Text Column Width
Additional Benefits

Heat Stress

Heat waves and extreme heat are becoming increasingly significant factors of morbidity and mortality worldwide (Romanello et al., 2024). Some buildings that replace heating systems with heat pumps will gain access to cooling (Congedo et al., 2023; Wilson et al., 2024; Zhang et al., 2017; also see Let’s turbo-boost heat pump sales by making heat pumps the default for cooling). This can provide protection from heat stress in regions experiencing increasingly hotter summers (where air conditioning was not previously necessary) and for populations that are vulnerable to heat stress, such as the elderly (Malmquist et al., 2022). Some jurisdictions incentivize heat pumps for this reason. For example, the United Kingdom plans to install 600,000 heat pumps by 2028 (Zahiri & Gupta, 2023), and local climate adaptation plans in Canada recommend the installation of heat pumps to provide space cooling that can reduce morbidity and mortality during heat waves (Canadian Climate Institute, 2023; City of Vancouver, n.d.). Because exposure to extreme heat is disproportionately higher for minority communities – particularly in urban environments – access to cooling has important implications for environmental justice (Benz & Burney, 2021). 

Income and Work

Installing heat pumps can lead to greater household savings on electricity. Research has shown that across the United States, heat pumps can reduce electricity bills for 49 million homes with an average savings of US$350–600 per year, depending on the efficiency of the heat pump (Wilson et al., 2024). Wilson et al. (2024) found that higher efficiency heat pumps could be cost-effective for about 65 million households in the United States. Heat pumps also create jobs (Sovacool et al., 2023). In its post-COVID-19 recovery plan, the IEA (2020) estimated that every US$1 million investment in heat pumps could generate 9.1 new jobs and reduce 0.8 jobs in the fossil fuel industry. About half of the new jobs will be in manufacturing, with the remaining distributed between installation and maintenance.

Health

Burning fossil fuels for heating directly emits health-harming particulates and can generate carbon monoxide. Replacing fossil gas heating with heat pumps can reduce air pollution (Carella & D’Orazio, 2021) and contribute to improving health outcomes (Zhou et al., 2022). A study in China showed that as the power grid moves to incorporate renewable energy, the air quality and health benefits of heat pumps will increasingly outweigh the benefits of gas heaters (Zhou et al., 2022). The risk of carbon monoxide poisoning also decreases in buildings that switch from fuel-burning space heating to heat pumps. In buildings that burn fuels for applications such as space heating, carbon monoxide can pose serious health risks, including poisoning and death (Mattiuzzi & Lippi, 2020). 

Risks

Heat pumps contain refrigerants that often have high global warming potentials. Refrigerant leaks can occur during installation, operation, and end of life (McDiarmid & Parker, 2024). As more heat pumps are adopted, there is a risk of increased emissions from refrigerant leaks during operation as well as refrigerant release at the end of equipment life. Alternate refrigerants with lower global warming potentials are being phased in due to an international agreement to reduce hydrofluorocarbons, including many refrigerants (Kigali Amendment). 

Higher rates of heat pump installation will require upscaling heat pump manufacturing and training, plus certification of skilled labor to install them. Skilled labor shortages are already creating bottlenecks for heat pump adoption in some countries, some of which can be met by reskilling other heating technicians (IEA, 2022).

Interactions with Other Solutions

Reinforcing

Advancements in heat pump technology will support the development and adoption of heat pump technology for industrial applications.

The increased adoption of heat pumps will increase the market for alternative refrigerants and refrigerant management.

Competing

Heat pumps reduce the emissions from heating and cooling buildings. This reduces the effectiveness of technologies that reduce heating and/or cooling demands.

Adoption of heat pumps for space heating is likely to generate seasonal peaks in power demand during cold days that may require building out extra generating capacity that decrease grid efficiency (Bloess et al., 2018). Heat pumps can compete with electric cars for power during peak times (Van Someren et al., 2021).

Dashboard

Solution Basics

heat pump systems

t CO₂-eq (100-yr)/unit/yr
0.97
units
Current 1.3×10⁸ 06.0×10⁸9.6×10⁸
Achievable (Low to High)

Climate Impact

Gt CO₂-eq (100-yr)/yr
Current 0.13 0.580.93
US$ per t CO₂-eq
-200
Gradual

CO₂ , CH₄, N₂O

Trade-offs

Enhanced grid infrastructure will be required to support widespread building electrification and the greater demand for electricity, especially on cold days when heat pumps are less efficient at moving heat (Cooper et al., 2016). Demand-side management, thermal storage, home batteries, bidirectional chargers, and greater adoption of ground-source heat pumps can all help to reduce this increased demand (Cooper et al., 2016; McDiarmid, 2023).

In general, heat pumps have higher up-front costs than do fueled alternatives but will save a building owner money over the lifetime of the system. This can create economic barriers to accessing the benefits of heat pumps, with low-income homeowners and renters who pay for their utilities being particularly vulnerable to being left behind in the transition (Sandoval et al., 2024). Equity advocates are also concerned that the cost of maintaining gas and other fossil fuel infrastructure may increasingly fall on lower-income building owners who struggle to afford the upfront cost of electrifying with heat pumps (Davis & Hausman, 2022). 

°C days
015,000

Space heating demand (18 °C basis)

Heating degree days are an indicator of total space-heating demand to maintain an indoor temperature above 18 °C. Here we show annual average heating degree days for the decade ending in 2025.

Copernicus Climate Change Service. (2023). ERA5 hourly data on single levels from 1940 to present [Data set]. Copernicus Climate Change Service (C3S) Climate Data Store (CDS). Retrieved January 13, 2026 from Link to source: https://doi.org/10.24381/cds.adbb2d47     

Hersbach, H., Bell, B., Berrisford, P., Hirahara, S., Horányi, A., Muñoz‐Sabater, J., Nicolas, J., Peubey, C., Radu, R., Schepers, D., Simmins, A., Soci, C., Abdalla, S., Abellan, X., Balsamo, G., Bechtold, P., Biavati, G., Bidlot, J., Bonavita, M., … Thépaut, J. N. (2020). The ERA5 global reanalysis. Quarterly Journal of the Royal Meteorological Society, 146(730), 1999–2049. Link to source: https://doi.org/10.1002/qj.3803  

°C days
015,000

Space heating demand (18 °C basis)

Heating degree days are an indicator of total space-heating demand to maintain an indoor temperature above 18 °C. Here we show annual average heating degree days for the decade ending in 2025.

Copernicus Climate Change Service. (2023). ERA5 hourly data on single levels from 1940 to present [Data set]. Copernicus Climate Change Service (C3S) Climate Data Store (CDS). Retrieved January 13, 2026 from Link to source: https://doi.org/10.24381/cds.adbb2d47     

Hersbach, H., Bell, B., Berrisford, P., Hirahara, S., Horányi, A., Muñoz‐Sabater, J., Nicolas, J., Peubey, C., Radu, R., Schepers, D., Simmins, A., Soci, C., Abdalla, S., Abellan, X., Balsamo, G., Bechtold, P., Biavati, G., Bidlot, J., Bonavita, M., … Thépaut, J. N. (2020). The ERA5 global reanalysis. Quarterly Journal of the Royal Meteorological Society, 146(730), 1999–2049. Link to source: https://doi.org/10.1002/qj.3803  

Maps Introduction

In this solution, heat pumps replace space-heating options that rely on fossil fuels. This primarily applies to North America, Asia, and Europe. Limited data are available for some regions, so this analysis focuses on European countries, Canada, the United States, Japan and China. 

The effectiveness of heat pumps at reducing GHG emissions is influenced by the heating needs of the region and the generation mix of the electricity grid. Areas with higher heating needs will generally show greater emissions reduction because more energy is needed to keep buildings warm. However, this is partially offset because heat pumps are less energy efficient on colder days. The local electricity grid mix matters because heat pumps are powered by electricity. Given the same outside temperature, regions with a largely emissions-free grid (e.g., France or Canada) will have higher emissions impacts from heat pump adoption than areas where electricity is  largely generated from fossil fuels (e.g., China). The type of heat pumps (all-electric vs. hybrid) best suited to each region depends on technological and economic factors.

Action Word
Use
Solution Title
Heat Pumps
Classification
Highly Recommended

Lawmakers and Policymakers

  • Introduce zero-carbon ready building codes, clearly designating heat pumps as the default for all new buildings.
  • Incentivize purchases with grants, loans, or tax rebates.
  • Increasing training and support for heat pump installers.
  • Expand the electrical grid and increase renewable energy generation.
  • Streamline permitting processes.
  • Incentivize complementary solutions such as better insulation, thermal storage, and air sealing.
  • Institute a clean heat standard (similar to a renewable energy standard) with a well-defined implementation timeline.
  • Launch performance labels for heating technology.
  • Roll out new energy efficiency programs.

Practitioners

  • Commit to zero-carbon construction, clearly designating heat pumps as the default for all new buildings.
  • Increase the available workforce by encouraging trade organizations to promote career and workforce development programs.
  • Design heat pumps that are simpler, faster, and cheaper to install.
  • Educate customers on the benefits and train them on usage.
  • Connect with users and early adopters to understand and adapt to consumer sentiment.
  • Create appealing incentives and financing programs.
  • Partner with builders and developers to improve product adoption and increase market demand for heat pumps.

Business Leaders

  • Commit to zero-carbon construction, clearly designating heat pumps as the default for all new buildings.
  • Deploy heat pumps in all owned and operated facilities.
  • Encourage building owners and managers to switch to heat pumps in leased facilities.
  • Promote the benefits of heat pumps and share government incentives with leased facilities and networks.
  • Encourage employees to reduce emissions at home by providing educational resources on the benefits of domestic heat pumps.

Further information:

Nonprofit Leaders

  • Advocate for zero-carbon construction and building codes that clearly designate heat pumps as the default for all new buildings.
  • Deploy heat pumps in owned and operated facilities.
  • Encourage building owners and managers to switch to heat pumps in leased facilities.
  • Educate businesses and communities on the benefits of installing heat pumps and any tax incentives in their region.
  • Advocate to policymakers for improved policies and incentives.
  • Educate community leaders on the need for adoption.

Investors

  • Commit to only finance zero-carbon construction with clear requirements for heat pumps as the default for all new development investments.
  • Deploy capital to efforts that improve heat pump performance and reduce material, installation, and maintenance costs.
  • Explore investment opportunities that address supply chain concerns.
  • Consider investments that mitigate non-manufacturing barriers to scaling.
  • Finance heat pump installations via low-interest loans.

Philanthropists and International Aid Agencies

  • Directly distribute heat pumps, prioritizing locations where heat pumps maximize emissions reductions, and improve housing affordability.
  • Advocate for zero-carbon construction and building codes that clearly designate heat pumps as the default for all new buildings.
  • Fund R&D efforts and competitions to improve technology, reduce costs, and address supply chain concerns.
  • Support consumer advocacy and education campaigns on heat pumps and how to maximize regulatory incentives.
  • Support training or incentive programs for distributors and installers.

Thought Leaders

  • Advocate for zero-carbon construction and building codes that clearly designate heat pumps as the default for all new buildings.
  • Highlight the need to transition away from fossil-fuel-fired heating.
  • Educate the public on the benefits of heat pumps and how they work.
  • Provide case studies that present successes and lessons learned.
  • Increase consumer comfort by including heat pumps in communication content on topics such as home remodeling and construction, technology, health, self-sufficiency, and personal finance.
  • Provide up-to-date user information on available models.

Technologists and Researchers

  • Identify safe, cost-effective, and suitable alternative refrigerants.
  • Design systems that require less refrigerant.
  • Work to increase the longevity of heat pumps.
  • Improve heat pumps’ efficiency and capacity at low temperatures as well as their ability to deliver higher temperature heat.
  • Research external social factors critical to adoption.
  • Identify appropriate methods for recycling and disposing of heat pumps and responsibly recovering their refrigerant chemicals at the end of the product life cycle. 

Further information:

Communities, Households, and Individuals

  • Install heat pumps when possible and encourage local heating, ventilation, and air conditioning (HVAC) retailers and installers to sell services and equipment.
  • Increase consumer comfort by sharing your experience and tips for troubleshooting technologies.
  • Advocate for zero-carbon construction and building codes that clearly designate heat pumps as the default for all new buildings.
  • Build support networks for new users and connect to explore innovations.
  • Encourage your property management company, employers, and government officials to accelerate adoption. 

Further information:

Evidence Base

Consensus of effectiveness in reducing GHG emissions: High

Electric heat pumps are generally viewed as the primary strategy for reducing GHG emissions from buildings. The Intergovernmental Panel on Climate Change ([IPCC] 2023) noted that heat pumps drive electrification in buildings and help decrease emissions. The European Commission (2022) claimed that heat pumps are an essential way of decreasing reliance on gas in heating while increasing the use of renewable energy in the heating sector. The IEA (2022) reported that heat pumps powered by electricity generated with renewable energy “are the central technology in the global transition to secure and sustainable heating.” IRENA (2024) claimed heat pumps in buildings “will play a crucial role in reducing reliance on fossil fuels.” 

In one of the largest scientific reviews on the topic, Gaur et al. (2021) concluded that heat pumps “have the potential to play a substantial role in the transition to low carbon heating,” and noted that emissions impacts of heat pumps are dependent on the type of heat pump technology, their location, and the electricity grid mix. Knobloch et al. (2020) studied 59 world regions and found that electrification of the heating sector via heat pumps will reduce emissions in most world regions where they are adopted.

The results presented in this document summarize findings from 46 reports, reviews and meta-analyses and 13 original studies reflecting current evidence from 30 countries, primarily European countries, Canada, the United States, Japan, and China. We recognize this limited geographic and technology scope creates bias, and hope this work inspires research and data sharing on this topic in underrepresented regions and in the commercial sector.

Updated Date
Coming Soon Label
Coming Soon
Subscribe to Heat stress