Use Heat Pumps

Image
Image
Peatland
Coming Soon
On
Summary

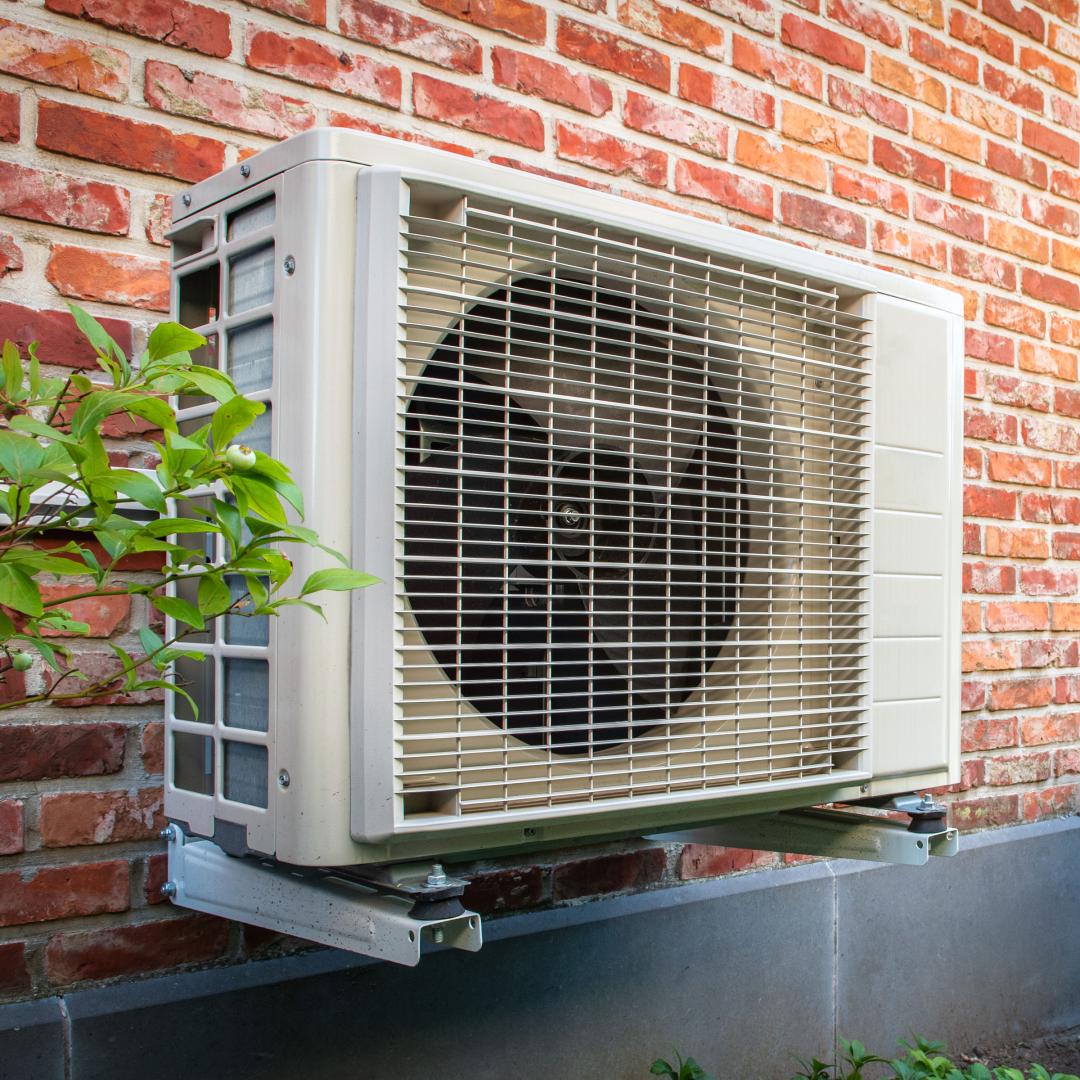
Heat pumps use electricity to efficiently move heat from one place to another. This solution focuses on the replacement of fossil fuel-based heating systems with electric heat pumps. Heat pumps are remarkably efficient because they collect heat from the outside air, ground, or water using a refrigerant and use a pump to move the heat into buildings to keep them warm in the colder months. Heat pumps typically replace heating systems such as boilers, furnaces, and electric resistance heaters and many will also replace air conditioners, because the same pump can move heat out of a building in the warmer months. 

Description for Social and Search
Heat pumps are a highly recommended climate solution. They replace heating systems that burn fossil fuels to reduce emissions; many can also provide cooling in hotter months.
Overview

Heat pumps use a refrigerant cycle to move heat. When the liquid refrigerant enters a low pressure environment, it will absorb heat from the surrounding air, water, or ground as it evaporates. When the refrigerant vapor is compressed, it will condense back into a liquid, releasing the stored heat into the building. By passing the refrigerant through this cycle, heat can be moved from outside to inside a building. Absorbing heat from the outside gets more difficult as temperatures drop but modern cold climate heat pumps are designed to work effectively at temperatures approaching –30°C (–22°F) (Gibb et al., 2023). The freezer in your home uses the same technology, moving heat out of the cold box into the warm room to keep your food frozen. In most systems, the refrigerant cycle in a heat pump can be reversed in the warmer months, moving heat out of a building to ensure its occupants are comfortable year-round. 

Heat pumps are very efficient at using electricity for heating. This is because they move heat rather than generating heat (e.g., by combustion). For example, a heat pump may have a seasonal coefficient of performance (SCOP) of three, meaning it can move an average of three units of heat energy for every unit of electrical energy that it consumes. Conventional combustion and electric resistance heaters cannot produce more than one unit of heat energy for every unit of fuel energy or electrical energy provided. 

Heat pump systems may be all-electric or hybrid, where a secondary fossil fuel-based heating system takes over in colder weather. 

A heat pump’s potential to reduce GHG emissions depends on the heating source it replaces and the emissions intensity of the electricity used to run it. When heat pumps replace fossil fuel-based heating, they displace the GHG emissions – primarily CO₂ – generated when the fuel is burned. When replacing electric resistance heaters, heat pumps reduce the GHG emissions from the electricity to power the system because heat pumps are much more energy efficient. As electrical grids decarbonize, the GHG emissions from operating heat pumps will decrease. 

All-electric heat pumps provide the most climate benefit because they can be powered with clean energy, but hybrid heat pumps also play an important emissions-reduction role. Hybrids consist of a smaller electric heat pump system that switches to fuel-based heating systems in colder weather. They may be attractive due to lower upfront costs and because they have lower peak power demand on cold days, but hybrids also have a smaller emissions impact. The cost and emissions analysis assumed all-electric air-source heat pumps while the data used in the adoption analysis included all types of heat pumps with the expectation that all-electric versions will dominate in the longer term. 

In this analysis, we calculated effectiveness and cost outcomes from specific countries with high heat pump adoption (European countries, Canada, the United States, Japan, and China) to avoid comparing research studies that use different assumptions. The analysis used global assumptions for heating system efficiency: 90% for fueled systems (International Gas Union, 2020), 100% for electric resistance (U.S. Department of Energy [U.S. DOE], n.d.), and SCOP of three for heat pumps (Crownhart, 2023). We also assumed all existing fueled systems use natural gas, which is currently the dominant fossil fuel used for space heating globally (International Energy Agency [IEA], 2023b). The analysis does not include emissions or costs from cooling but does assume the heat pump is replacing both a heating and cooling system. 

The cost and effectiveness analysis focused on residential heating systems for which more data are available and also because large variations in the cost and size of commercial systems make it more challenging to estimate their global impacts. Commercial heating systems are typically larger and their emissions impacts are expected to be proportionally greater per unit. Cost savings may be different due the greater complexity of heating and cooling systems (Tejani & Toshniwal, 2023). Available data on heat pump adoption, on the other hand, typically include both residential and commercial units. Our adoption analysis therefore included both residential and commercial buildings, with greater adoption assumed in the residential sector. 

Air-Conditioning, Heating, and Refrigeration Institute. (2025). AHRI releases November 2024 US heating and cooling equipment shipment data. Link to source: https://www.ahrinet.org/sites/default/files/Stat%20Release%20Nov%2024/November%202024%20Statistical%20Release.pdf 

Asahi, T. (2023, July 3). The role of heat pumps toward decarbonization [Power Point Presentation]. Japan Refrigeration and Air Conditioning Industry Association. Link to source: https://www.jraia.or.jp/english/relations/file/2023_July_OEWG45_JRAIA_side_event_Presentation_4.pdf 

Benz, S. A., & Burney, J. A. (2021). Widespread race and class disparities in surface urban heat extremes across the United States. Earth’s Future, 9(7), e2021EF002016. Link to source: https://doi.org/10.1029/2021EF002016 

Bloess, A., Schill, W.-P., & Zerrahn, A. (2018). Power-to-heat for renewable energy integration: A review of technologies, modeling approaches, and flexibility potentials. Applied Energy, 212, 1611–1626. Link to source: https://doi.org/10.1016/j.apenergy.2017.12.073 

Canadian Climate Institute. (2023). Heat pumps pay off. Canadian Climate Institute. Link to source: https://climateinstitute.ca/wp-content/uploads/2023/09/Heat-Pumps-Pay-Off-Unlocking-lower-cost-heating-and-cooling-in-Canada-Canadian-Climate-Institute.pdf 

Carella, A., & D’Orazio, A. (2021). The heat pumps for better urban air quality. Sustainable Cities and Society, 75, 103314. Link to source: https://doi.org/10.1016/j.scs.2021.103314 

City of Vancouver. (n.d.). Climate change adaptation strategy. City of Vancouver. Link to source: https://vancouver.ca/files/cov/vancouver-climate-change-adaptation-strategy-2024-25.pdf 

Congedo, P. M., Baglivo, C., D’Agostino, D., & Mazzeo, D. (2023). The impact of climate change on air source heat pumps. Energy Conversion and Management, 276, 116554. Link to source: https://doi.org/10.1016/j.enconman.2022.116554 

Cooper, S. J. G., Hammond, G. P., McManus, M. C., & Pudjianto, D. (2016). Detailed simulation of electrical demands due to nationwide adoption of heat pumps, taking account of renewable generation and mitigation. IET Renewable Power Generation, 10(3), 380–387. Link to source: https://doi.org/10.1049/iet-rpg.2015.0127 

Crownhart, C. (2023, February 14). Everything you need to know about the wild world of heat pumps. MIT Technology Review. Link to source: https://www.technologyreview.com/2023/02/14/1068582/everything-you-need-to-know-about-heat-pumps/ 

Davis, L. W., & Hausman, C. (2022). Who will pay for legacy utility costs? Journal of the Association of Environmental and Resource Economists. Link to source: https://doi.org/10.1086/719793 

European Commission. (2022). REPowerEU: joint European action for more affordable, secure and sustainable energy. Link to source: https://build-up.ec.europa.eu/en/resources-and-tools/publications/repowereu-joint-european-action-more-affordable-secure-and 

European Heat Pump Association. (2024). Heat pump sales fall by 5% while EU delays action. European Heat Pump Association. Link to source: https://www.ehpa.org/news-and-resources/news/heat-pump-sales-fall-by-5-while-eu-delays-action/ 

Gaur, A. S., Fitiwi, D. Z., & Curtis, J. (2021). Heat pumps and our low-carbon future: A comprehensive review. Energy Research & Social Science, 71, 101764. Link to source: https://doi.org/10.1016/j.erss.2020.101764 

Gibb, D., Rosenow, J., Lowes, R., & Hewitt, N. J. (2023). Coming in from the cold: Heat pump efficiency at low temperatures. Joule, 7(9), 1939–1942. Link to source: https://doi.org/10.1016/j.joule.2023.08.005 

GlobalPetrolPrices. (2023). Energy prices around the world. GlobalPetrolPrices.Com. Link to source: https://www.globalpetrolprices.com/ 

Intergovernmental Panel On Climate Change (IPCC) (Ed.). (2023). Climate change 2022 - Mitigation of climate change: Working group III contribution to the sixth assessment report of the Intergovernmental Panel on Climate Change (1st ed.). Cambridge University Press. Link to source: https://doi.org/10.1017/9781009157926 

International Energy Agency. (2020). Sustainable recovery—World energy outlook special report. International Energy Agency. Link to source: https://iea.blob.core.windows.net/assets/c3de5e13-26e8-4e52-8a67-b97aba17f0a2/Sustainable_Recovery.pdf 

International Energy Agency. (2022). The future of heat pumps. Link to source: https://iea.blob.core.windows.net/assets/4713780d-c0ae-4686-8c9b-29e782452695/TheFutureofHeatPumps.pdf 

International Energy Agency. (2023a). Net zero roadmap: A global pathway to keep the 1.5 °C goal in reach—2023 update. International Energy Agency. Link to source: https://iea.blob.core.windows.net/assets/8ad619b9-17aa-473d-8a2f-4b90846f5c19/NetZeroRoadmap_AGlobalPathwaytoKeepthe1.5CGoalinReach-2023Update.pdf 

International Energy Agency. (2023b, June 15). Builings-related energy demand for heating and share by fuel in the Net Zero Scenario 2022-2030. Link to source: https://www.iea.org/data-and-statistics/charts/buildings-related-energy-demand-for-heating-and-share-by-fuel-in-the-net-zero-scenario-2022-2030 

International Energy Agency. (2024). Clean energy market monitor. Link to source: https://iea.blob.core.windows.net/assets/d718c314-c916-47c9-a368-9f8bb38fd9d0/CleanEnergyMarketMonitorMarch2024.pdf 

International Energy Agency. (2025). Electricity 2025. Link to source: https://iea.blob.core.windows.net/assets/0f028d5f-26b1-47ca-ad2a-5ca3103d070a/Electricity2025.pdf 

International Gas Union. (2020). Global gas insights 2019 gas & efficiency. Link to source: https://www.igu.org/advocacy/graphics-data/ggi-energy-efficiency 

International Renewable Energy Agency. (2022). Renewable solutions in end-uses: Heat pump costs and markets. International Renewable Energy Agency.

International Renewable Energy Agency. (2024). World energy transitions outlook 2024: 1.5°C pathway. International Renewable Energy Agency.

Jakob, M., Reiter, U., Krishnan, S., Louwen, A., & Junginger, M. (2020). Chapter 11—Heating and cooling in the built environment. In M. Junginger & A. Louwen (Eds.), Technological Learning in the Transition to a Low-Carbon Energy System (pp. 189–219). Academic Press. Link to source: https://doi.org/10.1016/B978-0-12-818762-3.00011-X 

Kim, B., Lee, S. H., Lee, D., & Kim, Y. (2020). Performance comparison of heat pumps using low global warming potential refrigerants with optimized heat exchanger designs. Applied Thermal Engineering, 171, 114990. Link to source: https://doi.org/10.1016/j.applthermaleng.2020.114990 

Knobloch, F., Hanssen, S. V., Lam, A., Pollitt, H., Salas, P., Chewpreecha, U., Huijbregts, M. A. J., & Mercure, J.-F. (2020). Net emission reductions from electric cars and heat pumps in 59 world regions over time. Nature Sustainability, 3(6), 437–447. Link to source: https://doi.org/10.1038/s41893-020-0488-7 

Malmquist, A., Hjerpe, M., Glaas, E., Karlsson-Larsson, H., & Lassi, T. (2022). Elderly People’s Perceptions of Heat Stress and Adaptation to Heat: An Interview Study. International Journal of Environmental Research and Public Health, 19(7), 3775. Link to source: https://doi.org/10.3390/ijerph19073775 

Mattiuzzi, C., & Lippi, G. (2020). Worldwide epidemiology of carbon monoxide poisoning. Human and Experimental Toxicology, 39(4), 387-392. Link to source: https://doi.org/10.1177/0960327119891214 

McDiarmid, H. (2023). An analysis of the impacts of all-electric heat pumps and peak mitigation technologies on peak power demand in Ontario. Ontario Clean Air Alliance. Link to source: https://www.cleanairalliance.org/wp-content/uploads/2023/12/Heat-Pump-Peak-Report-ONLINE-dec-11.pdf 

McDiarmid, H., & Parker, P. (2024). Retrofitting homes in Ontario entails significant embodied emissions: New policies needed. Climate Policy, 25(3), 388–400. Link to source: https://doi.org/10.1080/14693062.2024.2390520 

Renaldi, R., Hall, R., Jamasb, T., & Roskilly, A. P. (2021). Experience rates of low-carbon domestic heating technologies in the United Kingdom. Energy Policy, 156, 112387. Link to source: https://doi.org/10.1016/j.enpol.2021.112387 

Romanello, M., Walawender, M., Hsu, S.-C., Moskeland, A., Palmeiro-Silva, Y., Scamman, D., Ali, Z., Ameli, N., Angelova, D., Ayeb-Karlsson, S., Basart, S., Beagley, J., Beggs, P. J., Blanco-Villafuerte, L., Cai, W., Callaghan, M., Campbell-Lendrum, D., Chambers, J. D., Chicmana-Zapata, V., … Costello, A. (2024). The 2024 report of the Lancet Countdown on health and climate change: Facing record-breaking threats from delayed action. The Lancet, 404(10465), 1847–1896. Link to source: https://doi.org/10.1016/S0140-6736(24)01822-1 

Sandoval, N., Harris, C., Reyna, J. L., Fontanini, A. D., Liu, L., Stenger, K., White, P. R., & Landis, A. E. (2024). Achieving equitable space heating electrification: A case study of Los Angeles. Energy and Buildings, 317, 114422. Link to source: https://doi.org/10.1016/j.enbuild.2024.114422 

Sovacool, B. K., Evensen, D., Kwan, T. A., & Petit, V. (2023). Building a green future: Examining the job creation potential of electricity, heating, and storage in low-carbon buildings. The Electricity Journal, 36(5), 107274. Link to source: https://doi.org/10.1016/j.tej.2023.107274 

Tejani, A., & Toshniwal, V. (2023). Differential energy consumption patterns of HVAC systems in residential and commercial structures: A comparative study. International Journal of Advancements in Science & Technology, 1(3), 47–58. Link to source: https://doi.org/DOI:10.56472/25839233/IJAST-V1I3P107 

U.S. Department of Energy. (2022). Residential cold-climate heat pump technology challenge. Link to source: https://www.energy.gov/eere/buildings/articles/residential-cold-climate-heat-pump-technology-challenge-fact-sheet 

U.S. Department of Energy. (n.d.). Electric resistance heating. US Department of Energy. Link to source: https://www.energy.gov/energysaver/electric-resistance-heating 

U.S. Energy Information Administration. (2023). Updated buildings sector appliance and equipment costs and efficiencies. US Energy Information Administration. Link to source: https://www.eia.gov/analysis/studies/buildings/equipcosts/pdf/full.pdf 

Van Someren, C., Visser, M., & Slootweg, H. (2021). Impacts of electric heat pumps and rooftop solar panels on residential electricity distribution grids. 2021 IEEE PES Innovative Smart Grid Technologies Europe (ISGT Europe), 01–06. Link to source: https://doi.org/10.1109/ISGTEurope52324.2021.9640090 

Wilson, E. J. H., Munankarmi, P., Less, B. D., Reyna, J. L., & Rothgeb, S. (2024a). Heat pumps for all? Distributions of the costs and benefits of residential air-source heat pumps in the United States. Joule, 8(4), 1000–1035. Link to source: https://doi.org/10.1016/j.joule.2024.01.022 

Wilson, E. J. H., Munankarmi, P., Less, B. D., Reyna, J. L., & Rothgeb, S. (2024b). Heat pumps for all? Distributions of the costs and benefits of residential air-source heat pumps in the United States. Joule, 8(4), Article 4. Link to source: https://doi.org/10.1016/j.joule.2024.01.022 

Zahiri, S., & Gupta, R. (2023). Examining the Risk of Summertime Overheating in UK Social Housing Dwellings Retrofitted with Heat Pumps. Atmosphere, 14(11), 1617. Link to source: https://doi.org/10.3390/atmos14111617 

Zhang, Q., Zhang, L., Nie, J., & Li, Y. (2017). Techno-economic analysis of air source heat pump applied for space heating in northern China. Applied Energy, 207, 533–542. Link to source: https://doi.org/10.1016/j.apenergy.2017.06.083 

Zhou, M., Liu, H., Peng, L., Qin, Y., Chen, D., Zhang, L., & Mauzerall, D. L. (2022). Environmental benefits and household costs of clean heating options in northern China. Nature Sustainability, 5(4), 329–338. Link to source: https://doi.org/10.1038/s41893-021-00837-w 

Credits

Lead Fellow

  • Heather McDiarmid, Ph.D.

Contributors

  • Stephen Agyeman, Ph.D.

  • Ruthie Burrows, Ph.D.

  • James Gerber, Ph.D.

  • Sarah Gleeson, Ph.D.

  • Yusuf Jameel, Ph.D.

  • Daniel Jasper

  • Jason Lam

  • Cameron Roberts, Ph.D.

  • Alex Sweeney

  • Eric Wilczynski

Internal Reviewers

  • Aiyana Bodi

  • Hannah Henkin

  • Jason Lam

  • Zoltan Nagy, Ph.D.

  • Ted Otte

  • Amanda D. Smith, Ph.D.

Effectiveness

Our analysis showed that each all-electric residential heat pump for space heating reduces emissions by an average of 0.95 t CO₂‑eq/yr per dwelling (20-yr and 100-yr basis, Table 1). 

Heat pumps reduce emissions by reducing the amount of fossil fuels burned for space heating or by reducing the use of less efficient electric resistance heating. Operating a heat pump generates no on-site emissions except refrigerant leaks which are addressed by the Improve Refrigerant Management solution. Our analysis included the emissions from the electricity used to power heat pumps. Thus, the emissions reduction from heat pump adoption is expected to improve as electricity generation incorporates more renewable energy (Knobloch et al., 2020). 

There are significant regional differences in heat pump effectiveness due to the electricity mix, climate, and types of heating systems used today (Knobloch et al., 2020). The global average is weighted based on regional heating requirements and existing heating technologies. 

We did not quantify the reduction in pollutants such as NOx, SOx, and particulate matter, which are released when fossil fuels are burned for space heating. We also refrained from estimating the global warming impacts of refrigerant leaks associated with the use of heat pumps, which is addressed by our Improve Refrigerant Management solution, or natural gas leaks associated with the use of fossil fuels for heating. 

left_text_column_width

Table 1. Effectiveness at reducing emissions from space heating.

Unit: t CO₂‑eq /heat pump/yr, 100-yr basis

mean 0.95
Left Text Column Width
Cost

A residential air-source heat pump has a mean initial installed cost of US$6,800 and an estimated US$540/yr operational cost for heating. Over a 15-yr lifespan, this results in a net cost of US$990/yr. A heat pump generally replaces both a heating and cooling system with a combined mean installed cost of US$5,300. Operating a baseline heating system costs US$830/yr (operational cooling cost not included in this analysis). Over a 15-year lifespan, the baseline case has a net cost of US$1,180/yr. This results in a net US$190 savings for households that switch to a heat pump. This translates to US$200 savings/yr/t CO₂‑eq reduced (Table 2).

These values include the average annual cost to operate the equipment for heating and the annualized upfront cost of a heat pump relative to both a heating and cooling system that it replaces. There can be significant variability in the upfront cost of equipment based on the type of heat pump installed, the size of the building, and the climate in which it is designed to operate. The cost to operate the equipment for cooling is assumed to be the same with heat pumps and the air conditioners they replace. 

There are significant regional differences in the operational cost of heating systems due to climate, utility rates, and the heating systems in use today. The global average outcomes described here are weighted averages from Europe, Canada, the United States, China, and Japan based on regional heating requirements and existing heating technologies. 

Utility cost estimates are from June 2023 (GlobalPetrolPrices, 2023) and may vary substantially over time due to factors such as volatile fossil fuel prices, changing carbon prices, and heat pump incentives. Additional installation costs, such as upgrades to electrical systems, ductwork, or radiators are not included. 

left_text_column_width

Table 2. Cost per heat pump climate impact (2023). Negative values reflect cost savings.

Unit: US$/t CO₂‑eq /heat pump/yr, 100-yr basis

mean -200
Left Text Column Width
Learning Curve

Insufficient data exist to quantify the learning curve for heat pumps. 

The cost of installing a heat pump includes both equipment costs and the labor cost of installation. According to the U.S. Energy Information Administration (2023), retail equipment costs are 60–80% of the total installed cost of residential air-source heat pumps (central and ductless). 

Equipment costs can decrease with economies of scale and as local markets mature, but may be confounded by technological advances as well as equipment and/or refrigerant regulations that can also increase costs (IEA, 2022). European estimated learning rates for heat pump equipment costs range from 3.3% for ground-source heat pumps (Renaldi et al., 2021) to 18% for air-source heat pumps (Jakob et al., 2020). Ease and cost of installation is a research and development goal for manufacturers (IEA, 2022). 

The installed cost is also affected by rising labor costs and projected labor shortages (IEA, 2022). Renaldi et al. (2021) showed negative learning rates for the total installed costs in the United Kingdom due to increasing installation costs: -2.3% and -0.8% for air-source and ground-source heat pumps, respectively.

Heat pump manufacturers are also looking to improve the performance of the technology which may impact learning curves. In North America, the Residential Heat Pump Technology Challenge has supported the development of heat pumps with improved cold climate performance (U.S. Department of Energy [U.S. DOE], 2022). 

left_text_column_width
Speed of Action

Speed of action refers to how quickly a climate solution physically affects the atmosphere after it is deployed. This is different from speed of deployment, which is the pace at which solutions are adopted.

At Project Drawdown, we define the speed of action for each climate solution as emergency brake, gradual, or delayed.

Use Heat Pumps is a GRADUAL climate solution. It has a steady, linear impact on the atmosphere. The cumulative effect over time builds as a straight line.

left_text_column_width
Caveats

Heat pumps can increase demands for electricity and can therefore increase demand for fossil fuel-based power generation. In areas where power generation relies heavily on fossil fuels, heat pumps may generate more emissions than gas heating systems. As the electricity sector adopts more renewables and phases out fossil fuel-based generation, the emissions impact of heat pumps will decrease. Once a building has been designed or retrofitted to accommodate a heat pump it is likely that new heat pumps will be installed at the end of equipment life, perpetuating the benefit.

Efforts are underway to retrofit buildings by improving the insulation, air-sealing and upgrading windows. When done alongside heat pump adoption, they can reduce the size of heat pump needed and increase total energy, emissions, and cost savings. 

As heat pump adoption grows, so too will the manufacture of refrigerants, some of which have high global warming potentials when they escape to the atmosphere. See Deploy Alternate Refrigerants and Improve Refrigerant Management solutions for more on accelerating change in this sector.

left_text_column_width
Current Adoption

Our analysis suggests that 130 million heat pumps for heating are currently in operation primarily based on data in Europe, Canada, the United States, China, and Japan (Table 3). These include both all-electric heat pumps and hybrid heat pumps. The IEA (2023a) estimated that 12% of global space heating demand was met by heat pumps in 2022. 

This value is based on market reports and national data sources plus IEA estimates of total GW of installed capacity (2022). To convert installed capacity to the number of heat pumps, we used the median from the range of suggested average capacities (7.5 kW for Europe and North America, 4 kW in Japan and China, 5 kW global average). In Japan, where heat pump units typically heat only one room, we assumed 2.4 units per heat pump (International Renewable Energy Agency, 2022).

left_text_column_width

Table 3. Current heat pump adoption level (2020-2022).

Unit: Heat pumps in operation

mean 130,000,000
Left Text Column Width
Adoption Trend

Our estimates put the average adoption trend at 15 million new all-electric and hybrid heat pumps in operation per year (see Table 4). This analysis is based on product shipment data (used as a proxy for installed heat pumps), market reports, national statistics, and IEA data for growth in installed capacity. For the IEA data (2010–2023), we assume a global average of 5 kW of heat capacity per heat pump unit (IEA, 2024).

Shipment and market analysis reports consistently show growing markets for heat pumps in much of the world (Asahi, 2023; European Heat Pump Association, 2024; IEA, 2024). In the United States, shipments of heat pumps have outnumbered gas furnaces since at least 2022 (Air-Conditioning, Heating, and Refrigeration Institute, 2025).

left_text_column_width

Table 4. Heat pump adoption trend (2010–2023).

Unit: Heat pumps in operation/yr

25th percentile 12,000,000
mean 15,000,000
median (50th percentile) 17,000,000
75th percentile 18,000,000
Left Text Column Width
Adoption Ceiling

Our adoption ceiling is set at 1.200 billion heat pumps for space heating by 2050 (see Table 5), most of which are expected to be in residential buildings. This is based on the IEA’s Net Zero Roadmap projection that heat pumps will represent 6,500 GW of heating capacity globally by 2050, covering 55% of space heating demand (IEA, 2023a, p. 98). Our adoption ceiling assumes all-electric heat pumps cover all space heating demand. 

We assumed that average heat pump sizes (capacities) will increase over time as heat pumps cover a greater portion of a building’s heating load and as more commercial buildings with larger heating loads install heat pumps. Using a global average of 10 kW per heat pump, the IEA projections imply 650 million heat pumps will be in operation by 2050 with the technical adoption ceiling for 1,200 million heat pumps if all heating demand were met by heat pumps.

left_text_column_width

Table 5. Heat pump adoption ceiling: upper limit for adoption level.

Unit: Heat pumps in operation by 2050

mean 1,200,000,000
Left Text Column Width
Achievable Adoption

We estimate the achievable range for heat pump adoption to be 600–960 million heat pumps in operation by 2050 (see Table 6).

Most existing space heating systems will be replaced at least once between now and 2050 because this equipment typically has lifetimes of 15–30 years (U.S. Energy Information Administration, 2023). Policies that encourage high efficiency heat pumps alongside insulation upgrades have the potential to provide lifetime savings, greater comfort, and energy efficiency benefits (Wilson et al., 2024a). Given the available timelines and potential benefits, near full adoption is technically feasible. 

We have set the high achievable heat pump adoption at 80% of the adoption ceiling to account for systems that are difficult to electrify due to very cold climates, policy, economic barriers, and grid constraints. This high achievable value assumes that some systems may be replaced before their end of life to meet climate and/or financial goals. 

We have set the low achievable heat pump adoption at 50% of the adoption ceiling. This is roughly consistent with the current adoption trend continuing out to 2050. 

Our heat pump units adopted include both all-electric and hybrid heat pumps that also rely on fuels for some heating. This analysis assumes that hybrid heat pumps will become less common with time as fuels are phased out and that all-electric heat pumps will dominate by 2050. 

left_text_column_width

Table 6. Range of achievable adoption levels.

Unit: Heat pumps installed

Current Adoption 130,000,000
Achievable – Low 600,000,000
Achievable – High 960,000,000
Adoption Ceiling 1,200,000,000
Left Text Column Width

Our estimates show the global impact of existing heat pumps for space heating to be a reduction of 0.12 Gt CO₂‑eq/yr (100- and 20-yr basis) based on current adoption and today’s electricity grid emissions (see Table 7). Because electricity grid emissions are decreasing for each kWh of electricity generated (IEA, 2025), the actual impact will be greater than our estimates when future electricity generation emissions are lower.

For the adoption ceiling, assuming heat pumps supply all of the IEA’s projected global heating demand in 2050 (International Energy Agency, 2023a), 1.1 Gt CO₂‑eq/yr (100- and 20-yr basis) could be avoided per year with today’s electricity grid. 

A high end achievable target is 80% of the adoption ceiling, accounting for systems that may continue to use fossil fuels for heating due to factors such as cold climates, economic barriers, and grid constraints. This would result in avoiding 0.91 Gt CO₂‑eq/yr (100- and 20-yr basis) with today’s electricity grid emissions. 

A low end achievable target is 50% of the adoption ceiling, roughly equivalent to heat pump adoption continuing at today’s rate. This would result in avoiding 0.57 Gt CO₂‑eq/yr (100- and 20-yr basis) with today’s electricity grid emissions. 

left_text_column_width

Table 7. Climate impact at different levels of heat pump adoption.

Unit: Gt CO₂‑eq/yr, 100-yr basis

Current Adoption 0.12
Achievable – Low 0.57
Achievable – High 0.91
Adoption Ceiling 1.1
Left Text Column Width
Additional Benefits

Heat Stress

Heatwaves and extreme heat are becoming increasingly significant factors of morbidity and mortality worldwide (Romanello et al., 2024). Some buildings that replace heating systems with heat pumps will gain access to cooling (Congedo et al., 2023; Wilson et al., 2024b; Zhang et al., 2017). This can provide protection from heat stress in regions experiencing increasingly hotter summers (where air conditioning was not previously necessary) and for populations that are vulnerable to heat stress, such as the elderly (Malmquist et al., 2022). Some jurisdictions incentivize heat pumps for this reason. For example, the United Kingdom plans to install 600,000 heat pumps by 2028 (Zahiri & Gupta, 2023) and local climate adaptation plans in Canada recommend the installation of heat pumps to provide space cooling that can mitigate morbidity and mortality during heat waves (Canadian Climate Institute, 2023; City of Vancouver, n.d.). Because exposure to extreme heat is disproportionately higher for minority communities – particularly in urban environments – access to cooling has important implications for environmental justice (Benz & Burney, 2021). 

Income and Work

Installing heat pumps can lead to greater household savings on electricity. Research has shown that across the United States, heat pumps can reduce electricity bills for 49 million homes with an average savings of US$350–600 per year, depending on the efficiency of the heat pump (Wilson et al., 2024). An analysis by Wilson et al. (2024a) found that higher efficiency heat pumps could be cost-effective for about 65 million households in the United States. Heat pumps also create jobs (Sovacool et al., 2023). In its post-COVID-19 recovery plan, the IEA (2020) estimated that every US$1 million investment in heat pumps could generate 9.1 new jobs and reduce 0.8 jobs in the fossil fuel industry. About half of the new jobs will be in manufacturing, with the remaining distributed between installation and maintenance.

Health

Burning fossil fuels for heating directly emits health-harming particulates and can generate carbon monoxide. Replacing fossil gas heating with heat pumps can reduce air pollution (Carella & D’Orazio, 2021) and contribute to improving health outcomes (Zhou et al., 2022). A study in China showed that as the power grid moves to incorporate renewable energy, the air quality and health benefits of heat pumps will increasingly outweigh the benefits of gas heaters (Zhou et al., 2022). The risk of carbon monoxide poisoning also decreases in buildings that switch from fuel-burning space heating to heat pumps. In buildings that burn fuels for applications such as space heating, carbon monoxide can pose serious health risks, including poisoning and death (Mattiuzzi and Lippi, 2020). 

left_text_column_width
Risks

Heat pumps contain refrigerants that often have high global warming potentials. Refrigerant leaks can occur during installation, operation, and end of life (McDiarmid & Parker, 2024). As more heat pumps are adopted, there is a risk of increased emissions from refrigerant leaks during operation as well as refrigerant release at the end of equipment life. Alternate refrigerants with lower global warming potentials are being phased in due to an international agreement to reduce hydrofluorocarbons, including many refrigerants (Kigali Amendment). 

Higher rates of heat pump installation will require upscaling heat pump manufacturing and training, plus certification of skilled labor to install them. Skilled labor shortages are already creating bottlenecks for heat pump adoption in some countries, some of which can be met by reskilling other heating technicians (IEA, 2022).

left_text_column_width
Interactions with Other Solutions

Reinforcing

Advancements in heat pump technology will support the development and adoption of heat pump technology for industrial applications. 

left_text_column_width

The increased adoption of heat pumps will increase the market for alternative refrigerants and refrigerant management.

left_text_column_width

Competing

Alternative refrigerants require design changes (Kim et al., 2020) that may increase the upfront cost of heat pumps.

left_text_column_width

Heat pumps may compete with alternatives such as fossil fuel-based district heating and cooling systems that lack heat pumps as well as low carbon biofuels.

left_text_column_width

Adoption of heat pumps for space heating is likely to generate seasonal peaks in power demand during cold days that may require building out extra generating capacity that decrease grid efficiency (Bloess et al., 2018). Heat pumps can compete with electric cars for power during peak times (Van Someren et al., 2021).

left_text_column_width
Dashboard

Solution Basics

heat pump system

t CO₂-eq (100-yr)/unit/yr
0.95
units
Current 1.3×10⁸ 06×10⁸9.6×10⁸
Achievable (Low to High)

Climate Impact

Gt CO₂-eq (100-yr)/yr
Current 0.12 0.570.91
US$ per t CO₂-eq
-200
Gradual

CO₂ , CH₄, N₂O, BC

Trade-offs

Enhanced grid infrastructure will be required to support widespread building electrification and the greater demand for electricity, especially on cold days when heat pumps are less efficient at moving heat (Cooper et al., 2016). Demand side management, thermal storage, home batteries, bidirectional chargers, and greater adoption of ground-source heat pumps can all help to mitigate this increased demand (Cooper et al., 2016; McDiarmid, 2023).

In general, heat pumps have higher upfront costs relative to fueled alternatives but will save a building owner money over the lifetime of the system. This can create economic barriers to accessing the benefits of heat pumps with low-income homeowners and renters who pay for their utilities being particularly vulnerable to being left behind in the transition (Sandoval et al., 2024). Equity advocates are also concerned that the cost of maintaining gas and other fossil fuel infrastructure may increasingly fall on lower-income building owners who struggle to afford the upfront cost of electrifying with heat pumps (Davis & Hausman, 2022). 

left_text_column_width
Action Word
Use
Solution Title
Heat Pumps
Classification
Highly Recommended
Lawmakers and Policymakers
  • Introduce zero-carbon ready building codes, clearly designating heat pumps as the default for all new buildings.
  • Incentivize purchases with grants, loans, or tax rebates.
  • Increasing training and support for heat pump installers.
  • Expand the electrical grid and increase renewable energy generation.
  • Streamline permitting processes.
  • Incentivize complementary solutions such as better insulation, thermal storage, and air sealing.
  • Institute a clean heat standard (similar to a renewable energy standard) with a well-defined implementation timeline.
  • Launch performance labels for heating technology.
  • Roll out new energy efficiency programs.
Practitioners
  • Commit to zero-carbon construction, clearly designating heat pumps as the default for all new buildings.
  • Increase the available workforce by encouraging trade organizations to promote career and workforce development programs.
  • Design heat pumps that are simpler, faster, and cheaper to install.
  • Educate customers on the benefits and train them on usage.
  • Connect with users and early adopters to understand and adapt to consumer sentiment.
  • Create appealing incentives and financing programs.
  • Partner with builders and developers to improve product adoption and increase market demand for heat pumps.
Business Leaders
  • Commit to zero-carbon construction, clearly designating heat pumps as the default for all new buildings.
  • Deploy heat pumps in all owned and operated facilities.
  • Encourage building owners and managers to switch to heat pumps in leased facilities.
  • Promote the benefits of heat pumps and share government incentives with leased facilities and networks.
  • Encourage employees to reduce emissions at home by providing educational resources on the benefits of domestic heat pumps.

Further information:

Nonprofit Leaders
  • Advocate for zero-carbon construction and building codes that clearly designate heat pumps as the default for all new buildings.
  • Deploy heat pumps in owned and operated facilities.
  • Encourage building owners and managers to switch to heat pumps in leased facilities
  • Educate businesses and communities on the benefits of installing heat pumps and any tax incentives in their region.
  • Advocate to policymakers for improved policies and incentives.
  • Educate community leaders on the need for adoption.
Investors
  • Commit to only finance zero-carbon construction with clear requirements for heat pumps as the default for all new development investments.
  • Deploy capital to efforts that improve heat pump performance and reduce material, installation, and maintenance costs.
  • Explore investment opportunities that address supply chain concerns.
  • Consider investments that mitigate non-manufacturing barriers to scaling.
  • Finance heat pump installations via low-interest loans.
Philanthropists and International Aid Agencies
  • Directly distribute heat pumps, prioritizing locations where heat pumps maximize emissions reductions and improve housing affordability.
  • Advocate for zero-carbon construction and building codes that clearly designate heat pumps as the default for all new buildings.
  • Fund R&D efforts and competitions to improve technology, reduce costs, and address supply chain concerns.
  • Support consumer advocacy and education campaigns on heat pumps and how to maximize regulatory incentives.
  • Support training or incentive programs for distributors and installers.
Thought Leaders
  • heat pumps as the default for all new buildings.
  • Highlight the need to transition away from fossil-fuel-fired heating.
  • Educate the public on the benefits of heat pumps and how they work.
  • Provide case studies that present successes and lessons learned.
  • Increase consumer comfort by including heat pumps in communication content on topics such as home remodeling and construction, technology, health, self-sufficiency, and personal finance.
  • Provide up-to-date user information on available models.
Technologists and Researchers
  • Identify safe, cost-effective, and suitable alternative refrigerants.
  • Design systems that require less refrigerant.
  • Work to increase the longevity of heat pumps.
  • Improve heat pumps’ efficiency and capacity at low temperatures as well as their ability to deliver higher temperature heat.
  • Research external social factors critical to adoption.
  • Identify appropriate methods for recycling and disposing of heat pumps and responsibly recovering their refrigerant chemicals at the end of the product life cycle. 
Communities, Households, and Individuals
  • Install heat pumps when possible and encourage local HVAC retailers and installers to sell services and equipment.
  • Increase consumer comfort by sharing your experience and tips for troubleshooting technologies.
  • Advocate for zero-carbon construction and building codes that clearly designate heat pumps as the default for all new buildings.
  • Build support networks for new users and connect to explore innovations.
  • Encourage your property management company, employers, and government officials to accelerate adoption. 

Further information:

Evidence Base

Consensus of Effectiveness in Reducing Emissions: High

Electric heat pumps are generally viewed as the primary strategy for reducing GHG emissions from buildings. The Intergovernmental Panel on Climate Change ([IPCC] 2023) noted that heat pumps drive electrification in buildings and help decrease emissions. The European Commission (2022) claims that heat pumps are an essential way of decreasing reliance on gas in heating while increasing the use of renewable energy in the heating sector. The IEA (2022) reported that heat pumps powered by electricity generated with renewable energy “are the central technology in the global transition to secure and sustainable heating.” The International Renewable Energy Agency ([IRENA] 2024) claimed heat pumps in buildings “will play a crucial role in reducing reliance on fossil fuels.” 

In one of the largest scientific reviews on the topic, Gaur et al. (2021) concluded that heat pumps “have the potential to play a substantial role in the transition to low carbon heating,” and noted that emissions impacts of heat pumps are dependent on the type of heat pump technology, their location, and the electricity grid mix. Knobloch et al. (2020) studied 59 world regions and found that electrification of the heating sector via heat pumps will reduce emissions in most world regions where they are adopted.

The results presented in this document summarize findings from 46 reports, reviews and meta-analyses and 13 original studies reflecting current evidence from 30 countries, primarily European countries, Canada, the United States, Japan, and China. We recognize this limited geographic and technology scope creates bias, and hope this work inspires research and data sharing on this topic in underrepresented regions and in the commercial sector.

left_text_column_width
Updated Date

Deploy Clean Cooking

Sector
Buildings
Image
Image
Family cooking on a clean stove indoors
Coming Soon
Off
Summary

We define the Deploy Clean Cooking solution as the use of cleaner cooking fuels (liquid petroleum gas, natural gas, electricity, biogas, and ethanol) in place of polluting fuels such as wood, charcoal, dung, kerosene, and coal, and/or the use of efficient cookstove technologies (together called cleaner cooking solutions). Replacing unclean fuel and cookstoves with cleaner approaches can drastically reduce GHG emissions while offering health and biodiversity benefits.

Description for Social and Search
Replacing unclean fuel and cookstoves with cleaner approaches can drastically reduce GHG emissions while offering health and biodiversity benefits.
Overview

Worldwide, cooking is responsible for an estimated 1.7 Gt CO₂‑eq/yr (100-yr basis), (World Health Organization [WHO], 2023), or almost 3% of annual global emissions. Most of these emissions come from burning nonrenewable biomass fuels. Only the CO₂‑eq on a 100-yr basis is reported here due to lack of data on the relative contributions of GHGs. The International Energy Agency (IEA, 2023a) states that 2.3 billion people in 128 countries currently cook with coal, charcoal, kerosene, firewood, agricultural waste, or dung over open fires or inefficient cookstoves because they do not have the ability to regularly cook using cleaner cooking solutions. Even when sustainably harvested, biomass fuel is not climate neutral because it emits methane and black carbon (Smith, 2002).

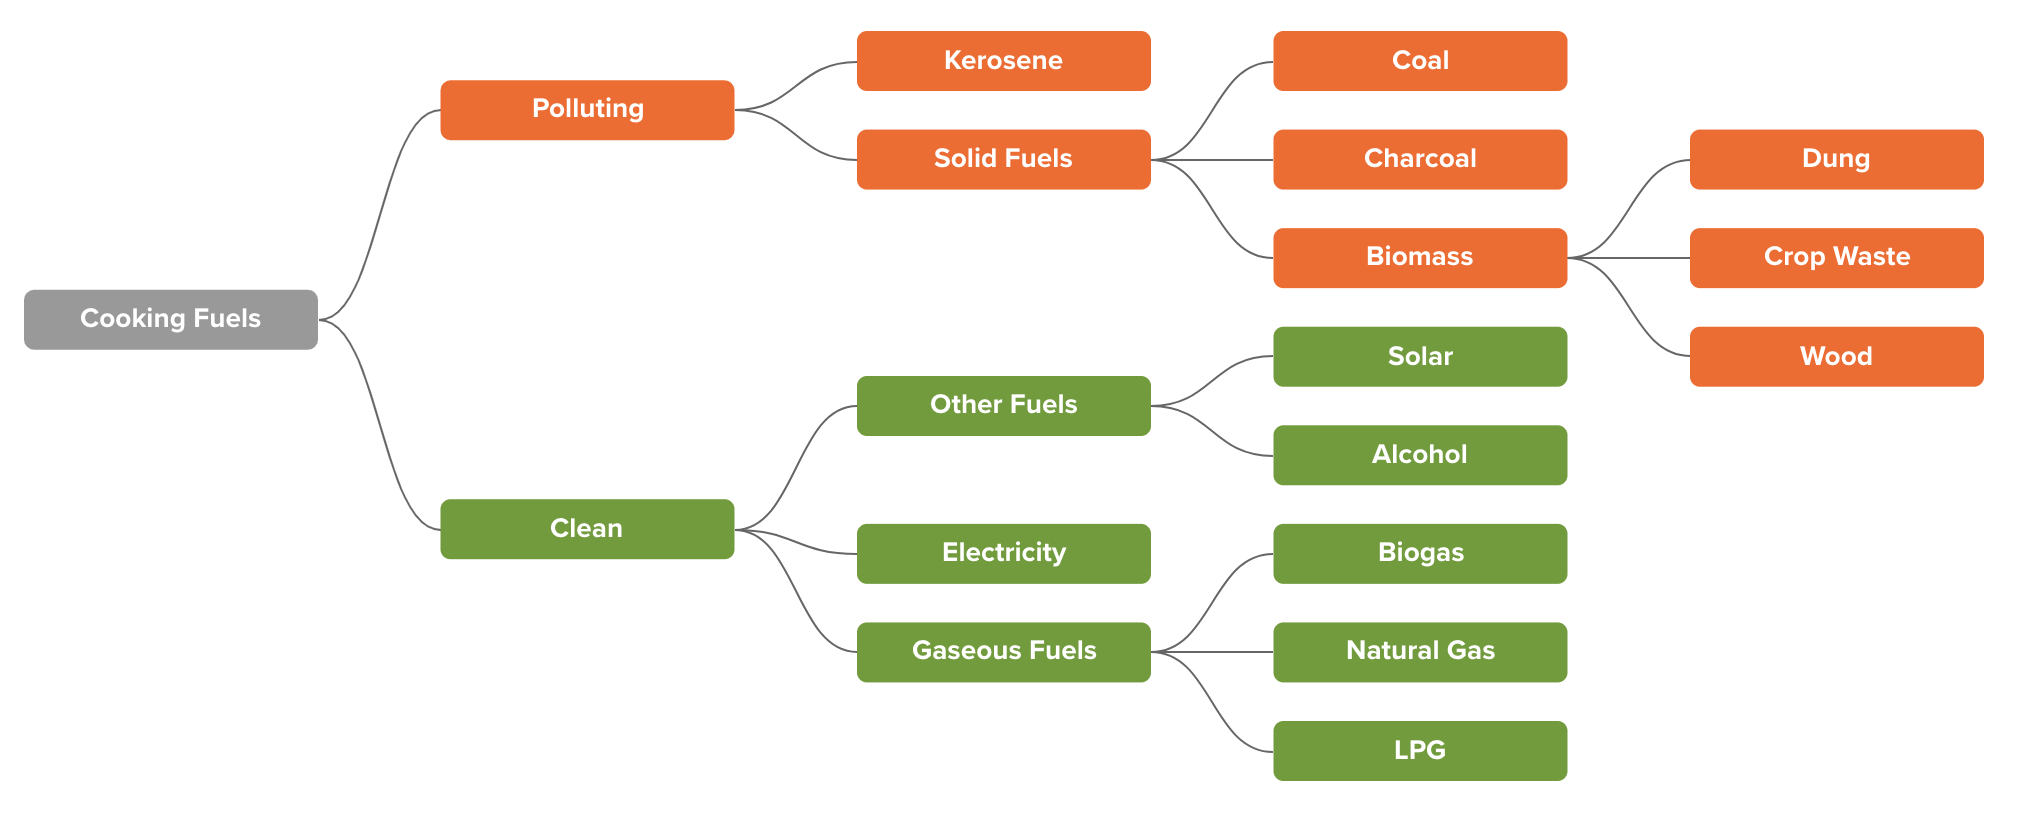
Clean cooking (Figure 1) reduces GHG emissions through three pathways: 

Improving Efficiency

Traditional biomass or charcoal cookstoves are less than 15% efficient (Khavari et al., 2023), meaning most generated heat is lost to the environment rather than heating the cooking vessel and food. Cleaner fuels and technologies can be many times more efficient, using less energy to prepare meals than traditional fuels and cookstoves (Kashyap et al., 2024). 

Reducing Carbon Intensity

Cleaner fuels have lower carbon intensity, producing significantly fewer GHG emissions per unit of heat generated than conventional fuels. Carbon intensity includes CO₂, methane, and nitrous oxide as well as black carbon. For instance, charcoal cookstoves emit approximately 572 kg CO₂‑eq /GJ of heat delivered for cooking (Cashman et al., 2016). In contrast, liquefied petroleum gas (LPG) and biogas emit about 292 and 11 kg CO₂‑eq /GJ, respectively (Cashman et al., 2016) and, excluding the embodied carbon, stoves that heat with electricity generated from renewable energy sources such as solar, wind, or hydroelectric have zero emissions.

Reducing Deforestation

Cleaner cooking also helps mitigate climate change by reducing deforestation (Clean Cooking Alliance [CCA], 2023) and associated GHG emissions. 

Figure 1. Classification of household cooking fuels as clean (green) and polluting (orange). Adapted from Stoner et al. (2021).

Image
Tree diagram listing types of fuels.

Source: Stoner, O., Lewis, J., Martínez, I. L., Gumy, S., Economou, T., & Adair-Rohani, H. (2021). Household cooking fuel estimates at global and country level for 1990 to 2030. Nature communications12(1), 5793.https://www.nature.com/articles/s41467-021-26036-x

Afrane, G., & Ntiamoah, A. (2011). Comparative life cycle assessment of charcoal, biogas, and liquefied petroleum gas as cooking fuels in Ghana. Journal of Industrial Ecology15(4), 539–549. Link to source: https://onlinelibrary.wiley.com/doi/abs/10.1111/j.1530-9290.2011.00350.x

Afrane, G., & Ntiamoah, A. (2012). Analysis of the life-cycle costs and environmental impacts of cooking fuels used in Ghana. Applied energy98, 301–306. Link to source: https://www.sciencedirect.com/science/article/abs/pii/S0306261912002590

Anenberg, S. C., Balakrishnan, K., Jetter, J., Masera, O., Mehta, S., Moss, J., & Ramanathan, V. (2013). Cleaner cooking solutions to achieve health, climate, and economic cobenefits. Link to source: https://pubs.acs.org/doi/10.1021/es304942e

Bailis, R., Drigo, R., Ghilardi, A., & Masera, O. (2015). The carbon footprint of traditional woodfuels. Nature Climate Change5(3), 266–272. Link to source: https://www.nature.com/articles/nclimate2491

Bensch, G., Jeuland, M., & Peters, J. (2021). Efficient biomass cooking in Africa for climate change mitigation and development. One Earth4(6), 879–890. Link to source: https://www.cell.com/one-earth/pdf/S2590-3322(21)00296-7.pdf

Bennitt, F. B., Wozniak, S. S., Causey, K., Burkart, K., & Brauer, M. (2021). Estimating disease burden attributable to household air pollution: new methods within the Global Burden of Disease Study. The Lancet Global Health9, S18. Link to source: https://doi.org/10.1016/S2214-109X(21)00126-1

Bergero, C., Gosnell, G., Gielen, D., Kang, S., Bazilian, M., & Davis, S. J. (2023). Pathways to net-zero emissions from aviation. Nature Sustainability6(4), 404–414. Link to source: https://www.nature.com/articles/s41893-022-01046-9

​​Biswas, S., & Das, U. (2022). Adding fuel to human capital: Exploring the educational effects of cooking fuel choice from rural India. Energy Economics, 105, 105744. Link to source: https://doi.org/10.1016/j.eneco.2021.105744 

Cabiyo, B., Ray, I., & Levine, D. I. (2020). The refill gap: clean cooking fuel adoption in rural India. Environmental Research Letters16(1), 014035. Link to source: https://iopscience.iop.org/article/10.1088/1748-9326/abd133

Cashman, S., Rodgers, M., & Huff, M. (2016). Life-cycle assessment of cookstove fuels in India and China. US Environmental Protection Agency, Washington, DC. EPA/600/R-15/325. Link to source: https://cleancooking.org/wp-content/uploads/2021/07/496-1.pdf

Clean Cooking Alliance (CCA). (2023). Accelerating clean cooking as a nature-based solution. Link to source: https://cleancooking.org/reports-and-tools/accelerating-clean-cooking-as-a-nature-based-climate-solution/

Clean Cooking Alliance. (2022). Clean cooking as a catalyst for sustainable food systemsLink to source: https://cleancooking.org/wp-content/uploads/2023/11/CCA_Clean-Cooking-as-a-Catalyst-for-Sustainable-Food-Systems.pdf

Climate & Clean Air Coalition. (2024). Nationally determined contributions and clean cooking. Link to source: https://www.ccacoalition.org/resources/nationally-determined-contributions-and-clean-cooking

Choudhuri, P., & Desai, S. (2021). Lack of access to clean fuel and piped water and children’s educational outcomes in rural India. World Development, 145, 105535. Link to source: https://doi.org/10.1016/j.worlddev.2021.105535 

Dagnachew, A. G., Lucas, P. L., van Vuuren, D. P., & Hof, A. F. (2018). Towards universal access to clean cooking solutions in sub-Saharan Africa. PBL Netherlands Environmental Assessment Agency. Link to source: https://www.pbl.nl/uploads/default/downloads/pbl-2019-clean-cooking-solutions-sub-saharan-africa_3421_0.pdf

Down to Earth. (2022). Ujjwala: Over 9 million beneficiaries did not refill cylinder last year, Centre admits. Retrieved 20 June 2024, from Link to source: https://www.downtoearth.org.in/energy/ujjwala-over-9-million-beneficiaries-did-not-refill-cylinder-last-year-centre-admits-84130

Energy Sector Management Assistance Program. (2023). Building evidence to unlock impact finance : A field assessment of lean cooking co-benefits for climate, health, and gender. Retrieved 13 September 2024, from Link to source: https://www.esmap.org/Building_Evidence_To_unloc_Impact_Finance_Benefits

Fullerton, D. G., Bruce, N., & Gordon, S. B. (2008). Indoor air pollution from biomass fuel smoke is a major health concern in the developing world. Transactions of the Royal Society of Tropical Medicine and Hygiene, 102(9), 843–851. Link to source: https://doi.org/10.1016/j.trstmh.2008.05.028 

Garland, C., Delapena, S., Prasad, R., L'Orange, C., Alexander, D., & Johnson, M. (2017). Black carbon cookstove emissions: A field assessment of 19 stove/fuel combinations. Atmospheric Environment169, 140–149. Link to source: https://doi.org/10.1016/j.atmosenv.2017.08.040

Gill-Wiehl, A., Kammen, D. M., & Haya, B. K. (2024). Pervasive over-crediting from cookstove offset methodologies. Nature Sustainability7(2), 191–202. Link to source: https://doi.org/10.1038/s41893-023-01259-6 

International Energy Agency. (2022). Africa energy outlook. Link to source: https://www.iea.org/reports/africa-energy-outlook-2022/key-findings

International Energy Agency. (2023a). A vision for clean cooking access for all. Link to source: https://iea.blob.core.windows.net/assets/f63eebbc-a3df-4542-b2fb-364dd66a2199/AVisionforCleanCookingAccessforAll.pdf 

International Energy Agency. (2023b). Electricity market report. Link to source: https://www.iea.org/reports/electricity-market-report-update-2023

Intergovernmental Panel on Climate Change. (2022). Climate change 2022: mitigation of climate change. Contribution of the Working Group III to the sixth assessment report of the Intergovernmental Panel on Climate Change. Link to source: https://www.ipcc.ch/report/ar6/wg3/

Jameel, Y., Patrone, C. M., Patterson, K. P., & West, P. C. (2022). Climate-poverty connections: Opportunities for synergistic solutions at the intersection of planetary and human well-being. Link to source: https://drawdown.org/publications/climate-poverty-connections-report

Jewitt, S., Atagher, P., & Clifford, M. (2020). “We cannot stop cooking”: Stove stacking, seasonality and the risky practices of household cookstove transitions in Nigeria. Energy Research & Social Science61, 101340. Link to source: https://www.sciencedirect.com/science/article/pii/S2214629619304700?via%3Dihub

Johnson, E. (2009). Charcoal versus LPG grilling: a carbon-footprint comparison. Environmental Impact Assessment Review29(6), 370–378. Link to source: https://www.sciencedirect.com/science/article/abs/pii/S0195925509000420

Kashyap, S. R., Pramanik, S., & Ravikrishna, R. V. (2024). A review of energy-efficient domestic cookstoves. Applied Thermal Engineering, 236, 121510. Link to source: https://doi.org/10.1016/j.applthermaleng.2023.121510

Kapsalyamova, Z., Mishra, R., Kerimray, A., Karymshakov, K., & Azhgaliyeva, D. (2021). Why energy access is not enough for choosing clean cooking fuels? Evidence from the multinomial logit model. Journal of Environmental Management290, 112539. Link to source: https://www.sciencedirect.com/science/article/pii/S0301479721006010

Khavari, B., Ramirez, C., Jeuland, M., & Fuso Nerini, F. (2023). A geospatial approach to understanding clean cooking challenges in sub-Saharan Africa. Nature Sustainability6(4), 447–457 Link to source: https://www.nature.com/articles/s41893-022-01039-8

Lacey, F. G., Henze, D. K., Lee, C. J., van Donkelaar, A., & Martin, R. V. (2017). Transient climate and ambient health impacts due to national solid fuel cookstove emissions. Proceedings of the National Academy of Sciences114(6), 1269–1274.Link to source: https://www.pnas.org/doi/full/10.1073/pnas.1612430114

Lansche, J., & Müller, J. (2017). Life cycle assessment (LCA) of biogas versus dung combustion household cooking systems in developing countries–a case study in Ethiopia. Journal of cleaner production165, 828–835. Link to source: https://www.sciencedirect.com/science/article/abs/pii/S0959652617315597

Lee, M., Chang, J., Deng, Q., Hu, P., Bixby, H., Harper, S., ... & Liu, J. (2024). Effects of a coal to clean heating policy on acute myocardial infarction in Beijing: a difference-in-differences analysis. The Lancet Planetary Health8(11), e924–e932. Link to source: https://doi.org/10.1016/S2542-5196(24)00243-2

Mazorra, J., Sánchez-Jacob, E., de la Sota, C., Fernández, L., & Lumbreras, J. (2020). A comprehensive analysis of cooking solutions co-benefits at household level: Healthy lives and well-being, gender and climate change. Science of The Total Environment707, 135968. Link to source: https://www.sciencedirect.com/science/article/abs/pii/S0048969719359637

Po, J. Y. T., FitzGerald, J. M., & Carlsten, C. (2011). Respiratory disease associated with solid biomass fuel exposure in rural women and children: Systematic review and meta-analysis. Thorax, 66(3), 232–239. Link to source: https://doi.org/10.1136/thx.2010.147884 

Rosenthal, J., Quinn, A., Grieshop, A. P., Pillarisetti, A., & Glass, R. I. (2018). Clean cooking and the SDGs: Integrated analytical approaches to guide energy interventions for health and environment goals. Energy for Sustainable Development42, 152–159. Link to source: https://www.sciencedirect.com/science/article/pii/S0973082617309857

Shankar, A. V., Quinn, A. K., Dickinson, K. L., Williams, K. N., Masera, O., Charron, D., ... & Rosenthal, J. P. (2020). Everybody stacks: Lessons from household energy case studies to inform design principles for clean energy transitions. Energy Policy141, 111468. Link to source: https://doi.org/10.1016/j.enpol.2020.111468

Simkovich, S. M., Williams, K. N., Pollard, S., Dowdy, D., Sinharoy, S., Clasen, T. F., ... & Checkley, W. (2019). A systematic review to evaluate the association between clean cooking technologies and time use in low-and middle-income countries. International journal of environmental research and public health16(13), 2277. Link to source: https://www.mdpi.com/1660-4601/16/13/2277

Singh, P., Gundimeda, H., & Stucki, M. (2014). Environmental footprint of cooking fuels: a life cycle assessment of ten fuel sources used in Indian households. The International Journal of Life Cycle Assessment19, 1036–1048. Link to source: https://link.springer.com/article/10.1007/s11367-014-0699-0

Smith, K. R. (2002). In praise of petroleum? Science298(5600), 1847–1847. DOI: 10.1126/science.298.5600.1847

Stoner, O., Lewis, J., Martínez, I. L., Gumy, S., Economou, T., & Adair-Rohani, H. (2021). Household cooking fuel estimates at global and country level for 1990 to 2030. Nature communications12(1), 5793.Link to source: https://www.nature.com/articles/s41467-021-26036-x

World Bank. (2018). A recipe for protecting the Democratic Republic of Congo’s tropical forests. Retrieved 16 January 2025, from Link to source: https://www.worldbank.org/en/news/feature/2018/01/24/a-recipe-for-protecting-the-democratic-republic-of-congos-tropical-forests

World Bank. (2020). Energy Sector Management Assistance Program. (2020). The state of access to modern energy cooking servicesLink to source: https://www.worldbank.org/en/topic/energy/publication/the-state-of-access-to-modern-energy-cooking-services

World Bank. (2023). Moving the needle on clean cooking for all. Retrieved 13 September 2024, from Link to source: https://www.worldbank.org/en/results/2023/01/19/moving-the-needle-on-clean-cooking-for-all

World Health Organization. (2025). Proportion of population with primary reliance on clean fuels and technologies. Retrieved 1, May 2025, from Link to source: https://www.who.int/data/gho/data/themes/air-pollution/household-air-pollution 

World Health Organization. (2023). Achieving universal access and net-zero emissions by 2050: a global roadmap for just and inclusive clean cooking transition. Link to source: https://www.who.int/publications/m/item/achieving-universal-access-by-2030-and-net-zero-emissions-by-2050-a-global-roadmap-for-just-and-inclusive-clean-cooking-transition

World Health Organization. (2024a). WHO publishes new global data on the use of clean and polluting fuels for cooking by fuel type. Retrieved 17 June 2024, Link to source: https://www.who.int/news/item/20-01-2022-who-publishes-new-global-data-on-the-use-of-clean-and-polluting-fuels-for-cooking-by-fuel-type#:~:text=As%20of%202021%2C%202.3%20billion,%2D%20and%20middle%2Dincome%20countries.

World Health Organization. (2024b). Household air pollution. Retrieved 17 June 2024, Link to source: https://www.who.int/news-room/fact-sheets/detail/household-air-pollution-and-health

Credits

Lead Fellow

  • Yusuf Jameel, Ph.D.

Contributors

  • Ruthie Burrows, Ph.D.

  • James Gerber, Ph.D.

  • Yusuf Jameel, Ph.D.

  • Daniel Jasper

  • Heather McDiarmid, Ph.D.

  • Amanda D. Smith, Ph.D.

  • Alex Sweeney

Internal Reviewers

  • Aiyana Bodi

  • Hannah Henkin

  • Megan Matthews, Ph.D.

  • Ted Otte

  • Amanda D. Smith, Ph.D.

  • Christina Swanson, Ph.D.

Effectiveness

The climate impact of cleaner cooking depends on which fuel and technology is being replaced and what is replacing it. The WHO (2023) categorizes cooking fuels as clean, transitional, or polluting based primarily on health impacts. Clean fuels include solar, electric, biogas, LPG, and alcohols, while kerosene and unprocessed coal are polluting fuels. Biomass cooking technologies may be classified as clean, transitional, or polluting depending on the levels of fine particulate matter and carbon monoxide produced. Switching from traditional cookstoves (polluting) to improved cookstoves (transitional) can reduce emissions 20–40%, while switching to an LPG or electric cookstove can reduce emissions more than 60% (Johnson, 2009). Not including the embodied carbon, switching completely to solar-powered electric cookstoves can reduce emissions 100%.

We estimated the effectiveness of cleaner cooking by calculating the reduction in GHG emissions per household switching to cleaner cooking solutions per year (Table 1). Our analysis of national, regional, and global studies suggested that switching to cleaner fuels and technologies can reduce emissions by 0.83–3.4 t CO₂‑eq /household/yr (100-yr basis), including CO₂, methane, black carbon, and sometimes other GHGs. The large range is due to varying assumptions. For example, the IEA arrived at 3.2 t CO₂‑eq /household/yr (100-yr basis) by assuming that >50% of the households switched to electricity or LPG. In comparison, Bailis et al. (2015) assumed a switch from unclean cookstoves to improved biomass cookstoves, resulting in an emissions reduction of only 0.98 t CO₂‑eq /household/yr (100-yr basis).

left_text_column_width

Table 1. Effectiveness at reducing GHG emissions of switching from unclean cooking fuels and technologies to cleaner versions.

Unit: t CO-eq/household switching to cleaner cooking solutions/yr, 100-yr basis

25th percentile 1.5
mean 2.2
median (50th percentile) 2.3
75th percentile 3.1
Left Text Column Width

While we calculated a median reduction of 2.3 t CO₂‑eq /household switching to cleaner cooking solutions/yr (100-yr basis), the actual reduction per household might be lower because households often stack cleaner cooking fuel with unclean fuel. This could result from multiple socioeconomic factors. For instance, a household may primarily rely on LPG as its main cooking fuel but occasionally turn to firewood or kerosene for specific dishes, price fluctuation, or fuel shortages (Khavari et al., 2023). In rural areas, cleaner fuels and traditional biomass (e.g., wood or dung) are used together to cut costs or due to personal preferences.

left_text_column_width
Cost

People can obtain traditional unclean fuels and traditional woodstoves for little or no cost (Bensch et al., 2021; Kapsalyamova et al., 2021). Our analysis estimated the cost of woodstoves at US$1.50/household and the monetary cost of biomass fuel at US$0.00/household/yr. Over the two-yr lifespan of a woodstove, the net annualized cost is US$0.75/household/yr. While collecting this fuel might be free, it contributes to poverty because households can spend one to three hours daily collecting fuelwood. This can contribute to children, especially girls, missing school (Jameel et al., 2022). 

We estimated the median upfront cost of transitioning from primarily unclean cooking fuels and technology to cleaner cooking to be approximately US$58/household, with stoves lasting 3–10 years. However, the range of annual costs is large because several cleaner cooking technologies have significant variations in price, and cleaner fuel cost is even more variable. Our analysis showed a median annual fuel cost of US$56/household/yr with costs ranging from savings of US$9/household/yr when buying less biomass for more efficient biomass stoves to costs of US$187/household/yr for LPG. Over a five-yr lifespan, cleaner cooking solutions have a net cost of US$64/household/yr (Table 2). 

Our analysis may overestimate operational costs due to a lack of data on biomass and charcoal costs. The IEA (2023a) estimates that an annual investment of US$8 billion is needed to supply cleaner cookstoves, equipment, and infrastructure to support a transition to cleaner cooking. This translates to US$17/household/yr. 

The IEA (2023) assumes improved biomass and charcoal cookstoves are predominantly adopted in rural areas while LPG and electric stoves are adopted in urban regions because, in LMICs, economic and infrastructure challenges can limit access to LPG and electricity in rural areas. If every household were to switch exclusively to modern cooking (e.g., LPG and electricity), the cost would be much higher. The World Bank estimates the cost of implementing these solutions to be US$1.5 trillion between 2020 and 2030 or ~US$150 billion/yr over the next 10 years. This translates into an average cost of US$214/household/yr (World Bank, 2020). 

left_text_column_width

Table 2. Cost of cleaner cooking solutions.

Unit: 2023 US$/household switching to cleaner cooking solution

Median cookstove cost 1.50
Median annual fuel cost 0.00
Net annual cost 0.74

Unit: 2023 US$/household switching to cleaner cooking solution

Median cookstove cost 58
Median annual fuel cost 56
Net annual cost 64
Left Text Column Width

The median cost per unit of climate impact was US$28/t CO₂‑eq (100-yr basis, Table 3), obtained by taking the difference between median cost of cooking with polluting sources and the cost of adopting cleaner fuel, then dividing by the median reduction per household (Table 1). Beyond climate benefits, cleaner cooking offers significant other benefits (discussed below). While the median cost presented here is a reasonable first-order estimate, the actual cost of GHG reduction will depend upon several factors, including the type of stove adopted, stove usage, fuel consumption, and scale of adoption. 

left_text_column_width

Table 3. Cost per unit climate impact.

Unit: 2023 US$/t CO‑eq, 100-yr basis

median (50th percentile) 28
Left Text Column Width
Learning Curve

Deploying cleaner cooking is a mature technology, and prices are unlikely to decrease in high-income countries where cleaner cooking fuels and technologies have been completely adopted. Nonetheless, the high cost of cleaner cooking technologies and the fluctuating prices of cleaner cooking fuel have been among the main impediments in the transition of households experiencing poverty away from unclean fuels and technologies. For example, recent price surges in Africa rendered LPG unaffordable for 30 million people (IEA, 2022). Electricity prices have also fluctuated regionally. In Europe and India, prices were higher in 2023 than in 2019 (IEA, 2023b). In contrast, U.S. electricity prices have remained stable over the past five years, while China experienced an 8% decrease.

left_text_column_width
Speed of Action

Speed of action refers to how quickly a climate solution physically affects the atmosphere after it is deployed. This is different from speed of deployment, which is the pace at which solutions are adopted.

At Project Drawdown, we define the speed of action for each climate solution as emergency brake, gradual, or delayed.

Deploy Clean Cooking is an EMERGENCY BRAKE climate solution. It has the potential to deliver a more rapid impact than gradual and delayed solutions. Because emergency brake solutions can deliver their climate benefits quickly, they can help accelerate our efforts to address dangerous levels of climate change. For this reason, they are a high priority.

left_text_column_width
Caveats

Households may continue using unclean cooking fuel and technologies alongside cleaner fuels and technologies (referred to as stacking). The data on cleaner cooking are typically measured as the number of households primarily relying on cleaner cooking fuel. This fails to capture the secondary fuel source used in the household. A review from LMICs revealed that stacking can range from low (28%) to as high as 100%, which would mean that every household is simultaneously using cleaner and unclean fuel (Shankar et al., 2020). This can happen due to factors like an increase in the cost of cleaner cooking fuel, cooking preference, unavailability of cleaner fuel, and unfamiliarity with cleaner cooking technologies. Stacking is challenging to avoid, and there is a growing realization from cleaner cooking practitioners of the need for cleaner approaches, even when multiple stoves are used. For example, electric stoves can be supplemented with LPG or ethanol stoves.

Permanence

There are significant permanence challenges associated with cleaner cooking. Households switch back from cleaner cooking fuels and technologies to unclean fuels and technologies (Jewitt et al., 2020). 

Finance

Finance is vital to supercharge adoption of cleaner cooking. Investment in the cleaner cooking sector remains significantly below the scale of the global challenge, with current funding at approximately US$130 million. This is many times lower than the amount needed each year to expand adoption of cleaner cooking solutions for the 2.4 billion people who still rely on polluting fuels and technologies (CCA 2023). At the current business-as-usual adoption rate, limited by severe underfunding, more than 80% of the population in sub-Saharan Africa will continue to rely on unclean fuels and technologies in 2030 (Stoner et al., 2021)

Climate funding, developmental finance, and subsidies have made some progress in increasing adoption of cleaner cooking. For instance, the World Bank invested more than US$562 million between 2015 and 2020, enabling 43 million people across 30 countries to adopt cleaner cooking solutions (ESMAP, 2023; World Bank, 2023). However, the emissions reductions these programs achieve can be overestimated. A recent analysis (Gill-Wiehl et al., 2024) found that 26.7 million clean cooking offset credits in reality only amounted to about 2.9 million credits. This discrepancy underscores the urgent need for updated methodologies and standards to accurately estimate emissions reductions and the cost of reduction per t CO₂‑eq (100-yr basis). 

left_text_column_width
Current Adoption

The WHO (2025) estimated that 74% of the global population in 2022 used cleaner cooking fuels and technologies. This translates to 1.2 billion households using cleaner cooking (Table 4) and 420 million households that have yet to switch to clean cooking solutions (Table 7). The adoption of cleaner cooking is not evenly spread across the world. On the higher end of the spectrum are the Americas and Europe, where, on average, more than 93% of people primarily rely on cleaner cooking fuels and technologies (WHO, 2025). On the lower end of the spectrum are sub-Saharan countries such as Madagascar, Mali and Uganda, where primary reliance on cleaner cooking fuel and technologies is <5%. While current adoption represents households that enjoy cleaner cooking today, our analysis for achievable adoption and adoption ceiling focuses on quantifying households that currently use traditional cooking methods and can switch to cleaner cooking.

left_text_column_width

Table 4. Current adoption level (2022).

Unit: households using cleaner cooking solutions

mean 1,200,000,000
Left Text Column Width
Adoption Trend

Global adoption of cleaner cooking fuel and technologies as the primary source of cooking increased from 61% of the population in 2013 to 74% in 2023 (WHO, 2025). This translates to roughly 21 million households adopting cleaner cooking technologies/yr (Table 5). This uptake, however, is not evenly distributed (see Maps section above).

Large-scale adoption across China, India, and Indonesia has driven the recent increase. Between 2011 and 2021, use of cleaner fuels and technologies as the primary means of cooking rose from 61% to 83% of the population in China. In India, adoption expanded from 38% to 71%, and in Indonesia, it increased from 47% to 87% (WHO, 2024a). In contrast, primary reliance on cleaner cooking in sub-Saharan Africa only increased from 12% in 2010 to 16% in 2020 (Stoner et al., 2021). 

Based on the existing policies, population growth, and investments, more than 75% of the sub-Saharan African population will use unclean cooking fuels and technologies in 2030 (Stoner et al., 2021). In Central and Southern Asia, about 25% of the population will use unclean cooking fuels and technologies by 2030 (Stoner et al., 2021).

left_text_column_width

Table 5. Adoption trend (2013–2023).

Unit: households switching to cleaner cooking solutions/yr

mean 21,000,000
Left Text Column Width
Adoption Ceiling

The World Bank (2020) estimated that universal adoption of modern energy cooking services by 2030 is possible with an annual investment of US$148–156 billion, with 26% of the investment coming from governments and development partners, 7% from private investment, and 67% from households. Universal adoption and use of cleaner fuels and technologies is possible with an investment of US$8–10 billion/yr (IEA, 2023a; World Bank, 2020). We therefore set the adoption ceiling at 100% of households adopting and using cleaner cooking solutions, which entails 420 million households switching from unclean solutions (Table 6).

left_text_column_width

Table 6. Cleaner cooking adoption ceiling: upper limit for new adoption of cleaner cooking solutions.

Unit: households switching to cleaner cooking solutions

mean 420,000,000
Left Text Column Width
Achievable Adoption

Universal adoption and use of cleaner cooking solutions is achievable before 2050 (Table 7). This is because if the current adoption trend continues, all households that currently use unclean cooking fuels and technologies will have switched to using cleaner versions by 2043. 

China, India, and Indonesia have shown that it is possible to rapidly expand adoption with the right set of policies and investments. In Indonesia, for example, use of cleaner cooking solutions increased from 9% of the population to 89% between 2002 and 2012 (WHO, 2025). 

left_text_column_width

Table 7. Range of achievable adoption levels.

Unit: households switching to cleaner cooking solutions

Current Adoption 0
Achievable – Low 420,000,000
Achievable – High 420,000,000
Adoption Ceiling 420,000,000
Left Text Column Width

Cooking from all fuel types is responsible for approximately 1.7 Gt CO₂‑eq (100-yr basis) emissions every year (WHO, 2023), on par with global emissions from the aviation industry (Bergero et al., 2023). Unclean cooking fuels and technologies are also the largest source of black carbon (Climate & Clean Air Coalition, 2024), a short-lived climate pollutant with a GWP several hundred times higher than CO₂ that contributes to millions of premature deaths yearly (Garland et al., 2017). 

The actual reduction in climate impact will depend upon the mix of cleaner fuel and technologies that replace unclean fuel. The IEA (2023a) estimates that if the cleanest cooking fuels and technologies (e.g., electric and LPG) are adopted, emissions could be reduced by 1.5 Gt CO₂‑eq/yr (100-yr basis) by 2030. In contrast, a greater reliance on improved cookstoves as cleaner cooking solutions will result in lower emissions reductions. The WHO (2023) estimates that much of the shift by 2030 will involve using improved biomass and charcoal cookstoves, especially in rural areas, reducing emissions 0.6 Gt CO₂‑eq/yr (100-yr basis) by 2030 and ~1.6 CO₂‑eq/yr (100-yr basis) by 2050, closely matching the IEA estimate.

According to our analysis, deploying cleaner cooking can reduce emissions by 0.98 Gt CO₂‑eq/yr (100-yr basis) between now and 2050 (Table 8). Our emissions reduction estimates are lower than those of the IEA because we do not assume that the shift to cleaner cooking will be dominated by LPG and renewables.

left_text_column_width

Table 8. Climate impact at different levels of adoption.

Unit: Gt CO-eq/yr, 100-yr basis

Current Adoption 0.00
Achievable – Low 0.98
Achievable – High 0.98
Adoption Ceiling 0.98
Left Text Column Width
Additional Benefits

Income and Work

Simkovich et al. (2019) found that time gained by switching to cleaner fuel can increase daily income by 3.8–4.7%. Their analysis excludes the expenses related to fuel, as well as the costs associated with delivery or transportation for refilling cleaner fuel. Mazorra et al. (2020) reported that if 50% of the time saved from not gathering firewood were redirected to income-generating activities, it could lead to an estimated annual income increase of approximately US$125 (2023 dollars) in the Gambia, US$113 in Guinea-Bissau, and US$200 in Senegal. Health and Air Quality

Unclean cooking fuels and technologies produce household air pollution (HAP), with smoke and fine particulates sometimes reaching levels up to 100 times acceptable limits, particularly in poorly ventilated spaces (WHO, 2024b). HAP is linked to numerous health issues, such as stroke, ischemic heart disease, chronic obstructive pulmonary disease, lung cancer, and poor birth outcomes (Jameel et al., 2022). It accounts for more than 3.2 million early deaths annually (WHO, 2024b). In 2019, it accounted for over 4% of all the deaths globally (Bennitt et al., 2021). The World Bank (2020) estimated that the negative health impact of unclean cooking fuels and technologies is valued at US$1.4 trillion/yr. Globally, switching to cleaner fuels and technologies could prevent 21 million premature deaths from 2000–2100 (Lacey et al., 2017). A recent study offered empirical evidence of potential cardiovascular benefits stemming from household cleaner energy policies (Lee et al., 2024).

Equality

Unclean cooking disproportionately impacts women and children who are traditionally responsible for collecting fuelwood or biomass. Typically, they spend an hour every day collecting solid fuel; however, in some countries (e.g., Senegal, Niger, and Cameroon), daily average collection time can exceed three hours (Jameel et al., 2022). Time-saving cooking fuels are associated with more education in women and children (Biswas & Das, 2022; Choudhuri & Desai, 2021) and can additionally promote gender equity through economic empowerment by allowing women to pursue additional employment opportunities (CCA, 2023). In conflict zones, adoption of cleaner fuels and technologies has been shown to reduce gender-based violence (Jameel et al., 2022). Finally, cleaner cooking fuels can improve health equity as women are disproportionately exposed to indoor air pollution generated from cooking (Fullerton et al., 2008; Po et al., 2011). 

Nature Protection

The unsustainable harvest of wood for cooking fuel has led to deforestation and biodiversity loss in regions such as South Asia and sub-Saharan Africa (CCA, 2022). East African nations, including Eritrea, Ethiopia, Kenya, and Uganda, are particularly affected by the rapid depletion of sustainable wood fuel resources. In the Democratic Republic of the Congo, 84% of harvested wood is charcoal or firewood (World Bank, 2018). Switching to cleaner cooking fuels and technologies can reduce deforestation and protect biodiversity (Anenberg et al., 2013; CCA, 2022; Dagnachew et al., 2018).

left_text_column_width
Risks

The expensive nature of cleaner cooking presents a significant barrier to adoption. Households that have recently transitioned to cleaner cooking face a high risk of defaulting back to unclean fuels and technologies. For example, among the households that received free LPG connection as a part of the Pradhan Mantri Ujjwala Yojana in India, low-income households reverted to unclean fuels and technologies during extensive periods of refill gaps (Cabiyo et al., 2020). In total, 9 million recipients could not refill their LPG cylinders even once in 2021–22 due to high LPG costs and other factors (Down to Earth, 2022).

Beyond the cost, there is an adjustment period for the households adopting the cleaner cooking solution, which includes familiarizing themselves with the technology and fostering cultural and behavioral changes, including overcoming biases and adopting new habits.

left_text_column_width
Interactions with Other Solutions

Reinforcing

Shifting to cleaner cooking reduces the need to burn biomass and so contributes positively to protecting and restoring forests, grasslands, and savannas. 

left_text_column_width
Dashboard

Solution Basics

household switching to cleaner cooking

t CO₂-eq (100-yr)/unit/yr
01.52.3
units
Current 0 04.2×10⁸4.2×10⁸
Achievable (Low to High)

Climate Impact

Gt CO₂-eq (100-yr)/yr
Current 0 0.980.98
US$ per t CO₂-eq
27
Emergency Brake

CO₂, CH₄, BC

Trade-offs

Switching to electric cooking will meaningfully reduce GHG emissions only if the grid is powered by clean energy. A life-cycle assessment of cooking fuels in India and China (Cashman et al., 2016) showed that unclean cooking fuels such as crop residue and cow dung had a lower carbon footprint than electricity because in these countries >80% of the electricity was produced by coal and natural gas

LPG has been the leading cleaner fuel source replacing unclean cooking fuel globally (IEA, 2023a). The IEA (2023a) estimated that 33% of households transitioning to cleaner cooking fuels and technologies will do so using LPG to transition. Because LPG is a fossil fuel, increased reliance can hinder or slow the transition from fossil fuels

left_text_column_width
% population
0–15
15–30
30–45
45–60
60–75
75–100
No data

Percentage of country population relying primarily on clean cooking technologies, 2023

Access to clean cooking technology – and the benefits it confers – varies widely around the world.

World Health Organization (2025). Proportion of population with primary reliance on clean fuels and technologies for cooking (%) [Data set]. The Global Health Observatory Indicators. Retrieved May 8, 2025 from Link to source: https://www.who.int/data/gho/data/indicators/indicator-details/GHO/gho-phe-primary-reliance-on-clean-fuels-and-technologies-proportion

Maps Introduction

The Deploy Clean Cooking solution applies to geographies where low-cost, inefficient, and polluting cooking methods are common. Sub-Saharan Africa is the overwhelming target, with only 23% of the population relying on clean cooking technologies (WHO, 2025). 

There are significant correlations between the lack of clean cooking solutions and levels of extreme poverty (World Bank, 2024), and the financial cost of clean fuel and cookstoves is a significant barrier to adoption (WHO, 2023).  

Some of the key benefits of deploying clean cooking will vary based on geography and landscape. For instance, freeing up time spent collecting firewood will be more notable in areas with less dense forests, since people in such locations would have to travel further to harvest the wood (Khavari et al., 2023).

Barriers to the adoption of clean cooking can also vary with geography. Examples noted by Khavari et al. (2023) include robustness of supply chains, which can be influenced by population density and road networks.

Action Word
Deploy
Solution Title
Clean Cooking
Classification
Highly Recommended
Lawmakers and Policymakers
  • Prioritize the issue at the national level to coordinate policy, coordinate resources, and ensure a robust effort.
  • Create a dedicated coordinating body across relevant ministries, agencies, and sectors.
  • Create subsidies and fuel price caps, and ban unclean cooking fuels and technologies.
  • Remove taxes and levies on clean-cooking stoves.
  • Create dedicated teams to deliver cleaner cooking equipment.
  • Run public education campaigns appropriate for the context
Practitioners
  • Serve as a clean cooking ambassador to raise awareness within your industry and community.
  • Participate in training programs.
  • Develop feedback channels with manufacturers to enhance design and overcome local challenges.
  • Restaurant owners and cooks can adopt clean cooking in their kitchens to reduce emissions, lower costs, and improve worker health and safety. 
Business Leaders
Nonprofit Leaders
  • Ensure operations use clean cooking methods.
  • Educate the public on the benefits of clean cooking, available options, and applicable incentive programs.
  • Advocate to policymakers on issues such as targeted subsidies and providing government support.
  • Educate investors and the business community on local needs and market trends. 
Investors
Philanthropists and International Aid Agencies
  • Distribute cleaner cooking equipment and fuel.
  • Work with local policymakers to ensure that recipient communities can maintain fuel costs over the long term (possibly through fuel subsidies).
  • Provide grants to businesses in this sector.
  • Fund education campaigns appropriate for the context.
  • Advance political action through public-private partnerships such as the CCA
Thought Leaders
  • Educate the public on the health, gender, climate, and environmental impacts of unclean cooking and the benefits of cleaner cooking.
  • Hone your message to fit the context and share through appropriate messengers and platforms.
  • Use mechanisms to promote trust, such as working with local health-care workers or other respected professionals. 
Technologists and Researchers
  • Develop regional-specific technology that uses local sources of energy, such as biogas or high-efficiency charcoal.
  • Create technology that works with the local environment and economy and has reliable supply chains.
Communities, Households, and Individuals
  • Learn about the benefits and harms associated with unclean fuels and technologies.
  • Identify the right technology to purchase by considering the availability and affordability of fuels; practicality of the equipment in producing the quantity, quality, and type of preferred food, and ease of use. 
Evidence Base

There is a strong consensus on the effectiveness of cleaner cooking as a climate solution. Research over the past two decades (e.g., Anenberg et al., 2013; Mazorra et al., 2020; Rosenthal et al., 2018) has supported the contention that replacing solid fuel cooking with cleaner fuel reduces GHG emissions. 

There is high agreement and robust evidence that switching cooking from unclean fuels and technologies to cleaner alternatives such as burning LPG or electric stoves offers health, air quality, and climate change benefits (Intergovernmental Panel on Climate Change [IPCC], 2022).

The IPCC (2022) identified unclean fuels such as biomass as a major source of short-lived climate pollutants (e.g., black carbon, organic carbon, carbon monoxide, and methane) and switching to cleaner fuels and technologies can reduce the emission of short-lived climate pollutants.

Regional and country-level analyses provide additional evidence of the efficacy of cleaner cooking solutions. Khavari et al. (2023) reported that in sub-Saharan Africa, replacing unclean solid fuels with cleaner cooking could reduce GHG emissions by 0.5 Gt CO₂‑eq/yr (100-yr basis). Life cycle assessments comparing different cooking fuels and technologies (Afrane & Ntiamoah, 2011; Afrane & Ntiamoah, 2012; Lansche & Müller, 2017; Singh et al., 2014) also have shown that cleaner cooking fuels and technologies emit less GHG per unit of energy delivered than unclean fuels.

The IEA estimated that switching completely to clean cooking fuels and technologies by 2030 would result in a net reduction of 1.5 Gt CO₂‑eq/yr (100-yr basis) by 2030 (IEA, 2023a). 

The results presented in this document summarize findings from five reviews and meta-analyses and 23 original studies and reports reflecting current evidence from 13 countries, primarily in sub-Saharan Africa. We recognize this limited geographic scope creates bias, and hope this work inspires research and data sharing on this topic in underrepresented regions.

left_text_column_width
Updated Date
Subscribe to Shift Energy Sources