Improve Steel Production

Bioplastics are renewable, plant-based alternatives to conventional plastics that can reduce emissions by replacing fossil-based feedstocks with biogenic carbon feedstocks. These feedstocks are biomass materials that absorb atmospheric CO₂ during growth and serve as the carbon source for plastic production. The chemical and biological properties of bioplastics are well understood, commercially validated, and can reduce emissions when produced sustainably and managed properly at their end-of-life. Benefits include reducing fossil fuel reliance, alleviating plastic pollution, and, in targeted uses, supporting circularity. However, these are counterbalanced by their inconsistent emissions savings, high costs, and scalability constraints. We conclude that deploying bioplastics as plastic alternatives remains a climate solution to “Keep Watching”, but would require changes in feedstock and appropriate end-of-life infrastructure to achieve reliable emissions reductions.
Based on our analysis, the widespread use of bioplastics is challenged by their potential ecological risks and currently high costs. While bioplastics offer some environmental benefits in niche applications, their climate impact is inconsistent and hinges on feedstock type, manufacturing practices, and waste management. Therefore, we conclude that Deploy Bioplastics is a solution to “Keep Watching.”
Plausible | Could it work? | Yes |
---|---|---|
Ready | Is it ready? | Yes |
Evidence | Are there data to evaluate it? | Yes |
Effective | Does it consistently work? | No |
Impact | Is it big enough to matter? | No |
Risk | Is it risky or harmful? | ? |
Cost | Is it cheap? | No |
Bioplastics (also called biopolymers) are plastic alternatives made from renewable biological sources, such as corn, sugarcane, crop residues, or other plants, instead of fossil fuels. Bioplastics are produced by extracting sugars or starches from plants and converting them through chemical or biological processes into chemical building blocks that form the basic structure of plastics. Because plants absorb atmospheric CO₂ through photosynthesis, the carbon stored in bioplastics is considered biogenic, as it is already part of the natural carbon cycle. In contrast, petrochemical plastics are made by extracting and refining oil or natural gas, which releases new (formerly buried) carbon into the atmosphere. Bioplastics cut emissions by replacing fossil carbon feedstocks with biomass-based feedstocks. Some bioplastics are durable, non-biodegradable, chemically identical to traditional plastics (i.e., “drop-in” bioplastics), and recyclable. Others are biodegradable and can be designed to break down in compost. Emissions from bioplastics come from growing and processing biomass (which requires energy and land use), manufacturing the plastics, and managing their end-of-life waste. Bioplastics can achieve climate benefits when the emissions from production and end-of-life are kept low enough to realize the advantages of biogenic carbon.
The basic idea of bioplastics is scientifically and chemically sound, with their development and commercialization ongoing since the 1990s. Numerous studies support the effectiveness of bioplastics in reducing atmospheric CO₂ emissions from feedstock production and manufacturing stages compared to fossil-based plastics, particularly when made from sustainably sourced biomass under energy-efficient conditions and properly composted or recycled. However, other studies show bioplastics have inconsistent emissions reduction performance. Global adoption also remains limited, representing only about 0.5% of total plastics production (approximately 2–2.5 million tons (Mt) out of 414 Mt, according to the organization European Bioplastics).
Bioplastics, particularly biologically derived and biodegradable polymers, have functional advantages in reducing fossil fuel dependence and mitigating plastic pollution. By sourcing raw materials from renewable biomass instead of petroleum (e.g., oil, natural gas), bioplastics can lower CO₂ emissions in the production stage, especially when accounting for biogenic carbon uptake during plant cultivation. Some types of bioplastics are interchangeable with traditional plastics and can be produced with existing plastic manufacturing systems, easing the transition. Compostable plastics simplify disposal in applications where contamination with food or organic waste occurs, enabling organic recycling and returning carbon and other nutrients to soil. Biodegradable bioplastics are also advantageous for products that are often discarded and may leak into the environment. Studies show that two widely used commercial bioplastics, polylactic acid (PLA) and polyhydroxybutyrate (PHB), biodegrade 60–80% in composting conditions within 28–30 days, while cellulose-based and starch-based plastics can fully degrade in soil and marine environments in 180 days and 50 days, respectively. These functional benefits, combined with potential additional benefits, such as soil enrichment and waste stream simplification, make bioplastics appealing in specific, targeted use cases. More broadly, they can significantly contribute to emissions reduction efforts in materials production when designed for circularity and supported by infrastructure that facilitates appropriate end-of-life waste treatment.
Despite their promise, bioplastics have several limitations as a viable climate solution, including relatively low emissions reduction potential and possible risks and adverse impacts from their large-scale deployment. Current production is low. To reach a meaningful 20–30% marketplace share by 2040, bioplastics would need to expand manufacturing by approximately 30% per year, nearly double the current pace. This could put pressure on land and food systems, since current bioplastics rely on food-based crops for industrial-level production. This raises sustainability concerns around food security and could potentially drive unintended land-use changes such as deforestation or cropland conversion. Furthermore, the effectiveness of reducing emissions by replacing conventional plastics with bioplastics is low and inconsistent. Some bioplastics produce more life cycle emissions than conventional plastics. The likely climate impact of replacing 20–30% of traditional plastics with bioplastics is <0.1 Gt CO₂‑eq/yr. End-of-life treatment is also a major challenge. Many bioplastics are incompatible with home composting and current recycling streams, and improperly composted or landfilled biodegradable bioplastics can emit methane. Finally, bioplastics remain 2–3 times more expensive than conventional plastics.
Barbu, B. (2024). Can biodegradable polymers make microplastics? C&EN Global Enterprise, 102(37), 21–22. Link to source: https://doi.org/10.1021/cen-10237-cover4
Bauer, F., Nielsen, T. D., Nilsson, L. J., Palm, E., Ericsson, K., Fråne, A., & Cullen, J. (2022). Plastics and climate change—Breaking carbon lock-ins through three mitigation pathways. One Earth, 5(4), 361–376. Link to source: https://doi.org/10.1016/j.oneear.2022.03.007
Benavides, P. T., Lee, U., & Zarè-Mehrjerdi, O. (2020). Life cycle greenhouse gas emissions and energy use of polylactic acid, bio-derived polyethylene, and fossil-derived polyethylene. Journal of Cleaner Production, 277(124010), 124010. Link to source: https://doi.org/10.1016/j.jclepro.2020.124010
Bishop, G., Styles, D., & Lens, P. N. L. (2022). Land-use change and valorisation of feedstock side-streams determine the climate mitigation potential of bioplastics. Resources, Conservation and Recycling, 180, 106185. Link to source: https://doi.org/10.1016/j.resconrec.2022.106185
Chen, G., Li, J., Sun, Y., Wang, Z., Leeke, G. A., Moretti, C., Cheng, Z., Wang, Y., Li, N., Mu, L., Li, J., Tao, J., Yan, B., & Hou, L. (2024). Replacing traditional plastics with biodegradable plastics: Impact on carbon emissions. Engineering, 32, 152–162. Link to source: https://doi.org/10.1016/j.eng.2023.10.002
Cotterill, M. (2020, August 5). Bioplastics: Don’t let the label fool you. Canadian Geographic.
Link to source: https://canadiangeographic.ca/articles/bioplastics-dont-let-the-label-fool-you/
Di Bartolo, A., Infurna, G., & Dintcheva, N. T. (2021). A review of bioplastics and their adoption in the circular economy. Polymers, 13(8), 1229. Link to source: https://doi.org/10.3390/polym13081229
Dokl, M., Copot, A., Krajnc, D., Fan, Y. V., Vujanović, A., Aviso, K. B., Tan, R. R., Kravanja, Z., & Čuček, L. (2024). Global projections of plastic use, end-of-life fate and potential changes in consumption, reduction, recycling and replacement with bioplastics to 2050. Sustainable Production and Consumption, 51, 498–518. Link to source: https://doi.org/10.1016/j.spc.2024.09.025
Escobar, N., & Britz, W. (2021). Metrics on the sustainability of region-specific bioplastics production, considering global land use change effects. Resources, Conservation and Recycling, 167, 105345. Link to source: https://doi.org/10.1016/j.resconrec.2020.105345
European Bioplastics. (2023). Bioplastics market development update 2023. European Bioplastics E.V. Link to source: https://docs.european-bioplastics.org/publications/market_data/2023/EUBP_Market_Data_Report_2023.pdf
European Bioplastics. (2024). Bioplastics market development update 2024. European Bioplastics E.V. Link to source: https://www.european-bioplastics.org/market/
Ferreira-Filipe, D. A., Paço, A., Duarte, A. C., Rocha-Santos, T., & Patrício Silva, A. L. (2021). Are biobased plastics green alternatives?—A critical review. International Journal of Environmental Research and Public Health, 18(15), 7729. Link to source: https://doi.org/10.3390/ijerph18157729
Helm, L. T., Venier-Cambron, C., & Verburg, P. H. (2025). The potential land-use impacts of bio-based plastics and plastic alternatives. Nature Sustainability, 8, 190–201. Link to source: https://doi.org/10.1038/s41893-024-01492-7
Islam, M., Xayachak, T., Haque, N., Lau, D., Bhuiyan, M., & Pramanik, B. K. (2024). Impact of bioplastics on environment from its production to end-of-life. Process Safety and Environmental Protection, 188, 151–166. Link to source: https://doi.org/10.1016/j.psep.2024.05.113
Ita-Nagy, D., Vázquez-Rowe, I., Kahhat, R., Chinga-Carrasco, G., & Quispe, I. (2020). Reviewing environmental life cycle impacts of biobased polymers: current trends and methodological challenges. The International Journal of Life Cycle Assessment, 25(11), 2169–2189. Link to source: https://doi.org/10.1007/s11367-020-01829-2
Karali, N., Khanna, N., & Shah, N. (2024, April 12). Climate Impact of Primary Plastic Production [Review of Climate Impact of Primary Plastic Production]. Lawrence Berkeley National Laboratory. Link to source: https://escholarship.org/uc/item/6cc1g99q
Meng, F., Brandão, M., & Cullen, J. M. (2024). Replacing plastics with alternatives is worse for greenhouse gas emissions in most cases. Environmental Science & Technology, 58(6), 2716–2727. Link to source: https://doi.org/10.1021/acs.est.3c05191
Patria, R. D., Rehman, S., Yuen, C. W. M., Lee, D.-J., Vuppaladadiyam, A. K., & Leu, S. (2024). Energy-environment-economic (3E) hub for sustainable plastic management – Upgraded recycling, chemical valorization, and bioplastics. Applied Energy, 357, 122543. Link to source: https://doi.org/10.1016/j.apenergy.2023.122543
Piemonte, V., & Gironi, F. (2010). Land-use change emissions: How green are the bioplastics? Environmental Progress & Sustainable Energy, 30(4), 685–691. Link to source: https://doi.org/10.1002/ep.10518
Plastics Europe. (2024, November 18). Plastics – the fast Facts 2024 • Plastics Europe. Plastics Europe. Link to source: https://plasticseurope.org/knowledge-hub/plastics-the-fast-facts-2024/
Rosenboom, J.-G., Langer, R., & Traverso, G. (2022). Bioplastics for a circular economy. Nature Reviews Materials, 7, 117–137. Link to source: https://doi.org/10.1038/s41578-021-00407-8
The multifaceted challenges of bioplastics. (2024). Nature Reviews Bioengineering, 2(4), 279–279. Link to source: https://doi.org/10.1038/s44222-024-00181-6
Vanderreydt, I., Rommens, T., Tenhunen, A., Mortensen, L. F., & Tange, I. (2021, May). Greenhouse gas emissions and natural capital implications of plastics (including biobased plastics). Eionet Portal; European Environment Agency (EEA) European Topic Centre on Waste and Materials in a Green Economy.
Link to source: https://www.eionet.europa.eu/etcs/etc-wmge/products/etc-wmge-reports/greenhouse-gas-emissions-and-natural-capital-implications-of-plastics-including-biobased-plastics
Walker, S., & Rothman, R. (2020). Life cycle assessment of bio-based and fossil-based plastic: A review. Journal of Cleaner Production, 261, 121158. Link to source: https://doi.org/10.1016/j.jclepro.2020.121158
Zhao, X., Cornish, K., & Vodovotz, Y. (2020). Narrowing the gap for bioplastic use in food packaging: An update. Environmental Science & Technology, 54(8), 4712–4732. Link to source: https://doi.org/10.1021/acs.est.9b03755
Zhao, X., Wang, Y., Chen, X., Yu, X., Li, W., Zhang, S., Meng, X., Zhao, Z.-M., Dong, T., Anderson, A., Aiyedun, A., Li, Y., Webb, E., Wu, Z., Kunc, V., Ragauskas, A., Ozcan, S., & Zhu, H. (2023). Sustainable bioplastics derived from renewable natural resources for food packaging. Matter, 6(1), 97–127. Link to source: https://doi.org/10.1016/j.matt.2022.11.006
This solution involves reducing the use of high-global warming potential (GWP) refrigerants, instead deploying lower-GWP refrigerants. High-GWP (>800 on a 100-yr basis) fluorinated gases (F-gases) are currently used as refrigerants in refrigeration, air conditioning, and heat pump systems. Over the lifetime of this equipment, refrigerants escape into the atmosphere where they contribute to climate change.
Leaked lower-GWP refrigerant gases trap less heat in the atmosphere than do higher-GWP gases, so using lower-GWP gases reduces the climate impact of refrigerant use. In our analysis, this solution is only deployed as new equipment replaces decommissioned equipment because alternative refrigerants cannot typically be retrofitted into existing systems.
Refrigerants are chemicals that can absorb and release heat as they move between gaseous and liquid states under changing pressure. In this solution, we considered their use in six applications: residential, commercial, industrial, and transport refrigeration as well as stationary and mobile air conditioning. Heat pumps double as heating sources, though they are included here with air conditioning appliances. Refrigerants are released to the atmosphere during manufacturing, transport, installation, operation, repair, and disposal of refrigerants and equipment. Deploy Alternative Insulation Materials covers the use of refrigerant chemicals to produce foams.
Climate impacts of emissions of refrigerants can be reduced by:
This solution evaluated the use of lower-GWP refrigerants alone. Leak reduction and responsible disposal are covered in Improve Refrigerant Management. Lowering use of and demand for refrigerants – while outside the scope of these assessments – is the most effective way to reduce emissions.
Most refrigerants used in new equipment today are a group of F-gases called hydrofluorocarbons (HFCs) (Figure 1). HFCs are GHGs and are typically hundreds to thousands of times more potent than CO₂ (Smith et al., 2021). Since high-GWP refrigerants are usually short-lived climate pollutants, their negative climate impacts tend to be concentrated in the near term (Shah et al., 2015). High-GWP HFC production and consumption are being phased down under the Kigali Amendment to the Montreal Protocol, but existing stock and production remains high worldwide (Amendment to the Montreal Protocol on Substances That Deplete the Ozone Layer, 2016; United Nations Framework Convention on Climate Change [UNFCCC], 2023). Other types of refrigerants that deplete the ozone layer – including chlorofluorocarbons (CFCs) and hydrochlorofluorocarbons (HCFCs) — are also being phased out of new production and use globally (Montreal Protocol on Substances That Deplete the Ozone Layer, 1987; Figure 1).
Figure 1. Examples of common refrigerants and their climate and environmental impacts
High-GWP: red; Medium-GWP: yellow; Low-GWP: green
Type | GWP (20-yr) | GWP (100-yr) | Life (yr) | Ozone Depleting? | PFAS? | Safety Class* | |
---|---|---|---|---|---|---|---|
R11 | CFC | 8,320 | 6,230 | 52 | Yes | A1 | |
R12 | CFC | 12,700 | 12,500 | 102 | Yes | A1 | |
R22 | HCFC | 5,690 | 1,960 | 11.9 | Yes | A1 | |
R141b | HCFC | 2,710 | 860 | 9.4 | Yes | ||
R125 | HFC | 6,740 | 3,740 | 30 | No | Yes | A1 |
R134a | HFC | 4,140 | 1,530 | 14 | No | Yes | A1 |
R143a | HFC | 7,840 | 5,810 | 51 | No | Yes | A2L |
R404A | HFC blend | 7,208 | 4,728 | No | Yes | A1 | |
R407C | HFC blend | 4,457 | 1,908 | No | Yes | A1 | |
R410A | HFC blend | 4,715 | 2,256 | No | Yes | A1 | |
R452A | HFC/HFO blend | 4,273 | 2,292 | No | Yes | A1 | |
R32 | HFC | 2,690 | 771 | 5.4 | No | No | A2L |
R452B | HFC/HFO blend | 2,275 | 779 | No | Yes | A2L | |
R454A | HFC/HFO blend | 943 | 270 | No | Yes | A2L | |
R513A | HFC/HFO blend | 1,823 | 673 | No | Yes | A1 | |
R290 (Propane) | Natural | 0.072 | 0.02 | 0.036 | No | No | A3 |
R600a (Isobutane) | Natural | < 1 | < 1 | 0.019 | No | No | A3 |
R717 (Ammonia) | Natural | < 1 | < 1 | < 1 | No | No | B2L |
R744 (CO₂) | Natural | 1 | 1 | No | No | A1 | |
R1234yf | HFO | 1.81 | 0.501 | 0.033 | No | Yes | A2L |
R1234ze(E) | HFO | 4.94 | 1.37 | 0.052 | No | Yes | A2L |
*Safety classes based on ASHRAE Standard 34:
A1: non-flammable, lower toxicity
A2L: lower flammability, lower toxicity
A3: higher flammability, lower toxicity
B2L: lower flammability, higher toxicity
Sources: Baha & Dupont, 2023; Behringer et al., 2021; Burkholder et al., 2023; Garry, 2021; Smith et al., 2021; Trevisan, 2023; United Nations Environment Programme (UNEP), 2023; UNEP & ASHRAE, 2025; own calculations for blended refrigerant GWPs.
In this solution, production and consumption of high-GWP refrigerants (which we defined as GWP>800, 100-yr basis) are avoided by the use of lower-GWP refrigerants in new equipment. These alternative refrigerants can still leak to the atmosphere, but their heat-trapping effect is much lower. Some promising alternatives have low GWPs (<5, 100-yr basis), including some hydrofluoroolefins (HFOs) as well as natural refrigerants, which include CO₂, ammonia, propane, and isobutane. (Figure 1). However, the adoption of these low-GWP refrigerants comes with challenges, including flammability, cost, building codes, and technical limitations (see Risks and Take Action sections below).
Refrigerants with medium GWPs (<800, 100-yr basis; <2,700, 20-yr basis (Smith et al., 2021)) can also be near-term alternatives that increase adoption while providing a climate benefit. In our analysis, we separately considered medium-GWP alternatives in applications where low-GWP alternatives are less common (Figure 2).
Figure 2. Alternative refrigerants used to calculate the low-GWP and medium-GWP scenarios. The low-GWP scenario assumes equipment using high-GWP refrigerants is replaced at end-of-life with equipment using alternative refrigerants with GWP<5. The medium-GWP calculations assume GWP<800 (100-yr basis) and GWP<2,700 (20-yr basis) alternatives in applications where low-GWP replacements are currently less common (commercial refrigeration, transport refrigeration, stationary air conditioning) and assumes low-GWP replacements for the remaining applications where they are more developed technologies (residential refrigeration, industrial refrigeration, mobile air conditioning). The alternative refrigerants in the table are used for effectiveness and/or cost calculations.
Application |
Scenario 1: Low-GWP only (low GWP: < 5, 100-year basis) |
Scenario 2: Medium-GWP when low-GWP alternatives are less common, otherwise low-GWP (medium GWP: < 800, 100-year basis) |
---|---|---|
Residential refrigeration | Isobutane | |
Commercial refrigeration | Propane, CO₂ | Medium-GWP HFC and HFO blends |
Industrial refrigeration | Ammonia, CO₂, propane | |
Transport refrigeration | Propane, propene, ammonia, CO₂, low-GWP HFOs |
Medium-GWP HFC and HFO blends |
Mobile AC | CO₂, low-GWP HFOs | |
Stationary AC | Propane, CO₂, ammonia, low-GWP HFOs |
Medium-GWP HFC and HFO blends |
Sources: Purohit & Höglund-Isaksson (2017); Sustainable Purchasing Leadership Council Climate Friendly Refrigerant Action Team (2021); UNEP (2023); UNFCCC (2023); U.S. Environmental Protection Agency (2011).
There is currently no single refrigerant that perfectly fits the climate, safety, and performance requirements for all applications. Instead, the optimal alternative refrigerant will vary depending on equipment type and location (UNEP, 2023).
Generating electricity to run heating, ventilation, air conditioning, and refrigeration (HVAC&R) equipment also produces high levels of emissions (mostly CO₂ ) at power plants – more than twice the emissions from direct release of refrigerants (United Nations Development Programme [UNDP], 2022). Using alternative refrigerants can impact efficiency, changing these electricity-related emissions. However, indirect emissions are not quantified in this solution.
Amendment to the Montreal Protocol on substances that deplete the ozone layer. (2016, October 15). Link to source: https://treaties.un.org/doc/Treaties/2016/10/20161015%2003-23%20PM/Ch_XXVII-2.f-English%20and%20French.pdf
Arp, H. P. H., Gredelj, A., Glüge, J., Scheringer, M., & Cousins, I. T. (2024). The global threat from the irreversible accumulation of trifluoroacetic acid (TFA). Environmental Science & Technology, 58(45), 19925–19935. Link to source: https://doi.org/10.1021/acs.est.4c06189
ASHRAE. (2009). ASHRAE position document on natural refrigerants. Link to source: https://www.epa.gov/sites/default/files/documents/ASHRAE_PD_Natural_Refrigerants_2011.pdf
Babiker, M., Berndes, G., Blok, K., Cohen, B., Cowie, A., Geden, O., Ginzburg, V., Leip, A., Smith, P., Sugiyama, M., & Yamba, F. (2022). Cross-sectoral perspectives. In P. R. Shukla, J. Skea, R. Slade, A. Al Khourdajie, R. van Diemen, D. McCollum, M. Pathak, S. Some, P. Vyas, R. Fradera, M. Belkacemi, A. Hasija, G. Lisboa, S. Luz, & J. Malley (Eds.), Climate change 2022: Mitigation of climate change. Contribution of working group III to the sixth assessment report of the intergovernmental panel on climate change (pp. 1245–1354). Cambridge University Press. Link to source: https://doi.org/10.1017/9781009157926.014
Baha, M., & Dupont, J.-L. (2023, September 15). Global warming potential (GWP) of HFC refrigerants. International Institute of Refrigeration. Link to source: https://iifiir.org/en/encyclopedia-of-refrigeration/global-warming-potential-gwp-of-hfc-refrigerants
Behringer, D., Heydel, F., Gschrey, B., Osterheld, S., Schwarz, W., Warncke, K., Freeling, F., Nödler, K., Henne, S., Reimann, S., Blepp, M., Jörß, W., Liu, R., Ludig, S., Rüdenauer, I., & Gartiser, S. (2021). Persistent degradation products of halogenated refrigerants and blowing agents in the environment: Type, environmental concentrations, and fate with particular regard to new halogenated substitutes with low global warming potential. Final report. Umweltbundesamt [German Environment Agency]. Link to source: https://www.umweltbundesamt.de/sites/default/files/medien/5750/publikationen/2021-05-06_texte_73-2021_persistent_degradation_products.pdf
Blumberg, K., Isenstadt, Taddonio, K. N., Andersen, S. O., & Sherman, N. J. (2019). Mobile air conditioning: The life-cycle costs and greenhouse-gas benefits of switching to alternative refrigerants and improving system efficiencies. Link to source: https://theicct.org/wp-content/uploads/2021/06/ICCT_mobile-air-cond_CBE_201903.pdf
Bolaji, B. O., & Huan, Z. (2013). Ozone depletion and global warming: Case for the use of natural refrigerant – a review. Renewable and Sustainable Energy Reviews, 18, 49–54. Link to source: https://doi.org/10.1016/j.rser.2012.10.008
Booten, C., Nicholson, S., Mann, M., & Abdelaziz, O. (2020). Refrigerants: Market trends and supply chain assessment. Link to source: https://www.nrel.gov/docs/fy20osti/70207.pdf
Burkholder, J. B., Hodnebrog, Ø., McDonald, B. C., Orkin, V., Papadimitriou, V. C., & Van Hoomissen, D. (2023). Annex: Summary of abundances, lifetimes, ODPs, REs, GWPs, and GTPs. Scientific Assessment of Ozone Depletion 2022. Link to source: https://csl.noaa.gov/assessments/ozone/2022/downloads/Annex_2022OzoneAssessment.pdf
California Public Utilities Commission. (2022). Refrigerant avoided cost calculator [Data set]. Link to source: https://www.cpuc.ca.gov/dercosteffectiveness
Campbell, I., Kalanki, A., & Sachar, S. (2018). Solving the global cooling challenge: How to counter the climate threat from room air conditioners. Rocky Mountain Institute. Link to source: https://rmi.org/wp-content/uploads/2018/11/Global_Cooling_Challenge_Report_2018.pdf
Chele, F. S., Salvador, C., Stevenson, L., Dolislager, F., Armstrong, A., Power, S., Mathews, T., & Yana Motta, S. F. (2024). Critical literature review of low global warming potential (GWP) refrigerants and their environmental impact. Oak Ridge National Laboratory. Link to source: https://www.osti.gov/servlets/purl/2528023
CLASP & ATMOsphere. (2022). Global refrigerant impact from 6 appliances in 22 countries. Link to source: https://www.clasp.ngo/wp-content/uploads/2022/05/Refrigerant-Modeling-Interim-Report-APR142022.pdf
Climate and Ozone Protection Alliance. (2025). Global banks of ozone depleting substances (ODS) and hydrofluorocarbons (HFCs). Link to source: https://www.copalliance.org/imglib/publications/2025-04_COPA_Global%20Banks%20ODS%20HFC_update.pdf
Colbourne, D., Croiset, I., Ederberg, L., Heubes, J., Martin, M., Narayan, C., Oppelt, D., Papst, I., Usinger, J., & Gschrey, B. (2013). NAMAs in the refrigeration, air conditioning and foam sectors: A technical handbook. Deutsche Gesellschaft für Internationale Zusammenarbeit (GIZ) GmbH [German Agency for International Cooperation] . Link to source: https://transparency-partnership.net/sites/default/files/e-bruochure-20131015-neu.pdf
Denzinger, P. (2023, December 9). Context and global mitigation potential of “green” ACs. COP28 UAE. Link to source: https://www.green-cooling-initiative.org/fileadmin/user_upload/Final_02_COP28_Side_Event_Green_ACs_Final_Final.pdf
Dimitrakopoulou, M.-E., Karvounis, M., Marinos, G., Theodorakopoulou, Z., Aloizou, E., Petsangourakis, G., Papakonstantinou, M., & Stoitsis, G. (2024). Comprehensive analysis of PFAS presence from environment to plate. npj Science of Food, 8, 80. Link to source: https://doi.org/10.1038/s41538-024-00319-1
Dong, Y., Coleman, M., & Miller, S. A. (2021). Greenhouse gas emissions from air conditioning and refrigeration service expansion in developing countries. Annual Review of Environment and Resources, 46, 59–83. Link to source: https://doi.org/10.1146/annurev-environ-012220-034103
Dräger. (n.d.). Cooling with ammonia: What you should keep in mind. Link to source: https://www.draeger.com/Content/Documents/Content/ammoniak-fa-pdf-8110-en.pdf
Dreyfus, G., Borgford-Parnell, N., Christensen, J., Fahey, D. W., Motherway, B., Peters, T., Picolotti, R., Shah, N., & Xu, Y. (2020). Assessment of climate and development benefits of efficient and climate-friendly cooling. Link to source: https://www.ccacoalition.org/resources/assessment-climate-and-development-benefits-efficient-and-climate-friendly-cooling
European Chemicals Agency. (2023). Annex XV restriction report: Per- and polyfluoroalkyl substances (PFASs). Link to source: https://echa.europa.eu/documents/10162/f605d4b5-7c17-7414-8823-b49b9fd43aea
European Environmental Bureau. (2025). Universal PFAS restriction under REACH: Briefing on fluorinated gases in the universal PFAS restriction—The F-lephant in the room. Link to source: https://eeb.org/wp-content/uploads/2025/02/EEB_EURENI_F-gas_Policy-Brief.pdf
Fabris, F., Fabrizio, M., Marinetti, S., Rossetti, A., & Minetto, S. (2024). Evaluation of the carbon footprint of HFC and natural refrigerant transport refrigeration units from a life-cycle perspective. International Journal of Refrigeration, 159, 17–27. Link to source: https://doi.org/10.1016/j.ijrefrig.2023.12.018
Fenton, S. E., Ducatman, A., Boobis, A., DeWitt, J. C., Lau, C., Ng, C., Smith, J. S., & Roberts, S. M. (2021). Per- and polyfluoroalkyl substance toxicity and human health review: Current state of knowledge and strategies for informing future research. Environmental Toxicology and Chemistry, 40(3), 606–630. Link to source: https://doi.org/10.1002/etc.4890
Food and Agriculture Organization of the United Nations. (2019). The state of food and agriculture 2019: Moving forward on food loss and waste reduction. Link to source: https://openknowledge.fao.org/server/api/core/bitstreams/11f9288f-dc78-4171-8d02-92235b8d7dc7/content
Garavagno, M. d. l. A., Holland, R., Khan, M. A. H., Orr-Ewing, A. J., & Shallcross, D. E. (2024). Trifluoroacetic acid: Toxicity, sources, sinks and future prospects. Sustainability, 16(6), Article 2382. Link to source: https://doi.org/10.3390/su16062382
Garry, M. (2021, June 23). Certain HFCs and HFOs are in PFAS group that five EU countries intend to restrict. Link to source: https://naturalrefrigerants.com/certain-hfcs-and-hfos-are-in-pfas-group-that-five-eu-countries-intend-to-restrict/
Goetzler, W., Guernsey, M., Young, J., Fuhrman, J., & Abdelaziz, O. (2016). The future of air conditioning for buildings. U.S. Department of Energy. Office of Energy Efficiency and Renewable Energy. Building Technologies Office. Link to source: https://www.energy.gov/sites/prod/files/2016/07/f33/The%20Future%20of%20AC%20Report%20-%20Full%20Report_0.pdf
Gradient. (2015). Risk assessment of refrigeration systems using A2L flammable refrigerants. Link to source: https://www.ahrinet.org/system/files/2023-08/AHRI-8009_Final_Report.pdf
Green Cooling Initiative. (n.d.). Global greenhouse gas emissions from the RAC sector. Retrieved April 15, 2025, from Link to source: https://www.green-cooling-initiative.org/country-data
Hanson, M. L., Madronich, S., Solomon, K., Sulbaek Andersen, M. P., & Wallington, T. J. (2024). Trifluoroacetic acid in the environment: Consensus, gaps, and next steps. Environmental Toxicology and Chemistry, 43, 2091–2093. Link to source: https://doi.org/10.1002/etc.5963
Hayes, C., Stausholm, T., Ilana, K., & Devin, Y. (2023). Natural refrigerants: State of the industry. ATMOsphere. Link to source: https://atmosphere.cool/marketreport-2022/
Heubes, J., Martin, M., & Oppelt, D. (2012). Refrigeration, air conditioning and foam blowing sectors technology roadmap. GIZ Proklima. Link to source: https://unfccc.int/ttclear/misc_/StaticFiles/gnwoerk_static/TEM_tec_cfi_rm/993ecdfa67144e68b88b4735ea50fcf0/647faaa714484a2983fe6851111ab9aa.pdf
Höglund-Isaksson, L., Purohit, P., Amann, M., Bertok, I., Rafaj, P., Schöpp, W., & Borken-Kleefeld, J. (2017). Cost estimates of the Kigali Amendment to phase-down hydrofluorocarbons. Environmental Science & Policy, 75, 138–147. Link to source: https://doi.org/10.1016/j.envsci.2017.05.006
Holland, R., Khan, M. A. H., Driscoll, I., Chhantyal-Pun, R., Derwent, R. G., Taatjes, C. A., Orr-Ewing, A. J., Percival, C. J., & Shallcross, D. E. (2021). Investigation of the production of trifluoroacetic acid from two halocarbons, HFC-134a and HFO-1234yf and its fates using a global three-dimensional chemical transport model. ACS Earth and Space Chemistry, 5(4), 849–857. Link to source: https://doi.org/10.1021/acsearthspacechem.0c00355
Imamura, T., Kamiya, K., & Sugawa, O. (2015). Ignition hazard evaluation on A2L refrigerants in situations of service and maintenance. Journal of Loss Prevention in the Process Industries, 36, 553–561. Link to source: https://doi.org/10.1016/j.jlp.2014.12.018
Inforum, JMS Consulting, The Alliance for Responsible Atmospheric Policy, & Air-Conditioning, Heating, and Refrigeration Institute. (2019, December 12). Economic & consumer impacts of HFC phasedown. Link to source: https://www.congress.gov/116/meeting/house/110388/documents/HHRG-116-IF18-20200114-SD003.pdf
International Energy Agency. (2023, July 12). Space cooling. Link to source: https://www.iea.org/energy-system/buildings/space-cooling
Intergovernmental Panel on Climate Change. (2023). Climate change 2022: Mitigation of climate change. Working Group III Contribution to the Sixth Assessment Report of the Intergovernmental Panel on Climate Change. Cambridge University Press. Link to source: https://doi.org/10.1017/9781009157926
JMS Consulting & Inforum. (2018). Consumer cost impacts of U.S. ratification of the Kigali Amendment. Link to source: https://www.alliancepolicy.org/site/usermedia/application/10/Consumer_Costs_Final_InforumJMS_20181109.pdf
Montreal protocol on substances that deplete the ozone layer. (1987, September 16). Link to source: https://treaties.un.org/doc/publication/unts/volume%201522/volume-1522-i-26369-english.pdf
Petri, Y., & Caldeira, K. (2015). Impacts of global warming on residential heating and cooling degree-days in the United States. Scientific Reports, 5(1), Article 12427. Link to source: https://doi.org/10.1038/srep12427
Purohit, P., & Höglund-Isaksson, L. (2017). Global emissions of fluorinated greenhouse gases 2005–2050 with abatement potentials and costs. Atmospheric Chemistry and Physics, 17(4), 2795–2816. Link to source: https://doi.org/10.5194/acp-17-2795-2017
Salvador, C. M., Chele, F. S., Stevenson, L., Dolislager, F., Armstrong, A., Mathews, T., & Yana Motta, S. (2024). Atmospheric transformation of refrigerants: Current research developments and knowledge gaps. International Refrigeration and Air Conditioning Conference, USA, Paper 2671. Link to source: https://docs.lib.purdue.edu/iracc/2671
Secop. (2018). Practical application of refrigerants R600a and R290 in small hermetic systems. Link to source: https://www.secop.com/fileadmin/user_upload/technical-literature/guidelines/application_guideline_r600a_r290_02-2018_desa610a202.pdf
Shah, N., Khanna, N., Karali, N., Park, W. Y., Qu, Y., & Zhou, N. (2017). Opportunities for simultaneous efficiency improvement and refrigerant transition in air conditioning. Lawrence Berkeley National Laboratory. Link to source: https://cooling.lbl.gov/publications/opportunities-simultaneous-efficiency
Shah, N., Wei, M., Letschert, V., & Phadke, A. (2015). Benefits of leapfrogging to superefficiency and low global warming potential refrigerants in room air conditioning. Lawrence Berkeley National Laboratory. Link to source: https://www.osti.gov/servlets/purl/1235571
Shah, N., Wei, M., Letschert, V., & Phadke, A. (2019). Benefits of energy efficient and low-global warming potential refrigerant cooling equipment. Lawrence Berkeley National Laboratory. Link to source: https://cooling.lbl.gov/publications/benefits-energy-efficient-and-low
Sherry, D., Nolan, M., Seidel, S., & Andersen, S. O. (2017). HFO-1234yf: An examination of projected long-term costs of production. Nolan Sherry & Associates, Center for Climate and Energy Solutions, Institute for Governance and Sustainable Development. Link to source: https://www.c2es.org/wp-content/uploads/2017/04/hfo-1234yf-examination-projected-long-term-costs-production.pdf
Smith, C., Nicholls, Z. R. J., Armour, K., Collins, W., Forster, P., Meinshausen, M., Palmer, M. D., & Watanabe, M. (2021). The Earth’s energy budget, climate feedbacks, and climate sensitivity supplementary material. In Climate Change 2021: The Physical Science Basis. Contribution of Working Group I to the Sixth Assessment Report of the Intergovernmental Panel on Climate Change. Link to source: https://www.ipcc.ch/report/ar6/wg1/downloads/report/IPCC_AR6_WGI_Chapter07_SM.pdf
Sustainable Purchasing Leadership Council Climate Friendly Refrigerant Action Team. (2021). Recommendations for climate friendly refrigerant management and procurement. Link to source: https://www.igsd.org/publications/recommendations-for-climate-friendly-refrigerant-management-and-procurement/
Trevisan, T. (2023, July 3). Overview of PFAS refrigerants used in HVAC&R and relevance of refrigerants in the PFAS Restriction Intention. UN Montreal Protocol 45th OEWG, Bangkok. Link to source: https://ozone.unep.org/system/files/documents/OEWG45_ATMO_sidevent.pdf
United Nations Development Programme. (2022). Guidance note: Assessing greenhouse gas emissions from refrigerants use in UNDP operations. Link to source: https://www.undp.org/sites/g/files/zskgke326/files/2022-07/Refrigerants%20methodology%20version%20July%202022.pdf
United Nations Environment Programme. (2023). Refrigeration, Air Conditioning and Heat Pumps Technical Options Committee: 2022 assessment report. Link to source: https://ozone.unep.org/system/files/documents/RTOC-assessment%20-report-2022.pdf
United Nations Environment Programme & ASHRAE. (2025). Update on new refrigerants designations and safety classifications June 2025. Link to source: https://www.ashrae.org/file%20library/professional%20development/ashrae-unep/unep---ashrae-factsheet--english.pdf
United Nations Framework Convention on Climate Change. (2023). National inventory submissions, Annex 1 parties [Data set]. Link to source: https://unfccc.int/ghg-inventories-annex-i-parties/2023
U.S. Environmental Protection Agency. (2011). Transitioning to low-GWP alternatives in transport refrigeration. Link to source: https://www.epa.gov/sites/default/files/2015-07/documents/transitioning_to_low-gwp_alternatives_in_transport_refrigeration.pdf
U.S. Environmental Protection Agency. (2025). Frequent questions on the phasedown of hydrofluorocarbons. Link to source: https://www.epa.gov/climate-hfcs-reduction/frequent-questions-phasedown-hydrofluorocarbons
Velders, G. J. M., Daniel, J. S., Montzka, S. A., Vimont, I., Rigby, M., Krummel, P. B., Muhle, J., O’Doherty, S., Prinn, R. G., Weiss, R. F., & Young, D. (2022). Projections of hydrofluorocarbon (HFC) emissions and the resulting global warming based on recent trends in observed abundances and current policies. Atmospheric Chemistry and Physics, 22(9), 6087–6101. Link to source: https://doi.org/10.5194/acp-22-6087-2022
Velders, G. J. M., Fahey, D. W., Daniel, J. S., Andersen, S. O., & McFarland, M. (2015). Future atmospheric abundances and climate forcings from scenarios of global and regional hydrofluorocarbon (HFC) emissions. Atmospheric Environment, 123, 200–209. Link to source: https://doi.org/10.1016/j.atmosenv.2015.10.071
World Meteorological Organization. (2018). Executive summary: Scientific assessment of ozone depletion: 2018 (Report No. 58). Link to source: https://ozone.unep.org/sites/default/files/2019-04/SAP-2018-Assessment-report-ES-rev%20%281%29.pdf
Zaelke, D., & Borgford-Parnell, N. (2015). The importance of phasing down hydrofluorocarbons and other short-lived climate pollutants. Journal of Environmental Studies and Sciences, 5(2), 169–175. Link to source: https://doi.org/10.1007/s13412-014-0215-7
Zanchi, V., Boban, L., & Soldo, V. (2019). Refrigerant options in the near future. Journal of Sustainable Development of Energy, Water and Environment Systems, 7(2), 293–304. Link to source: https://doi.org/10.13044/j.sdewes.d6.0250
Sarah Gleeson, Ph.D.
Ruthie Burrows, Ph.D.
James Gerber, Ph.D.
Daniel Jasper
Alex Sweeney
Aiyana Bodi
James Gerber, Ph.D.
Hannah Henkin
Heather McDiarmid, Ph.D.
Ted Otte
Amanda D. Smith, Ph.D.
For every kt high-GWP refrigerant phased out in favor of low-GWP refrigerant, approximately 460,000 t CO₂‑eq/yr of F-gas emissions will be mitigated on a 100-yr basis (Table 1). If medium-GWP refrigerants are instead adopted in certain applications (Figure 2), the effectiveness decreases to 400,000 t CO₂‑eq (100-yr)/kt high-GWP refrigerant phased out/yr. Effectiveness is based on average GWP of the high-, low-, and medium-GWP refrigerants; the difference in refrigerant charge; and the expected percent released to the atmosphere.
Since F-gases are short-lived climate pollutants, the effectiveness of this solution on a 20-yr basis is higher than on a 100-yr basis. Switching to low-GWP refrigerants saves 860,000 t CO₂‑eq /kt high-GWP refrigerant phased out/yr on a 20-yr basis. Medium-GWP refrigerants in certain applications reduces the effectiveness to 700,000 t CO₂‑eq (20-yr)/kt high-GWP refrigerant phased out/yr.
Using low-GWP refrigerants mitigates almost all CO₂‑eq emissions from direct release of high-GWP refrigerants. Medium-GWP refrigerants potentially offer a faster path to adoption in certain applications, but yield a smaller reduction in CO₂‑eq emissions. Switching to the lowest possible GWP refrigerant appropriate for a given application will have the highest effectiveness at cutting emissions.
Table 1. Effectiveness at reducing emissions using low-GWP refrigerants.
Unit: t CO₂‑eq /kt high-GWP refrigerant phased out/yr, 100-yr basis
Average | 460,000 |
We estimated the cost of purchasing and using low-GWP alternative refrigerants and equipment by taking a weighted average across all application types, averaging to US$23 million/kt high-GWP refrigerant phased out/yr. A kt of refrigerant goes a long way; a typical residential air conditioner requires only 0.6–3 kg refrigerant, depending on the country and refrigerant type (CLASP & ATMOsphere, 2022). On average across all applications, the emissions abatement cost for this solution is only US$50/t CO₂‑eq on a 100-yr basis (Table 2), or US$27/t CO₂‑eq on a 20-yr basis.
We separately evaluated the net costs of using medium-GWP refrigerants in some applications (Figure 2). Using medium-GWP refrigerants brought average costs down to US$9.4 million/kt high-GWP refrigerant phased out/yr. The emissions abatement cost is US$24/t CO₂‑eq (100-yr basis) or US$13/t CO₂‑eq (20-yr basis).
We calculated cost using values of initial cost and annual operation and maintenance costs from Purohit and Höglund-Isaksson (2017). The overall net cost is a weighted average of the average net costs of switching to alternative refrigerants for each of the six refrigerant applications (Figure 2). Costs are likely to change as the HFC phase-down continues under the Kigali Amendment. We did not evaluate external costs such as those to manufacturers.
Although our calculated costs are averages, costs varied widely depending on the specific equipment, refrigerant type, and geographic location. Using ammonia in industrial refrigeration yields net savings of US$24 million/kt high-GWP refrigerant/yr. Low-GWP alternative refrigerants for transport refrigeration lead to cost savings over high- or medium-GWP refrigerants, as do hydrocarbons in residential and commercial air conditioning.
We did not consider energy cost differences due to changes in efficiency. Since electricity costs are the majority of the life-cycle costs for certain equipment, these changes in energy costs may be significant (Goetzler et al., 2016).
Table 2. Cost per unit of climate impact for low-GWP refrigerants.
Unit: 2023 US$/t CO₂‑eq , 100-yr basis
Average | 50.00 |
We did not find a learning rate for this solution, although there is evidence that costs of equipment and refrigerant decrease as more alternative refrigerants are deployed. Zanchi et al. (2019) claim that after regulations limiting emissions from F-gases and capping allowable refrigerant GWP were enacted in Europe, component prices for natural refrigerant equipment – particularly in commercial refrigeration – became comparable with lower HFC unit prices. Equipment prices have trended downwards through other similar technological transitions in the past (JMS Consulting & Inforum, 2018).
The cost of refrigerants can change with adoption as well as the cost of equipment. Natural refrigerants tend to be inexpensive, but cost premiums for expensive HFO refrigerants could drop by more than 75% as production volumes increase (Booten et al., 2020). Certain expensive-to-produce alternative refrigerants like HFO-1234yf have limited information about possible future price reductions, but other refrigerant transitions have indicated that prices should decrease due to increased production experience, capacity, and number of producers – especially as patents expire (Sherry et al., 2017).
Speed of action refers to how quickly a climate solution physically affects the atmosphere after it is deployed. This is different from speed of deployment, which is the pace at which solutions are adopted.
At Project Drawdown, we define the speed of action for each climate solution as emergency brake, gradual, or delayed.
Deploy Alternative Refrigerants is an EMERGENCY BRAKE climate solution. It has the potential to deliver a more rapid impact than gradual and delayed solutions. Because emergency brake solutions can deliver their climate benefits quickly, they can help accelerate our efforts to address dangerous levels of climate change. For this reason, they are a high priority.
Permanence
There is a low risk of the emissions reductions for this solution being reversed. Each kt high-GWP refrigerant phased out for a lower-GWP alternative reduces the emissions from refrigerant release during manufacturing, transport, installation, operation, repair, and disposal of equipment.
Additionality
This solution is additional when alternative refrigerant is used in applications that would have used HFCs or other high-GWP refrigerants in recent history. HFCs are not the baseline refrigerant in every scenario: hydrocarbons, for example, have been widely used in residential refrigeration and ammonia in industrial refrigeration for many years.
In our analysis, we considered any path to adoption of alternative refrigerants to be part of its effectiveness at reducing GHG emissions. For example, we considered all HFC reductions mandated by policy to be considered additional over baseline HFC usage. However, some GHG accounting or crediting organizations would consider this regulatory additionality; the only emissions reductions that count as additional would be those not mandated by international, regional, and application-specific policy limits.
We estimated that 440 kt high-GWP refrigerants already have been phased out in favor of low-GWP alternative refrigerants worldwide (Table 3). For adoption, we did not differentiate between low- and medium-GWP alternative refrigerants due to insufficient data.
There are limited recent and global data available to quantify the adoption of alternative refrigerants. For this reason, our approach to quantifying adoption is a simplified approximation. We used projected 2022 HFC emissions from Velders et al. (2015) as our baseline. These projections were made before any Kigali Amendment phase-down began, and we assumed they represent a reasonable 2022 emissions picture in the absence of policy-regulated HFC reductions.
To calculate current adoption, we analyzed a Velders et al. (2022) model of 2022 HFC emissions accounting for current policies. Projected 2022 emissions in the current model were 6.4% lower than the 2015-projected baseline, which we assumed to be proportional to the amount of high-GWP HFC phased out and replaced with low-GWP alternatives. We estimated current adoption by applying this assumption to an estimated 6,480 kt bank of existing refrigerants (Climate and Ozone Protection Alliance, 2025). That bank includes all HFC and ozone-depleting refrigerants in new, in-use, and end-of-life equipment, and represents the potential refrigerant that could be replaced by alternative refrigerants. Since some alternative refrigerants were adopted before our 2015 baseline, the current adoption value is likely an underestimate.
Some applications are known to have higher levels of current adoption than others. For example, 800 million domestic refrigerators are estimated to use isobutane refrigerant globally, and most of the market for commercial supermarket plug-in cases in Europe, the United States, and Japan use hydrocarbons such as propane (Hayes et al., 2023; UNEP, 2023).
Table 3. Current (2022 modeled) adoption level of low-GWP alternative refrigerants relative to 2015 baseline levels.
Unit: kt high-GWP refrigerant phased out
Estimate | 440 |
We estimated that 77 kt high-GWP refrigerants are phased out for alternative low-GWP refrigerants each year (Table 4). Using the same method as current adoption, we compared baseline and policy-adjusted projections of HFC emissions from Velders et al. (2015, 2022) for 2019–2022. The difference between the projections increased by a median 1.2% year-over-year.
We applied this percent change directly to the 2022 HFC refrigerant bank estimate to determine the tonnage of high-GWP refrigerant that will be phased out as new equipment replaces decommissioned stock. We assumed the replacements all use low-GWP refrigerants.
Although more HFC is being phased out each year, the bank and associated emissions of HFCs are also growing as refrigeration and cooling equipment are more heavily used globally. Alternative refrigerant adoption will need to outpace market growth before net emissions reductions occur. The adoption trend is likely higher today than what is reflected by the data used in our calculations (prior to 2023), since 2024 was a Kigali-mandated increase in HFC phase-down for certain countries. We expect adoption trend to continue to increase as HFC restrictions tighten further in the future.
Table 4. 2019–2022 adoption trend of low-GWP alternative refrigerants.
Unit: kt high-GWP refrigerant phased out/yr
Estimate | 77 |
The adoption ceiling for this solution is phasing out all high-GWP refrigerants, or 6,900 kt globally (Table 5). This value represents the entire current bank of HFCs and ozone-depleting refrigerants added to the current adoption of low-GWP refrigerants (Climate and Ozone Protection Alliance, 2025).
This quantity assumes no increase in the total refrigerant bank above 2022 levels, while in reality the bank is projected to increase substantially as demand for cooling and refrigeration grows worldwide (International Energy Agency [IEA], 2023). Consumption of refrigerants in stationary air conditioning applications alone is projected to increase 3.5-fold between 2020–2050 (Denzinger, 2023). Additionally, new equipment that uses refrigerants (such as heat pump water heaters) is expected to replace non-refrigerant equipment, adding to future refrigerant demand. However, projecting future refrigerant demand was not part of this assessment.
We assumed that in all future cases, high-GWP refrigerants can be phased out for low-GWP alternatives. While ambitious, this ceiling is possible across all applications as new refrigerants, blends, and equipment are developed and commercialized. Since we considered implementation in new equipment, it comes with an adoption delay as existing equipment with high-GWP refrigerants finish their lifespans, which can last 10–20 years (California Public Utilities Commission, 2022; CLASP & ATMOsphere, 2022).
Table 5. Adoption ceiling for low-GWP refrigerants.
Unit: kt high-GWP refrigerant phased out
Estimate | 6,900 |
The achievable adoption range is clearly laid out by the Kigali Amendment schedule for reduction in HFC consumption and production. The Achievable – Low adoption assumes that worldwide, all countries meet the Kigali phase-down schedule and collectively reach 80% reduction from baseline emissions by 2045. Under the Kigali Amendment, all participating countries are expected to meet at least this standard by this date. It is achievable that this adoption level could be reached collectively across all nations (including higher-adopting countries and non-Kigali signatories). This comes to 5,500 kt reduction in high-GWP refrigerants, calculated as 80% of the sum of net bank and current adoption (Table 6).
Achievable – High assumes that all countries average the highest Kigali-mandated HFC reduction levels for any country (85% reduction from baseline), which comes to 5,900 kt high-GWP refrigerant phased out when applied to our adoption ceiling. If countries continue to follow the Kigali Amendment phase-down schedule, most production and use of HFCs will be eliminated over the coming decades. Other high-GWP ozone-depleting refrigerants are mostly phased out of new production under the Montreal Protocol, although large quantities still exist in refrigerant banks (Montreal Protocol on Substances That Deplete the Ozone Layer, 1987).
Our achievable adoption values do not account for growth in the refrigerant bank over 2022 levels. Although refrigerant use is expected to grow substantially in the coming decades (IEA, 2023), we did not project future demand as part of our assessment. If HFC phaseout does not outpace refrigerant demand growth, emissions can increase despite more widespread adoption of this solution. Lowering the demand for refrigerant while ensuring that all people have access to refrigeration, heating, and cooling will be challenging.
Table 6. Range of achievable adoption levels for low-GWP refrigerants.
Unit: kt high-GWP refrigerant phased out
Current Adoption | 440 |
Achievable – Low | 5500 |
Achievable – High | 5900 |
Adoption Ceiling | 6900 |
This solution has high potential climate impact due to both the quantity and high GWP of many current refrigerants. High-GWP refrigerant already phased out for low-GWP alternatives has an estimated current climate impact of 0.20 Gt CO₂‑eq/yr on a 100-yr basis (Table 7). If the Kigali Amendment HFC phasedown schedule is followed globally, we expect the achievable-adoption climate impact to be 2.5–2.7 Gt CO₂‑eq (100-yr)/yr. Reaching the adoption ceiling could potentially mitigate 3.2 Gt CO₂‑eq (100-yr)/yr.
Due to the short lifetime of most high-GWP refrigerants, the climate benefit of phasing them out for alternatives is higher on a 20-year time horizon, making this solution highly impactful in the short-term. The use of low-GWP refrigerants currently saves an estimated 0.38 Gt CO₂‑eq (20-yr)/yr. The achievable 20-year impact is 4.7–5.0 Gt CO₂‑eq/yr, with a ceiling of 5.9 Gt CO₂‑eq/yr.
Since medium-GWP refrigerants are less effective at reducing emissions, the climate impacts are lower. If the same achievable adoption scenarios are reached but the effectiveness is calculated for medium-GWP refrigerants in commercial refrigeration, transport refrigeration, and stationary air conditioning applications, the climate impact reduces to 2.2–2.4 Gt CO₂‑eq (100-yr)/yr or 3.9–4.1 Gt CO₂‑eq (20-yr)/yr.
Our findings differ from some prominent literature estimates of the scale of current refrigerant emissions. The Green Cooling Initiative (n.d.) reports 1.4 Gt CO₂‑eq/yr in total direct refrigerant emissions in 2024. The Intergovernmental Panel on Climate Change (IPCC) Sixth Assessment (2023) estimates less than 1.0 Gt CO₂‑eq/yr in 2019. We find potential for greater mitigation than these estimates of emissions. This difference could be due to our use of national self-reported emissions data, much of which did not specify sector or particular refrigerant type, leading to uncertainties in average GWPs and refrigerant release rates.
Table 7. Climate impact at different levels of adoption of low-GWP alternative refrigerants.
Unit: Gt CO₂‑eq/yr, 100-yr basis
Current Adoption | 0.20 |
Achievable – Low | 2.50 |
Achievable – High | 2.70 |
Adoption Ceiling | 3.20 |
Transitioning from HFCs to refrigerants with lower GWP can increase jobs (Colbourne et al., 2013; U.S. EPA, 2025). Reports from the Alliance for Responsible Atmospheric Policy and collaborators found that moving toward lower GWP refrigerants in the United States would increase jobs, increase manufacturing outputs of alternative refrigerants, and create more exports, strengthening the United States’ trade position (Inforum et al., 2019; JMS Consulting & Inforum, 2018). It is possible that using alternative refrigerants could lead to consumer savings on energy bills, depending on the alternative refrigerant, application, and equipment design (Colbourne et al., 2013; Purohit & Höglund-Isaksson, 2017; Shah et al., 2019; Zaelke & Borgford-Parnell, 2015). For example, an analysis of mobile air conditioning found that switching to an alternative refrigerant, such as R152a, can lead to high cost savings over its lifetime, and consumers in hotter climates would see the savings benefits (Blumberg et al., 2019). Since efficiency improvements are possible but not guaranteed in all cases, we do not consider this a guaranteed additional benefit.
For a description of the benefits to land resources, please refer to Air Quality below.
Some F-gases such as HFCs are considered per- and polyfluoroalkyl substances (PFAS) and can persist in the environment for centuries, posing serious human and ecosystem health risks (Figure 1) (Dimitrakopoulou et al., 2024; Fenton et al., 2021). PFAS can decompose in the atmosphere to produce trifluoroacetic acid (TFA), which can harm the environment and human health (UNEP, 2023). Possible impacts of high atmospheric TFA concentrations include acid rain, accumulation in terrestrial ecosystems in water and plant matter, and harmful effects on the environment and organisms (Chele et al., 2024; Hanson et al., 2024). Non-fluorinated alternative refrigerants would reduce the amount of PFAS pollution and reduce atmospheric TFA formation, lessening these harmful impacts. Some of these air quality benefits would also benefit indoor air quality because most refrigerants are used in buildings. Using alternative refrigerants avoids leakage of ozone-depleting substances such as HCFCs that can harm the ozone layer (Bolaji & Huan, 2013).
These benefits depend on the alternative refrigerant used – some low-GWP F-gas refrigerants such as HFOs are highly reactive, can be classified as PFAS, and can form TFA and other degradation products (Salvador et al., 2024). Therefore, the type of alternative refrigerant affects whether this is a benefit or a risk (see Risks below for more information). The thresholds at which these impacts occur are not well understood, and more research is needed to understand the potential harmful effects of TFA (Arp et al., 2024).
Some alternative refrigerants – including propane and ammonia – can react in the atmosphere to form polluting or toxic compounds (Chele et al., 2024). Low- and medium-GWP HFO or HFC refrigerants degrade into TFA, which is considered by some regulating bodies to be a PFAS, a class of chemicals with a proposed ban in Europe (European Chemicals Agency, 2023; European Environmental Bureau, 2025; Garavagno et al., 2024). Although TFA concentrations are currently low and impacts are minimal, increased HFO use could lead to greater accumulation, making it important to further study the potential risks (Chele et al., 2024; European Environmental Bureau, 2025; Hanson et al., 2024; Holland et al., 2021). Moreover, HFOs are made from high-GWP feedstocks, perpetuating the production and release of high-GWP chemicals (Booten et al., 2020; Chele et al., 2024). The use of other alternative refrigerant chemistries will reduce these risks (see Figure 1 and Additional Benefits).
Alternative refrigerants can be flammable (e.g., propane, ammonia) and toxic (e.g., ammonia). This potentially risks the well-being of people or property due to ignition, explosion, or refrigerant leaks (Shah et al., 2017). Minimizing leaks, reducing proximity to ignition sources, enhancing leak sensing, regulating safe charge sizes, and training installation and maintenance professionals are ways to lower this risk (Secop, 2018). Many alternative refrigerants are classified in ASHRAE safety group A2L, and these refrigerants have a low risk of ignition (Gradient, 2015; Imamura et al., 2015). Many countries have updated their standards in recent years to ensure safe use of low-GWP refrigerants, but adoption can be slowed if building codes do not allow for adoption (Heubes et al., 2012; UNEP, 2023).
Some specific technological solutions are required to avoid risks – for example, ammonia corrodes copper (Dräger, n.d.), and CO₂ refrigerant requires equipment and safety mechanisms that can handle its high operating pressure (Zanchi et al., 2019).
Decreasing food loss and waste could require increases in cold storage capacity, especially in commercial, residential, and transport refrigeration (Babiker, 2017; Food and Agriculture Organization of the United Nations, 2019). Alternative refrigerants will lead to reduced GHG emissions from this new food refrigeration equipment, particularly for high-leakage systems such as supermarket refrigeration. However, if less food is produced to better manage food loss, this could lead to a decreased demand for cold storage (Dong et al., 2021).
Decreasing emissions from air conditioning technology would decrease the effectiveness of other building cooling solutions relative to single-building refrigerant-based air cooling units.
Using alternative refrigerants will decrease the CO₂‑eq emissions from released refrigerants. This means that management practices to reduce refrigerant release will save fewer CO₂‑eq emissions.
kt high-GWP refrigerant phased out
F-gases
For particular alternative refrigerants and applications, switching to a lower-GWP refrigerant can reduce equipment efficiency (ASHRAE, 2009). Such a switch would decrease direct emissions due to reduction in refrigerant GWP, but would increase emissions associated with electricity generation.
Less efficient refrigerants may also require larger equipment and heavier masses of refrigerants, increasing the emissions for producing and transporting appliances. Fabris et al. (2024) reported that transport refrigeration systems using CO₂ refrigerant are heavier, leading to a 9.3% increase in emissions from fuel consumption during transport.
Consensus of effectiveness in reducing emissions: High
Phasing out high-GWP refrigerants for low or medium-GWP refrigerants is unquestionably effective at reducing emissions from refrigerant use.
In a report from two U.S. national laboratories, Booten et al. (2020) claim that systems using F-gas refrigerants for refrigeration and air conditioning are “the most difficult and impactful” innovation spaces for refrigerants. Zaelke and Borgford-Parnell (2015) asserted that reducing short-lived climate pollutants including HFCs “is the most effective strategy for constraining warming and associated impacts in the near term.” Utilizing low-GWP alternative refrigerants is a proven means to achieve this.
The IPCC Sixth Assessment (2023) cites the World Meteorological Organization (2018) and Höglund-Isaksson et al. (2017) in claiming that worldwide compliance with the Kigali Amendment schedule would reduce HFC emissions by 61% over baseline emissions by 2050. Velders et al. (2022) modeled future HFC emissions under the Kigali Amendment and found that these HFC reductions could save 3.1–4.4 Gt CO₂‑eq , 100-yr basis/yr by 2050. Dreyfus et al. (2020) estimate possible cumulative savings of 33–47 Gt CO₂‑eq (100-yr) through 2050, with an additional 53 Gt CO₂‑eq (100-yr) through 2060 if HFC phase-down is immediate.
Expert consensus is that the potential impact of alternative refrigerants will increase as a warming climate and increased population and development drive demand for higher use of cooling equipment (Campbell et al., 2018; Dreyfus et al., 2020; Petri & Caldeira, 2015). This will particularly be true for developing countries in already warm climates (Dong et al., 2021).
The results presented in this document summarize findings from one review article, six original studies, two reports, one international treaty, two industry guidelines, one conference proceeding, and eight national GHG inventory submissions to the United Nations. This reflects current evidence from 34 countries, primarily Annex 1 countries as identified by the United Nations as well as China. We recognize this limited geographic scope creates bias, and hope this work inspires research and data sharing on this topic in underrepresented regions.
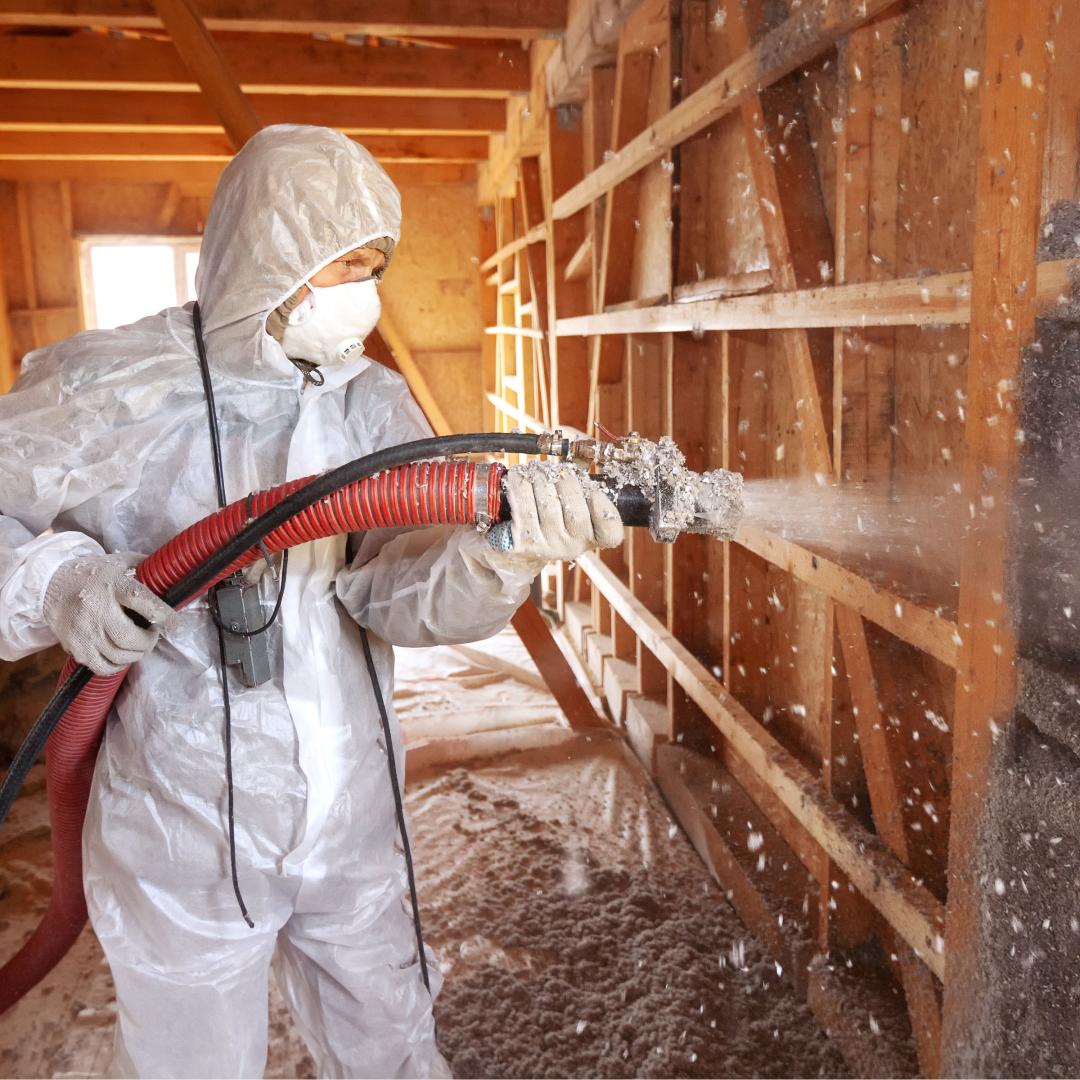
Deploy Alternative Insulation Materials is defined as using alternative building insulation materials in place of conventional ones. In particular, we highlight the impact of using cellulose instead of glass, mineral, or plastic insulation in new and retrofit buildings. Cellulose insulation manufacture and installation emits fewer GHGs to reach the same operational insulating performance than does manufacture and installation of conventional materials.
Thermal insulation materials are used in the walls, roofs, and floors of buildings to help maintain comfortable indoor temperatures. However, manufacture and installation of insulation materials produces GHG emissions. These are called embodied emissions because they occur before the insulation is used in buildings. Insulation embodied emissions offset a portion of the positive climate impacts from using insulation to reduce heating and cooling demand. A Canadian study found that over 25% of residential embodied emissions from manufacturing building materials can be due to insulation (Magwood et al., 2022). Using cellulose insulation made primarily from recycled paper avoids some embodied emissions associated with conventional insulation.
Insulation is manufactured in many different forms, including continuous blankets or boards, loose fill, and sprayed foam (Types of Insulation, n.d.). Most conventional insulation materials are nonrenewable inorganic materials such as stone wool and fiberglass. These require high temperatures (>1,300 °C) to melt the raw ingredients, consuming thermal energy and releasing CO₂ from fossil fuel combustion or grid power generation (Schiavoni et al., 2016). Other common insulations are plastics, including expanded polystyrene (EPS), extruded polystyrene (XPS), polyurethane (PUR), and polyisocyanurate (PIR). Producing these plastics requires the extraction of fossil fuels – primarily petroleum – for feedstocks, as well as high amounts of energy for processing (Harvey, 2007).
F-gases are often used as blowing agents to manufacture rigid foam board insulation or install sprayed foam insulation. F-gases are GHGs with GWPs that can be hundreds or thousands of times higher than CO₂. High-GWP F-gases used in foam production are released into the atmosphere during all subsequent stages of the foam’s life cycle (Biswas et al., 2016; Waldman et al., 2023). The climate benefits of this solution during the installation stage are primarily due to avoiding these blowing agents.
Alternative insulation is produced from plant or animal biomass (bio-based materials) or waste products (recycled materials). Alternative insulation materials provide climate benefits by consuming less manufacturing energy, using renewable materials in place of fossil fuels, and eliminating high-GWP blowing agents (Sustainable Traditional Buildings Alliance, 2024).
Figure 1 compares a variety of conventional and alternative insulation materials. While many bio-based and recycled materials could be used as alternatives to these conventional materials, this solution focuses on cellulose due to its effectiveness in avoiding emissions, low cost, and wide availability. Cellulose insulation is made primarily from recycled paper fibers, newsprint, and cardboard. These products are made into fibers and blended with fire retardants to produce loose or batt cellulose insulation (Waldman et al., 2023; Wilson, 2021).
Figure 1. Properties and adoption of conventional and alternative insulation materials. Costs and emissions will vary from the values here depending on the insulation form (board, blanket, loose-fill, etc.).
Category | Material | High-GWP F-gases used? | Median manufacturing and installation emissions* | Mean product and installation cost** | Estimated market share (% by mass) |
---|---|---|---|---|---|
Conventional materials | Stone wool | No | 0.31 | 623 | 20 |
Glass wool (fiberglass) | No | 0.29 | 508 | 34 | |
EPS | No | 0.38 | 678 | 22 | |
XPS | Yes, sometimes | 9.44 | 702 | 7 | |
PUR/PIR | Yes, sometimes | 6.14 | 1,000 | 11 | |
Alternative materials | Cellulose | No | 0.05 | 441 | 2–13 |
Cork | No | 0.30 | 1,520 | Commercially available, not widely used | |
Wood fiber | No | 0.13 | 814 | Commercially available, not widely used | |
Plant fibers (kenaf, hemp, jute) | No | 0.18 | 467 | Commercially available, not widely used | |
Sheep’s wool | No | 0.14 | 800 | Commercially available, not widely used | |
Recycled PET plastic | No | 0.12 | 2,950 | Commercially available, not widely used |
*t CO₂‑eq (100-yr) to insulate 100m² to 1m²·K/W
**2023 US$ to insulate 100m² to 1m²·K/W. We use mean values for cost analysis to better capture the limited data and wide range of reported costs.
Although we are estimating the impact of using cellulose insulation in all buildings, the unique circumstances of each building are important when choosing the most appropriate insulation material. In this solution, we do not distinguish between residential and commercial buildings, retrofit or new construction, different building codes, or different climates, but these would be important areas of future study.
In this solution, the effectiveness, cost, and adoption are calculated over a specified area (100 m²) and thermal resistance (1 m²·K/W). The chosen adoption unit ensures that all data are for materials with the same insulating performance. Due to limited material information, we assumed that insulation mass scales linearly with thermal resistance.
To better understand the adoption unit, a one-story residential building of 130 m² floor area would require approximately 370 m² of insulation area (RSMeans, & The Gordian Group, 2023). For a cold climate like Helsinki, Finland, code requires insulation thermal resistance of 11 m²·K/W (The World Bank, n.d.). For a warm climate like Jerusalem, Israel, envelope thermal resistance requirements average 1.1 m²·K/W (The World Bank, n.d.). Therefore, depending on the location, anywhere from approximately 4–40 adoption units insulating 100 m² to 1 m²·K/W may be needed to insulate a small single-story home to the appropriate area and insulation level.
Would you like to help deploy alternative insulation? Below are some ways you can make a difference, depending on the roles you play in your professional or personal life.
These actions are meant to be starting points for involvement and may or may not be the most important, impactful, or doable actions you can take. We encourage you to explore, get creative, and take a step that is right for you!
Adams, M., Burrows, V., & Richardson, S. (2019). Bringing embodied carbon upfront: Coordinated action for the building and construction sector to tackle embodied carbon. World Green Building Council, Advancing Net Zero, Ramboll, & C40 Cities. Link to source: https://worldgbc.s3.eu-west-2.amazonaws.com/wp-content/uploads/2022/09/22123951/WorldGBC_Bringing_Embodied_Carbon_Upfront.pdf
Amendment to the Montreal Protocol on substances that deplete the ozone layer. (2016, October 15). Link to source: https://treaties.un.org/doc/Treaties/2016/10/20161015%2003-23%20PM/Ch_XXVII-2.f-English%20and%20French.pdf
Andersen, B., & Rasmussen, T. V. (2025). Biobased building materials: Moisture characteristics and fungal susceptibility. Building and Environment, 112720. Link to source: https://doi.org/10.1016/j.buildenv.2025.112720
Asdrubali, F., D’Alessandro, F., & Schiavoni, S. (2015). A review of unconventional sustainable building insulation materials. Sustainable Materials and Technologies, 4, 1–17. Link to source: https://doi.org/10.1016/j.susmat.2015.05.002
Biswas, K., Shrestha, S. S., Bhandari, M. S., & Desjarlais, A. O. (2016). Insulation materials for commercial buildings in North America: An assessment of lifetime energy and environmental impacts. Energy and Buildings, 112, 256–269. Link to source: https://doi.org/10.1016/j.enbuild.2015.12.013
Cabeza, L. F., Boquera, L., Chàfer, M., & Vérez, D. (2021). Embodied energy and embodied carbon of structural building materials: Worldwide progress and barriers through literature map analysis. Energy and Buildings, 231, 110612. Link to source: https://doi.org/10.1016/j.enbuild.2020.110612
Carbon Removals Expert Group Technical Assistance. (2023, December). Review of certification methodologies for long-term biogenic carbon storage in buildings. European Commission. Link to source: https://climate.ec.europa.eu/system/files/2023-12/policy_carbon_expert_biogenic_carbon_storage_in_buildings_en.pdf
Deer et al. (2007). Alaska Residential Building Manual. Alaska Housing Finance Corporation. Link to source: https://www.ahfc.us/application/files/2813/5716/1325/building_manual.pdf
Esau et al. (2021). Reducing Embodied Carbon in Buildings: Low-Cost, High-Value Opportunities. RMI. Link to source: http://www.rmi.org/insight/reducing-embodied-carbon-in-buildings
The Freedonia Group. (2024). Global insulation report. Link to source: https://www.freedoniagroup.com/industry-study/global-insulation
Fabbri, M., Rapf, O., Kockat, J., Fernández Álvarez, X., Jankovic, I., & Sibileau, H. (2022). Putting a stop to energy waste: How building insulation can reduce fossil fuel imports and boost EU energy security. Buildings Performance Institute Europe. Link to source: https://www.bpie.eu/wp-content/uploads/2022/05/Putting-a-stop-to-energy-waste_Final.pdf
Forestry production and trade. (2023). [Dataset]. FAOSTAT. Link to source: https://www.fao.org/faostat/en/#data/FO
Füchsl, S., Rheude, F., & Röder, H. (2022). Life cycle assessment (LCA) of thermal insulation materials: A critical review. Cleaner Materials, 5, 100119. Link to source: https://doi.org/10.1016/j.clema.2022.100119
Gelowitz, M. D. C., & McArthur, J. J. (2017). Comparison of type III environmental product declarations for construction products: Material sourcing and harmonization evaluation. Journal of Cleaner Production, 157, 125–133. Link to source: https://doi.org/10.1016/j.jclepro.2017.04.133
Global Alliance for Buildings and Construction, International Energy Agency, and the United Nations Environment Programme. (2020). GlobalABC roadmap for buildings and construction: Towards a zero-emission, efficient and resilient buildings and construction sector. International Energy Agency. Link to source: https://www.iea.org/reports/globalabc-roadmap-for-buildings-and-construction-2020-2050
Grazieschi, G., Asdrubali, F., & Thomas, G. (2021). Embodied energy and carbon of building insulating materials: A critical review. Cleaner Environmental Systems, 2, 100032. Link to source: https://doi.org/10.1016/j.cesys.2021.100032
Harvey, L. D. D. (2007). Net climatic impact of solid foam insulation produced with halocarbon and non-halocarbon blowing agents. Building and Environment, 42(8), 2860–2879. Link to source: https://doi.org/10.1016/j.buildenv.2006.10.028
Insulation choices revealed in new study. (2019, June 19). Home Innovation Research Labs. Link to source: https://www.homeinnovation.com/trends_and_reports/trends/insulation_choices_revealed_in_new_study
International Energy Agency. (2023). Building envelopes. Link to source: https://www.iea.org/energy-system/buildings/building-envelopes
International Energy Agency, International Renewable Energy Agency, & United Nations Climate Change High-Level Champions. (2023). Breakthrough agenda report 2023. Link to source: https://www.iea.org/reports/breakthrough-agenda-report-2023
Jelle, B. P. (2011). Traditional, state-of-the-art and future thermal building insulation materials and solutions – Properties, requirements and possibilities. Energy and Buildings, 43(10), 2549–2563. Link to source: https://doi.org/10.1016/j.enbuild.2011.05.015
Kumar, D., Alam, M., Zou, P. X. W., Sanjayan, J. G., & Memon, R. A. (2020). Comparative analysis of building insulation material properties and performance. Renewable and Sustainable Energy Reviews, 131, 110038. Link to source: https://doi.org/10.1016/j.rser.2020.110038
Magwood et al. (2022). Emissions of materials benchmark assessment for residential construction report. Passive Buildings Canada and Builders for Climate Action.
Malhotra, A., & Schmidt, T. S. (2020). Accelerating Low-Carbon Innovation. Joule, 4(11), 2259–2267. Link to source: https://doi.org/10.1016/j.joule.2020.09.004
Mályusz, L., & Pém, A. (2013). Prediction of the learning curve in roof insulation. Automation in Construction, 36, 191–195. Link to source: https://doi.org/10.1016/j.autcon.2013.04.004
Mapping energy efficiency: A global dataset on building code effectiveness and compliance: Country profiles. (n.d.). [Dataset]. The World Bank. Link to source: https://www.worldbank.org/content/dam/sites/buildinggreen/doc/building_green_country_profile.pdf
Maskell, D., Da Silva, C., Mower, K., Rana, C., Dengel, A., Ball, R., Ansell, M., Walker, P., & Shea, A. (2015, June 22). Properties of bio-based insulation materials and their potential impact on indoor air quality. First International Conference on Bio-based Building Materials, Clermont-Ferrand, France.
McGrath et al. (2023). Embodied carbon and material health in insulation. Healthy Building Network, Perkins&Will. Link to source: https://habitablefuture.org/wp-content/uploads/2024/03/96-Carbon-Health-Insulation.pdf
Naldzhiev, D., Mumovic, D., & Strlic, M. (2020). Polyurethane insulation and household products: A systematic review of their impact on indoor environmental quality. Building and Environment, 169, 106559. Link to source: https://doi.org/10.1016/j.buildenv.2019.106559
Northeast Bio-based Materials Collective 2023 summit proceedings. (2023). Link to source: https://massdesigngroup.org/sites/default/files/file/2024/Northeast%20Bio-Based%20Materials%20Collective%202023%20Summit%20Proceedings.pdf
Petcu et al. (2023). Research on thermal insulation performance and impact on indoor air quality of cellulose-based thermal insulation materials. Materials, 16(15), Article 15. Link to source: https://doi.org/10.3390/ma16155458
Rabbat, C., Awad, S., Villot, A., Rollet, D., & Andrès, Y. (2022). Sustainability of biomass-based insulation materials in buildings: Current status in France, end-of-life projections and energy recovery potentials. Renewable and Sustainable Energy Reviews, 156, 111962. Link to source: https://doi.org/10.1016/j.rser.2021.111962
Riverse. (2024, August). Methodology: Biobased construction materials. Link to source: https://www.riverse.io/methodologies/biobased-construction-materials
RSMeans, & The Gordian Group. (2023, September). Installed cost of residential siding comparative study – September 2023 [Report]. The Brick Industry Association. Link to source: https://www.gobrick.com/content/userfiles/files/RSMeans%20Residential%20Siding%20Comparative%20Cost%20Wall%20System%20Study%20Final%202023-09-15.pdf
SaravanaPrabhu et al. (2021). Comparative analysis of learning curve models on construction productivity of diaphragm wall and pile. IOP Conference Series: Materials Science and Engineering, 1197(1), 012004. Link to source: https://doi.org/10.1088/1757-899X/1197/1/012004
Schiavoni, S., D׳Alessandro, F., Bianchi, F., & Asdrubali, F. (2016). Insulation materials for the building sector: A review and comparative analysis. Renewable and Sustainable Energy Reviews, 62, 988–1011. Link to source: https://doi.org/10.1016/j.rser.2016.05.045
Schulte, M., Lewandowski, I., Pude, R., & Wagner, M. (2021). Comparative life cycle assessment of bio-based insulation materials: Environmental and economic performances. GCB Bioenergy, 13(6), 979–998. Link to source: https://doi.org/10.1111/gcbb.12825
Stamm et al. (2022). Chemical and environmental justice impacts in the life cycle of building insulation. Energy Efficiency for All, Healthy Building Network. Link to source: https://informed.habitablefuture.org/resources/research/20-chemical-and-environmental-justice-impacts-in-the-life-cycle-of-building-insulation-report-brief
Sustainable Traditional Buildings Alliance. (2024, March). The use of natural insulation materials in retrofit. Link to source: https://stbauk.org/wp-content/uploads/2024/03/The-use-of-natural-insulation-materials-in-retrofit.pdf
The World Bank. (n.d.). Mapping energy efficiency: A global dataset on building code effectiveness and compliance. Link to source: https://www.worldbank.org/content/dam/sites/buildinggreen/doc/building_green_main_findings.pdf
Types of insulation. (n.d.). U.S. Department of Energy. Link to source: https://www.energy.gov/energysaver/types-insulation
Waldman et al. (2023). 2023 Carbon Leadership Forum North American material baselines. Carbon Leadership Forum, University of Washington. Link to source: https://carbonleadershipforum.org/clf-material-baselines-2023/
Wang et al. (2023). Can paper waste be utilised as an insulation material in response to the current crisis. Sustainability, 15(22), Article 22. Link to source: https://doi.org/10.3390/su152215939
Wi, S., Kang, Y., Yang, S., Kim, Y. U., & Kim, S. (2021). Hazard evaluation of indoor environment based on long-term pollutant emission characteristics of building insulation materials: An empirical study. Environmental Pollution, 285, 117223. Link to source: https://doi.org/10.1016/j.envpol.2021.117223
Wilson. (2021). The BuildingGreen guide to thermal insulation: What you need to know about performance, health, and environmental considerations. BuildingGreen, Inc.
Zabalza Bribián, I., Valero Capilla, A., & Aranda Usón, A. (2011). Life cycle assessment of building materials: Comparative analysis of energy and environmental impacts and evaluation of the eco-efficiency improvement potential. Building and Environment, 46(5), 1133–1140. Link to source: https://doi.org/10.1016/j.buildenv.2010.12.002
Sarah Gleeson, Ph.D.
Ruthie Burrows, Ph.D.
James Gerber, Ph.D.
Yusuf Jameel, Ph.D.
Daniel Jasper
Alex Sweeney
Aiyana Bodi
Hannah Henkin
Ted Otte
Amanda D. Smith, Ph.D.
Christina Swanson, Ph.D.
To insulate 100 m² to a thermal resistance of 1 m²·K/W using entirely cellulose insulation in place of the current baseline mix of insulation materials is expected to avoid 1.59 t CO₂‑eq on a 100-yr basis (Table 1). Since many of the avoided emissions are F-gases, the 20-yr effectiveness is higher, avoiding 4.07 t CO₂‑eq per unit of insulation. Effectiveness for this solution measures the one-time reduced emissions from manufacturing and installing insulation. Insulation also reduces the energy used while a building is operating, but those emissions are addressed separately in the Improve Building Envelopes solution.
Conventional insulation effectiveness was considered to be a weighted average effectiveness of the current baseline insulation mix, including a small amount of cellulose insulation currently in use.
The largest contributor to conventional insulation embodied emissions is using high-GWP blowing agents to manufacture or install XPS, PUR, or PIR foam. We assumed the use of F-gas blowing agents for all foams, although these are already being regulated out of use globally (Amendment to the Montreal Protocol on Substances That Deplete the Ozone Layer, 2016) and an unknown amount of low-GWP blowing agents are currently used (such as hydrocarbons or CO₂). Therefore, we anticipate the effectiveness of this solution will decrease as F-gases are used less in the future. We assumed that 100% of blowing agents are emitted over the product lifetime.
Cellulose has the greatest avoided emissions of all of the alternative materials we evaluated (Figure 1). The next most effective materials were recycled PET, wood fibers, and sheep’s wool. Conventional materials like XPS, PUR, and PIR that are foamed with F-gases had the highest GHG emissions. For bio-based materials, we did not consider biogenic carbon as a source of carbon sequestration due to quantification and permanence concerns.
Table 1. Effectiveness at reducing emissions.
Unit: t CO₂‑eq /insulation required to insulate 100 m² to a thermal resistance of 1 m²·K/W, 100-yr basis
25th percentile | 0.98 |
mean | 1.34 |
median (50th percentile) | 1.59 |
75th percentile | 1.81 |
Available cost data are variable for all materials, particularly those in early-stage commercialization. The mean cost of purchasing and installing cellulose insulation is less than that of any other conventional or alternative insulation material (Figure 1). Compared with the average cost of conventional insulation, the mean cost savings for cellulose insulation is US$193/100 m² insulated to a thermal resistance of 1 m²·K/W. Since most buildings are insulated over greater areas to higher thermal resistances, these savings would quickly add up. When considering the mean cost per median climate impact, cellulose insulation saves US$121/t CO₂‑eq (100-yr basis), making it an economically and environmentally beneficial alternative (Table 2).
We considered conventional insulation cost to be a weighted average cost of the current baseline insulation mix, including a small amount of cellulose insulation currently in use.
For conventional insulation, material costs of purchasing the insulation are higher than costs for installation (US$540 and US$97, respectively, to insulate 100 m2 to a thermal resistance of 1 m²·K/W). Cellulose has a lower product cost and comparable installation costs to conventional materials. We considered all costs to be up front and not spread over the lifetime of the material or building. For each material type, cost will vary based on the form of the insulation (board, loose, etc.), and this should be accounted for when comparing insulation options for a particular building.
We determined net costs of insulation materials by adding the mean cost to purchase the product and the best estimation of installation costs based on available information. Installation costs were challenging to find data on and therefore represent broad assumptions of installation type and labor. Cost savings were determined by subtracting the weighted average net cost of conventional materials to the net cost of an alternative material. Although we used median values for other sections of this assessment, the spread of data was large for product cost estimates and the mean value was more appropriate in the expert judgment of our reviewers.
Table 2. Cost per unit of climate impact.
Unit: 2023 US$/t CO₂‑eq, 100-yr basis
estimate | -121 |
Little information is available about the learning rate for new insulation materials. Mályusz and Pém (2013) evaluated how labor time decreased with repetitive cycles for installing roof insulation. They found a learning rate of ~90%, but only for this specific insulation scenario, location, and material. Additionally, this study does not include any product or manufacturing costs that may decrease with scale.
In general, labor time for construction projects decreases with repetitive installation, including improved equipment and techniques and increased construction crew familiarity with the process (SaravanaPrabhu & Vidjeapriya, 2021). However, Malhotra and Schmidt (2020) classify building envelope retrofits as technologies that are highly customized based on user requirements, regulations, physical conditions, and building designs, likely leading to learning rates that are slow globally but where local expertise could reduce installation costs.
Speed of action refers to how quickly a climate solution physically affects the atmosphere after it is deployed. This is different from speed of deployment, which is the pace at which solutions are adopted.
At Project Drawdown, we define the speed of action for each climate solution as emergency brake, gradual, or delayed.
Deploy Alternative Insulation Materials is an EMERGENCY BRAKE climate solution. It has the potential to deliver a more rapid impact than gradual and delayed solutions. Because emergency brake solutions can deliver their climate benefits quickly, they can help accelerate our efforts to address dangerous levels of climate change. For this reason, they are a high priority.
Manufacturing and installation emissions reductions due to the use of alternative building thermal insulation materials are both permanent and additional.
Permanence
There is a low risk of the emissions reductions for this solution being reversed. By using cellulose insulation instead of inorganic or plastic-based insulation, a portion of the manufacturing and installation emissions are never generated in the first place, making this a permanent reduction. Emissions from high-temperature manufacturing, petroleum extraction, and blowing agent use are all reduced through this approach.
Additionality
The GHG emissions reductions from alternative insulation materials are additional because we calculated them relative to a baseline insulation case. This includes a small amount of cellulose materials included in baseline building insulation. Therefore, avoided emissions represent an improvement of the current emissions baseline that would have occurred in the absence of this solution.
Adoption data are extremely limited for alternative insulation materials. All adoption data and estimates are assumed to apply to both residential and commercial buildings, although in reality the uptake of alternative insulation materials will vary by building type due to differences in structures, climate, use type, and regulations. We assume that future uptake of alternative insulation is used only during retrofit or new construction, or when existing insulation is at the end of its functional lifetime.
European sources report that 2–13% of the insulation market is alternative materials. Depending on the source, this could include renewable materials, bio-based insulation, or recycled materials. In 2018 in the United States, 5% of total insulation area in new single-family homes was insulated with cellulose (Insulation Choices Revealed in New Study, 2019).
To convert estimated cellulose adoption percentage into annual insulation use, we estimated 26 Mt of all installed global insulation materials in 2023 based on a report from The Freedonia Group (2024). We calculated an annual use of approximately 1.7 billion insulation units of 100 m² at a thermal resistance of 1 m²·K/W. Therefore, the median cellulose adoption is 14 million units/yr at 100 m² at 1 m²·K/W, calculated from the median of the 2–13% adoption range.
Since this calculation is based on more alternative materials than just cellulose and is heavily reliant on European data where we assume adoption is higher, this estimate of current adoption (Table 3) is most likely an overestimate.
The little adoption data that were considered in this section are mostly for Europe, and some for the United States. We recognize this limited geographic scope creates bias, and hope this work inspires research and data sharing on this topic in underrepresented regions.
Table 3. Current (2017–2022) adoption level.
Unit: units of insulation/yr installed to insulate 100 m² to a thermal resistance of 1 m²·K/W
25th percentile | 9000000 |
mean | 13000000 |
median (50th percentile) | 14000000 |
75th percentile | 17000000 |
Very few data are available that quantify adoption trends. In a regional study of several bio-based insulation materials, Rabbat et al. (2022) estimated French market annual growth rates of 4–10%, with cellulose estimated at 10%. Petcu et al. (2023) estimated the European adoption of recycled plastic and textile insulation, biomass fiber insulation, and waste-based insulation to have increased from 6% to 10% between 2012 and 2020.
When accounting for the calculated current adoption, these growth rates mean a median estimated annual increase of 500,000 insulation units/yr required to insulate 100 m² to a thermal resistance of 1 m²·K/W. The increasing adoption of bio-based insulation decreases the use of conventional insulation materials in those regions.
This adoption trend (Table 4) is likely an overestimate, as it is biased by high European market numbers and based on the likely high estimate we made for current adoption.
Table 4. 2012–2020 adoption trend.
Unit: annual change in units of insulation/yr installed to insulate 100 m² to a thermal resistance of 1 m²·K/W
25th percentile | 500000 |
mean | 800000 |
median (50th percentile) | 500000 |
75th percentile | 1300000 |
No estimates have been found for the adoption ceiling of this solution, although we expect it to be high given low rates of current adoption and projected increases in building construction in the coming decades (International Energy Agency [IEA], International Renewable Energy Agency, & United Nations Climate Change High-Level Champions, 2023). Two physical factors that could influence adoption are availability of alternative materials and thickness of insulation.
For cellulose insulation, availability does not seem to limit adoption. The Food and Agriculture Organization of the United Nations (2023) reports that there is a much higher annual production of cellulose-based materials (>300 Mt annually of cartonboard, newsprint, and recycled paper) than the overall demand for insulation globally (>25 Mt annual demand; Global Insulation Report, 2024). However, other uses for cellulose products may create competition for this supply.
Increased thickness of insulation could also be a limiting factor because this would reduce adoption by decreasing building square footage, in particular making retrofits more challenging and expensive. Deer et al. (2007) reported that the average cellulose thermal resistance is similar to mineral and glass wool, and lower than plastic insulations made of polystyrene and other foams. If we assume that 50% of plastic insulation cannot be replaced with cellulose due to thickness limitations, this would represent ~20% of current insulation that could not be replaced without structural changes to the building. Therefore, we calculated the adoption ceiling to be 80% of the current insulation that would be reasonably replaceable, or 140 million units/yr required to insulate 100 m² to a thermal resistance of 1 m²·K/W (Table 5).
Uptake of cellulose insulation could also be limited by its susceptibility to absorbing moisture, limiting its use in wet climates or structures that retain moisture, such as flat roofs. Commercialization of alternative insulation materials beyond cellulose and in many different forms (e.g., board, loose-fill) will increase the adoption ceiling across more building types.
Table 5. Adoption ceiling.
Unit: units of insulation/yr installed to insulate 100 m² to a thermal resistance of 1 m²·K/W
25th percentile | N/A |
mean | N/A |
estimate | 140000000 |
75th percentile | N/A |
We found no estimates for feasible global adoption of this solution. Rabbat et al. (2022) estimated the adoption levels of several bio-based insulation materials in France in 2050. For cellulose wadding, this was estimated to be 2.1 times the commercialized volume in France in 2020. Although we do not expect France to be representative of the rest of the world, if the predicted adoption trend holds across the world then we expect low adoption in 2050 to be 2.1 times greater than 2023 adoption. This is 29 million units/yr to insulate 100 m² to a thermal resistance of 1 m²·K/W (Table 6).
The IEA (2023) claims that building envelopes need to have their retrofit rate increase by 2.5 times over the current rate in order to meet net zero targets (2023). This is a reasonable high-adoption scenario. Assuming that more retrofits of buildings occur and greater amounts of alternative insulation are installed in new buildings, we estimate that high future adoption of new insulation could occur at 2.5 times the rate of the low-adoption scenario. This is 73 million units/yr to insulate 100 m² to a thermal resistance of 1 m²·K/W (Table 6).
Adoption will be facilitated or limited by local regulations around the world. Building codes will determine the location and extent of use of cellulose or other bio-based insulation. We expect uptake to be different between residential and commercial buildings, but due to insufficient data, we have grouped them in our adoption estimates.
Table 6. Range of achievable adoption levels.
Unit: units of insulation/yr installed to insulate 100 m² to a thermal resistance of 1 m²·K/W
Current Adoption | 14000000 |
Achievable – Low | 29000000 |
Achievable – High | 73000000 |
Adoption Ceiling | 140000000 |
The climate impacts for this solution are modest compared to current global GHG emissions. Not all conventional insulations have a high environmental impact due to the use of a wide range of materials, forms, and installation methods as well as the recent adoption of lower-GWP blowing agents. Therefore, the potential for further emissions savings is limited.
We quantified the effectiveness and adoption of cellulose insulation, which has the lowest emissions and, therefore, the highest climate impacts of the insulation materials we evaluated. With high adoption, 1.2 Gt CO₂‑eq on a 100-yr basis could be avoided over the next decade (Table 7).
While we only considered the adoption of cellulose insulation in this analysis, a realistic future for lowering the climate impact of insulation may include other bio-based materials, too. Utilizing a greater range of materials should increase adoption and climate impact due to more available forms, sources, and thermal resistance values of bio-based insulation.
Note that we calculated the current climate impact using a current materials baseline that includes a small fraction of cellulose. This means that the reported current adoption impact is a slight underestimate compared with the impacts for replacing entirely conventional insulation with the current amount of cellulose insulation in use.
Table 7. Climate impact at different levels of adoption.
Unit: Gt CO₂‑eq/yr, 100-yr basis
Current Adoption | 0.022 |
Achievable – High | 0.046 |
Achievable – Low | 0.12 |
Achievable Ceiling | 0.22 |
Some alternative insulations can be cheaper than conventional materials. Although there is large variation in evaluation methods and reported costs, our analysis found that cellulose and plant fibers are cheaper than conventional insulation materials such as stone wool, glass wool, and EPS (Figure 1). Depending on the applicable climate conditions and insulation form, switching to alternative insulation materials can result in cost savings for consumers, including homeowners and business owners.
Conventional insulation materials may contribute to poor indoor air quality, especially during installation, and contribute to eye, skin, and lung irritation (Naldzhiev et al., 2020; Stamm et al., 2022; Wi et al., 2021). Additionally, off-gassing of flame retardants and other volatile organic compounds and by-products of conventional insulation can occur shortly after installation (Naldzhiev et al., 2020). Using bio-based alternative insulation products can minimize the health risks during and after installation (McGrath et al., 2023).
Although there is not a scientifically consistent approach to compare the environmental impacts of conventional and alternative insulation materials, a review analysis of 47 studies on insulation concluded that bio-based insulation materials generally have lower impacts as measured through acidification, eutrophication, and photochemical ozone creation potentials than do conventional materials (Füchsl et al., 2022). Other alternative materials such as wood fiber and miscanthus also tend to have a lower environmental footprint (Schulte et al., 2021). The water demand for wood and cellulose is significantly lower than that for EPS (about 2.8 and 20.8 l/kg respectively compared with 192.7 l/kg for EPS) (Zabalza Bribián et al., 2011). While the limited evidence suggests that the alternative material tends to be better environmentally, there is an urgent need to conduct life cycle assessments using a consistent approach to estimate the impact of these materials.
Cellulose insulation is susceptible to water absorption, which can lead to mold growth in wet or humid environments (Andersen & Rasmussen, 2025; Petcu et al., 2023). Reducing this risk either requires an antifungal treatment for the material or limits adoption to particular climates. The thermal performance of cellulose insulation can decrease over time due to water absorption, settling, or temperature changes, but installing it as dense-packed or damp-spray can alleviate this problem (Wang & Wang, 2023; Wilson, 2021).
Bio-based insulation materials tend to be combustible, meaning they contribute more to the spread of a fire than non-combustible stone or glass insulation. Some bio-based materials are classified as having minimal contribution to a fire, such as some cellulose forms, rice husk, and flax (Kumar et al., 2020). These materials are less likely to contribute to a fire than very combustible plastic insulation such as EPS, XPS, and PUR. Fire codes – as well as other building and energy codes – could limit adoption, risking a lack of solution uptake due to regulatory setbacks (Northeast Bio-Based Materials Collective 2023 Summit Proceedings, 2023).
Additives such as fire retardants and anti-fungal agents are added to bio-based insulation along with synthetic binders, which can lead to indoor air pollution from organic compounds, although likely in low concentrations (Maskell et al., 2015; Rabbat et al., 2022).
Upgrading insulation to lower-cost and lower-emitting alternative materials should increase the adoption of other building envelope solutions as they can be installed simultaneously to optimize cost and performance.
Increasing the manufacturing of cellulose insulation, which contains large amounts of recycled paper, could increase the revenues for paper recycling.
The use of biomass as raw material for insulation will reduce the availability and increase the cost of using it for other applications. For cellulose, global production of cellulose materials (>300 Mt annually of cartonboard, newsprint, and recycled paper (Forestry Production and Trade, 2023) is an order of magnitude higher than the demand for insulation materials (>25 Mt annual demand (The Freedonia Group, 2024), so the overall impact should be small.
Reducing the demand for conventional insulation products and instead making insulation that produces fewer GHGs during manufacturing would slightly reduce the global climate impact of other industrial manufacturing solutions. This is because less energy overall would be used for manufacturing, and therefore other technologies for emissions reductions would be less impactful for insulation production.
insulation units of 100 m² and 1 m²·K/W
CO₂, F-gas
Bio-based insulation materials including cellulose often have lower thermal resistance than some conventional insulation materials. In particular, bio-based materials may require a thicker layer than plastic insulation to reach the same insulating performance (Esau et al., 2021; Rabbat et al., 2022). Usable floor area within a building would need to be sacrificed to accommodate thicker insulation, which would potentially depreciate the structure or impact the aesthetic value (Jelle, 2011). This would be a more significant trade-off for retrofit construction and buildings in densely developed urban areas.
Sourcing bio-based materials has environmental trade-offs that come from cultivating biomass, such as increased land use, fertilizer production, and pesticide application (Schulte et al., 2021). Using waste or recycled materials could minimize these impacts. Binders and flame-retardants may also be required in the final product, leading to more processing and material use (Sustainable Traditional Buildings Alliance, 2024).
The effectiveness of deploying alternative insulation is not inherently dependent on geographic factors since it addresses emissions embodied in the manufacture and deployment of insulation materials. However, due to a lack of related data, we assumed a consistent global breakdown of currently used insulation materials when in reality, the exact mix of insulation currently used in different geographic locations will affect the emissions impact of switching to alternative materials.
Building insulation is used in higher quantities in cold or hot climates, so deploying alternative insulation is more likely to be relevant and adopted in such climates. Other geographic factors also impact adoption: Areas with higher rates of new construction will be better able to design for cellulose or other alternative insulation materials, and drier climates will face a lower risk of mold growth on these materials. Local building codes, including fire codes, can also affect the adoption of alternative materials.
There are no maps for the Deploy Alternative Insulation Materials solution. It is intended to address emissions embodied in the manufacture and deployment of insulation materials and has no intrinsic dependence on geographic factors.
Consensus of effectiveness in reducing building sector emissions: Mixed
There is scientific consensus that using building insulation with lower embodied emissions will reduce GHG emissions, but expert opinions about the magnitude of possible emissions reductions as well as the accuracy of determining these reductions are mixed.
Biswas et al. (2016) determined that, for insulation, avoided emissions from reduced heating and cooling energy tend to outweigh the embodied emissions. However, others emphasize that as buildings become more energy-efficient, material embodied emissions become a larger factor in their carbon footprint (Cabeza et al., 2021; Grazieschi et al., 2021). Embodied emissions from insulation can be substantial: Esau et al. (2021) analyzed a mixed-use multifamily building and found that selecting low-embodied-carbon insulation could reduce building embodied emissions by 16% at no cost premium.
Multiple studies have found that some sustainable insulation materials have lower manufacturing emissions than traditional insulation materials (Asdrubali et al., 2015; Füchsl et al., 2022; Kumar et al., 2020; Schiavoni et al., 2016). However, researchers have highlighted the difficulty in evaluating environmental performance of different insulation materials (Cabeza et al., 2021; Grazieschi et al., 2021). Gelowitz and McArthur (2017) found that construction product Environmental Product Declarations contain many errors and discrepancies due to self-contradictory or missing data. Füschl et al. (2022) conducted a meta-analysis and cautioned that “it does not appear that a definitive ranking [of insulation materials] can be drawn from the literature.” In our analysis, we attempted to compare climate impact between materials, but we acknowledge that this can come from flawed and inconsistent data.
Despite the difficulties in comparing materials, there is high consensus that cellulose is a strong low-emissions insulation option due to its low embodied carbon, high recycled content, and good thermal insulating performance (Wilson, 2021).
The results presented in this document summarize findings from four reviews and meta-analyses, 14 original studies, three reports, 27 Environmental Product Declarations, and two commercial websites reflecting current evidence from eight countries as well as data representing global, North American, or European insulation materials. We recognize this limited geographic scope creates bias, and hope this work inspires research and data sharing on this topic in underrepresented regions.
Cement is a key ingredient of concrete, a manufactured material used in massive quantities around the world. Cement production generates high CO₂ emissions from the production of clinker, a binding ingredient. These emissions come from not only the chemical reaction that produces clinker, but also burning fossil fuels to provide heat for this reaction. We define the Improve Cement Production solution as reducing GHG emissions related to cement manufacturing by substituting other materials for clinker, using alternative fuels, and improving process efficiency.
Would you like to help reduce the climate impacts of cement production? Below are some ways you make a difference, depending on the roles you play in your professional or personal life.
These actions are meant to be starting points for involvement and may or may not be the most important, impactful, or doable actions you can take. We encourage you to explore, get creative, and take a step that is right for you!
Afsah, S. (2004). CDM potential in the cement sector: The challenge of demonstrating additionality. Performeks LLC. Link to source: https://www.performeks.com/media/downloads/CDM-Cement%20Sector_May%202004.pdf
Cannon, C., Guido, V., & Wright, L. (2021). Concrete solutions guide: Mix it up: Supplementary cementitious materials (SCMs). RMI. Link to source: https://rmi.org/wp-content/uploads/2021/08/ConcreteGuide2.pdf
Cao, Z., Masanet, E., Tiwari, A., and Akolawala, S. (2021). Decarbonizing concrete: Deep decarbonization pathways for the cement and concrete cycle in the United States, India, and China. Industrial Sustainability Analysis Laboratory. Link to source: https://www.climateworks.org/wp-content/uploads/2021/03/Decarbonizing_Concrete.pdf
Cavalett, O., Watanabe, M. D. B., Voldsund, M., Roussanaly, S., & Cherubini, F. (2024). Paving the way for sustainable decarbonization of the European cement industry. Nature Sustainability, 7, 568–580. Link to source: https://doi.org/10.1038/s41893-024-01320-y
CEMBUREAU. (n.d.) Clinker substitution. Retrieved August 7, 2024, from Link to source: https://lowcarboneconomy.cembureau.eu/5-parallel-routes/resource-efficiency/clinker-substitution/
Clark, G., Davis, M., Shibani, & Kumar, A. (2024). Assessment of fuel switching as a decarbonization strategy in the cement sector. Energy Conversion and Management, 312, 118585. Link to source: https://doi.org/10.1016/j.enconman.2024.118585
ClimeCo. (2022). Low carbon cement production. Link to source: https://www.climateactionreserve.org/wp-content/uploads/2022/10/Low-Carbon-Cement-Issue-Paper-05-20-2022_final.pdf
Daehn, K., Basuhi, R., Gregory, J., Berlinger, M., Somjit, V., & Olivetti, E. A. (2022). Innovations to decarbonize materials industries. Nature Reviews Materials, 7, 275–294. Link to source: https://doi.org/10.1038/s41578-021-00376-y
de Puy Kamp, M. (2021, July 9). How marginalized communities in the South are paying the price for ‘green energy’ in Europe. CNN. Link to source: https://edition.cnn.com/interactive/2021/07/us/american-south-biomass-energy-invs/
European Cement Research Academy. (2022). The ECRA technology papers 2022: State of the art cement manufacturing, current technologies and their future development. Link to source: https://api.ecra-online.org/fileadmin/files/tp/ECRA_Technology_Papers_2022.pdf
Georgiopoulou, M., & Lyberatos, G. (2018). Life cycle assessment of the use of alternative fuels in cement kilns: A case study. Journal of Environmental Management, 216, 224–234. Link to source: https://doi.org/10.1016/j.jenvman.2017.07.017
Glenk, G., Kelnhofer, A., Meier, R., & Reichelstein, S. (2023). Cost-efficient pathways to decarbonizing Portland cement production. ZEW - Centre for European Economic Research Discussion Paper No. 23-023. Link to source: https://doi.org/10.2139/ssrn.4434830
Global Cement and Concrete Association. (2021). Concrete future: The GCCA 2050 cement and concrete industry roadmap for net zero concrete. Link to source: https://gccassociation.org/concretefuture/wp-content/uploads/2021/10/GCCA-Concrete-Future-Roadmap-Document-AW.pdf
Goldman, S., Majsztrik, P., Sgro Rojas, I., Gavvalapalli, M., Gaikwad, R., Feric, T., Visconti, K., & McMurty, B. (2023). Pathways to commercial liftoff: Low-carbon cement. U.S. Department of Energy. Link to source: https://liftoff.energy.gov/wp-content/uploads/2023/09/20230918-Pathways-to-Commercial-Liftoff-Cement.pdf
Gómez, D. R., & Watterson, J. D., et al. (2006). Stationary combustion. In S. Eggelston, L. Buendia, K. Miwa, T. Ngara, & K. Tanabe (Eds.), 2006 IPCC guidelines for national greenhouse gas inventories (Vol. 2). Institute for Global Environmental Strategies (IGES) for the IPCC. Link to source: https://www.ipcc-nggip.iges.or.jp/public/2006gl/pdf/2_Volume2/V2_2_Ch2_Stationary_Combustion.pdf
Griffiths, S., Sovacool, B. K., Furszyfer Del Rio, D. D., Foley, A. M., Bazilian, M. D., Kim, J., & Uratani, J. M. (2023). Decarbonizing the cement and concrete industry: A systematic review of socio-technical systems, technological innovations, and policy options. Renewable and Sustainable Energy Reviews, 180, 113291. Link to source: https://doi.org/10.1016/j.rser.2023.113291
Habert, G., Miller, S. A., John, V. M., Provis, J. L., Favier, A., Horvath, A., & Scrivener, K. L. (2020). Environmental impacts and decarbonization strategies in the cement and concrete industries. Nature Reviews Earth & Environment, 1, 559–573. Link to source: https://doi.org/10.1038/s43017-020-0093-3
Hottle, T., Hawkins, T. R., Chiquelin, C., Lange, B., Young, B., Sun, P., Elgowainy, A., & Wang, M. (2022). Environmental life-cycle assessment of concrete produced in the United States. Journal of Cleaner Production, 363, 131834. Link to source: https://doi.org/10.1016/j.jclepro.2022.131834
International Energy Agency. (2018). Technology roadmap: Low-carbon transition in the cement industry. Link to source: https://www.iea.org/reports/technology-roadmap-low-carbon-transition-in-the-cement-industry
International Energy Agency. (2023a). CO2 emitted and captured in the cement sector and clinker-to-cement ratio in the Net Zero Scenario, 2015–2030. Link to source: https://www.iea.org/data-and-statistics/charts/co2-emitted-and-captured-in-the-cement-sector-and-clinker-to-cement-ratio-in-the-net-zero-scenario-2015-2030
International Energy Agency. (2023b). Global cement production in the Net Zero Scenario, 2010–2030. Link to source: https://www.iea.org/data-and-statistics/charts/global-cement-production-in-the-net-zero-scenario-2010-2030-5260
International Energy Agency. (2023c). Global thermal energy intensity of clinker production by fuel in the Net Zero Scenario, 2010–2030. Link to source: https://www.iea.org/data-and-statistics/charts/global-thermal-energy-intensity-of-clinker-production-by-fuel-in-the-net-zero-scenario-2010-2030
Isabirye, A., & Sinha, A. (2023). Manufacturing sector: Cement manufacturing emissions. ClimateTRACE. Link to source: https://github.com/climatetracecoalition/methodology-documents/blob/main/2023/Manufacturing/Manufacturing%20and%20Industrial%20Processes%20sector-%20Cement%20Manufacturing%20Emissions%20methodology.docx.pdf
Juenger, M. C. G., Snellings, R., & Bernal, S. A. (2019). Supplementary cementitious materials: New sources, characterization, and performance insights. Cement and Concrete Research, 122, 257–273. Link to source: https://doi.org/10.1016/j.cemconres.2019.05.008
Miller, S. A., & Moore, F. C. (2020). Climate and health damages from global concrete production. Nature Climate Change, 10(5), 439–443. Link to source: https://doi.org/10.1038/s41558-020-0733-0
Mokhtar, A., & Nasooti, M. (2020). A decision support tool for cement industry to select energy efficiency measures. Energy Strategy Reviews, 28, 100458. Link to source: https://doi.org/10.1016/j.esr.2020.100458
Morrow III, W. R., Hasanbeigi, A., Sathaye, J., & Xu, T. (2014). Assessment of energy efficiency improvement and CO2 emission reduction potentials in India's cement and iron & steel industries. Journal of Cleaner Production, 65, 131–141. Link to source: https://doi.org/10.1016/j.jclepro.2013.07.022
Rissman, J., Bataille, C., Masanet, E., Aden, N., Morrow III, W. R., Zhou, N., Elliott, N., Dell, R., Heeren, N., Huckestein, B., Cresko, J., Miller, S. A., Roy, J., Fennell, P., Cremmins, B., Blank, T. K., Hone, D., Williams, E. D., de la Rue du Can, S., …Helseth, J. (2020). Technologies and policies to decarbonize global industry: Review and assessment of mitigation drivers through 2070. Applied Energy, 266, 114848. Link to source: https://doi.org/10.1016/j.apenergy.2020.114848
Schorcht, F., Kourti, I., Scalet, B. M., Roudier, S., & Delgado Sancho L. (2013). Best available techniques (BAT) reference document for the production of cement, lime and magnesium oxide – Industrial Emissions Directive 2010/75/EU (integrated pollution prevention and control) (Joint Research Center publication JRC 83006). European Commission, Joint Research Centre, Institute for Prospective Technological Studies. Link to source: https://doi.org/10.2788/12850
Shah, I. H., Miller, S. A., Jiang, D., & Myers, R. J. (2022). Cement substitution with secondary materials can reduce annual global CO2 emissions by up to 1.3 gigatons. Nature Communications, 13, 5758. Link to source: https://doi.org/10.1038/s41467-022-33289-7
Sinha, A., and Crane, V. (2024). Manufacturing and industrial processes sector: Cement manufacturing emissions. TransitionZero, UK, Climate TRACE Emissions Inventory. Link to source: https://climatetrace.org
Snellings, R. (2016). Assessing, understanding and unlocking supplementary cementitious materials. RILEM Technical Letters, 1, 50–55. Link to source: https://doi.org/10.21809/rilemtechlett.2016.12
Snellings, R., Suraneni, P., & Skibsted, J. (2023). Future and emerging supplementary cementitious materials. Cement and Concrete Research, 171, 107199. Link to source: https://doi.org/10.1016/j.cemconres.2023.107199
U.S. Department of Energy. (2022). Industrial decarbonization roadmap. Link to source: https://www.energy.gov/sites/default/files/2022-09/Industrial%20Decarbonization%20Roadmap.pdf
U.S. Environmental Protection Agency. (2016). Greenhouse gas inventory guidance: Direct emissions from stationary combustion sources. Link to source: https://www.epa.gov/sites/default/files/2016-03/documents/stationaryemissions_3_2016.pdf
U.S. Federal Highway Administration. (n.d.). Use of supplementary cementitious materials (SCMs) in concrete mixtures (FHWA-HIF-19-054). U.S. Department of Transportation. Link to source: https://www.fhwa.dot.gov/pavement/concrete/trailer/resources/hif19054.pdf
U.S. Geological Survey. (2024). Mineral commodity summaries 2024. https://doi.org/10.3133/mcs2024
Yang, X., Teng, F., & Wang, G. (2013). Incorporating environmental co-benefits into climate policies: A regional study of the cement industry in China. Applied Energy, 112, 1446–1453. Link to source: https://doi.org/10.1016/j.apenergy.2013.03.040
Zhang, S., Ren, H., Zhou, W., Yu, Y., & Chen, C. (2018). Assessing air pollution abatement co-benefits of energy efficiency improvement in cement industry: A city level analysis. Journal of Cleaner Production, 185, 761–771. Link to source: https://doi.org/10.1016/j.jclepro.2018.02.293
Zhang, S., Worrell, E., & Crijns-Graus, W. (2015). Evaluating co-benefits of energy efficiency and air pollution abatement in China’s cement industry. Applied Energy, 147, 192–213. Link to source: https://doi.org/10.1016/j.apenergy.2015.02.081
Zhang, S., Xie, Y., Sander, R., Yue, H., & Shu, Y. (2021). Potentials of energy efficiency improvement and energy–emission–health nexus in Jing-Jin-Ji’s cement industry. Journal of Cleaner Production, 278, 123335. Link to source: https://doi.org/10.1016/j.jclepro.2020.123335
Sarah Gleeson, Ph.D.
James Gerber, Ph.D.
Yusuf Jameel, Ph.D.
Daniel Jasper
Alex Sweeney
Aiyana Bodi
Hannah Henkin
Ted Otte
Amanda D. Smith, Ph.D.
Christina Swanson, Ph.D.
Cement production currently emits 760,000 t CO₂‑eq /Mt cement produced, based on our analysis. With global cement production exceeding 4 Gt/yr (U.S. Geological Survey, 2024), the scale of emissions to be mitigated is large.
Clinker substitution is the most effective of the three approaches at reducing emissions, eliminating approximately 240,000 t CO₂‑eq /Mt cement produced. This is equivalent to 690,000 t CO₂‑eq /Mt clinker avoided (Table 1a). This estimate is based on expert predictions of GHG savings for realistic target levels of clinker replacement with material substitutes.
Alternative fuels and efficiency upgrades have carbon abatement potentials of 96,000 and 90,000 t CO₂‑eq /Mt cement produced, respectively, when calculated based on production levels (Table 1b). Since the units of adoption for process efficiency upgrades are GJ thermal energy input, when calculating climate impact we used an effectiveness per GJ of thermal energy, calculated using an emission factor for fuel combustion. This effectiveness is 0.0847 t CO₂ /GJ thermal energy input (Table 1c; Gómez & Watterson et al., 2006; International Energy Agency [IEA], 2023c).
We calculated the effectiveness of these three approaches separately. Because the implementation of each affects the effectiveness potential of the others (Glenk et al., 2023), the actual effectiveness will be lower when the approaches are implemented together.
Emissions reductions from these approaches can be directly related to how the approach impacts GHG emissions from clinker production and fossil fuel burning. However, sourcing, processing, and transporting clinker substitutes and alternative fuels also produces GHGs. Our data sources did not always report whether such indirect emissions were accounted for, so our analysis primarily focuses on direct emissions. Further analysis of other life-cycle emissions considerations would be valuable in future research; however, indirect emission levels for both clinker substitutes and alternative fuels are reportedly small compared to direct emissions (European Cement Research Academy, 2022; Shah et al., 2022).
Additionally, cement industry members sometimes assume that there are no direct emissions from burning biomass fuels (Goldman et al., 2023). As a result, we assume that direct emissions from biomass are not fully accounted for in the data and therefore that the climate benefit of using alternative fuels may be exaggerated.
While other GHGs, including methane and nitrous oxide, are also released during cement manufacturing, these gases represent a small fraction (<3% combined) of overall CO₂‑eq emissions so we considered them negligible in our calculations (U.S. Environmental Protection Agency, 2016; Hottle et al., 2022).
Table 1. Effectiveness at reducing emissions.
Unit: t CO₂‑eq /Mt clinker avoided, 100-year basis
25th percentile | 540,000 |
mean | 710,000 |
median (50th percentile) | 690,000 |
75th percentile | 860,000 |
Unit: t CO₂‑eq /Mt cement produced (100-year basis)
25th percentile | 77,000 |
mean | 94,000 |
median (50th percentile) | 96,000 |
75th percentile | 99,000 |
Unit: t CO₂‑eq /GJ thermal energy input (100-year basis)
calculated value | 0.0847 |
All three approaches to mitigating cement emissions result in cost savings by our analysis. Despite high initial costs, when considering the long technology lifetime and annual operational savings, the net lifetime and annualized costs are lower than conventional cement production.
Clinker substitution has the highest net savings of the three approaches, with US$7 million/Mt cement produced generating savings of US$30/t CO₂‑eq (Table 2a). While initial and operating costs may vary between different substitute materials, we averaged all material types for each cost estimate. Goldman et al. (2023) and the European Cement Research Academy (2022) offer breakdowns of cost by material type.
Alternative fuels generate savings of US$5 million/Mt cement, or US$50/t CO₂‑eq mitigated (Table 2b). For both clinker substitution and alternative fuels, cost and emissions will vary based on local material availability (Cannon et al., 2021). We assumed equivalent costs for all alternative fuel types.
Efficiency upgrades save US$6 million/Mt cement and have the highest cost savings per unit climate impact (US$60/t CO₂‑eq ). While process efficiency upgrades encompass many different technologies, this cost estimate incorporates the costs of two of the technologies yielding high avoided emissions – replacing long kilns with preheater/precalciner kilns and implementing efficient clinker cooler technology. Between these technologies, upgrading to preheater/precalciner kilns represents most of the initial cost increase and the operational cost savings (European Cement Research Academy, 2022).
The costs of each approach (Table 2) were calculated as amortized initial costs of upgrading plants, added to the expected changes in annual operational costs. Only very limited data are available for price premiums on low-carbon cement. Therefore, we did not include any revenues for low-carbon cement.
While we calculated these costs separately, in reality the cost for implementing multiple approaches will be different due to interactions between technologies (Glenk et al., 2023). For example, material processing equipment could change based on the type of clinker substitute materials. We do not expect the costs to be additive as we assumed in our analysis, and limited cost data means that this estimate is based on limited sources.
Table 2: Cost per unit climate impact.
Unit: 2023 US$/t CO₂‑eq , 100-yr basis
Clinker substitution | –30 |
Negative values reflect cost savings.
Unit: 2023 US$/t CO₂‑eq , 100-yr basis
Alternative fuels | –50 |
Negative values reflect cost savings.
Unit: 2023 US$/t CO₂‑eq , 100-yr basis
Process efficiency upgrades | –60 |
Negative values reflect cost savings.
The technologies needed for all approaches in this solution are well developed and ready to deploy at scale, so we did not consider learning curves.
We did not find any global data on cost changes related to adoption levels for equipment, including energy-efficient processing technologies, dry-process kilns, or material storage. A portion of the solution’s initial costs come from plant downtimes, which would not be impacted by the technology learning curve. For feedstock components of the solution, including alternative fuels and clinker material substitutes, the costs will be subject to material availability, market prices, and transportation, and therefore will not necessarily decrease with adoption.
Speed of action refers to how quickly a climate solution physically affects the atmosphere after it is deployed. This is different from speed of deployment, which is the pace at which solutions are adopted.
At Project Drawdown, we define the speed of action for each climate solution as emergency brake, gradual, or delayed.
Improve Cement Production is a GRADUAL climate solution. It has a steady, linear impact on the atmosphere. The cumulative effect over time builds as a straight line.
Manufacturing emissions reductions due to clinker substitution, alternative fuels, and process efficiency upgrades are both permanent and additional.
There is a low risk that the emission reductions this solution generates will be reversed in the next 100 years. This approach calls for reduced burning of fossil fuels and less calcination of limestone into clinker, thereby avoiding emissions from these activities. Meanwhile, carbon that is not released as CO₂ due to these technologies will remain stable in limestone or fossil fuel reserves indefinitely, making the emissions mitigation permanent.
These cement emissions reductions are additional if they are adopted in amounts higher than what is currently required and used in local or regional cement manufacturing. Afsah (2004) assessed additionality based on whether it represents “not common practice” from a national standpoint of market share or adoption. ClimeCo (2022) suggested that for clinker material substitutes to be considered additional, the substitute needs to meet two criteria: The replacement is not mandated by law, and new or emerging materials are used.
Few global data are available for current adoption. Most data are from regional sources, typically the United States or Europe. As a result, we do not expect these data to be representative at the global level – China and India alone produce more than 60% of the world’s cement (U.S. Geological Survey, 2024). Therefore, we quantified adoption only from a limited number of worldwide sources, using the adoption units listed in Figure 2.
Clinker substitution is challenging to assess for adoption, since it is implemented with a broad range of materials and replacement fractions. We therefore simplified adoption in this analysis by quantifying it as the amount of global cement material that is not clinker. The adoption tonnage (Table 3a) represents Mt of clinker production avoided, using conventional Portland cement (5% non-clinker) as a baseline (CEMBUREAU, n.d.). Note that this is different from the way we considered cement tonnage for effectiveness and cost. There, we calculated emissions reductions for a Mt of cement produced including substituted material. For adoption, however, we considered tonnage to be clinker avoided (based on amount replaced with other materials).
The IEA (2023a) and the European Cement Research Academy (2022) estimated the global clinker-to-cement ratio to be approximately 0.72, meaning that 28% of cement composition is material other than clinker. This correlates to 980 Mt clinker avoided/yr used over the Portland cement baseline.
Alternative fuels are currently used to replace approximately 7% of fossil fuels in global cement production (Global Cement and Concrete Association, 2021; IEA, 2023c). We assumed this means approximately 300 Mt cement/yr are currently produced with biomass and waste fuels (Table 3b).
Efficiency upgrades encompass dozens of technological improvements, which – along with a paucity of available data – make adoption levels challenging to assess. To estimate the current state of energy usage in the cement industry, we used the IEA (2023c) estimate of 3,550,000 GJ/Mt clinker as the 2022 benchmark thermal energy input for clinker production. This value does not include electrical efficiency and can vary based on fuel mix, but approximates the current state of energy use. We converted it to GJ/yr using amounts of annual clinker production, yielding 10.5 billion GJ thermal energy consumed each year for clinker production. Since there is no baseline for efficiency, we consider this value to be the zero adoption scenario and the current adoption to be not determined (Table 3c).
For the other approaches, there is a clear baseline case of “zero adoption” where no substitutes or alternative fuels are in use. However, thermal energy input is an energy use indicator that represents a continuum with no clear baseline. We therefore had to benchmark future energy savings against an initial value, which we chose as 2022 since it provided the most recent available data. All future estimates represent annual GHG savings relative to global cement production’s 2022 GHG emissions levels.
Table 3. Current adoption level (2022).
Unit: Mt clinker avoided/yr
median (50th percentile) | 980 |
Unit: Mt cement produced using alternative fuels/yr
median (50th percentile) | 300 |
Unit: GJ thermal energy input/yr saved
median (50th percentile) | not determined |
Clinker substitution has experienced relatively unchanged adoption worldwide in recent years (Table 4a). Since 2016, there has been a small increase in clinker-to-cement ratio, indicating a slight decrease in adoption of this approach (IEA, 2023a). This corresponds to 40 Mt fewer clinker material substitutes being used each year, on average.
Alternative fuels adoption is slowly on the rise as percent of fuel mix (Table 4b). According to the IEA (2023c), the percentage of global clinker produced by bioenergy and waste fuels increased from 6.5% in 2015 to 8.5% in 2022. This corresponds to a median annual increase of 12 Mt cement/yr produced by alternative fuels.
The IEA (2023c) reported efficiency upgrades to have led to a median annual decrease of 5,000 GJ/Mt clinker from 2011 to 2022, representing a –0.14% annual change in energy input. This indicates that processes consuming thermal energy have become slightly more efficient in recent years. When converted to GJ/yr, this is 15 million fewer GJ thermal energy consumed each year (Table 4c).
Table 4. Adoption trend.
Unit: annual change in Mt clinker avoided/yr
median (50th percentile) | –40 |
2016–2022 adoption trend
Unit: annual change in Mt cement produced using alternative fuels/yr
median (50th percentile) | 12 |
2015–2022 adoption trend
Unit: annual change in GJ thermal energy input/yr
median (50th percentile) | –15,000,000 |
2011–2022 adoption trend
The adoption ceiling (Table 5) is high for all approaches within this solution.
Clinker substitution adoption is likely to be limited primarily by material standards and availability. Across literature, the median adoption ceiling is considered to be 3,000 Mt clinker avoided/yr beyond the Portland cement baseline, yielding a clinker-to-cement ratio of 0.2. Snellings (2016) calculated the worldwide amount of clinker materials substitutes and found that a maximum of ~2,000 Mt/yr would be available, which would result in a clinker-to-cement ratio of approximately 0.5. In the future, some waste materials – like fly ash and ground granulated blast furnace slag – are likely to be less available so increasing the possible substitute amounts would require research on new materials or cement properties.
Alternative fuels are typically assumed to be applicable to roughly 90% of cement production globally, or approximately 4,000 Mt cement/yr at 2022 global production levels (Daehn et al., 2022). In theory, kilns can use 100% alternative fuels, although composition of the fuel can influence the trace elements or calorific value (European Cement Research Academy, 2022). In particular, several analyses point to the lower calorific value of alternative fuels as an adoption-limiting factor. Cavalett et al. (2024) considered 90% to be the maximum. A separate analysis of Canadian cement production determined that 65% is the threshold due to lower-calorie fuels only being applicable in a precalciner kiln – the equipment where fuel is used to begin decomposing limestone through the calcination process (Clark et al., 2024).
Efficiency upgrades have their adoption ceiling limited by the minimum thermal energy demand needed to run cement kilns. The European Cement Research Academy estimates this lower threshold of energy input to be approximately 2,300,000 GJ/Mt clinker, considering chemical reaction and evaporation energy needs (European Cement Research Academy, 2022). This converts to 6.9 billion GJ thermal energy used each year, or 3.6 billion GJ/yr saved over current thermal energy efficiency levels (Table 5c).
Table 5. Adoption ceiling.
Unit: Mt clinker avoided/yr
median (50th percentile) | 3,000 |
Unit: Mt cement produced using alternative fuels/yr
median (50th percentile) | 4,000 |
Unit: GJ thermal energy input/yr saved over current levels
median (50th percentile) | 3,600,000,000 |
Clinker substitution achievable adoption (Table 6a) is primarily limited by material availability and initial costs. Global estimates generally expect 30–50% of total substituted material to be reasonable, which correlates to a clinker-to-cement ratio of 0.4–0.6 and 1,000–2,000 Mt clinker avoided/yr (Habert et al., 2020; European Cement Research Academy, 2022). In a separate U.S.-specific analysis, the substitute amount was projected to vary from 5% to 45% depending on the availability and performance of the material substitute (Goldman et al., 2023).
Alternative fuels are projected to account for roughly 40% of the cement fuel mix in 2050 for both global and North American estimates. Taking the median of the global achievable adoption estimates, this correlates to 2,000 Mt cement/yr that would be produced using alternative kiln fuels. As a low estimate, if the current adoption trend holds, approximately 16% of global cement fuel (producing 610 Mt cement/yr) will come from biomass and waste (IEA, 2023c). A reasonable adoption range is 610–2,000 Mt cement/yr (Table 6b), although some European countries currently have ~80% adoption of alternative fuels, meaning that >40% adoption in an aggressive 2050 scenario may be feasible (Cavalett et al., 2024).
Little information exists on projected global adoption of efficiency upgrades between now and 2050. In an analysis of a fraction of cement plants in China, India, and the U.S., it was estimated that these three countries – which represent more than 70% of current cement production worldwide – could reach a thermal energy input of 3.15–3.25 million GJ/Mt clinker by 2060, or 9.30–9.59 billion GJ/yr, which is 0.886–1.18 billion GJ/yr saved over current adoption levels (Table 6c; Cao et al., 2021). Meanwhile, in a European analysis, the European Cement Research Academy (2022) found the same range to be possible by 2050. This is not significantly lower than the current state due to the fact that the highest-producing countries – China and India – have newer manufacturing facilities with more efficient equipment today. Countries with more room to improve in thermal energy efficiency – such as the U.S. – produce only a small fraction of the world’s cement. Approximately 92% of global plants are estimated to use more efficient dry kiln technology, indicating that some of the more energy-saving equipment upgrades are already highly adopted (Isabirye & Sinha, 2023). Therefore, there is less room for increased adoption in kiln technologies worldwide, although electrical efficiency measures could further improve these values.
While the estimates for tonnage of cement impacted by these approaches are based on 2022 global production numbers, cement production will change through 2050, meaning the impacted mass of cement will also change as these emissions-reducing measures are adopted (IEA, 2023b).
Table 6. Range of achievable adoption levels.
Unit: Mt clinker avoided/yr
Current Adoption | 980 |
Achievable – Low | 1,000 |
Achievable – High | 2000 |
Adoption Ceiling | 3000 |
Unit: Mt cement produced using alternative fuels/yr
Current Adoption | 300 |
Achievable – Low | 610 |
Achievable – High | 2,000 |
Adoption Ceiling | 4,000 |
Unit: GJ thermal energy input/yr saved over current adoption levels
Current Adoption | not determined |
Achievable – Low | 886,000,000 |
Achievable – High | 1,180,000,000 |
Adoption Ceiling | 3,600,000,000 |
Note: High adoption in this case results in lower energy use for each unit of cement produced, and thus better efficiency.
Improved cement production has high potential for climate impact. By our estimate, cement production is responsible for >5% of global GHG emissions, so mitigating even a portion of these emissions will meaningfully reduce the world’s carbon output.
Clinker substitution has the highest current and potential GHG emissions savings of the three approaches (Table 7a). To calculate the climate impact, we used effectiveness and adoption on the basis of Mt clinker avoided. Climate impact was calculated as:
Alternative fuels have a low current climate impact but possess the potential to be adopted for a much greater fraction of the global kiln fuel mix (Table 7b). However, alternative fuels’ potential GHG emissions savings are lower than those for clinker substitutes because alternative fuels have a lower CO₂ mitigation effectiveness. Climate impact is calculated as:
Efficiency upgrades are the most challenging to assess for climate impact because they represent a broad range of equipment upgrades with no clear baseline efficiency. We considered adoption to be energy savings from the current (2022) baseline in GJ thermal energy input/yr. We converted adoption to climate impact using the emission factor of 0.0847 t CO₂‑eq /GJ thermal energy input (calculated using data from Gómez & Watterson et al., 2006 and IEA, 2023c). The resulting calculation is as follows:
While clinker substitution, alternative fuels, and efficiency upgrades are quantified separately here, the adoption of any of these approaches will reduce the climate impact of the others. In particular, the climate impacts for technologies that reduce emissions per Mt of clinker (such as alternative fuels and process efficiency upgrades) will be lower when implemented along with technologies that reduce the amount of clinker used (such as clinker substitution), and vice versa (Glenk et al., 2023). Therefore, these impacts will not be additive, although they will contribute to reduced emissions when implemented together.
While our analysis found clinker substitution to have the highest climate impact, cement manufacturers will have to prioritize these technologies depending on their plant’s existing equipment, local availability of materials, and regional cement standards.
Table 7. Climate impact at different levels of adoption.
Unit: Gt CO₂‑eq/yr, 100-yr basis
Current Adoption | 0.67 |
Achievable – Low | 0.7 |
Achievable – High | 1 |
Adoption Ceiling | 2 |
Unit: Gt CO₂‑eq/yr, 100-yr basis
Current Adoption | 0.03 |
Achievable – Low | 0.06 |
Achievable – High | 0.2 |
Adoption Ceiling | 0.4 |
Unit: Gt CO₂‑eq/yr, 100-yr basis
Current Adoption | not determined |
Achievable – Low | 0.075 |
Achievable – High | 0.100 |
Adoption Ceiling | 0.31 |
Miller & Moore (2020) estimated that the health damages associated with cement production amounted to approximately US$60 billion globally in 2015. These health damages are due to air pollutants produced during cement manufacturing, which would be reduced by this solution as described above. In China, one study estimated that improving energy efficiency in the Jing Jin Ji region’s cement industry could prevent morbidity in 17,000 individuals (Zhang et al., 2021).
Cement production is a major contributor to air pollution. Globally, concrete production accounts for approximately 8% of nitrogen oxide emissions, 5% of sulfur oxide emissions, and 5% of particulate matter emissions, with a significant portion of all these emissions stemming exclusively from cement production (Miller & Moore, 2020). Cement-related air pollution is especially acute in China, which produces over 50% of the world’s cement (U.S. Geological Survey, 2024). In 2009, China's cement industry emitted 3.59 Mt of particulate matter, making the industry the leading source of particulate matter emissions in the country (Yang et al., 2013). China also released 0.88 Mt of sulfur dioxide, accounting for about 4% of the national total, and emitted 1.7 Mt of nitrogen oxides (Yang et al., 2013). Process efficiency upgrades in cement manufacturing can reduce these harmful emissions. For example, implementing energy efficiency measures in China’s cement industry could reduce particulate matter by more than 3%, lower sulfur dioxide emissions by more than 15%, and decrease nitrogen oxide emissions by more than 12% by 2030 (Zhang et al., 2015). In Jiangsu province, which is the largest cement producer in China, energy and CO₂ reduction techniques could cut particulate matter and nitrogen oxide emissions by 30% and 56%, respectively, by 2030 (Zhang et al., 2018).
According to the U.S. Federal Highway Administration (n.d.), the use of clinker material substitutes in cement slows concrete curing times. Additionally, some clinker material substitutes, such as fly ash, raise ecotoxicity concerns and require safe handling (U.S. Department of Energy, 2022). Robust research and development is needed for new compositions of cement to accelerate testing, standardization, and adoption (Griffiths et al., 2023). Since regional standards vary for cement and concrete, policy and regulatory support designed for specific locations will be necessary to influence adoption levels and rates.
Most clinker material substitutes have limited or regional availability, leading to shortages, high costs, and transportation emissions (Habert et al., 2020). Because some substitute materials are sourced from the waste streams of other industries, such as the coal and steel industries, the long-term feasibility of sourcing these materials is uncertain (Goldman et al., 2023; Juenger et al., 2019). However, one study found that most leading cement-producing countries have substitute materials available in sufficient quantities to replace at least half of their current clinker usage (Shah et al., 2022).
In terms of risks associated with alternative fuels, they can be subject to regional scarcity. Lack of available waste fuel in particular could risk non-waste biomass burning, leading to deforestation and high net emissions (de Puy Kamp, 2021). In addition, waste fuels can have varying compositions that can lead to different heats of combustion, kiln compatibility, or emitted pollutants (Griffiths et al., 2023). Finally, the use of waste products requires cement plants to be situated near industrial waste sources, risking low adoption for cement plants that are not located near a waste source.
Lower-carbon cement will improve the effectiveness and enhance the net climate impact of any solutions that might require new construction. The embodied emissions from the cement and concrete used for new built structures or roads will be reduced.
Technological advancements and increased adoption of efficient cement manufacturing equipment will improve the rate and cost of scaling similar high-efficiency machinery.
Industrial electrification in cement plants will be faster and easier to adopt if the plants’ energy demands are lowered via reduced clinker production and more efficient processes.
All of these solutions rely on biomass as a raw material or feedstock. For that reason, the use of biomass as an alternative kiln fuel or a source of ash for clinker substitutes will reduce the overall availability of biomass and increase the cost of using it for other applications.
Mt clinker avoided
CO₂
Mt cement produced using alternative fuels
CO₂
GJ thermal energy input reduced from current levels/yr
CO₂
Wider adoption of clinker material substitutes, alternative fuels, and process efficiency upgrades could generate new GHG emissions, including emissions stemming from the transportation of clinker material substitutes and alternative fuels as well as embodied emissions from manufacturing and installing new cement plant equipment. Nevertheless, the overall solution effectiveness is not expected to be significantly impacted. In some of the largest cement-producing countries, the emissions from transport of clinker material substitutes has been calculated to be an order of magnitude less than the emissions savings from the use of those substitutes in place of clinker (Shah et al., 2022).
In terms of environmental impact, some clinker substitutes such as calcined clays and natural pozzolans can increase water use (Juenger et al., 2019; Snellings et al., 2023). Additionally, the use of biomass as an alternative fuel source could lead to trade-offs – such as increased water use and land use, or diminished resource availability – although the risk of this outcome is low since biomass for kiln fuels tends to be agricultural by-products or other waste (Clark et al., 2024; Georgiopoulou & Lyberatos, 2018).
Cement production emissions are partly due to burning fossil fuels to run kilns and partly due to CO2 emissions associated with the chemistry of producing clinker, a key component of cement.
Sinha, A. and Crane, V. (2024). Manufacturing and industrial processes sector: Cement manufacturing emissions [Data set]. TransitionZero, Climate TRACE Emissions Inventory. Retrieved February 11, 2025, from Link to source: https://climatetrace.org
There are no location-specific constraints to the effectiveness of the Improve Cement Production solution as there are for solutions dependent on climatic factors. However, there is geographic variation associated with current uptake of solutions and feasibility/expense of future uptake. Moreover, the distribution of cement-producing facilities around the world is non-uniform, thus the solution set naturally has the greatest applicability in regions with the greatest concentration of cement production. China and India have particularly high production of cement at 51% and 8% of global totals in 2024, respectively (Sinha & Crane, 2024).
Newer cement plants are more likely to have high thermal efficiencies, and the age of cement plants varies around the world, with average ages of cement plants less than 20 years in much of Asia, and greater than 40 years in much of the U.S. and Europe.
Uptake of alternative fuels is relatively high in Europe and low in the Americas.
While use of clinker substitutes is in principle possible anywhere, the materials themselves are not readily available everywhere, thus transportation costs and associated emissions can place constraints on their viability (Shah et al., 2022).
Our analysis of the current state of solutions for improved cement production included three separate approaches to reducing emissions: clinker substitution, alternative fuels, and process efficiency upgrades. Each approach had adoption units chosen based on data availability and consistency between calculated values. Figure 2 summarizes the units and conversions used for all approaches.
Figure 2. Units of quantification used in the Current State, Adoption, and Impacts analyses below.
Approach | Clinker substitution | Alternative fuels | Process efficiency upgrades |
---|---|---|---|
Effectiveness | t CO₂-eq abated/Mt clinker avoided* t CO₂ abated/Mt cement produced* |
t CO₂-eq abated/Mt cement produced | t CO₂-eq abated/GJ thermal energy input** t CO₂-eq abated/Mt cement produced** |
Cost | US$/Mt cement produced | US$/Mt cement produced | US$/Mt cement produced |
Adoption | Mt clinker avoided/yr | Mt cement/yr produced using alternative fuels | GJ thermal energy input saved/yr |
Climate impact | Gt CO₂-eq/yr | Gt CO₂-eq/yr | Gt CO₂-eq/yr |
*Clinker substitution effectiveness was calculated in two different adoption units using the same source data. Effectiveness in t CO₂‑eq abated/Mt cement produced was used to calculate cost per climate impact. Effectiveness was converted to t CO₂‑eq abated/Mt clinker avoided using the clinker-to-cement ratio for each individual study in the analysis, and this was used to calculate climate impact.
**Process efficiency upgrades effectiveness in units of t CO₂‑eq abated/Mt cement produced was used to calculate cost per climate impact. Separately, a calculated fuel emission factor effectiveness in units of t CO₂‑eq abated/GJ thermal energy was used to quantify climate impact.
The U.S. Department of Energy reports that the cement industry produces an estimated 7–8% of global CO₂ emissions (Goldman et al., 2023), so this is an important area to target. There is high scientific consensus that clinker substitution, alternative fuels, and process efficiency upgrades can be immediately and effectively implemented. Other emissions reduction strategies – including hydrogen kiln fuel, electrification, and carbon capture and storage technologies – have generated mixed scientific opinions on their potential for immediate impact and were not considered in this analysis.
The U.S. Department of Energy (2022) highlighted cement as one of five high-emitting industries with potential for mitigation. The technologies identified as having the highest level of maturity and market readiness were energy efficiency measures, biomass and natural gas fuels, material efficiency measures, and blended-material cements.
An extensive review of industrial decarbonization points to four technologies that could be implemented in the near term across global industries: electrification, material efficiency, energy efficiency, and circularity (Rissman et al., 2020). The European Cement Research Academy (2022) classified the three cement industry approaches considered in this solution – clinker substitution, alternative fuels, and process efficiency upgrades – as meeting the highest technology readiness level.
Goldman et al. (2023) identified clinker substitution, alternative fuels, and efficiency improvements as deployable today, estimating that these three approaches could abate 30% of U.S. cement industry emissions by 2030. Habert et al. (2020) proposed technologies that could reduce emissions up to 50% in the next few decades, including “cement improvements” of supplementary clinker materials, alternative fuels, and more efficient technologies. The IEA (2018) estimated that clinker material replacement, alternative fuels, and efficiency improvements could provide 37%, 12%, and 3% of cement emissions savings by 2050, respectively.
The results presented in this document summarize findings from two reviews and meta-analyses, eight original studies, nine reports, and several data sets reflecting current evidence from 33 countries, primarily high cement-producing countries in North America, Europe, and Asia. We recognize this limited geographic scope creates bias, and hope this work inspires research and data sharing on this topic in underrepresented regions.
Join the 85,000+ subscribers discovering how to drive meaningful climate action around the world! Every other week, you'll get expert insights, cutting-edge research, and inspiring stories.