The amount of pollutants, sediments, and microorganisms in fresh and marine water systems that affects the health of humans, wildlife, and ecosystems.

Icon

Improve Diets

Image
Image
Plates of food
Coming Soon
Off

Key Takeaways

  • Reducing beef consumption to one serving per week could reduce GHG emissions and improve health outcomes. 
  • Beef and lamb are especially emissions-intensive because ruminant animals emit methane, a powerful GHG, during digestion.
  • Producing beef and other red meat generates 30% of food-related GHG emissions but provides only 5% of global dietary calories. 
  • If everyone in high and middle-income countries reduced beef to one serving a week – and ate any other protein-rich food instead – up to 2.8 Gt CO₂‑eq/yr of GHG emissions could be avoided.
Summary

Agriculture produces about 12 Gt CO₂‑eq/yr, or 21% of total human-caused GHG emissions (Intergovernmental Panel on Climate Change [IPCC], 2023). Animal agriculture contributes more than half of these emissions (Halpern et al., 2022; Poore and Nemecek, 2018). 

Ruminant animals, such as cattle, sheep, and goats produce methane – a GHG with 80 times the warming potential of CO₂ in the near term – in their digestive system (Jackson et al., 2024). Since agriculture is the leading driver of tropical deforestation, particularly for cattle and animal feed production, reducing ruminant meat consumption can avoid additional forest loss and associated GHG emissions.

We define improved diets as a reduction in ruminant meat consumption and a replacement with other protein-rich foods. Such a diet shift can be adopted incrementally through small behavioral changes that together lead to globally significant reductions in GHG emissions.

Description for Social and Search
Improve Diets is a Highly Recommended climate solution. Reducing ruminant meat consumption reduces methane production and pressure to destroy tropical forests.
Overview

Reducing ruminant meat consumption, especially in high-consuming regions, has a globally significant potential for climate change mitigation. Red meat production (including beef, lamb, and pork) contributes 30% of food-related emissions but generates only 5% of global dietary calories (Li et al., 2024). 

Ruminant animals have digestive systems with multiple chambers that allow them to ferment grass and leaves. However, this digestion generates methane emissions through a process called enteric fermentation. In addition, clearing forests and grasslands for pastures and cropland to feed livestock emits CO₂, and livestock manure emits methane and nitrous oxide. 

In 2019, an international team of scientists called the EAT-Lancet Commission developed benchmarks for a healthy, sustainable diet based on peer-reviewed information on human health and environmental sustainability (Willett et al., 2019). The commission estimated that red meat (beef, lamb, and pork) should be limited to 14 grams (30 calories) per day per person, or 5.1 kg/person/yr. Although the EAT-Lancet diet includes pork, our analysis looked specifically at limiting ruminant meat to 5.1 kg/person/yr because it has much higher GHG emissions than pork (Figure 1).

Figure 1. Greenhouse gas emissions associated with the production of protein-rich foods. Beef has the highest emissions per kilogram. These emissions data are from Poore & Nemecek (2018), with the exception of  "Ruminant meat," which was calculated based on the amount of beef and lamb consumed in 2022. 

Poore, J., &  Nemecek, T. (2018). Reducing food’s environmental impacts through producers and consumers. Science, 360(6392), 987–992.

In this solution, we explored reducing ruminant meat consumption in middle- and high-income countries in which consumption exceeds 5.1 kg/person/yr. Furthermore, our analysis assumed ruminant meat is replaced with approximately the same amount of protein-rich plant- or animal-based foods, which are estimated to be about 20% protein by weight (Poore and Nemecek, 2018).

References

Bai, Y., Alemu, R., Block, S. A., Headey, D., & Masters, W. A. (2021). Cost and affordability of nutritious diets at retail prices: Evidence from 177 countries. Food policy, 99, Article 101983. Link to source: https://doi.org/10.1016/j.foodpol.2020.101983

Bouvard, V., Loomis, D., Guyton, K. Z., Grosse, Y., Ghissassi, F. E., Benbrahim-Tallaa, L., Guha, N., Mattock, H., & Straif, K. (2015). Carcinogenicity of consumption of red and processed meat. The Lancet Oncology, 16(16), 1599–1600. https://doi.org/10.1016/S1470-2045(15)00444-1 

Bradbury, K. E., Murphy, N., & Key, T. J. (2020). Diet and colorectal cancer in UK Biobank: A prospective study. International Journal of Epidemiology, 49(1), 246–258. Link to source: https://doi.org/10.1093/ije/dyz064 

Casey, J. A., Curriero, F. C., Cosgrove, S. E., Nachman, K. E., & Schwartz, B. S. (2013). High-density livestock operations, crop field application of manure, and risk of community-associated methicillin-resistant Staphylococcus aureus infection in Pennsylvania. JAMA Internal Medicine, 173(21), 1980–1990. Link to source: https://doi.org/10.1001/jamainternmed.2013.10408

Domingo, N. G. G., Balasubramanian, S., Thakrar, S. K., Clark, M. A., Adams, P. J., Marshall, J. D., Muller, N. Z., Pandis, S. N., Polasky, S., Robinson, A. L., Tessum, C. W., & Hill, J. D. (2021). Air quality–related health damages of food. Proceedings of the National Academy of Sciences, 118(20), Article e2013637118. Link to source: https://doi.org/10.1073/pnas.2013637118

Foley, J. A., Ramankutty, N., Brauman, K. A., Cassidy, E. S., Gerber, J. S., Johnston, M., Mueller, N. D., O’Connell, C., Ray, D. K., West, P. C., Balzer, C., Bennett, E. M., Carpenter, S. R., Hill, J., Monfreda, C., Polasky, S., Rockström, J., Sheehan, J., Siebert, S., ... Zaks, D. P. M. (2011). Solutions for a cultivated planet. Nature, 478, 337–342. Link to source: https://doi.org/10.1038/nature10452

Food and Agriculture Organization of the United Nations (FAO). (2025). FAO‑FAOSTAT: Food balances (2010-) [Data set]. Food balances for individual countries for the year 2022 (most recent year available). Retrieved March 25, 2025, from Link to source: https://www.fao.org/faostat/en/#data/FBS

Food and Agriculture Organization of the United Nations (FAO). (2023). Low-Income Food-Deficit Countries (LIFDCs) - List updated June 2023. Retrieved March 25, 2025, from Link to source: https://www.fao.org/member-countries/lifdc/en 

Food and Agriculture Organization of the United Nations (FAO). (2017). Livestock solutions for climate change [Technical paper]. Link to source: https://www.fao.org/family-farming/detail/en/c/1634679/

Gerber, P. J., Steinfeld, H., Henderson, B., Mottet, A., Opio, C., Dijkman, J., Falcucci, A., & Tempio, G. (2013). Tackling climate change through livestock: A global assessment of emissions and mitigation opportunities [Report]. Food and Agriculture Organization of the United Nations. Link to source: https://www.fao.org/4/i3437e/i3437e00.htm 

Godfray, H. C. J., Aveyard, P., Garnett, T., Hall, J. W., Key, T. J., Lorimer, J., Pierrehumbert, R. T., Scarborough, P., Springmann, M., & Jebb, S. A. (2018). Meat consumption, health, and the environment. Science, 361(6399), Article eaam5324. Link to source: https://doi.org/10.1126/science.aam5324

Gupta, S., Vemireddy, V., Singh, D. K., & Pingali, P. (2021). Ground truthing the cost of achieving the EAT lancet recommended diets: Evidence from rural India. Global Food Security, 28, Article 100498. Link to source: https://doi.org/10.1016/j.gfs.2021.100498

Halpern, B. S., Frazier, M., Verstaen, J., Rayner, P.-E., Clawson, G., Blanchard, J. L., Cottrell, R. S., Froehlich, H. E., Gephart, J. A., Jacobsen, N. S., Kuempel, C. D., McIntyre, P. B., Metian, M., Moran, D., Nash, K. L., Többen, J., & Williams, D. R. (2022). The environmental footprint of global food production. Nature Sustainability, 5, 1027–1039. Link to source: https://doi.org/10.1038/s41893-022-00965-x 

Harter, T., Lund, J. R., Darby, J., Fogg, G. E., Howitt, R., Jessoe, K. K., Pettygrove, G. S., Quinn, J. F., Viers, J. H., Boyle, D. B., Canada, H. E., De La Mora, N., Dzurella, K. N., Fryjoff-Hung, A., Hollander, A. D., Honeycutt, K. L., Jenkins, M. W., Jensen, V. B., King, A. M., ... Rosenstock, T. S. (2012). Addressing nitrate in California’s drinking water with a focus on Tulare Lake Basin and Salinas Valley groundwater [Report]. Center for Watershed Sciences, University of California. Link to source: https://ucanr.edu/sites/default/files/2012-03/138956.pdf 

Heederik, D., Sigsgaard, T., Thorne, P. S., Kline, J. N., Avery, R., Bønløkke, J. H., Chrischilles, E. A., Dosman, J. A., Duchaine, C., Kirkhorn, S. R., Kulhanková, K., & Merchant, J. A. (2007). Health effects of airborne exposures from concentrated animal feeding operations. Environmental Health Perspectives, 115(2), 298–302. Link to source: https://doi.org/10.1289/ehp.8835

Herrero, M., Henderson, B., Havlík, P., Thornton, P. K., Conant, R. T., Smith, P., Wirsenius, S., Hristov, A. N., Gerber, P., Gill, M., Butterbach-Bahl, K., Valin, H., Garnett, T., & Stehfest, E. (2016). Greenhouse gas mitigation potentials in the livestock sector. Nature Climate Change, 6(5), 452–461. Link to source: https://doi.org/10.1038/nclimate2925 

Hirvonen, K., Bai, Y., Headey, D., & Masters, W. A. (2020). Affordability of the EAT–Lancet reference diet: A global analysis. The Lancet Global Health, 8(1), e59–e66. Link to source: https://doi.org/10.1016/S2214-109X(19)30447-4 

Intergovernmental Panel on Climate Change. (2023). Climate change 2023: Synthesis report. Contribution of working groups I, II and III to the sixth assessment report of the intergovernmental panel on climate change [Core Writing Team, H. Lee, & J. Romero (Eds.)]. Link to source: https://doi.org/10.59327/IPCC/AR6-9789291691647 

Jackson, R. B., Saunois, M., Martinez, A., Canadell, J. G., Yu, X., Li, M., Poulter, B., Raymond, P. A., Regnier, P., Ciais, P., Davis, S. J., & Patra, P. K. (2024). Human activities now fuel two-thirds of global methane emissions. Environmental Research Letters, 19(10), Article 101002. Link to source: https://doi.org/10.1088/1748-9326/ad6463

Kaluza, J., Wolk, A., & Larsson, S. C. (2012). Red meat consumption and risk of stroke: A meta-analysis of prospective studies. Stroke, 43(10), 2556–2560. Link to source: https://doi.org/10.1161/STROKEAHA.112.663286

Katare, B., Wang, H. H., Lawing, J., Hao, N., Park, T., & Wetzstein, M. (2020). Toward optimal meat consumption. American Journal of Agricultural Economics, 102(2), 662–680. Link to source: https://doi.org/10.1002/ajae.12016 

Kim, B. F., Santo, R. E., Scatterday, A. P., Fry, J. P., Synk, C. M., Cebron, S. R., Mekonnen, M. M., Hoekstra, A. Y., de Pee, S., Bloem, M. W., Neff, R. A., & Nachman, K. E. (2020). Country-specific dietary shifts to mitigate climate and water crises. Global Environmental Change, 62, Article 101926. Link to source: https://doi.org/10.1016/j.gloenvcha.2019.05.010 

Li, M., Wang, Y., Zhao, S., Chen, W., Liu, Y., Zheng, H., Sun, Z., He, P., Li, R., Zhang, S., Xing, P., & Li., Q. (2024). Improving the affordability and reducing greenhouse gas emissions of the EAT-Lancet diet in China. Sustainable Production and Consumption, 52, 445–457. Link to source: https://doi.org/10.1016/j.spc.2024.11.014

Li, Y., He, P., Shan, Y., Li, Y., Hang, Y., Shao, S., Ruzzenenti, F., & Hubacek, K. (2024). Reducing climate change impacts from the global food system through diet shifts. Nature Climate Change, 14(9), 943–953. Link to source: https://doi.org/10.1038/s41558-024-02084-1

Mariotti, F., & Gardner, C. D. (2019). Dietary protein and amino acids in vegetarian diets—A review. Nutrients, 11(11), Article 2661. Link to source: https://doi.org/10.3390/nu11112661

Mbow, C., Rosenzweig, C., Barioni, L. G., Benton, T. G., Herrero, M., Krishnapillai, M., Liwenga, E., Pradhan, P., Rivera-Ferre, M. G., Sapkota, T., Tubiello, F. N., & Xu, Y. (2019). Food security. In P. R. Shukla, J. Skea, E. Calvo Buendia, V. Masson-Delmotte, H.-O. Pörtner, D. C. Roberts, P. Zhai, R. Slade, S. Connors, R. van Diemen, M. Ferrat, E. Haughey, S. Luz, S. Neogi, M. Pathak, J. Petzold, J. Portugal Pereira, P. Vyas, E. Huntley, K. Kissick, M. Belkacemi, & J. Malley (Eds.), Climate change and land: An IPCC special report on climate change, desertification, land degradation, sustainable land management, food security, and greenhouse gas fluxes in terrestrial ecosystems (pp. 437–550). Cambridge University Press. Link to source: https://doi.org/10.1017/9781009157988.007

Meier, T., & Christen, O. (2013). Environmental impacts of dietary recommendations and dietary styles: Germany as an example. Environmental Science & Technology, 47(2), 877–888. Link to source: https://doi.org/10.1021/es302152v

Nelson, M. E., Hamm, M. W., Hu, F. B., Abrams, S. A., & Griffin, T. S. (2016). Alignment of healthy dietary patterns and environmental sustainability: A systematic review. Advances in Nutrition, 7(6), 1005–1025. Link to source: https://doi.org/10.3945/an.116.012567

Nijdam, D., Rood, T., & Westhoek, H. (2012). The price of protein: Review of land use and carbon footprints from life cycle assessments of animal food products and their substitutes. Food Policy, 37(6), 760–770. Link to source: https://doi.org/10.1016/j.foodpol.2012.08.002

Norwood, F. B., & Lusk, J. L. (2011). Compassion, by the pound: The economics of farm animal welfare. Oxford University Press. Link to source: https://global.oup.com/academic/product/compassion-by-the-pound-9780199551163?cc=ca&lang=en& 

Pan, A., Sun, Q., Bernstein, A. M., Schulze, M. B., Manson, J. E., Willett, W. C., & Hu, F. B. (2011). Red meat consumption and risk of type 2 diabetes: 3 cohorts of US adults and an updated meta-analysis. The American Journal of Clinical Nutrition, 94(4), 1088–1096. Link to source: https://doi.org/10.3945/ajcn.111.018978

Pan, A., Sun, Q., Bernstein, A. M., Schulze, M. B., Manson, J. E., Stampher, M. J., Willett, W. C., & Hu, F. B. (2012). Red meat consumption and mortality: Results from 2 prospective cohort studies. Archives of Internal Medicine, 172(7), 555–563. Link to source: https://doi.org/10.1001/archinternmed.2011.2287

Pimentel, D., & Pimentel, M. (2003). Sustainability of meat-based and plant-based diets and the environment. The American Journal of Clinical Nutrition, 78(3), 660S–663S. Link to source: https://doi.org/10.1093/ajcn/78.3.660S

Poore, J., & Nemecek, T. (2018) Reducing food’s environmental impacts through producers and consumers. Science, 360(6392), 987–992. Link to source: https://doi.org/10.1126/science.aaq0216

Porter, S., & Cox, C. (2020, May 28). Manure overload: Manure plus fertilizer overwhelms Minnesota’s land and water. Environmental Working Group. Link to source: https://www.ewg.org/interactive-maps/2020-manure-overload/

Ripple, W. J., Smith, P., Haberl, H., Montzka, S. A., McAlpine, C., & Boucher, D. H. (2014a). Ruminants, climate change and climate policy. Nature Climate Change, 4(1), 2–5. Link to source: https://doi.org/10.1038/nclimate2081

Ripple, W. J., Estes, J. A., Beschta, R. L., Wilmers, C. C., Ritchie, E. G., Hebblewhite, M., Berger, J., Elmhagen, B., Letnic, M., Nelson, M. P., Schmitz, O. J., Smith, D. W., Wallach, A. D., & Wirsing, A. J. (2014b). Status and ecological effects of the world’s largest carnivores. Science, 343(6167), Article 1241484. Link to source: https://doi.org/10.1126/science.1241484

Ripple, W. J., Newsome, T. M., Wolf, C., Dirzo, R., Everatt, K. T., Galetti, M., Hayward, M. W., Kerley, G. I. H., Levi, T., Lindsey, P. A., Macdonald, D. W., Malhi, Y., Painter, L. E., Sandom, C. J., Terborgh, J., & Van Valkenburgh, B. (2015). Collapse of the world’s largest herbivores. Science Advances, 1(4), Article e1400103. Link to source: https://doi.org/10.1126/sciadv.1400103

Searchinger, T., Waite, R., Hanson, C., Ranganathan, J., Dumas, P., Matthews, E., & Klirs, C. (2019). Creating a sustainable food future: A menu of solutions to feed nearly 10 billion people by 2050 [Report]. World Resources Institute. Link to source: https://research.wri.org/wrr-food

Sinha, R., Cross, A. J., Graubard, B. I., Leitzmann, M. F., & Schatzkin, A. (2009). Meat intake and mortality: A prospective study of over half a million people. Archives of Internal Medicine, 169(6), 562–571. Link to source: https://doi.org/10.1001/archinternmed.2009.6

Springmann, M., Clark, M. A., Rayner, M., Scarborough, P., & Webb, P. (2021). The global and regional costs of healthy and sustainable dietary patterns: A modelling study. The Lancet Planetary Health, 5(11), e797–e807. Link to source: https://doi.org/10.1016/S2542-5196(21)00251-5 

Steinfeld, H., Gerber, P., Wassenaar, T., Castel, V., Rosales, M., & de Haan, C. (2006). Livestock’s long shadow: Environmental issues and options [Report]. Food and Agriculture Organization of the United Nations. Link to source: https://www.fao.org/4/a0701e/a0701e00.htm 

Sun, J., Liao, X.-P., D’Souza, A. W., Boolchandani, M., Li, S.-H., Cheng, K., Luis Martínez, J., Li, L., Feng, Y.-J., Fang, L.-X., Huang, T., Xia, J., Yu, Y., Zhou, Y.-F., Sun, Y.-X., Deng, X.-B., Zeng, Z.-L., Jiang, H.-X., Fang, B.-H., … Liu, Y.-H. (2020). Environmental remodeling of human gut microbiota and antibiotic resistome in livestock farms. Nature Communications, 11(1), Article 1427. Link to source: https://doi.org/10.1038/s41467-020-15222-y

Tang, K. L., Caffrey, N. P., Nóbrega, D. B., Cork, S. C., Ronksley, P. E., Barkema, H. W., Polachek, A. J., Ganshorn, H., Sharma, N., Kellner, J. D., & Ghali, W. A. (2017). Restricting the use of antibiotics in food-producing animals and its associations with antibiotic resistance in food-producing animals and human beings: A systematic review and meta-analysis. The Lancet Planetary Health, 1(8), e316–e327. Link to source: https://doi.org/10.1016/S2542-5196(17)30141-9

Toumpanakis, A., Turnbull, T., & Alba-Barba, I. (2018). Effectiveness of plant-based diets in promoting well-being in the management of type 2 diabetes: A systematic review. BMJ Open Diabetes Research & Care, 6(1), Article e000534. Link to source: https://doi.org/10.1136/bmjdrc-2018-000534

Van Boeckel, T. P., Brower, C., Gilbert, M., Grenfell, B. T., Levin, S. A., Robinson, T. P., Teillant, A., & Laxminarayan, R. (2015). Global trends in antimicrobial use in food animals. Proceedings of the National Academy of Sciences, 112(18), 5649–5654. Link to source: https://doi.org/10.1073/pnas.1503141112 

Vergnaud, A.-C., Norat, T., Romaguera, D., Mouw, T., May, A. M., Travier, N., Luan, J., Wareham, N., Slimani, N., Rinaldi, S., Couto, E., Clavel-Chapelon, F., Boutron-Ruault, M.-C., Cottet, V., Palli, D., Agnoli, C., Panico, S., Tumino, R., Vineis, P., … Peeters, P. H. M. (2010). Meat consumption and prospective weight change in participants of the EPIC-PANACEA study. The American Journal of Clinical Nutrition, 92(2), 398–407. Link to source: https://doi.org/10.3945/ajcn.2009.28713

Westhoek, H., Lesschen, J. P., Rood, T., Wagner, S., De Marco, A., Murphy-Bokern, D., Leip, A., van Grinsven, H., Sutton, M. A., & Oenema, O. (2014). Food choices, health and environment: Effects of cutting Europe’s meat and dairy intake. Global Environmental Change, 26, 196–205. Link to source: https://doi.org/10.1016/j.gloenvcha.2014.02.004

Willett, W., Rockström, J., Loken, B., Springmann, M., Lang, T., Vermeulen, S., Garnett, T., Tilman, D., DeClerck, F., Wood, A., Jonell, M., Clark, M., Gordon, L. J., Fanzo, J., Hawkes, C., Zurayk, R., Rivera, J. A., De Vries, W., Majele Sibanda, L., ... Murray, C. J. L. (2019). Food in the Anthropocene: The EAT–Lancet Commission on healthy diets from sustainable food systems. The Lancet, 393(10170), 447–492. Link to source: https://doi.org/10.1016/s0140-6736(18)31788-4

Willits-Smith, A., Odinga, H., O’Malley, K., & Rose, D. (2023). Demographic and socioeconomic correlates of disproportionate beef consumption among US adults in an age of global warming. Nutrients, 15(17), Article 3795. Link to source: https://doi.org/10.3390/nu15173795 

Credits

Lead Fellows

  • Emily Cassidy

Contributors

  • Ruthie Burrows, Ph.D.
  • James Gerber, Ph.D.
  • Daniel Jasper
  • Alex Sweeney

Internal Reviewers

  • Paul C. West, Ph.D.
  • James Gerber, Ph.D.
  • Megan Matthews, Ph.D
  • Ted Otte
Effectiveness

We estimated that replacing 1 kg of ruminant meat with the same weight of other meat or protein-rich food reduces emissions by about 0.065 t CO₂‑eq (100-yr basis). 

We derived GHG emissions from 1 kg of ruminant meat, 0.075 t CO₂‑eq (100-yr basis), from Poore and Nemecek’s (2018) database and modeling from Kim et al. (2020). Our calculation was based on the GHG footprint of a kg of meat from beef cattle, dairy cattle, and sheep. We weighted the average GHG footprint based on the fact that beef makes up the majority (83%) of ruminant meat consumption, with sheep meat making up a smaller proportion (17%), according to data from the United Nations’ Food and Agriculture Organization (FAO) Food Balances (FAO, 2025).

From Poore and Nemecek’s database, we also derived the average GHG emissions from consuming 1 kg of other protein-rich foods in place of ruminant meat. These foods were: pig meat (pork), poultry meat, eggs, fish (farmed), crustaceans (farmed), peas, other pulses, groundnuts, nuts, and tofu, which are all around 20% protein by weight. Using FAO data on food availability in 2022 as a proxy for consumption, we calculated that the weighted average of these substitutes is 0.01 t CO₂‑eq /kg. 

We subtracted the weighted average emissions of these protein-rich foods (0.01 t CO₂‑eq /kg) from the weighted average emissions from ruminant meat production (0.075 t CO₂‑eq /kg) to calculate the emissions savings (0.065 t CO₂‑eq /kg) (Table 1). Our analysis assumed that substituting a serving of plant- or animal-based protein for ruminant meat reduces the production of that meat (see Caveats). 

Kim et al. (2020) did not provide species-specific emissions, but we assumed that for ruminant meat, the breakdown of CO₂, nitrous oxide, and methane was the same as in Poore and Nemecek (2018) – 43% methane and 57% CO₂ and nitrous oxide. 

Table 1. Effectiveness at reducing emissions.

Unit: t CO₂‑eq /kg avoided ruminant meat

Mean (weighted average) 0.065

Unit: t CO₂‑eq /kg avoided ruminant meat

Mean (weighted average) 0.13
Left Text Column Width
Cost

Based on our analysis, the average cost of 1 kg of ruminant meat was US$21.29 compared with the weighted average US$20.73 for other protein-rich foods. This resulted in a savings of US$0.56/kg of food. This translates to an estimated savings of US$8.54/t CO₂ eq (Table 2).

Since the publication of the EAT-Lancet Commission's dietary benchmarks, several studies have been published on the affordability of shifting to the diet (Gupta et al., 2021; Hirvonen et al., 2020; Li et al., 2024; Springmann et al., 2021). Research findings have been mixed on whether this diet shift reduces costs for consumers. One modeling study found that while the diet may cost less in upper-middle-income to high-income countries, on average, it may be more expensive in lower-middle-income to low-income countries (Springmann et al., 2021). 

As opposed to the EAT-Lancet commission, our analysis focused solely on the shift from ruminant meat toward other protein-rich foods, which doesn’t include other dietary shifts, such as reducing other kinds of meat, reducing dairy, or increasing fruits and vegetables. We found no published evidence on the economic impacts of the shift away from ruminant meat alone. However, we used data from Bai et al. (2020), which used food price data from the World Bank’s International Comparison Program (ICP) (2011), to estimate cost differences between ruminant meat and substitutes.

We converted these prices into 2023 US$ and calculated a weighted average cost of food substitutes, based on food availability from the FAO Food Balances (2025). 

The limited information used for this estimate can create bias, and we hope this work inspires research and data sharing on the economic impact of reduced ruminant consumption.

Table 2. Cost per unit climate impact. Negative values reflect cost savings.

Unit: 2023 US$/t CO₂‑eq , 100-year basis

Mean -8.54
Left Text Column Width

Methods and Supporting Data

Learning Curve

Improve Diets does not have a learning curve associated with falling costs of adoption. This solution does not address synthetically derived animal products, such as lab-grown meat, which could serve as replacements for ruminant meat. See Advance Cultivated Meat for more information

Speed of Action

Speed of action refers to how quickly a climate solution physically affects the atmosphere after it is deployed. This is different from speed of deployment, which is the pace at which solutions are adopted.

At Project Drawdown, we define the speed of action for each climate solution as emergency brake, gradual, or delayed.

Improve Diets is an EMERGENCY BRAKE climate solution. It has the potential to deliver a more rapid impact than nominal and delayed solutions. The impact of this solution is two-fold: first, it reduces methane from enteric fermentation and manure management. Second, the solution reduces pressure on natural ecosystems, reducing deforestation and other land use changes, which create a large, sudden “pulse” of CO₂ emissions.

Because emergency brake solutions can deliver their climate benefits quickly, they can help accelerate our efforts to address dangerous levels of climate change. For this reason, they are a high priority.

Caveats

We did not include Low-Income Food-Deficit countries (FAO, 2023) in this analysis because the solution does not apply to people who do not have access to affordable and healthy alternatives to ruminant meat or those with micronutrient deficiencies. 

Although some amino acids, which are building blocks of protein, are present in lower-than-optimal proportions for human needs in some plant-based foods, mixing plant protein sources, as is typically done in vegetarian diets, can address deficiencies (Mariotti & Gardner, 2019).

Additionality is a concern for this solution. While ruminant meat consumption in middle- to high-income countries remained fairly stable between 2010 and 2022, some high-income countries have recently started reducing their ruminant consumption (see Adoption Trends). However, it’s difficult to determine current adoption and trends from national-level statistics, which average out low and high consumers within a country.

Another consideration is that the decision to eat less ruminant meat will ultimately lead farmers to produce fewer ruminant animals, but the substitution may not be one-to-one. For example, one modeling study found that cutting beef consumption by 1 kg may only reduce beef production by 0.7 kg (Norwood & Lusk, 2011).

Humans use more land for animal agriculture than for any other activity. However, the potential to remove and store carbon from the atmosphere by freeing up the land used in food production, as estimated by Mbow et al. (2019), was not included in this analysis.

Current Adoption

Household-level data on food consumption are limited and not often comparable. In this analysis, we summarized current levels of food consumption on a national level, based on data on food availability from FAO Food Balances (2025). Because the data are averaged at a country level, we couldn’t estimate the current level of adoption for individuals of reduced ruminant meat consumption or the EAT-Lancet diet. 

The EAT-Lancet recommended threshold of 5.1 kg of ruminant meat per person per year is in edible, retail weight. However, available data on per capita food availability from the FAO Food Balances is measured in carcass weight, which, for beef cattle, is about 1.4 times larger than a retail cut of meat. Therefore, in this analysis, we set the threshold of excess consumption in the Food Balances as greater than 7.2 kg carcass weight per person per year, which is 5.1 kg of retail ruminant meat per person per year.

In 110 of the 146 countries tracked by FAO, average annual consumption was more than 5.1 kg of ruminant meat per person per year. Some of the highest consuming nations include Mongolia (70.1 kg/person/yr), Argentina (33.3 kg/person/yr), the United States (27.5 kg/person/yr), Australia (25.3 kg/person/yr), and Brazil (25 kg/person/yr). 

The 36 high- and middle-income countries with low (<5.1 kg/person/year) ruminant meat consumption include India (2 kg/person/yr), Peru (3.6 kg/person/yr), Poland (0.2 kg/person/yr), Vietnam (3.9 kg/person/yr), and Indonesia (2.4 kg/person/yr). 

Adoption Trend

Ruminant meat consumption in high- and middle-income countries remained fairly stable between 2010 and 2022, according to data from FAO’s Food Balances, increasing only 3% overall from 8.2 to 8.5 kg/person/yr.

However, per capita ruminant meat consumption across high-consuming regions (the Americas, Europe, and Oceania) decreased. Consumption in South America and North America declined by 13% and 2%, respectively. Europe and Oceania saw the greatest declines, at 18% and 38%, respectively.

Adoption Ceiling

The adoption ceiling for this solution is the amount of total ruminant meat consumption across all 146 high- and middle-income countries tracked by the FAO. In 2022, the consumption of ruminant meat totaled 81.2 billion kg (Table 3).

Table 3. Adoption ceiling.

Unit: kg avoided ruminant meat/yr

Estimate 81,200,000,000
Left Text Column Width
Achievable Adoption

If all of the 110 countries consuming more than the EAT-Lancet recommendation cut consumption to 5.1 kg/person/yr (which is about an 85 g serving of ruminant meat every six days), that would lower annual global ruminant meat consumption by about half (53%), or 42.9 billion kg/yr. We used this as the estimated high achievable adoption value. The low achievable adoption value we estimated to be half of this reduction (26%), or 21.4 billion kg/yr (Table 4). 

Table 4. Range of achievable adoption levels.

Unit: kg avoided ruminant meat/yr

Current adoption Not Determined
Achievable – low 21,400,000,000
Achievable – high 42,900,000,000
Adoption ceiling 81,200,000,000
Left Text Column Width

Improving diets by reducing ruminant meat consumption globally could mitigate emissions by 1.4–5.3 Gt CO₂‑eq/yr (Table 5). 

Therefore, reducing ruminant meat consumption and replacing it with any other form of plant or animal protein can have a substantial impact on GHG emissions. Such a diet shift can be adopted incrementally with small behavioral changes that together lead to globally significant reductions in GHG emissions.

Table 5. Climate impact at different levels of adoption.

Unit: Gt CO₂‑eq/yr

Current adoption Not Determined
Achievable – low 1.40
Achievable – high 2.80
Adoption ceiling 5.30

Unit: Gt CO₂‑eq/yr

Current adoption Not Determined
Achievable – low 2.88
Achievable – high 5.76
Adoption ceiling 10.90
Left Text Column Width
Additional Benefits

Food Security

Reducing ruminant meat in diets of high-income countries can improve food security (Searchinger et al., 2019). Productive cropland that is used to grow animal feed could instead be used to produce food for human consumption (Ripple et al., 2014a).

Health

Reducing ruminant meat consumption has multiple health benefits. Diets high in red meat have been linked to increased risk of overall mortality and mortality from cancer (Pan et al., 2012; Sinha et al., 2009). Excess red meat consumption is also associated with increased risk of cardiovascular disease, stroke, type 2 diabetes, colorectal cancer, and weight gain (Bouvard et al., 2015; Bradbury et al., 2020; Kaluza et al., 2012; Pan et al., 2011; Vergnaud et al., 2010). Diets that incorporate other sources of protein such as fish, poultry, nuts, legumes, low-fat dairy, and whole grains are associated with a lower risk of mortality and a reduction in dietary saturated fat, and can improve the management of diabetes (Pan et al., 2012; Nelson et al., 2016; Toumpanakis et al., 2018). 

Reducing demand for meat also has implications for health outcomes associated with livestock production. Animal agriculture, especially industrial and confined feeding operations, commonly uses antibiotics to prevent and treat infections in livestock (Casey et al., 2013). Consistent direct contact with livestock exposes people, especially farmworkers, to antibiotic-resistant bacteria, which can lead to antibiotic-resistant health outcomes (Sun et al., 2020; Tang et al., 2017). Moreover, these exposures are not limited to farmworkers. In fact, a study in Pennsylvania found that people living near dairy/veal and swine industrial agriculture had a higher risk of developing methicillin-resistant Staphylococcus aureus (MRSA) infections (Casey et al., 2013).

Equality

A lower demand for ruminant meat could promote environmental justice by reducing the amount of industrial animal agriculture operations. This may benefit communities near these operations by reducing exposure to air and water pollution, pathogens, and odors (Casey et al., 2013; Heederik et al., 2007; Steinfeld et al., 2006).

Nature Protection

Agricultural expansion for livestock production is a major driver of deforestation (Ripple et al., 2014b). Deforestation is associated with biodiversity loss through habitat degradation and destruction, as well as forest fragmentation (Steinfeld et al., 2006). Livestock farming can reduce the diversity of landscapes and can contribute to the loss of large carnivore, herbivore, and bird species (Ripple et al., 2015; Steinfeld et al., 2006). The clearing of forests for animal agriculture is especially prevalent in the tropics, and a lower demand for meat, particularly ruminant meat, could reduce tropical deforestation (Ripple et al., 2014b).

Land Resources

Animal agriculture, especially ruminants such as cattle, requires a lot of land (Nijdam et al., 2012). Life-cycle analyses have found that beef consistently requires the most land use among animal-based proteins (Nijdam et al., 2012; Meier & Christen, 2013; Searchinger et al., 2019). This high land use is mostly due to the amount of land needed to grow crops that eventually feed livestock (Ripple et al., 2014a). In the European Union, Westhoek et al. (2014) estimated that halving consumption of meat, dairy, and eggs would result in a 23% reduction in per capita cropland use.

Water Resources

While livestock is directly responsible for a small proportion of global water usage, a significant amount of water is required to produce forage and grain for animal feed (Steinfeld et al., 2006). In the United States, livestock production is the largest source of freshwater consumption, and producing 1 kg of animal protein uses 100 times more water than 1 kg of grain protein (Pimentel & Pimentel, 2003). Ruminant meats have some of the highest water usage rates of all animal protein sources (Kim et al., 2020; Searchinger et al., 2019; Steinfed et al., 2006).

Water Quality

Livestock production can contribute to water pollution directly and indirectly through feed production and processing (Steinfeld et al., 2006). Manure contains nutrients such as nitrogen and phosphorus, as well as drug residues, heavy metals, and pathogens (Steinfeld et al., 2006). Manure can pollute water directly from feedlots and can also leach into water sources when used as a fertilizer on croplands (Porter & Cox, 2020). For example, animal agriculture is one of the top polluters of water basins in central California (Harter et al., 2012) 

Air Quality

In addition to CO₂, ruminant agriculture is a source of air pollutants such as methane, nitrous oxides, ammonia, and volatile organic compounds (Gerber et al., 2013). Fertilization of feed crops and deposition of manure on crops are the primary sources of nitrogen emissions from ruminant agriculture (Steinfeld et al., 2006). Air pollution in nearby communities can lead to poor odors and respiratory issues, which may affect stress levels and quality of life (Domingo et al., 2021; Heederik et al., 2007).

Risks

A total replacement of ruminant meat with other food may reduce food availability in arid climates, where ruminants graze on land not suitable for crop production. 

While the shift from ruminant meat consumption to chicken and pork would curtail some of the demand for animal feed, it would not be reduced as much as a shift from ruminants to plant-based foods. 

Interactions with Other Solutions

Reinforcing

Pastures for grazing ruminants occupy 3400 million ha of land, more than any other human activity (Foley et al., 2011). Curtailing ruminant consumption can significantly reduce demand for land and facilitate the protection of carbon-rich ecosystems. If the adoption of this solution is aggressive, it could open up opportunities for the restoration of land-based ecosystems and some coastal wetlands.

This solution increases the supply of food. This makes more raw material available to increase the adoption potential of the following solutions:

(mixed) Reducing ruminant consumption could lead to less manure production and, therefore, nutrient pollution in proximal and downstream receiving ecosystems. However, if ruminant meat is replaced with food sources that generate more manure or require more fertilizer/pesticides, pollution could increase in proximal or downgradient receiving ecosystems.

Reducing ruminant meat consumption can reduce the amount of nutrients and manure available to manage, depending on whether it is substituted with plant-based foods or other meat.

Dashboard

Solution Basics

kg avoided ruminant meat

t CO₂-eq (100-yr)/unit
0.065
units/yr
Current Not Determined 02.14×10¹⁰4.29×10¹⁰
Achievable (Low to High)

Climate Impact

Gt CO₂-eq (100-yr)/yr
Current Not Determined 1.42.8
US$ per t CO₂-eq
-9
Emergency Brake

CO₂, CH₄ , N₂O

Trade-offs

There are climate and environmental trade-offs associated with the production of different kinds of protein. Producing ruminant meat is land-intensive and contributes to the conversion of natural ecosystems to pasture and animal feed. However, ruminants can live on land that is too dry for crop production and graze on plants not suitable for human consumption. In some low-income food-insecure countries (not included in this analysis), grazing animals may be an important source of protein. 

Substituting ruminant meat with chicken, fish, or other meat can substantially reduce methane emissions, but comes with some environmental and animal welfare trade-offs. 

kg/person/yr
0-10
10–20
20–30
30–40
> 40

Per capita ruminant meat consumption

Per capita ruminant meat consumption varies greatly around the world. According to the Food and Agriculture Organization of the United Nations (FAO), Mongolia had the highest per-person ruminant meat consumption (99 kg/person/yr) in 2022, followed by Argentina (47 kg/person/yr) and Turkmenistan (46 kg/person/yr).

Food and Agriculture Organization of the United Nations (FAO). (2025). FAO‑FAOSTAT: Food balances (2010–) [Data set, food balances for individual countries for the year 2022]. Retrieved March 25, 2025, from Link to source: https://www.fao.org/faostat/en/#data/FBS

kg/person/yr
0-10
10–20
20–30
30–40
> 40

Per capita ruminant meat consumption

Per capita ruminant meat consumption varies greatly around the world. According to the Food and Agriculture Organization of the United Nations (FAO), Mongolia had the highest per-person ruminant meat consumption (99 kg/person/yr) in 2022, followed by Argentina (47 kg/person/yr) and Turkmenistan (46 kg/person/yr).

Food and Agriculture Organization of the United Nations (FAO). (2025). FAO‑FAOSTAT: Food balances (2010–) [Data set, food balances for individual countries for the year 2022]. Retrieved March 25, 2025, from Link to source: https://www.fao.org/faostat/en/#data/FBS

Maps Introduction

The emissions intensity of beef production varies considerably between countries, due to the contribution of regional deforestation and other land changes (Kim et al. 2020; Poore and Nemecek, 2018) and the intensity of different cattle raising systems, with extensive, pasture-based systems relatively less efficient (in terms of land and CO₂‑eq /kg beef) (Herrero et al. 2016). For example, GHG emissions per kilogram of bovine meat from Brazil and Paraguay were five and 17 times higher, respectively, than those of Danish bovine meat (Kim et al. 2020). These differences were attributable to higher deforestation for grazing lands and methane emissions from enteric fermentation.

Emissions from beef production are skewed by producers with particularly high impacts. About a quarter of beef producers contribute more than 56% (an estimated 1.3 Gt CO₂‑eq ) of all GHGs attributable to beef cattle production.

Beef consumption per person in Mongolia and North and South America is especially high, and reducing it can benefit human health (see Benefits to People & Nature). According to the Food and Agriculture Organization of the United Nations (FAO), Mongolia had the highest per-person ruminant meat consumption (99 kg/person/yr) in 2022, followed by Argentina (47 kg/person/yr) and Turkmenistan (46 kg/person/yr). 

For this analysis, we examined high- and middle-income countries that consume more than 5.1 kg/person/yr of ruminant meat (what we define as “excess consumption”). The United States has more excess ruminant meat consumption than any other country. A 2023 assessment of health survey data found that in the United States, about 12% of the population ate about half of all beef supplies (Willits-Smith et al., 2023).

Maps are based on global average emissions per kg of ruminant meat, which keeps the focus on consumption.

Action Word
Improve
Solution Title
Diets
Classification
Highly Recommended

Lawmakers and Policymakers

  • Use a comprehensive approach to improving diets including both “hard” (e.g., regulations) and “soft” (e.g., educational programs) policies.
  • Ensure public procurement avoids ruminant meat and favors plant-rich diets as the default, especially in schools, hospitals, and cafeterias for public workers.
  • Require companies that sell food to the government to disclose Scope 3 supply-chain emissions and adopt science-based targets, including a no-deforestation commitment.
  • Develop national dietary guidelines based on health and environmental factors; ensure the guidelines are integrated throughout procurement policies, public education programs, and government food aid programs.
  • Establish coordination bodies with stakeholders, such as farmers, distributors, storage facilities, food processors, transportation companies, retail, and waste management services, to design the most optimal policy package.
  • Set ambitious local, national, and international goals and climate plans to improve diets and include the agricultural sector in emissions reduction targets.
  • Establish safety nets for growers, such as access to grants or low-interest capital, reliable access to price information, early warning systems for price fluctuations, and insurance programs.
  • Use financial instruments such as grants, subsidies, or tax exemptions to support farmers, producers, start-ups, infrastructure, and related technology.
  • Reallocate subsidies for ruminant animal agriculture to alternatives; provide extensive support to farmers and ranchers transitioning to more sustainable agriculture systems through financial assistance, buyout programs, and education programs.
  • Remove or reconfigure other subsidies that artificially deflate the price of meat, such as animal feed and manure storage facilities.
  • Require carbon footprint labels on food and produce.
  • Limit or prohibit the expansion of agricultural lands, especially for animal agriculture.
  • Restrict advertising for unhealthy foods and/or require disclosures for health and environmental impacts for adverts.
  • Work with the health-care industry to integrate plant-rich diets into public health programs, and educate the public on the benefits of plant-rich diets.
  • Expand extension services to help food retailers develop plant-based items, design menus, develop marketing materials, and provide other assistance to improve the profitability of plant-rich diets.
  • Implement a carbon tax on livestock or meat products in food-secure areas and ensure there is proper monitoring and enforcement capacity.
  • Use zoning laws to give plant-based and healthy food outlets better visibility or higher traffic locations; designate favorable spaces for plant-based food trucks and street vendors.
  • Create robust educational programs for schools and adults on plant-based and healthy cooking.
  • Create, support, or join education campaigns and/or public-private partnerships that teach the importance of plant-based diets and the environmental impacts of common foods.

Practitioners

  • Scale up production of nutrient-dense plant-based foods.
  • Create peer-to-peer networks to exchange best practices and local or industry troubleshooting tips.
  • Increase the visibility of plant-based diets through repetitive ad campaigns, product placement, and displays.
  • Design menus to avoid ruminant meat and center plant-based products.
  • Invest in R&D to improve plant-based products.
  • Develop culturally relevant plant-based products to support acceptance and uptake.
  • Develop mobile or web apps that help consumers plan and cook plant-based meals, find plant-based retailers, and learn about plant-rich diets.
  • Take advantage of financial incentives such as grants, subsidies, or tax exemptions.
  • Participate or help establish coordination bodies with stakeholders, such as farmers, distributors, storage facilities, food processors, transportation companies, retail, and waste management services, to design the most optimal food systems transformation.
  • Work with the health-care industry to integrate plant-rich diets into public health programs, and educate the public on the benefits of plant-rich diets.
  • Use labels to show the environmental and emissions impact of food and menu items.
  • Hold local plant-based culinary challenges to promote products and services.
  • Create, support, or join education campaigns and/or public-private partnerships that promote plant-rich diets.

Business Leaders

  • Establish company goals for ruminant substitution and incorporate them into corporate net-zero strategies.
  • Ensure company procurement avoids ruminant meat and favors plant-rich diets as the default.
  • Participate in or help establish coordination bodies with stakeholders, such as farmers, distributors, storage facilities, food processors, transportation companies, retail, and waste management services, to design the most optimal food systems transformation.
  • Take advantage of financial incentives such as grants, subsidies, or tax exemptions.
  • Offer financial services, including low-interest loans, micro-financing, and grants, to support initiatives promoting plant-rich diets.
  • Use labels to show the environmental and emissions impact of food and menu items.
  • Increase the visibility of plant-based diets through repetitive ad campaigns, product placement, and displays.
  • Fund start-ups or existing companies that are improving plant-based proteins and alternatives to animal agriculture.
  • Develop mobile or web apps that help consumers plan and cook plant-based meals, find plant-based retailers, and learn about plant-rich diets.
  • Hold local plant-based culinary challenges to promote products and services.
  • Create, support, or join education campaigns and/or public-private partnerships that promote plant-rich diets.
  • Include ruminant-free and plant-rich dietary support in employee wellness and benefits programs.

Nonprofit Leaders

  • Ensure organization procurement avoids ruminant meat and favors plant-rich diets.
  • Help develop and advocate for ambitious local, national, and international goals and climate plans to improve diets.
  • Participate or help establish coordination bodies with stakeholders, such as farmers, distributors, storage facilities, food processors, transportation companies, retail, and waste management services, to design the most optimal food systems transformation.
  • Advocate to reallocate subsidies for ruminant agriculture to plant-based alternatives.
  • Advocate for financial instruments such as taxes, subsidies, or exemptions to support farmers, producers, start-ups, infrastructure, and related technology.
  • Advocate for standardized and mandatory carbon footprint labels on food and produce.
  • Advocate for a carbon tax on livestock or meat products in food-secure areas and ensure there is proper monitoring and enforcement capacity.
  • Offer comprehensive training and technical assistance programs for farmers and producers supporting plant-rich diets.
  • Implement campaigns promoting divestment from major animal agriculture polluters and challenge misleading claims on high-emissions meat products.
  • Work with the health-care industry to integrate plant-rich diets into public health programs, and educate the public on the benefits of plant-rich diets.
  • Create demonstration farms to show local examples, strategies to generate income, and how to use government programs.
  • Create robust educational programs for schools and adults on plant-based and healthy cooking.
  • Hold local plant-based culinary challenges to promote plant-rich diets.
  • Create, support, or join education campaigns and/or public-private partnerships that promote plant-rich diets.

Investors

  • Ensure relevant portfolio companies avoid ruminant meat production and support plant-rich diets; avoid investing in animal agriculture in high-income countries or work with them to transition to plant-rich alternatives.
  • Invest in companies developing plant-based foods or technologies that support processing, such as equipment, transportation, and storage.
  • Fund start-ups or existing companies that are improving plant-based proteins and alternatives to animal agriculture.
  • Offer financial services, including low-interest loans, micro-financing, and grants, for plant-based food initiatives.
  • Participate or help establish coordination bodies with stakeholders, such as farmers, distributors, storage facilities, food processors, transportation companies, retail, and waste management services, to design the most optimal food systems transformation.
  • Create, support, or join education campaigns and/or public-private partnerships that promote plant-rich diets.

Philanthropists and International Aid Agencies

  • Ensure organization procurement avoids ruminant meat and favors plant-rich diets.
  • Help develop and advocate for ambitious local, national, and international goals and climate plans to improve diets.
  • Participate or help establish coordination bodies with stakeholders, such as farmers, distributors, storage facilities, food processors, transportation companies, retail, and waste management services, to design the most optimal food systems transformation.
  • Invest in companies developing plant-based foods or technologies that support processing, such as equipment, transportation, and storage.
  • Fund start-ups or existing companies that are improving plant-based proteins and alternatives to ruminant animal agriculture.
  • Offer financial services, including low-interest loans, micro-financing, and grants, for plant-based food initiatives.
  • Advocate to reallocate subsidies for animal agriculture to plant-based alternatives.
  • Advocate for financial instruments such as taxes, subsidies, or exemptions to support plant-based farmers, producers, start-ups, infrastructure, and related technology.
  • Advocate for standardized and mandatory environmental impact labels on food and produce.
  • Advocate for a carbon tax on livestock or meat products in food-secure areas and ensure there is proper monitoring and enforcement capacity.
  • Offer comprehensive training and technical assistance programs for farmers and producers supporting plant-rich diets.
  • Create demonstration farms to show local examples, strategies to generate income, and how to use government programs.
  • Create robust educational programs for schools and adults on plant-based and healthy cooking.
  • Work with the health-care industry to integrate plant-rich diets into public health programs and educate the public on the benefits of plant-rich diets.
  • Integrate plant-rich diets with ecosystem protection and restoration efforts such as education campaigns, national plans, and international agreements, when relevant.
  • Create, support, or join education campaigns and/or public-private partnerships that promote plant-rich diets.

Thought Leaders

  • Help develop and advocate for ambitious local, national, and international goals and climate plans to improve diets.
  • Participate or help establish coordination bodies with stakeholders, such as farmers, distributors, storage facilities, food processors, transportation companies, retail, and waste management services, to design the most optimal local food systems transformation.
  • Help shift policy and academic goals around agriculture from quantity of outputs to nutritional quality of outputs.
  • Help market and brand plant-based items appealing to average and/or conventional tastes.
  • Find new ways to appeal to high-red-meat consumers and new markets – particularly, men and athletic communities.
  • Highlight the social and environmental impacts of animal-based products in high-income countries.
  • Design and implement robust educational programs for schools and adults on plant-based and healthy cooking.
  • Advocate to reallocate subsidies for animal agriculture to plant-based alternatives.
  • Advocate for financial instruments such as taxes, subsidies, or exemptions to support plant-based farmers, producers, start-ups, infrastructure, and related technology.
  • Advocate for standardized and mandatory carbon footprint labels on food and produce.
  • Create, support, or join education campaigns and/or public-private partnerships that promote plant-rich diets.

Technologists and Researchers

  • Research connections between plant-based agriculture and human well-being indicators such as nutrition, income, and human rights.
  • Develop new or improve existing plant-based or lab-grown alternatives to ruminant meat and other animal-based proteins.
  • Develop plant-based proteins that account for local supply chains and cultural preferences.
  • Analyze the full suite of interventions that encourage plant-based diets and offer recommendations to policy and lawmakers on the most effective options.
  • Use market data on food purchases and preferences to improve marketing and attractiveness of plant-based options.
  • Develop mobile or web apps that help consumers plan and cook plant-based meals, find plant-based retailers, and learn about plant-rich diets.
  • Research connections between plant-rich diets, food security, cultural cuisine preferences, and health indicators.
  • Help develop national dietary guidelines based on health and environmental factors.

Communities, Households, and Individuals

  • Eat plant-rich diets and avoid ruminant meat as much as possible.
  • Offer alternatives to ruminant meat at social gatherings and request plant-based options at public events.
  • Talk to family, friends, and coworkers about avoiding beef; recommend your favorite restaurants, recipes, and cooking tips.
  • Support educational programs for schools and adults on plant-based and healthy cooking.
  • Advocate to reallocate subsidies for animal agriculture to plant-based alternatives.
  • Advocate for financial instruments such as taxes, subsidies, or exemptions to support plant-based farmers, producers, start-ups, infrastructure, and related technology.
  • Create, support, or join education campaigns and/or public-private partnerships that promote plant-rich diets.
Evidence Base

Consensus of effectiveness in reducing ruminant meat: High

There is a high level of consensus in the scientific literature that shifting diets away from ruminant meat mitigates GHG emissions. An IPCC special report on land found “broad agreement” that meat – particularly ruminant meat – was the single food with the greatest impact on the environment on a global basis, especially in terms of GHG emissions and land use (Mbow et al., 2019). The IPCC found that the range of cumulative emissions mitigation from diet shifts by 2050, depending on the type of shift, was as much as 2.7–6.4 Gt CO₂‑eq/yr. This estimate included shifts away from all meat, whereas our analysis focused on shifting away from ruminant meat alone.

The emissions associated with the production of different food products in this solution came from Poore and Nemecek (2018) and Kim et al. (2020). Poore and Nemecek developed a database of emissions footprints for different foods based on a meta-analysis of 570 studies with a median reference year of 2010 (Figure 1). It covers ~38,700 commercially viable farms in 119 countries and 40 products representing ~90% of global protein and calorie consumption. 

According to Poore and Nemecek (2018), producing 1 kg of beef emits 33 times the GHGs emitted by producing protein-rich plant-based foods, such as beans, nuts, and lentils. But beef can also be replaced with any other non-ruminant meat (poultry, pork, or fish) to cut emissions. Substituting ruminant meat with any other kind of meat reduces average emissions by roughly 85%.

A 2024 study on dietary emissions from 140 food products in 139 countries found that shifting consumption toward the EAT-Lancet guidelines could reduce emissions from the food system 17%, or about 1.94 Gt CO₂‑eq/yr (Li, Y. et al., 2024). 

The results presented in this document summarize findings from 42 studies (34 academic reviews and original studies, three reports from NGOs, and five reports from public and multilateral organizations). The results reflect current evidence from 119 countries, but observations are concentrated in Europe, North America, Oceania, Brazil, and China, and limited in Africa and parts of Asia. We recognize this limited geographic scope creates bias, and hope this work inspires research and data sharing on this topic in underrepresented regions.

Updated Date
Coming Soon Label
Coming Soon

Mobilize Electric Cars

Image
Image
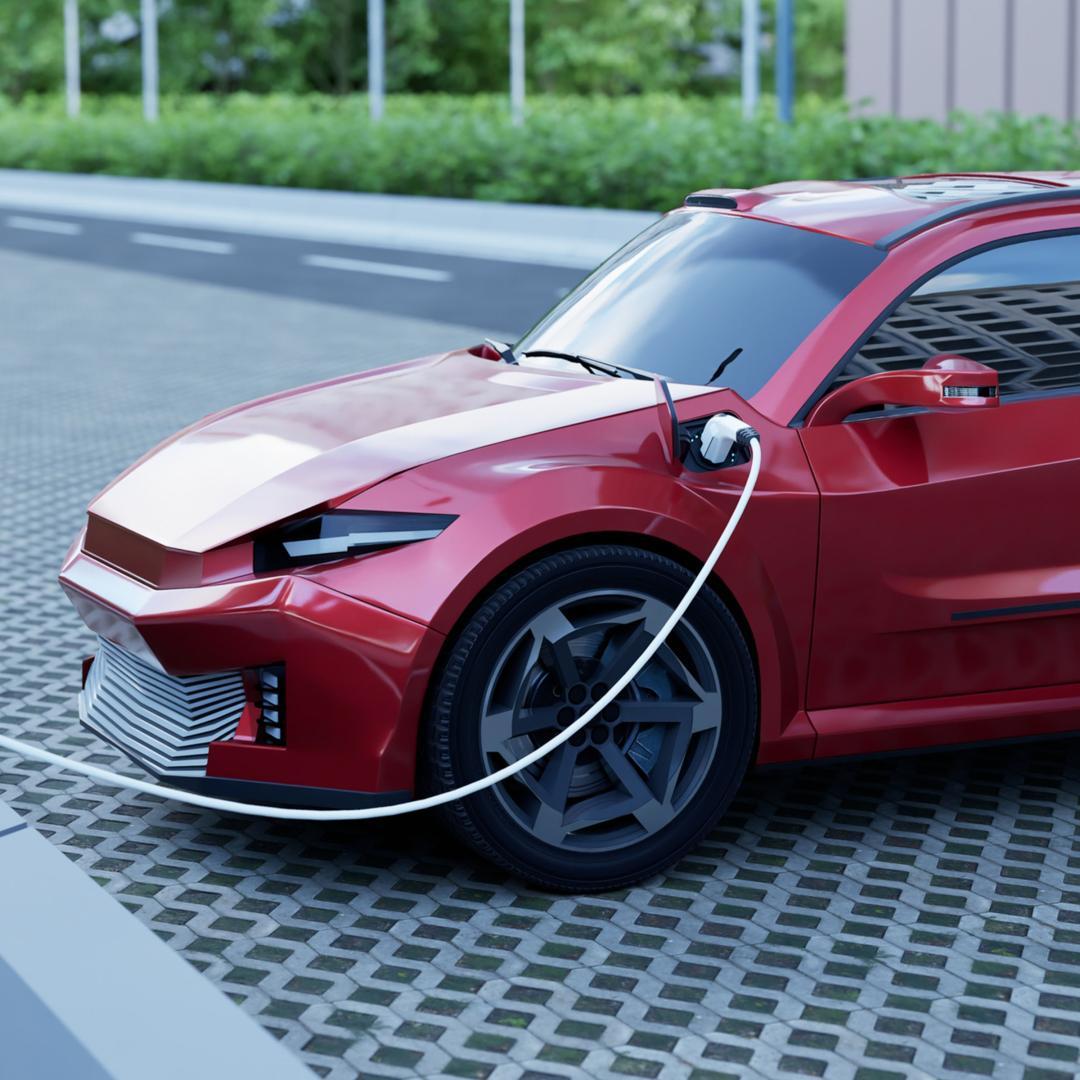
Electric car plugged into charging station
Coming Soon
Off

Key Takeaways

  • Electric cars generally produce fewer GHGs per passenger-kilometer than fossil fuel–powered cars, particularly when charged with low-carbon electricity.
  • Global adoption of electric cars is growing rapidly, but it remains small relative to the more than 2 billion cars currently in use.
  • Electric cars can lower operating costs and eliminate tailpipe emissions compared with fossil fuel–powered cars, improving urban air quality and health.
  • Battery production, mineral extraction, charging infrastructure, and electricity-grid emissions can limit the overall benefits of electric cars.
Summary

Electric cars are four-wheeled passenger cars that run on electricity, usually from the electricity grid and stored in onboard batteries (i.e., not including fuel cell electric cars). This definition includes electric pickup trucks, motorhomes, and other such vehicles. It does not include two-wheeled vehicles or hybrid cars (which combine an electric motor with a gasoline or diesel engine). It also does not include freight and commercial vehicles, such as electric heavy trucks, buses, and ambulances. We define Mobilize Electric Cars as replacing fossil fuel–powered cars (i.e., those powered by internal combustion engines) with electric equivalents, as well as building out the necessary infrastructure (especially charging stations) to support them.

Description for Social and Search
Mobilize Electric Cars is a Highly Recommended climate solution. Electric cars slash air pollution and greenhouse gases, especially when powered by clean grids.
Overview

Electric cars provide the same functionality as fossil fuel–powered cars, but use electric motors rather than fuel-burning engines. The energy for the motors comes from an onboard battery, which is normally charged using electricity from the grid.

Electric cars have no direct tailpipe emissions, since electric motors do not burn fuel to function. The grid electricity used to charge their batteries may have come from fossil fuel-burning power plants, meaning electric cars are not entirely free of direct emissions. However, in most electrical grids, even those that mainly generate electricity from fossil fuels, electric cars usually still produce fewer emissions per pkm than fossil fuel–powered cars. This is for three reasons. First, large, fixed power plants and efficient electric grids can convert fossil fuels into useful energy more efficiently than smaller, mobile internal combustion engines in cars. In extreme cases, such as grids powered entirely by coal, this might not be the case, particularly if the grid has a lot of transmission and distribution losses. Second, the powertrain of an electric car delivers electricity from the battery to the wheels much more efficiently than the powertrain of a fossil fuel–powered car, which wastes much more energy as heat (International Transport Forum, 2020; Mofolasayo, 2023; Verma et al., 2022). Third, electric cars’ powertrains enable regenerative braking, where the kinetic energy of the car’s motion is put back into the battery when the driver brakes (Yang et al., 2024).

Electric cars reduce emissions of CO₂,  methane, and nitrous oxide to the atmosphere by replacing fuel-powered cars, which emit these gases from their tailpipes.

References

APEC. (2024). Connecting Traveler Choice with Climate Outcomes: Innovative Greenhouse Gas Emissions Reduction Policies and Practices in the APEC Region through Traveler Behavioral Change. Link to source: https://www.apec.org/publications/2024/09/connecting-traveler-choice-with-climate-outcomes--innovative-greenhouse-gas-emissions-reduction-policies-and-practices-in-the-apec-region-through-traveler-behavioral-change 

Agusdinata, D. B., Liu, W., Eakin, H., & Romero, H. (2018). Socio-environmental impacts of lithium mineral extraction: Towards a research agenda. Environmental Research Letters, 13(12). Scopus. Link to source: https://doi.org/10.1088/1748-9326/aae9b1

Anenberg, S. C., Miller, J., Henze, D., & Minjares, R. (2019). A global snapshot of the air pollution-related health impacts of transportation sector emissions in 2010 and 2015. International Council on Clean Transportation. Link to source: https://theicct.org/publication/a-global-snapshot-of-the-air-pollution-related-health-impacts-of-transportation-sector-emissions-in-2010-and-2015/

Bloomberg New Energy Finance. (2024). Electric Vehicle Outlook 2024. Bloomberg. Link to source: https://about.bnef.com/electric-vehicle-outlook/

Carey, J. (2023). The other benefit of electric vehicles. Proceedings of the National Academy of Sciences, 120(3), e2220923120. Link to source: https://doi.org/10.1073/pnas.2220923120

Castelvecchi, D. (2021). Electric cars and batteries: How will the world produce enough? Nature, 596(7872), 336–339. Link to source: https://doi.org/10.1038/d41586-021-02222-1

Choma, E. F., Evans, J. S., Hammitt, J. K., Gómez-Ibáñez, J. A., & Spengler, J. D. (2020). Assessing the health impacts of electric vehicles through air pollution in the United States. Environment International, 144, 106015. Link to source: https://doi.org/10.1016/j.envint.2020.106015

Dillman, K. J., Árnadóttir, Á., Heinonen, J., Czepkiewicz, M., & Davíðsdóttir, B. (2020). Review and Meta-Analysis of EVs: Embodied Emissions and Environmental Breakeven. Sustainability, 12(22), Article 22. Link to source: https://doi.org/10.3390/su12229390

Electric vehicle database. (2024). Energy consumption of full electric vehicles. Electric Vehicle Database. Link to source: https://ev-database.org/cheatsheet/energy-consumption-electric-car

Fakhrooeian, P., Pitz, V., & Scheppat, B. (2024). Systematic Evaluation of Possible Maximum Loads Caused by Electric Vehicle Charging and Heat Pumps and Their Effects on Common Structures of German Low-Voltage Grids. World Electric Vehicle Journal, 15(2), 49. Link to source: https://doi.org/10.3390/wevj15020049

Garcia, E., Johnston, J., McConnell, R., Palinkas, L., & Eckel, S. P. (2023). California’s early transition to electric vehicles: Observed health and air quality co-benefits. The Science of the Total Environment, 867, 161761. Link to source: https://doi.org/10.1016/j.scitotenv.2023.161761

Goetzel, N., & Hasanuzzaman, M. (2022). An empirical analysis of electric vehicle cost trends: A case study in Germany. Research in Transportation Business & Management, 43, 100825. Link to source: https://doi.org/10.1016/j.rtbm.2022.100825

Guarnieri, M., & Balmes, J. R. (2014). Outdoor air pollution and asthma. Lancet, 383(9928), 1581–1592. Link to source: https://doi.org/10.1016/S0140-6736(14)60617-6

IEA. (2022). Electric Vehicles: Total Cost of Ownership Tool. IEA. Link to source: https://www.iea.org/data-and-statistics/data-tools/electric-vehicles-total-cost-of-ownership-tool

IEA. (2024). Global EV Outlook 2024. International Energy Agency. Link to source: https://www.iea.org/reports/global-ev-outlook-2024

International Council on Clean Transportation. (2024). Clearing the air: Why EVs can outperform conventional vehicles in freezing temperatures. International Council on Clean Transportation. Link to source: https://theicct.org/clearing-the-air-why-evs-can-outperform-conventional-vehicles-in-freezing-temperatures-oct24/

International Transport Forum. (2020). Good to Go? Assessing the Environmental Performance of New Mobility (Corporate Partnership Board). OECD. Link to source: https://www.itf-oecd.org/sites/default/files/docs/environmental-performance-new-mobility.pdf

IPCC. (2022). Mitigation of Climate Change. Contribution of Working Group III to the Sixth Assessment Report of the Intergovernmental Panel on Climate Change. Cambridge. Link to source: https://www.ipcc.ch/report/ar6/wg3/downloads/report/IPCC_AR6_WGIII_FullReport.pdf

Jones, S. J. (2019). If electric cars are the answer, what was the question? British Medical Bulletin, 129(1), 13–23. Link to source: https://doi.org/10.1093/bmb/ldy044

Kerr, G. H., Goldberg, D. L., & Anenberg, S. C. (2021). COVID-19 pandemic reveals persistent disparities in nitrogen dioxide pollution. Proceedings of the National Academy of Sciences, 118(30), e2022409118. Link to source: https://doi.org/10.1073/pnas.2022409118

Kittner, N., Tsiropoulos, I., Tarvydas, D., Schmidt, O., Staffell, I., & Kammen, D. M. (2020). Chapter 9—Electric vehicles. In M. Junginger & A. Louwen (Eds.), Technological Learning in the Transition to a Low-Carbon Energy System (pp. 145–163). Academic Press. Link to source: https://doi.org/10.1016/B978-0-12-818762-3.00009-1

Larson, E., Grieg, C., Jenkins, J., Mayfield, E., Pascale, A., Zhang, C., Drossman, J., Williams, R., Pacala, S., Socolow, R., Baik, E., Birdesy, R., Duke, R., Jones, R., Haley, B., Leslie, E., Paustain, K., & Swan, A. (2021). Net-Zero America: Potential Pathways, Infrastructure, and Impacts. Princeton University. Link to source: https://lpdd.org/resources/princeton-report-net-zero-america/

Melaina, M., Bush, B., Eichman, J., Wood, E., Stright, D., Krishnan, V., Keyser, D., Mai, T., & McLaren, J. (2016). National Economic Value Assessment of Plug-in Electric Vehicles: Volume I (No. NREL/TP-5400-66980). National Renewable Energy Lab. (NREL), Golden, CO (United States). Link to source: https://doi.org/10.2172/1338175

Milovanoff, A., Posen, I. D., & MacLean, H. L. (2020). Electrification of light-duty vehicle fleet alone will not meet mitigation targets. Nature Climate Change, 1–6. Link to source: https://doi.org/10.1038/s41558-020-00921-7

Mofolasayo, A. (2023). Assessing and Managing the Direct and Indirect Emissions from Electric and Fossil-Powered Vehicles. Sustainability, 15(2), Article 2. Link to source: https://doi.org/10.3390/su15021138

Nguyen, C. T. P., Nguyễn, B.-H., Ta, M. C., & Trovão, J. P. F. (2023). Dual-Motor Dual-Source High Performance EV: A Comprehensive Review. Energies, 16(20), Article 20. Link to source: https://doi.org/10.3390/en16207048

Nickel Institute. (2021a). Asia Pacific and UK Automotive ICE vs EV Total Cost of Ownership. Link to source: https://nickelinstitute.org/media/8d993d1b8165b23/tco-asia-pacific-automotive.pdf

Nickel Institute. (2021b). European Union and UK Automotive ICE vs EV Total Cost of Ownership. Link to source: https://nickelinstitute.org/media/8d9058c08d2bcf2/avicenne-study-tco-eu-and-uk-automotive.pdf

Nickel Institute. (2021c). North American Automotive ICE vs EV Total Cost of Ownership. Link to source: https://nickelinstitute.org/media/8d993d0fd3dfd5b/tco-north-american-automotive-final.pdf

Pan, S., Yu, W., Fulton, L. M., Jung, J., Choi, Y., & Gao, H. O. (2023). Impacts of the large-scale use of passenger electric vehicles on public health in 30 US. metropolitan areas. Renewable and Sustainable Energy Reviews, 173, 113100. Link to source: https://doi.org/10.1016/j.rser.2022.113100

Pennington, A. F., Cornwell, C. R., Sircar, K. D., & Mirabelli, M. C. (2024). Electric vehicles and health: A scoping review. Environmental Research, 251, 118697. Link to source: https://doi.org/10.1016/j.envres.2024.118697

Peters, D. R., Schnell, J. L., Kinney, P. L., Naik, V., & Horton, D. E. (2020). Public health and climate benefits and trade‐offs of U.S. vehicle electrification. GeoHealth, 4, e2020GH000275. Link to source: https://doi.org/10.1029/2020GH000275 

Ravi, S. S., & Aziz, M. (2022). Utilization of Electric Vehicles for Vehicle-to-Grid Services: Progress and Perspectives. Energies, 15(2), Article 2. Link to source: https://doi.org/10.3390/en15020589

Ren, Y., Sun, X., Wolfram, P., Zhao, S., Tang, X., Kang, Y., Zhao, D., & Zheng, X. (2023). Hidden delays of climate mitigation benefits in the race for electric vehicle deployment. Nature Communications, 14(1), 3164. Link to source: https://doi.org/10.1038/s41467-023-38182-5

Requia, W. J., Mohamed, M., Higgins, C. D., Arain, A., & Ferguson, M. (2018). How clean are electric vehicles? Evidence-based review of the effects of electric mobility on air pollutants, greenhouse gas emissions and human health. Atmospheric Environment, 185, 64–77. Link to source: https://doi.org/10.1016/j.atmosenv.2018.04.040

Roberts, C. (2022). Easy Street for Low-Carbon Mobility? The Political Economy of Mass Electric Car Adoption. In G. Parkhurst & W. Clayton (Eds.), Electrifying Mobility: Realising a Sustainable Future for the Car (Vol. 15, pp. 13–31). Emerald Publishing Limited. Link to source: https://doi.org/10.1108/S2044-994120220000015004

Sovacool, B. K. (2019). The precarious political economy of cobalt: Balancing prosperity, poverty, and brutality in artisanal and industrial mining in the Democratic Republic of the Congo. The Extractive Industries and Society, 6(3), 915–939. Link to source: https://doi.org/10.1016/j.exis.2019.05.018

Szyszkowicz, M., Kousha, T., Castner, J., & Dales, R. (2018). Air pollution and emergency department visits for respiratory diseases: A multi-city case crossover study. Environmental Research, 163, 263–269. Link to source: https://doi.org/10.1016/j.envres.2018.01.043

Vega-Perkins, J., Newell, J. P., & Keoleian, G. (2023). Mapping electric vehicle impacts: Greenhouse gas emissions, fuel costs, and energy justice in the United States. Environmental Research Letters, 18(1), 014027. Link to source: https://doi.org/10.1088/1748-9326/aca4e6

Verma, S., Dwivedi, G., & Verma, P. (2022). Life cycle assessment of electric vehicles in comparison to combustion engine vehicles: A review. Materials Today: Proceedings, 49, 217–222. Link to source: https://doi.org/10.1016/j.matpr.2021.01.666

Weiss, M., Dekker, P., Moro, A., Scholz, H., & Patel, M. K. (2015). On the electrification of road transportation – A review of the environmental, economic, and social performance of electric two-wheelers. Transportation Research Part D: Transport and Environment, 41, 348–366. Link to source: https://doi.org/10.1016/j.trd.2015.09.007

WHO. (2024). Number of registered vehicles. Link to source: https://www.who.int/data/gho/data/indicators/indicator-details/GHO/number-of-registered-vehicles

Yang, C., Sun, T., Wang, W., Li, Y., Zhang, Y., & Zha, M. (2024). Regenerative braking system development and perspectives for electric vehicles: An overview. Renewable and Sustainable Energy Reviews, 198, 114389. Link to source: https://doi.org/10.1016/j.rser.2024.114389

Yoder, K. (2023, June 14). The environmental disaster lurking beneath your neighborhood gas station. Grist. Link to source: https://grist.org/accountability/gas-stations-underground-storage-tank-leaks-environmental-disaster/

Credits

Lead Fellow

  • Cameron Roberts, Ph.D.

Contributors

  • Ruthie Burrows, Ph.D.

  • James Gerber, Ph.D.

  • Daniel Jasper

  • Heather Jones, Ph.D.

  • Heather McDiarmid, Ph.D.

  • Alex Sweeney

Internal Reviewers

  • Aiyana Bodi

  • James Gerber, Ph.D.

  • Hannah Henkin

  • Jason Lam

  • Ted Otte

  • Amanda D. Smith, Ph.D.
Effectiveness

Every million pkm shifted from fossil fuel–powered cars to electric cars reduces 48.52 t CO₂‑eq on a 100-yr basis (Table 1), or 49.13 t CO₂‑eq on a 20-yr basis. 

We found this by collecting data on electricity consumption for a range of electric car models (Electric Vehicle Database, 2024) and multiplying it by the global average emissions per kWh of electricity generation. Fossil fuel–powered cars emit 115.3 t CO₂‑eq/million pkm on a 100-yr basis (116.4 t CO₂‑eq/million pkm on a 20-yr basis). Electric cars already have lower emissions in countries with large shares of renewable, nuclear, or hydropower generation in their electricity grids (International Transport Forum, 2020; Verma et al., 2022).

These data come disproportionately from North America and Europe, and, notably, leave out China, which has made major progress on electric cars in recent years and has many of its own makes and models. 

Electric cars today are disproportionately used in high- and upper-middle-income countries, whose electricity grids emit fewer GHG emissions than the global average per unit of electricity generated (International Energy Agency [IEA], 2024). Electric cars in use today reduce more emissions on average than the figure we have calculated. 

Electric cars have higher embodied emissions than fossil fuel–powered cars, due to the GHG-intensive process of manufacturing batteries. This gives them a carbon payback period which ranges from zero to over 10 years (Dillman et al., 2020; Ren et al., 2023).

Table 1. Effectiveness at reducing emissions.

Unit: t CO₂‑eq/million pkm, 100-yr basis

25th percentile 38.95
Mean 49.54
Median (50th percentile) 48.52
75th percentile 62.82

Shifted from fossil fuel–powered cars to electric cars, 100-yr basis.

Left Text Column Width
Cost

Including purchase price, financing, fuel and electricity costs, maintenance costs, and insurance, electric cars cost on average US$0.05 less per pkm (US$49,440/million pkm) than fuel-powered cars. This is based on a population-weighted average of the cost differential between electric and fossil fuel–powered cars in seven countries: Japan, South Korea, China, the United States, France, Germany, and the United Kingdom (Nickel Institute, 2021b, 2021c, 2021a). 

While this analysis found that electric cars are less expensive than fossil fuel–powered cars almost everywhere, the margin is often quite small. The difference is less than US$0.01/pkm (US$10,000/million pkm) in South Korea, the United States, and Germany. In some markets, electric cars are more expensive per pkm than fossil fuel–powered cars (IEA, 2022).

This amounts to savings of US$1,019/t CO₂‑eq on a 100-yr basis (Table 2), or US$1,006/t CO₂‑eq avoided emissions on a 20-yr basis). 

Our analysis does not include costs that are the same for both electric and fossil fuel–powered cars, including taxes, insurance costs, and public costs of building road infrastructure.

Table 2. Cost per unit climate impact.

Unit: 2023 US$/t CO₂‑eq, 100-yr basis

Median -1,019
Left Text Column Width

Methods and Supporting Data

Learning Curve

For every doubling in electric car production, costs decline by approximately 23% (Table 3; Goetzel & Hasanuzzaman, 2022; Kittner et al., 2020; Weiss et al., 2015). 

In addition to manufacturing improvements and economies of scale, this reflects rapid technological advancements in battery production, which is a significant cost component of an electric powertrain (Weiss et al., 2015).

Table 3. Learning rate: drop in cost per doubling of the deployed solution.

Unit: %

25th percentile 23.00
Mean 22.84
Median (50th percentile) 23.00
75th percentile 24.00
Left Text Column Width
Speed of Action

Speed of action refers to how quickly a climate solution physically affects the atmosphere after it is deployed. This is different from speed of deployment, which is the pace at which solutions are adopted.

At Project Drawdown, we define the speed of action for each climate solution as emergency brake, gradual, or delayed.

Mobilize Electric Cars is a GRADUAL climate solution. It has a steady, linear impact on the atmosphere. The cumulative effect over time builds as a straight line.

Caveats

The effectiveness of electric cars in mitigating GHG emissions is critically dependent on the emissions associated with electricity production. In electricity grids dominated by fossil fuels, electric cars have far higher emissions than in jurisdictions with low-emission electricity generation (International Transport Forum [ITF], 2020; Intergovernmental Panel on Climate Change [IPCC], 2022; Milovanoff et al., 2020).

Electric car adoption faces a major obstacle in the form of constraints on battery production. While electric car battery production is being aggressively upscaled (IEA, 2024), building enough batteries to replace a significant fraction of fossil fuel–powered cars is an enormous challenge and will likely slow down a transition to electric cars, even if there is very high consumer demand (Milovanoff et al., 2020). 

Current Adoption

Approximately 28 million electric cars are in use worldwide (IEA, 2024). This corresponds to about 819,000 million pkm traveled by electric car worldwide each year (Table 4). We assume that all of this travel would be undertaken by a fossil fuel–powered car if the car’s occupants did not use an electric car. Adoption is much higher in some countries, such as Norway, where the share of electric cars was 29% in 2023.

To convert the IEA’s electric car estimates into pkm traveled, we needed to determine the average passenger-distance that each passenger car travels per year. Using population-weighted data from several different countries, the average car carries 1.5 people and travels an average of 29,250 pkm/yr. Multiplying this number by the number of electric cars in use gives the total travel distance shift from fossil fuel–powered cars to electric cars.

Table 4. Current (2024) adoption level.

Unit: million pkm/yr

Population-weighted mean 818,900

Implied travel shift from fossil fuel-powered cars to electric cars.

Left Text Column Width
Adoption Trend

Globally, about 104 billion pkm are displaced from fossil fuel–powered cars by electric cars every year (Table 5). The number of new electric cars purchased each year is growing at an average rate of over 10% (Bloomberg New Energy Finance, 2024; IEA, 2024), although purchase rates have declined slightly from record highs between 2020–2022. Global purchases of electric cars are still increasing by around 3.6 million cars/yr. This is based on globally representative data (Bloomberg New Energy Finance, 2024; IEA, 2024).

Despite this impressive rate of growth, electric cars still have a long way to go before they replace a large percentage of the more than 2 billion cars currently driven (WHO, 2024).

Table 5. 2023-2024 adoption trend.

Unit: million pkm/yr

Median, or population-weighted mean 104,000

Implied travel shift from fossil fuel-powered cars to electric cars.

Left Text Column Width
Adoption Ceiling

The adoption ceiling for electric cars is equal to the total passenger-distance driven by the more than 2 billion cars worldwide (WHO, 2024). Using a population-weighted mean of the average distance (in pkm) traveled per car annually, this translates to about 59 trillion pkm (Table 6).

Replacing every single fossil fuel–powered car with an electric car would require an enormous upscaling of electric car production capacity, rapid development of charging infrastructure, cost reductions to increase affordability, and technological improvements to improve suitability for more kinds of drivers and trips. It would also face cultural obstacles from drivers who are attached to fossil fuel–powered cars (Roberts, 2022).

Table 6. Adoption ceiling.

Unit: million pkm/yr

Median, or population-weighted mean 59,140,000

Implied travel shift from fossil fuel-powered cars to electric cars.

Left Text Column Width
Achievable Adoption

The achievable adoption of electric car travel ranges from about 26–47 trillion pkm displaced from fossil fuel–powered cars (Table 7).

Various organizations have produced forecasts for electric car adoption. These are not assessments of feasible adoption per se; they are instead trying to predict likely rates of adoption, given various assumptions about the future (Bloomberg New Energy Finance, 2024; IEA, 2024). However, they are useful in that they take a large number of different variables into account to make their estimates. To convert these estimates of future likely adoption into estimates of the achievable adoption range, we apply some assumptions to the numbers in the scenario projections. 

To find a high rate of electric car adoption, we assume that every country could reach the highest rate of adoption projected to occur for any country. Bloomberg New Energy Finance’s (2024) Economic Transition scenario predicts that Norway will reach an 80% electric vehicle stock share by 2040. We therefore set our high adoption rate at 80% worldwide. This corresponds to 1,617 million total electric cars in use, or 47 trillion pkm traveled by electric car. An important caveat is that with a global supply constraint in the production of electric car batteries, per-country adoption rates are somewhat zero-sum. Every electric car purchased in Norway is one that cannot be purchased elsewhere. Therefore, for the whole world to achieve an 80% electric car stock share, global electric car and battery production would have to increase radically. While this might be possible due to technological improvements or radical increases in investment, it should not be taken for granted.

To identify a lower feasible rate of electric car adoption, we simply take the highest estimate for global electric car adoption. Bloomberg’s Economic Transition scenario predicts 44% global electric car adoption by 2050. This corresponds to 890 million electric cars, or 26 trillion pkm.

Table 7. Range of achievable adoption levels.

Unit: million pkm/yr

Current adoption 818,900
Achievable – low 26020000
Achievable – high 47310000
Adoption ceiling (physical limit) 59140000
Left Text Column Width

Electric cars are currently displacing 0.040 Gt CO₂‑eq of GHG emissions from the transportation system on a 20-yr basis (Table 8), or 0.040 Gt CO₂‑eq on a 100-yr basis. 

If electric cars reach 44% of the global car stock share by 2040, as Bloomberg (2024) projects, without any change in the total number of cars on the road, they will displace 1.263 Gt CO₂‑eq GHG emissions on a 100-yr basis (1.279 Gt CO₂‑eq  on a 20-yr basis).

If electric cars globally reach 80% of car stock share, as Bloomberg projects might happen in Norway by 2040, they will displace 2.296 Gt CO₂‑eq GHG emissions on a 100-yr basis (2.325 Gt CO₂‑eq on a 20-yr basis).

If electric cars replace 100% of the global car fleet, they will displace 2.870 Gt CO₂‑eq  GHG emissions on a 100-yr basis (2.906 Gt CO₂‑eq on a 20-yr basis).

These numbers are based on the present-day average emissions intensity from electrical grids in countries with high rates of electric car adoption. If more clean energy is deployed on electricity grids, the total climate impact from electric cars will increase considerably.

Table 8. Climate impact at different levels of adoption.

Unit: Gt CO₂‑eq/yr, 100-yr basis

Current adoption 0.040
Achievable – low 1.263
Achievable – high 2.296
Adoption ceiling (physical limit) 2.870
Left Text Column Width
Additional Benefits

Health

Since electric cars do not have tailpipe emissions, they can mitigate traffic-related air pollution, which is associated with asthma, lung cancer, increased emergency department visits for respiratory disease, and increased mortality (Anenberg et al., 2019; Guarnieri & Balmes, 2014; Pan et al., 2023; Pennington et al., 2024; Requia et al., 2018; Szyszkowicz et al., 2018). Transitioning to electric cars can reduce exposure to air pollution, improve health, and prevent premature mortality (Garcia et al., 2023; Larson et al., 2021; Peters et al., 2020).

The health benefits of adopting electric cars vary spatially and partly depend upon how communities generate electricity (Choma et al., 2020), but there is evidence that they have improved health. A study in California found a reduction in emergency department visits in zip codes with an increase in zero-emissions cars (Garcia et al., 2023). By 2050, projections estimate that about 64,000–167,000 deaths could be avoided by adopting electric cars (Larson et al., 2021).

In the United States, communities with higher proportions of racial and ethnic minorities tend to be located near highways and major traffic corridors and so are disproportionately exposed to air pollution (Kerr et al., 2021). Transitioning to electric cars could improve health in marginalized urban neighborhoods that are located near highways, industry, or ports (Pennington et al., 2024). These benefits depend upon an equitable distribution of electric cars and infrastructure to support the adoption of electric cars (Garcia et al., 2023). Low-income households may not see the same savings from an electric car due to the cost and stability of electricity prices and distance to essential services (Vega-Perkins et al., 2023)

Income and Work

Adopting electric cars can reduce a household’s energy burden, or the proportion of income spent on residential energy (Vega-Perkins et al., 2023). About 90% of United States households that use a car could see a reduction in energy burden by transitioning to an electric car. Money spent to charge electric cars is more likely to stay closer to the local community where electricity is generated, whereas money spent on fossil fuels often benefits oil-producing regions. This benefits local and national economies by improving their trade balance (Melaina et al., 2016).

Water Quality

Substituting electric car charging points for gas stations can eliminate soil and water pollution from leaking underground gas tanks (Yoder, 2023). 

Air Quality

The adoption of electric cars reduces emissions of air pollutants, including sulfur oxides, sulfur dioxide, and nitrous oxides, and especially carbon monoxide and volatile organic compounds. It has a smaller impact on particulate emissions (Requia et al., 2018). Some air pollution reductions are limited (particularly PM and ozone) due to heavier electric cars and pollution from brakes, tires, and wear on the batteries (Carey, 2023; Jones, 2019).

Risks

Mining minerals necessary to produce electric car batteries carries environmental and social risks. This has been associated with significant harms, particularly in lower-income countries that supply many of these minerals (Agusdinata et al., 2018; Sovacool, 2019).

Electric cars might also pose added safety risks due to their higher weight, which means they have longer stopping distances and can cause more significant damage in collisions and to pedestrians and cyclists (Jones, 2019). This risk includes dual-motor electric cars that incorporate two electric motors – one for the front axle and one for the rear – providing all-wheel drive (AWD) capabilities. The addition of a second motor increases the vehicle's weight and complexity, which can lead to higher energy consumption and reduced overall efficiency. Moreover, the increased manufacturing costs associated with dual-motor systems can result in higher purchase prices for consumers (Nguyen et al., 2023). However, this configuration enhances vehicle performance, offering improved acceleration, traction, and handling, particularly in adverse weather conditions, which are valued by some consumers. 

Interactions with Other Solutions

Reinforcing

Electric car batteries can potentially be used as stationary batteries for use as energy storage to balance electrical grids, either through vehicle-to-grid (V2G) technology or with degraded electric car batteries being installed in stationary battery farms as a form of reuse (Ravi & Aziz, 2022). 

The effectiveness of electric cars in reducing GHG emissions increases as electricity grids become cleaner, since lower-carbon electricity further reduces the emissions associated with car charging. 

Competing

Electric cars compete with heat pumps for electricity. Installing both heat pumps and electric cars could strain the electric grid’s capacity (Fakhrooeian et al., 2024).

Getting travelers onto bicycles, sidewalks, public transit networks, or smaller electric vehicles (such as electric bicycles) provides a greater climate benefit than getting them into electric cars. There is an opportunity cost to deploying electric cars because those resources could otherwise be used to support these more effective solutions (APEC, 2024).

Dashboard

Solution Basics

million passenger kilometers (million pkm)

t CO₂-eq (100-yr)/unit
038.9548.52median
units/yr
Current 818,900 02.602×10⁷4.731×10⁷
Achievable (Low to High)

Climate Impact

Gt CO₂-eq (100-yr)/yr
Current 0.04 1.2632.296
US$ per t CO₂-eq
-1,019
Gradual

CO₂ , CH₄, N₂O

Trade-offs

Electric car batteries are currently quite emissions-intensive to produce, resulting in high embodied emissions. While the embodied emissions are higher for electric cars than fossil fuel–powered cars, the results are mixed when coupling these with operating emissions. Dillman et al.’s (2020) review of the literature on this topic found that producing the average battery-electric car emits 63% more GHG emissions than the average gasoline-powered car, and 77% more GHG emissions than the average diesel-powered car. Taking their lower tailpipe emissions into account, this gives them a GHG payback period of zero to more than 10 years. In some cases, the emissions payback period is longer than the expected lifespan of the electric car, meaning it will have higher life cycle GHG emissions than a comparable gasoline or diesel-powered car. However, the International Transport Forum (ITF, 2020) found that the lifetime emissions from manufacturing, operation, and infrastructure are lower for electric cars. All of these studies relied on assumptions, including the type of car, size of battery, electricity grid, km/yr, and lifetime. 

There is some criticism against any solution that advocates for car ownership, contending that the focus should be on solutions such as Enhance Public Transit that reduce car ownership and usage. Jones (2019) noted “there is little evidence to suggest that EVs can offer the universal solution that global governments are seeking,” and that efforts to popularize electric cars “may be better directed at creating more efficient public transport systems, rather than supporting personal transportation, if the significant health disbenefits of car use during the past 150 years are to be in any way reduced.”

Milovanoff et al. (2020) offered similar criticism: “Closing the mitigation gap solely with EVs would require more than 350 million on-road EVs (90% of the fleet), half of national electricity demand, and excessive amounts of critical materials to be deployed in 2050. Improving [the] average fuel consumption of fossil fuel–powered vehicles, with stringent standards and weight control, would reduce the requirement for alternative technologies, but is unlikely to fully bridge the mitigation gap. There is therefore a need for a wide range of policies that include measures to reduce vehicle ownership and usage.”

Allocating the limited global battery supply to privately owned electric cars might undermine the deployment of other solutions that also require batteries, but are more effective at avoiding GHG emissions (Castelvecchi, 2021). These could include electric buses, electric rail, and electric bicycles.

Mt CO2-eq/yr
0–4
4–8
8–12
12–16
16–20
> 20
No data

Annual road transportation emissions, 2024

Cars are the largest source of vehicle emissions, which are shown here for urban areas.

Kott, T., Foster, K., Villafane-Delgado, M., Loschen, W., Sicurello, P., Ghebreselassie, M., Reilly, E., and Hughes, M. (2024). Transportation sector - Global road emissions. [Data set]. The Johns Hopkins University Applied Physics Laboratory (JHU/APL), Climate TRACE Emissions Inventory. Retrieved March 12, 2025, from Link to source: https://climatetrace.org

Mt CO2-eq/yr
0–4
4–8
8–12
12–16
16–20
> 20
No data

Annual road transportation emissions, 2024

Cars are the largest source of vehicle emissions, which are shown here for urban areas.

Kott, T., Foster, K., Villafane-Delgado, M., Loschen, W., Sicurello, P., Ghebreselassie, M., Reilly, E., and Hughes, M. (2024). Transportation sector - Global road emissions. [Data set]. The Johns Hopkins University Applied Physics Laboratory (JHU/APL), Climate TRACE Emissions Inventory. Retrieved March 12, 2025, from Link to source: https://climatetrace.org

Maps Introduction

Electric cars can effectively mitigate climate change in all geographic regions, although there is spatial variability that influences per-pkm effectiveness and potential solution uptake. Effectiveness heavily depends on the carbon intensity of the charging source, which varies greatly between and within countries. The effectiveness of electric cars decreases for larger vehicles, favored in some countries (Jones, 2019; Nguyen et al., 2023).  

The uptake of electric cars can be significantly influenced by socioeconomic factors, including the relative costs of fuels and electricity, the capacity of civil society to provide adequate charging infrastructure, and the availability of subsidies for electric vehicles.

Extreme temperatures can negatively impact vehicle range, both by slowing battery chemistry and increasing energy demands for regulating passenger compartment temperature, which can adversely affect consumers’ perceptions of electric car suitability in locations with such climates (International Council on Clean Transportation, 2024).

Electric cars are most effective in regions with low-carbon electricity grids (International Transport Forum, 2020; Verma et al., 2022). This includes countries with high hydro power (including Iceland, Norway, Sweden, and parts of Canada such as British Columbia and Quebec), nuclear energy (such as France), and renewables (including Portugal, New Zealand, and parts of the United States, including California and some of the Northwest) (IEA, 2024). Electric car adoption is growing rapidly in a number of regions. For future scaling, targeting countries with supportive policies, renewable energy potential, and growing urban populations will deliver the greatest climate benefits.

Action Word
Mobilize
Solution Title
Electric Cars
Classification
Highly Recommended

Lawmakers and Policymakers

  • Create government procurement policies to transition government fleets to electric cars.
  • Provide financial incentives such as tax breaks, subsidies, or grants for electric car production and purchases that gradually reduce as market adoption increases.
  • Provide complimentary benefits for electric car drivers, such as privileged parking areas, free tolls, and access schemes.
  • Use targeted financial incentives to assist low-income communities in purchasing electric cars and to incentivize manufacturers to produce more affordable options.
  • Develop charging infrastructure, ensuring adequate spacing between stations and equitable distribution of stations.
  • Invest in R&D or implement regulations to improve manufacturing, adoption, supply chain standards, and circularity of electric cars, particularly batteries.
  • Transition fossil fuel electricity production to renewables while promoting the transition to electric cars.
  • Disincentivize fossil fuel–powered car ownership by gradually introducing taxes, penalties, buy-back programs, or other mechanisms.
  • Offer educational resources and one-stop shops for information on electric vehicles, including demonstrations, cost savings, environmental impact, and maintenance.
  • Work with industry and labor leaders to construct new electric car plants and to transition fossil fuel–powered car manufacturing into electric car production.
  • Set regulations for sustainable use of electric car batteries and improve recycling infrastructure.
  • Join international efforts to promote and ensure that environmental and human rights standards are met for supply chains.
  • Incentivize or mandate life-cycle assessments and product labeling (e.g., Environmental Product Declarations).
  • Create, support, or join partnerships that offer information, training, and general support for electric car adoption.

Further information:

Practitioners

  • Produce and sell affordable electric car models.
  • Collaborate with dealers to provide incentives, low-interest financing, or income-based payment options.
  • Develop charging infrastructure, ensuring adequate spacing between stations and equitable distribution of stations.
  • Invest in R&D to improve manufacturing, adoption, supply chain standards, and circularity of electric cars, particularly batteries.
  • Offer educational resources and one-stop shops for information on electric cars, including demonstrations, cost savings, environmental impact, and maintenance.
  • Work with policymakers and labor leaders to construct new electric car plants and to transition fossil fuel–powered car manufacturing into electric car production.
  • Join international efforts to promote and ensure that environmental and human rights standards are met for supply chains.
  • Invest in recycling and circular economy infrastructure.
  • Conduct life-cycle assessments and ensure product labeling (e.g., Environmental Product Declarations).
  • Create, support, or join partnerships that offer information, training, and general support for electric car adoption.

Further information:

Business Leaders

  • Set company procurement policies to transition corporate fleets to electric cars.
  • Take advantage of any financial incentives such as tax breaks, subsidies, or grants for electric car purchases.
  • Create long-term purchasing agreements with electric car manufacturers to support stable demand and improve economies of scale.
  • Install charging stations and offer employee benefits for electric car drivers, such as privileged parking areas.
  • Invest in R&D to improve manufacturing, adoption, supply chain standards, and circularity of electric cars, particularly batteries.
  • Work with industry and labor leaders to transition fossil fuel–powered car manufacturing into electric car production.
  • Advocate for financial incentives and policies that promote electric car adoption.
  • Join international efforts to promote and ensure that environmental and human rights standards are met for supply chains.
  • Educate customers and investors about the company's transition to electric cars and encourage them to learn more about them.
  • Create, support, or join partnerships that offer information, training, and general support for electric car adoption.

Further information:

Nonprofit Leaders

  • Set organizational procurement policies to transition fleets to electric cars.
  • Take advantage of financial incentives such as tax breaks, subsidies, or grants for electric car purchases.
  • Advocate for financial incentives and policies that promote electric car adoption.
  • Install charging stations and offer employee benefits for electric car drivers, such as privileged parking areas.
  • Advocate for or provide improved charging infrastructure.
  • Offer workshops or support to low-income communities for purchasing and owning electric cars.
  • Work with industry and labor leaders to transition fossil fuel–powered car manufacturing into electric car production.
  • Join international efforts to promote and ensure that environmental and human rights standards are met for supply chains.
  • Advocate for regulations on lithium-ion batteries and investments in recycling facilities.
  • Offer educational resources and one-stop shops for information on electric cars, including demonstrations, cost savings, environmental impact, and maintenance.
  • Create, support, or join partnerships that offer information, training, and general support for electric car adoption.

Further information:

Investors

  • Invest in electric car companies.
  • Support portfolio companies in transitioning their corporate fleets.
  • Invest in companies that provide charging equipment or installation.
  • Invest in R&D to improve manufacturing, adoption, supply chain standards, and circularity of electric cars, particularly batteries.
  • Invest in electric car companies, associated supply chains, and end-user businesses like rideshare apps.
  • Join international efforts to promote and ensure that environmental and human rights standards are met for supply chains.
  • Create, support, or join partnerships that offer information, training, and general support for electric car adoption. 

Further information:

Philanthropists and International Aid Agencies

  • Set organizational procurement policies to transition fleets to electric cars.
  • Install charging stations and offer employee benefits for electric car drivers, such as privileged parking areas.
  • Take advantage of any financial incentives such as tax breaks, subsidies, or grants for electric car purchases.
  • Advocate for financial incentives and policies that promote electric car adoption.
  • Advocate for or provide improved charging infrastructure.
  • Offer financial services such as low-interest loans or grants for purchasing electric cars and charging equipment.
  • Offer workshops or support to low-income communities for purchasing and owning electric cars.
  • Work with industry and labor leaders to transition fossil fuel–powered car manufacturing into electric car production.
  • Join international efforts to promote and ensure that environmental and human rights standards are met for supply chains.
  • Advocate for regulations on lithium-ion batteries and investments in recycling facilities.
  • Offer educational resources and one-stop shops for information on electric cars, including demonstrations, cost savings, environmental impact, and maintenance.
  • Create, support, or join partnerships that offer information, training, and general support for electric car adoption.

Further information:

Thought Leaders

  • If purchasing a new car, buy an electric car.
  • Take advantage of financial incentives such as tax breaks, subsidies, or grants for electric car purchases.
  • Share your experiences with electric cars through social media and peer-to-peer networks, highlighting the cost savings, benefits, incentive programs, and troubleshooting tips.
  • Advocate for financial incentives and policies that promote electric car adoption.
  • Advocate for improved charging infrastructure.
  • Help improve the circularity of electric car supply chains through design, advocacy, or implementation.
  • Conduct in-depth life-cycle assessments of electric cars in particular geographies.
  • Research ways to reduce weight and improve the performance of electric cars while appealing to customers.
  • Join international efforts to promote and ensure that environmental and human rights standards are met for supply chains.
  • Create, support, or join partnerships that offer information, training, and general support for electric car adoption.

Further information:

Technologists and Researchers

  • Improve the circularity of supply chains for electric car components.
  • Reduce the amount of critical minerals required for electric car batteries.
  • Innovate low-cost methods to improve safety, labor standards, and supply chains in mining for critical minerals.
  • Research ways to reduce weight and improve the performance of electric cars while appealing to customers.
  • Develop vehicle-grid integration and feasible means of using the electrical capacity of electric cars to manage the broader grid.
  • Improve techniques to repurpose used electric car batteries for stationary energy storage.
  • Develop methods of converting fossil fuel–powered car manufacturing and infrastructure to electric.

Further information:

Communities, Households, and Individuals

  • If purchasing a new car, purchase an electric car.
  • Take advantage of any financial incentives such as tax breaks, subsidies, or grants for electric car purchases.
  • Share your experiences with electric cars through social media and peer-to-peer networks, highlighting the cost-savings, benefits, incentive programs, and troubleshooting tips.
  • Help shift the narrative around electric cars by demonstrating capability and performance.
  • Advocate for financial incentives and policies that promote electric car adoption.
  • Advocate for improved charging infrastructure.
  • Help improve ciricularity of electric car supply chains.
  • Join international efforts to promote and ensure that environmental and human rights standards are met for supply chains.
  • Create, support, or join partnerships that offer information, training, and general support for electric car adoption.

Further information:

“Take Action” Sources

Evidence Base

Consensus of effectiveness in reducing emissions: Mixed

There is a high level of consensus among major organizations and researchers working on climate solutions that electric cars offer a substantial reduction in GHG emissions compared to fossil fuel–powered cars. This advantage is strongest in places where electricity in the grid comes from sources with low GHG emissions, but it persists even if fossil fuels play a major role in energy production. 

Major climate research organizations generally see electric cars as the primary means of reducing GHG emissions from passenger transportation. This perspective has received criticism from some scholars who argue that electric cars have been overstated as a climate solution, pointing to supply constraints, embodied emissions, and emissions from electricity generation (Jones, 2019; Milovanoff et al., 2020). Embodied emissions are outside the scope of this assessment. 

The IPCC (2022) estimated well-to-wheel (upstream and downstream emissions) GHG emissions intensity from gasoline and diesel cars at 139 g CO₂‑eq/pkm and 107 g CO₂‑eq/pkm, respectively. They estimated that electric cars running on low-carbon electricity (solar, wind, and nuclear sourced) emit 9 g CO₂‑eq/pkm; electric cars running on natural gas electricity emit 104 g CO₂‑eq/pkm; and electric cars running entirely on coal electricity emit 187 g CO₂‑eq/pkm. These estimates include upstream emissions, such as those from oil refining and coal mining.

The IEA (2024) noted that “[a] battery electric car sold in 2023 will emit half as much as fossil fuel–powered equivalents over its lifetime. This includes full life-cycle emissions, including those from producing the car.” 

The ITF (2020) estimated that fossil fuel–powered cars emit 162 g CO₂‑eq/pkm, while electric cars emit 125 g CO₂‑eq/pkm. This included embodied and upstream emissions, which are outside the scope of this assessment.

The results presented in this document summarize findings from 15 reviews and meta-analyses and 24 original studies reflecting current evidence from 52 countries, primarily the IEA’s Electric Vehicle Outlook (2024), the Electric Vehicle Database (2024), the International Transportation Forum’s life cycle analysis on sustainable transportation (2020), and the Nickel Institute’s cost estimates on electric cars (Nickel Institute, 2021a, 2021b, 2021c). We recognize this limited geographic scope creates bias, and hope this work inspires research and data sharing on this topic in underrepresented regions.

Updated Date
Coming Soon Label
Coming Soon

Deploy LED Lighting

Sector
Electricity
Image
Image
Office building exterior showing many floors of indoor lit offices
Coming Soon
Off

Key Takeaways

  • Lighting indoor and outdoor spaces globally accounts for about 20% of the electricity used in buildings annually.
  • LEDs have a power rating 3–10 times lower than other lighting options. 
  • Substituting LED lighting for other lighting sources reduces GHG emissions from burning fossil fuels to generate electricity.
  • Deploying LED lighting globally can help avoid CO₂, methane, and nitrous oxide emissions, reducing GHG generation up to 0.65 Gt CO₂‑eq/yr.
  • Deploying LED lighting not only mitigates climate change, it also reduces air pollution and its associated health risks and helps to enhance visual and occupant well-being.


Summary

We define the Deploy LED Lighting solution as replacing energy-inefficient light sources with light-emitting diodes (LEDs). Lighting accounts for 15–20% of electricity use in buildings. Using LEDs reduces the electricity that building lighting consumes, and thereby cuts GHG emissions from global electricity generation.

Description for Social and Search
Using LEDs reduces the electricity that building lighting consumes, and thereby cuts GHG emissions from global electricity generation.
Overview

LED technology for lighting indoor and outdoor spaces is more energy-efficient than other lighting sources currently on the market (Zissis et al., 2021). This is because LEDs are solid-state semiconductors that emit light generated through a direct conversion of the flow of electricity (electroluminescence) rather than heating a tungsten filament to make it glow. More of the electrical energy goes to producing light in an LED lamp than in less-efficient alternative lighting technologies such as incandescent light bulbs or compact fluorescent lamps (CFLs) (Koretsky, 2021; Nair & Dhoble, 2021a). This difference offers significant energy-efficiency gains (see Figure 1).

Globally, lighting-related electricity consumption can account for as much as 20% of the total annual electricity used in buildings (Gayral, 2017; Pompei et al., 2020; Pompei et al., 2022). In 2022, the IEA estimated that total electricity consumption for lighting buildings globally was 1,736 TWh (Lane, 2023). Schleich et al. (2014) and others have argued that buildings consume more electricity for lighting due to a rebound effect when occupants perceive a lighting source as efficient. However, the growing adoption of LED lighting over the years has significantly optimized electricity consumption from building lighting, especially in residential buildings (Lane, 2023).

According to the Intergovernmental Panel on Climate Change (IPCC, 2006), generating electricity from fossil fuels emits CO₂,  methane, and nitrous oxide. Replacing inefficient lamps with LEDs cuts these emissions by reducing electricity demand. LEDs often have a power rating of 4–10 W, which is 3–10 times lower than alternatives. LEDs also last significantly longer: With a lifespan that can exceed 25,000 hours, they vastly outperform incandescent bulbs (1,000 hours) and CFLs (10,000 hours), as shown in Figure 1. LED’s longevity leads to potential long-term savings due to fewer replacements. The amount of light produced per energy input (luminous efficacy) is up to 10 times greater than alternative lighting sources. This means substantially more lighting for less energy.

Figure 1. A comparison of light sources for building lighting (data from Lane, 2023; Mathias et al., 2023; Nair & Dhoble, 2021b; Xu, 2019).

Light source type Power rating (watts) Luminous efficacy (lumens/watt) Lifespan (hours)
Incandescent 40–100 10–15 1,000
CFL 12–20 60–63 10,000
LED 4–10 110–150 25,000–100,000

The International Energy Agency (IEA) and other international bodies report LED market penetration in terms of percentages of the global lighting market (Lane, 2023). We chose this approach to track the impact of adopting LEDs.

Take Action Intro

Would you like to help deploy LED lighting? Below are some ways you can make a difference, depending on the roles you play in your professional or personal life.

These actions are meant to be starting points for involvement and may or may not be the most important, impactful, or doable actions you can take. We encourage you to explore, get creative, and take a step that is right for you!

References

Albatayneh, A., Juaidi, A., Abdallah, R., & Manzano-Agugliaro, F. (2021). Influence of the advancement in the LED lighting technologies on the optimum windows-to-wall ratio of Jordanians residential buildings. Energies, 14(17), 5446. Link to source: https://www.mdpi.com/1996-1073/14/17/5446

Amann, J. T., Fadie, B., Mauer, J., Swaroop, K., & Tolentino, C. (2022). Farewell to fluorescent lighting: How a phaseout can cut mercury pollution, protect the climate, and save money. Link to source: https://www.aceee.org/research-report/b2202

Behar-Cohen, F., Martinsons, C., Viénot, F., Zissis, G., Barlier-Salsi, A., Cesarini, J. P.,Enouf, O., Garcia, M., Picaud, S., & Attia, D.. (2011). Light-emitting diodes (LED) for domestic lighting: Any risks for the eye? Progress in Retinal and Eye Research, 30(4), 239–257. Link to source: https://doi.org/10.1016/j.preteyeres.2011.04.002

Booysen, M. J., Samuels, J. A., & Grobbelaar, S. S. (2021). LED there be light: The impact of replacing lights at schools in South Africa. Energy and Buildings, 235, 110736. Link to source: https://doi.org/10.1016/j.enbuild.2021.110736

Bose-O'Reilly, S., McCarty, K. M., Steckling, N., & Lettmeier, B. (2010). Mercury exposure and children's health. Current Problems in Pediatric and Adolescent Health Care, 40(8), 186–215. Link to source: https://doi.org/10.1016/j.cppeds.2010.07.002

Build Up. (2019). Overview_Decarbonising the non-residential building stock. European Commission. Retrieved 05 March 2025 from Link to source: https://build-up.ec.europa.eu/en/resources-and-tools/articles/overview-decarbonising-non-residential-building-stock

Cenci, M. P., Dal Berto, F. C., Schneider, E. L., & Veit, H. M. (2020). Assessment of LED lamps components and materials for a recycling perspective. Waste Management, 107, 285-293. Link to source: https://doi.org/10.1016/j.wasman.2020.04.028

Environmental Protection Agency (EPA). (2024). Power sector programs - progress report. Link to source: https://www.epa.gov/power-sector/progress-report

Forastiere, S., Piselli, C., Silei, A., Sciurpi, F., Pisello, A. L., Cotana, F., & Balocco, C. (2024). Energy efficiency and sustainability in food retail buildings: Introducing a novel assessment framework. Energies, 17(19), 4882. Link to source: https://www.mdpi.com/1996-1073/17/19/4882

Fu, X., Feng, D., Jiang, X., & Wu, T. (2023). The effect of correlated color temperature and illumination level of LED lighting on visual comfort during sustained attention activities. Sustainability, 15(4), 3826. Link to source: https://www.mdpi.com/2071-1050/15/4/3826

Gao, W., Sun, Z., Wu, Y., Song, J., Tao, T., Chen, F., Zhang, Y., & Cao, H.(2022). Criticality assessment of metal resources for light-emitting diode (LED) production – a case study in China. Cleaner Engineering and Technology, 6, 100380. Link to source: https://doi.org/10.1016/j.clet.2021.100380

Gasparotto, J., & Da Boit Martinello, K. (2021). Coal as an energy source and its impacts on human health. Energy Geoscience, 2(2), 113–120. Link to source: https://doi.org/10.1016/j.engeos.2020.07.003

Gayral, B. (2017). LEDs for lighting: Basic physics and prospects for energy savings. Comptes Rendus Physique, 18(7), 453–461. Link to source: https://doi.org/10.1016/j.crhy.2017.09.001

Hasan, M. M., Moznuzzaman, M., Shaha, A., & Khan, I. (2025). Enhancing energy efficiency in Bangladesh's readymade garment sector: The untapped potential of LED lighting retrofits. International Journal of Energy Sector Management, 19(3), 569–588. Link to source: https://doi.org/10.1108/ijesm-05-2024-0009

Henneman, L., Choirat, C., Dedoussi, I., Dominici, F., Roberts, J., & Zigler, C. (2023). Mortality risk from United States coal electricity generation. 382(6673), 941–946. Link to source: https://doi.org/doi:10.1126/science.adf4915

Intergovernmental Panel on Climate Change (IPCC). (2006). 2006 IPCC guidelines for national greenhouse gas inventories volume 2: Energy; Chapter 2: Stationary combustion. Link to source: https://www.ipcc-nggip.iges.or.jp/public/2006gl/pdf/2_Volume2/V2_2_Ch2_Stationary_Combustion.pdf

International Energy Agency (IEA). (2022). Targeting 100% LED lighting sales by 2025. Link to source: https://www.iea.org/reports/targeting-100-led-lighting-sales-by-2025

International Energy Agency (IEA). (2023). Global floor area and buildings energy intensity in the net zero scenario, 2010-2030. Retrieved 06 March 2025 from Link to source: https://www.iea.org/data-and-statistics/charts/global-floor-area-and-buildings-energy-intensity-in-the-net-zero-scenario-2010-2030

International Energy Agency (IEA). (2024). World energy balances. IEA. Link to source: https://www.iea.org/data-and-statistics/data-product/world-energy-balances

Iskra-Golec, I., Wazna, A., & Smith, L. (2012). Effects of blue-enriched light on the daily course of mood, sleepiness and light perception: A field experiment. 44(4), 506-513. Link to source: https://doi.org/10.1177/1477153512447528

Kamat, A. S., Khosla, R., & Narayanamurti, V. (2020). Illuminating homes with LEDs in India: Rapid market creation towards low-carbon technology transition in a developing country. Energy Research & Social Science, 66, 101488. Link to source: https://doi.org/10.1016/j.erss.2020.101488

Khan, N., & Abas, N. (2011). Comparative study of energy saving light sources. Renewable and Sustainable Energy Reviews, 15(1), 296–309. Link to source: https://doi.org/10.1016/j.rser.2010.07.072

Koretsky, Z. (2021). Phasing out an embedded technology: Insights from banning the incandescent light bulb in europe. Energy Research & Social Science, 82, 102310. Link to source: https://doi.org/10.1016/j.erss.2021.102310

Lane, K. (2023, 11 July 2023). Lighting. International Energy Agency (IEA). Retrieved 13 December 2024 from Link to source: https://www.iea.org/energy-system/buildings/lighting

Lee, K., Donnelly, S., & Phillips, G. (2024). 2020 U.S. Lighting market characterization. Link to source: https://www.osti.gov/biblio/2371534

Lee, K., Nubbe, V., Rego, B., Hansen, M., & Pattison, M. (2021). 2020 LED manufacturing supply chain. U. S. DOE. Link to source: https://www.energy.gov/sites/default/files/2021-05/ssl-2020-led-mfg-supply-chain-mar21.pdf

Mathias, J. A., Juenger, K. M., & Horton, J. J. (2023). Advances in the energy efficiency of residential appliances in the US: A review. Energy Efficiency, 16(5), 34. Link to source: https://doi.org/10.1007/s12053-023-10114-8

Miah, M. A. R., & Kabir, R. (2023). Energy savings forecast for solid-state lighting in residential and commercial buildings in Bangladesh. IEEE PES 15th Asia-Pacific Power and Energy Engineering Conference (APPEEC), pp. 1-6. Link to source: https://doi.org/10.1109/APPEEC57400.2023.10561921

Moadab, N. H., Olsson, T., Fischl, G., & Aries, M. (2021). Smart versus conventional lighting in apartments - electric lighting energy consumption simulation for three different households. Energy and Buildings, 244, 111009. Link to source: https://doi.org/10.1016/j.enbuild.2021.111009

Moyano, D. B., Moyano, S. B., López, M. G., Aznal, A. S., & Lezcano, R. A. G. (2020). Nominal risk analysis of the blue light from LED luminaires in indoor lighting design. Optik, 223, 165599. Link to source: https://doi.org/10.1016/j.ijleo.2020.165599

Nair, G. B., & Dhoble, S. J. (2021a). 2 - fundamentals of LEDs. In G. B. Nair & S. J. Dhoble (Eds.), The fundamentals and applications of light-emitting diodes (pp. 35–57). Woodhead Publishing. Link to source: https://doi.org/10.1016/B978-0-12-819605-2.00002-1

Nair, G. B., & Dhoble, S. J. (2021b). 6 - general lighting. In G. B. Nair & S. J. Dhoble (Eds.), The fundamentals and applications of light-emitting diodes (pp. 155–176). Woodhead Publishing. Link to source: https://doi.org/10.1016/B978-0-12-819605-2.00006-9

Pattison, M., Hansen, M., Bardsley, N., Elliott, C., Lee, K., Pattison, L., & Tsao, J. (2020). 2019 lighting R&D opportunities. Link to source: https://www.osti.gov/biblio/1618035

Periyannan, E., Ramachandra, T., & Geekiyanage, D. (2023). Assessment of costs and benefits of green retrofit technologies: Case study of hotel buildings in Sri Lanka. Journal of Building Engineering, 78, 107631. Link to source: https://doi.org/10.1016/j.jobe.2023.107631

Placek, M. (2023). LED lighting in the United States - statistics & facts. Statista. Retrieved 09 February 2025 from Link to source: https://www.statista.com/topics/1144/led-lighting-in-the-us/#topicOverview

Pompei, L., Blaso, L., Fumagalli, S., & Bisegna, F. (2022). The impact of key parameters on the energy requirements for artificial lighting in Italian buildings based on standard en 15193-1:2017. Energy and Buildings, 263, 112025. Link to source: https://doi.org/10.1016/j.enbuild.2022.112025

Pompei, L., Mattoni, B., Bisegna, F., Blaso, L., & Fumagalli, S. (2020, 9–12 June 2020). Evaluation of the energy consumption of an educational building, based on the uni en 15193–1:2017, varying different lighting control systems. 2020 IEEE International Conference on Environment and Electrical Engineering and 2020 IEEE Industrial and Commercial Power Systems Europe (EEEIC / I&CPS Europe), Madrid, Spain, 2020, pp. 1-6. Link to source: https://doi.org/10.1109/EEEIC/ICPSEurope49358.2020.9160588

Sarigiannis, D. A., Karakitsios, S. P., Antonakopoulou, M. P., & Gotti, A. (2012). Exposure analysis of accidental release of mercury from compact fluorescent lamps (CFLs). Science of The Total Environment, 435–436, 306–315. Link to source: https://doi.org/10.1016/j.scitotenv.2012.07.026

Saunders, H. D., & Tsao, J. Y. (2012). Rebound effects for lighting. Energy Policy, 49, 477-478. Link to source: https://doi.org/10.1016/j.enpol.2012.06.050

Schleich, J., Mills, B., & Dütschke, E. (2014). A brighter future? Quantifying the rebound effect in energy efficient lighting. Energy Policy, 72, 35–42. Link to source: https://doi.org/10.1016/j.enpol.2014.04.028

Schratz, M., Gupta, C., Struhs, T. J., & Gray, K. (2016). A new way to see the light: Improving light quality with cost-effective led technology. IEEE Industry Applications Magazine, 22(4), 55–62. Link to source: https://doi.org/10.1109/MIAS.2015.2459089

United Nations Industrial Development Organization (UNIDO). (2021). SADC member states welcome the introduction of new efficient lighting standards. UNIDO. Retrieved 05 March 2025 from Link to source: https://www.unido.org/news/sadc-member-states-welcome-introduction-new-efficient-lighting-standards

U.S. Department of Energy. (2016). Solid-state lighting R&D plan. Link to source: https://www.energy.gov/sites/prod/files/2016/06/f32/ssl_rd-plan_%20jun2016_2.pdf

U.S. Department of Energy (2024). 2020 U.S. lighting market characterization. Link to source: https://www.energy.gov/sites/default/files/2024-08/ssl-lmc2020_apr24.pdf

World Furniture Online (2017). The lighting fixtures market in Australia and New Zealand. Link to source: https://www.worldfurnitureonline.com/report/the-lighting-fixtures-market-in-australia-and-new-zealand/

Xiong, Y., Guo, H., Nor, D. D. M. M., Song, A., & Dai, L. (2023). Mineral resources depletion, environmental degradation, and exploitation of natural resources: Covid-19 aftereffects. Resources Policy, 85, 103907. Link to source: https://doi.org/10.1016/j.resourpol.2023.103907

Xu, Y. (2019). Chapter 2.1 - nature and source of light for plant factory. In M. Anpo, H. Fukuda, & T. Wada (Eds.), Plant factory using artificial light (pp. 47–69). Elsevier. Link to source: https://doi.org/10.1016/B978-0-12-813973-8.00002-6

Zhang, H., Cai, J., & Braun, J. E. (2023). A whole building life-cycle assessment methodology and its application for carbon footprint analysis of U.S. commercial buildings. Journal of Building Performance Simulation, 16(1), 38–56. Link to source: https://doi.org/10.1080/19401493.2022.2107071

Zissis, G., Bertoldi, P., & Serrenho, T. (2021). Update on the status of LED-lighting world market since 2018. Publications Office of the European Union. Link to source: https://publications.jrc.ec.europa.eu/repository/handle/JRC122760

Credits

Lead Fellow

  • Henry Igugu, Ph.D.

Contributors

  • Ruthie Burrows, Ph.D.

  • James Gerber, Ph.D.

  • Daniel Jasper

  • Alex Sweeney

Internal Reviewers

  • Aiyana Bodi

  • Hannah Henkin

  • Megan Matthews, Ph.D.

  • Ted Otte

  • Amanda D. Smith, Ph.D.

  • Christina Swanson, Ph.D.

Effectiveness

Replacing 1% of the building lighting market with LED lamps avoids approximately 7.09 Mt CO₂‑eq/yr emissions on a 100-yr basis (Table 1) or 7.15 Mt CO₂‑eq/yr on a 20-yr basis.

We estimated this solution’s effectiveness (Table 1) by multiplying the global electricity savings intensity (kWh/%) by an emissions intensity for each GHG emitted (in g/kWh)  due to electricity generation. Using the IEA (2024)’s energy balances data, we estimated emissions intensities of approximately 529 g/kWh for CO₂, 0.07 g/kWh for methane, and 0.01 g/kWh for nitrous oxide. Country-specific data were limited. Therefore, we developed the savings intensity using the IEA’s adoption trend (%/yr) and electricity consumption reduction (kWh/yr) for residential buildings globally (Lane, 2023). We then scaled up the savings intensity to represent all buildings (since LEDs are applicable in all types of buildings), but we could not find global data specifying the energy savings potential of converting the lighting market in nonresidential buildings to LEDs. Notably, artificial lighting’s energy consumption varies across building types (Moadab et al., 2021) and is typically greater in nonresidential buildings (Build Up, 2019). This presents some level of uncertainty, but also suggests that our estimates could be conservative – and that there is potential for even greater savings in nonresidential buildings.

Table 1. Effectiveness at reducing emissions.

Unit: t CO₂‑eq/% lamps LED/yr, 100-yr basis

Estimate 7090000
Left Text Column Width
Cost

Our lifetime initial cost estimate of switching 1% of the global building lighting market to LEDs is approximately US$1.5 billion. Because LEDs use less electricity than alternative lamps, they cost less to operate, resulting in operating costs of –US$1.3 billion/yr (i.e., cost savings). Building owners typically are not paid to use LED lighting; therefore, the revenue is zero. After we amortize the initial cost over 30 years, the net annual cost for this solution is –US$1.2 billion/yr globally. Thus, replacing other bulbs with LEDs saves money despite the initial cost.

We estimated the cost (Table 2) by first identifying initial and operating costs from studies that retrofitted buildings with LEDs, such as Periyannan et al. (2023), Hasan et al. (2025), and Forastiere et al. (2024). We then divided the costs by the impact of the LED retrofit on the amount of electricity consumed by lighting in each study and multiplied this by the global electricity savings intensity (kWh/%) we estimated during the effectiveness analysis. The result was the cost per percent of lamps in buildings converted to LED lighting (US$/% lamps LED).

We estimated the cost per unit climate impact by dividing the annual cost savings per adoption unit by the CO₂‑eq emissions reduced yearly per adoption unit (Table 2).

Table 2. Cost per unit climate impact.

Unit: 2023 US$/t CO₂‑eq, 100-yr basis

Median -175.0

Negative values reflect cost savings.

Left Text Column Width

Methods and Supporting Data

Learning Curve

As LEDs became more common in building lighting, costs dropped significantly in recent years.

Trends based on LED adoption data (Lane, 2023) and the cost of LED lighting (Pattison et al., 2020) showed a 29.7% drop in cost as LED adoption doubled between 2016 and 2019.

The cost data we used to identify the learning curve for this solution (Table 3) are specific to the United States and limited to pre-2020. More recent LED cost data may show additional benefits with respect to cost, but this value may not be applicable for other countries. However, the cost data we analyzed do provide a useful sample of the broader LED cost-reduction trend.

Table 3. Learning rate: drop in cost per doubling of the installed solution base

Units: %

Estimate 29.7
Left Text Column Width
Speed of Action

Speed of action refers to how quickly a climate solution physically affects the atmosphere after it is deployed. This is different from speed of deployment, which is the pace at which solutions are adopted.

At Project Drawdown, we define the speed of action for each climate solution as emergency brake, gradual, or delayed.

Deploy LED Lighting is a GRADUAL climate solution. It has a steady, linear impact on the atmosphere. The cumulative effect over time builds as a straight line.

Caveats

Our effectiveness analysis is based on the current state of LED technology. If the adoption ceiling is attained, further improvements to the amount of light that LEDs generate per unit electricity could enhance the solution’s impact through further reductions in electricity use.

The rebound effect – where building occupants use more lighting in response to increased energy-efficiency of lamps – is a well-established concern (Saunders and Tsao, 2012; Schleich et al., 2014). We attempted to address this concern by using IEA data on actual electricity consumption originating from building lighting to determine both its effectiveness and cost implications (Lane, 2023).

We did not fully account for the cost savings that potentially arise from fewer bulb replacements, since LEDs may replace various types of lamps. Because LEDs last significantly longer than all alternative lamp technologies, building owners may require fewer replacements when using LED lamps compared with other lighting sources.

Current Adoption

Lane (2023) found that LED lamps represented 50.5% of the lighting market globally for residential buildings in 2022, but does not provide adoption data specific to nonresidential buildings. Studies that provide global or geographically segmented LED adoption data for all building types are also limited. Therefore, we assume 50.5% to be representative of LED adoption across all buildings globally (Table 4).

Other studies highlight adoption levels across various countries. The data captured in these studies and reports provide context with specific adoption levels from different regions (see Geographic Guidance).

The IEA and U.S. Department of Energy (DOE) report that LEDs are increasingly the preferred choice of homeowners and the general building lighting market. This preference is evident in the growing market share of LED lamps sold and installed annually (Lane, 2023; Lee et al., 2024).

In general, the solution’s current adoption globally is substantial, and we recognize that some countries possess more room for the solution to scale. While adoption barriers vary across regions, many countries are establishing lighting standards to drive LED adoption, especially across Africa [(IEA, 2022; United Nations Industrial Development Organization (UNIDO), 2021].

Table 4. Current (2022) adoption level.

Units: % lamps LED

Estimate 50.5
Left Text Column Width
Adoption Trend

Adoption of LEDs has grown approximately 3.75%/yr over the past two decades.

Lane (2023) found that the proportion of lamps sold annually for building lighting that are LEDs grew from 1.1% in 2010 to 50.5% in 2022 (Figure 2). We estimated the adoption trend (Table 5) by determining the percentage growth between successive years, and calculating the variances.

Figure 2. Trend in LED adoption between 2010 and 2022 (adapted from Lane, 2023).

Source: Lane, K. (2023, 11 July 2023). Lighting. International Energy Agency (IEA). Retrieved 13 December 2024 from https://www.iea.org/energy-system/buildings/lighting

Enable Download
On

Data on the growth of LEDs across regional building lighting markets are limited. Lee et al. (2024)’s analysis of the U.S. lighting market found 46.5% growth 2010–2020, which translates to 4.65% annually. Zissis et al. (2021) reported 26% growth for France for 2017–2020, which averages 8.67% annually.

Table 5. 2010–2022 adoption trend.

Units: % lamps LED market share growth/yr

25th percentile 2.85
Mean 4.12
Median (50th percentile) 3.75
75th percentile 5.4
Left Text Column Width
Adoption Ceiling

The adoption ceiling (Table 6) is 100%, meaning all lamps in buildings are LEDs. Lane (2023) projects 100% LED market penetration by 2030. If current adoption trends continue, 100% LED adoption is a practical and achievable upper limit. However, countries will need to overcome challenges such as regulatory enforcement, financial, and technology access issues, while preventing the entrance of inferior quality LEDs into their lighting market (IEA, 2022).

Table 6. Adoption ceiling

Units: % lamps LED

Estimate 100
Left Text Column Width
Achievable Adoption

We estimate a low achievable adoption scenario of 87% based on Statista’s projections about LED lighting market penetration by 2030 (Placek, 2023). The values were similar in Zissis et al. (2021).

For the high achievable scenario, we projected 10 years beyond the 2022 adoption level using the mean adoption trend of 4.12%/yr. This translates to a 41% growth on top of the current adoption level of 50.5%, summing up to a 92% LED adoption level (Table 7).

Table 7. Range of achievable adoption levels.

Unit: % lamps LED

Current adoption 50.5
Achievable – low 87
Achievable – high 92
Adoption ceiling 100
Left Text Column Width

We estimated that current adoption cuts about 0.36 Gt CO₂‑eq emissions on a 100-yr basis compared with the previous alternative lighting sources (Table 8). The low achievable adoption scenario of 87% LED lamps could cut emissions 0.62 Gt CO₂‑eq/yr due to reduced electricity consumption, while a high achievable adoption scenario of 92% LED lamps could cut emissions 0.65 Gt CO₂‑eq/yr. If the adoption ceiling of 100% LEDs for lighting buildings is reached, we estimate that 0.71 Gt CO₂‑eq/yr could be avoided (Table 8).

LED lighting could further cut electricity consumption as LED technology continues to improve. However, the technology’s future climate impacts will depend on the emissions of future electricity-generation systems.

Table 8. Climate impact at different levels of adoption.

Unit: Gt CO₂‑eq/yr, 100-yr basis

Current adoption 0.36
Achievable – low 0.62
Achievable – high 0.65
Adoption ceiling 0.71
Left Text Column Width
Additional Benefits

Income and Work

Because LEDs use less electricity than fluorescent and incandescent light bulbs (Khan & Abas, 2011), households and businesses using LED technology can save money on electricity costs. The payback period for the initial investment from lower utility bills is about one year for residential buildings and about two months for commercial buildings (Amann et al., 2022). LED lighting can contribute to savings by minimizing energy demand for cooling, since LEDs emit less heat than fluorescent and incandescent bulbs (Albatayneh et al., 2021; Schratz et al., 2016). However, it could also lead to a greater need for space heating in some regions. LED lights also last longer than alternative lighting technologies, which can lead to lower maintenance costs (Schratz et al., 2016).

Health

Reductions in air pollution due to LED lighting’s lower electricity demand decrease exposures to pollutants such as mercury and fine particulate matter generated from fossil fuel-based power plants, improving the health of nearby communities [Environmental Protection Agency (EPA), 2024]. These pollutants have been linked to increased morbidity from cardiovascular and respiratory disease, asthma, infections, and cancer, and to increased risk of mortality (Gasparotto & Martinello, 2021; Henneman et al., 2023). Because LEDs do not contain mercury, they can mitigate small health risks associated with mercury exposure when fluorescent light bulbs break (Bose-O’Reilly et al., 2010; Sarigiannis et al., 2012). Switching to LEDs can also enhance a visual environment and improve occupants’ well-being, visual comfort, and overall productivity when lamps with the appropriate lighting quality and correlated color temperature are selected (Fu et al., 2023; Iskra-Golec et al., 2012; Nair & Dhoble, 2021b).

Air and Water Quality

The lower electricity demand of LEDs could help reduce emissions from power plants and improve air quality (Amann et al., 2022). Additionally, LEDs can mitigate small amounts of mercury found in fluorescent lights (Amann et al., 2022). Mercury contamination from discarded bulbs in landfills can leach into surrounding water bodies and accumulate in aquatic life. LEDs also have longer lifespans than fluorescent and incandescent bulbs (Nair & Dhoble, 2021b) which can reduce the amount of discarded bulbs and further mitigate environmental degradation from landfills. 

Risks

We found limited data indicating risks with choosing LEDs over other lighting sources. Concerns about eye health raised in the early days of LED adoption (Behar-Cohen et al., 2011) have been allayed by studies that found that LEDs do not pose a greater risk to the eye than comparable lighting sources (Moyano et al., 2020). 

LED manufacturing uses metals like gold, indium, and gallium (Gao et al., 2022). This creates environmental risks due to mining (Xiong et al., 2023) and makes LED supply chains susceptible to macroeconomic uncertainties (Lee et al., 2021). With growing adoption of LED lights, there is also the risk of greater electronic waste at the end of the LED’s lifespan. Therefore, recycling is increasingly important (Cenci et al., 2020). 

Interactions with Other Solutions

Competing

Some studies demonstrate an increase in the indoor heating requirements when switching to LED lighting from other lighting sources, such as incandescent lamps, that produce more heat than LEDs. The difference is often small, but worth taking into account when adopting LEDs in a building with previously energy-inefficient lighting.

Dashboard

Solution Basics

% lamps LED

t CO₂-eq (100-yr)/unit/yr
7.09×10⁶
units
Current 50.5 08792
Achievable (Low to High)

Climate Impact

Gt CO₂-eq (100-yr)/yr
Current 0.36 0.620.65
US$ per t CO₂-eq
-175
Gradual

CO₂ , CH₄, N₂O

Trade-offs

LED lamp manufacturing creates more emissions than manufacturing other types of lamps. For example, Zhang et al. (2023) compared the manufacturing emissions of a 12.5W LED lamp with a 14W CFL and a 60W incandescent bulb. These light sources provided similar levels of illumination (850–900 lumens). The production of one LED bulb resulted in 9.81 kg CO₂‑eq emissions, while the CFL and incandescent resulted in 2.29 and 0.73 kg CO₂‑eq emissions, respectively. However, LEDs are preferred because their longevity results in fewer LED lamps required to provide the same amount of lighting over time. LEDs can last 25 times longer than incandescent lamps with an identical lumen output (Nair & Dhoble, 2021b; Xu, 2019; Zhang et al., 2023). 

% lamps LED
< 20
20–40
40–60
> 60
No data

Percentage of lamps that are LEDs, circa 2020

The percentage of lamps used to light buildings that are LEDs varies around the world, with limited data available on a per-country basis.

Miah, M. A. R., & Kabir, R. (2023). Energy savings forecast for solid-state lighting in residential and commercial buildings in Bangladesh. IEEE PES 15th Asia-Pacific Power and Energy Engineering Conference (APPEEC), pp. 1-6, Link to source: https://doi.org/10.1109/APPEEC57400.2023.10561921

U.S. Department of Energy (2024). 2020 U.S. lighting market characterization. Link to source: https://www.energy.gov/sites/default/files/2024-08/ssl-lmc2020_apr24.pdf

World Furniture Online (2017). The lighting fixtures market in Australia and New Zealand. Link to source: https://www.worldfurnitureonline.com/report/the-lighting-fixtures-market-in-australia-and-new-zealand/

Zissis, G., Bertoldi, P., & Serrenho, T. (2021). Update on the status of LED-lighting world market since 2018. Publications Office of the European Union. Link to source: https://publications.jrc.ec.europa.eu/repository/handle/JRC122760

% lamps LED
< 20
20–40
40–60
> 60
No data

Percentage of lamps that are LEDs, circa 2020

The percentage of lamps used to light buildings that are LEDs varies around the world, with limited data available on a per-country basis.

Miah, M. A. R., & Kabir, R. (2023). Energy savings forecast for solid-state lighting in residential and commercial buildings in Bangladesh. IEEE PES 15th Asia-Pacific Power and Energy Engineering Conference (APPEEC), pp. 1-6, Link to source: https://doi.org/10.1109/APPEEC57400.2023.10561921

U.S. Department of Energy (2024). 2020 U.S. lighting market characterization. Link to source: https://www.energy.gov/sites/default/files/2024-08/ssl-lmc2020_apr24.pdf

World Furniture Online (2017). The lighting fixtures market in Australia and New Zealand. Link to source: https://www.worldfurnitureonline.com/report/the-lighting-fixtures-market-in-australia-and-new-zealand/

Zissis, G., Bertoldi, P., & Serrenho, T. (2021). Update on the status of LED-lighting world market since 2018. Publications Office of the European Union. Link to source: https://publications.jrc.ec.europa.eu/repository/handle/JRC122760

Maps Introduction

The Deploy LED Lighting solution can be equally effective at reducing electricity use across global regions because the efficiency gained by replacing other bulbs with LEDs is functionally identical. However, its climate impact will vary with the emissions intensity of each region’s electricity grid. Secondary considerations associated with uptake of LED lighting also can vary with climate and hence geography. In particular, the decrease in heating associated with LED lighting can reduce demands on air conditioning, leading to increased incentive for solution uptake in warmer climates.

Historically, a few countries typically account for the bulk of LEDs purchased. For example, 30% of the 5 billion LEDs sold globally in 2016 were sold in China. In the same period, North America accounted for 15% while Western Europe, Japan, and India represented 11%, 10%, and 8% of the LEDs sold, respectively (Kamat et al., 2020; U.S. DOE, 2016). Essentially, the growing sales of LEDs drove global adoption levels from 17.6% of the building lighting market in 2016 to 50.5% in 2022 (Lane, 2023). However, current adoption still varies considerably around the world. For instance, Lee et al. (2024) reported that LED market penetration in the U.S. was 47.5% in 2020, compared with 43.3% globally in the same period (Lane, 2023). Meanwhile, LED adoption in France was 35% in 2017, and countries in the Middle East such as the United Arab Emirates, Saudi Arabia, and Turkey had over 70% LED adoption that same year; residential buildings in the United Kingdom had 13% LED adoption in 2018, while Japan had 60% LED adoption as of 2019 (Zissis et al., 2021). This demonstrates potential to scale LED adoption in the future, especially in low- and middle-income countries where the bulk of new building occurs (IEA, 2023).

Action Word
Deploy
Solution Title
LED Lighting
Classification
Highly Recommended

Lawmakers and Policymakers

  • Use regulations to phase out and replace energy-inefficient lighting sources with LEDs.
  • Set regulations that encourage sufficient lighting to limit the overuse of LEDs (or rebound effects).
  • Require that public lighting use LEDs.
  • Use financial incentives such as tax breaks, subsidies, and grants to facilitate the transition to LEDs.
  • Revise building energy-efficiency standards to reflect energy savings of LEDs.
  • Develop production standards and mandate labeling for LEDs.
  • Build sufficient inspection capacity for LED manufacturers and penalize noncompliance with standards.
  • Use energy-efficiency purchase agreements to help support utility companies during the transition to LED lighting.
  • Invest in research and development that improves the cost and efficiency of LED lighting.
  • Develop a certification program for LED lighting.
  • Create exchange programs or buy-back programs for inefficient light bulbs.
  • Start demonstration projects to promote LED lighting.
  • Join, support, or create educational programs that raise public awareness about the cost savings and energy-efficiency gains associated with LEDs.

Further information:

Practitioners

  • Take advantage of or advocate for financial incentives such as tax breaks, subsidies, and grants to facilitate the production of LED lighting.
  • Help develop circular supply chains in renovating, remanufacturing, reusing, and redistributing materials.
  • Invest in research and development to improve efficiency and cost of LEDs.
  • Adhere to, or advocate for, national LED standards.
  • Develop, produce, and sell LED lighting that imitates incandescent or other familiar lighting.
  • Consider bundling services with retrofitting companies and collaborating with utility companies to offer rebates or other incentives.
  • Improve self-service of LEDs by reducing obstacles to installation and ensuring LEDs can be easily replaced.
  • Help create positive perceptions of LED lighting by showcasing usage, cost savings, and emissions reductions.
  • Create feedback mechanisms, such as apps that alert users to real-time benefits such as energy and cost savings.
  • Start demonstration projects to promote LED lighting.
  • Join, support, or create educational programs that raise public awareness about the cost savings and energy-efficiency gains associated with LEDs.

Further information:

Business Leaders

  • Retrofit existing operations for LEDs, replace inefficient bulbs, and purchase only LEDs going forward.
  • Help develop circular supply chains in renovating, remanufacturing, reusing, and redistributing LED lighting materials.
  • Take advantage of financial incentives such as tax breaks, subsidies, and grants to facilitate the transition to LED lighting.
  • Invest in research and development that improves the cost and efficiency of LED lighting.
  • Join, support, or create educational programs that raise public awareness about the cost savings and energy-efficiency gains associated with LEDs.

Further information:

Nonprofit Leaders

  • Retrofit existing operations for LEDs, replace inefficient bulbs, and purchase only LEDs going forward.
  • Help develop circular supply chains in renovating, remanufacturing, reusing, and redistributing LED lighting materials.
  • Take advantage of, or advocate for, financial incentives such as tax breaks, subsidies, and grants to facilitate the transition to LED lighting.
  • Advocate for regulations to phase out and replace energy-inefficient lighting sources with LEDs.
  • Advocate for production standards and labeling for LEDs.
  • Call for regulations that encourage sufficient lighting to limit the overuse of LEDs (or rebound effects).
  • Start demonstration projects to promote LED lighting.
  • Help develop, support, or administer a certification program for LED lighting.
  • Create national catalogs of LED manufacturers, suppliers, and retailers.
  • Join, support, or create educational programs that raise public awareness about the cost savings and energy-efficiency gains associated with LEDs.

Further information:

Investors

  • Retrofit existing operations for LEDs, replace inefficient bulbs, and purchase only LEDs going forward.
  • Take advantage of financial incentives such as tax breaks, subsidies, and grants to facilitate the transition to LED lighting.
  • Invest in LED manufacturers, supply chains, and supportive industries.
  • Support research and development to improve the efficiency and cost of LEDs.
  • Invest in LED companies.
  • Fund companies that provide retrofitting services (energy service companies).
  • Invest in businesses dedicated to advancing LED use.
  • Ensure portfolio companies do not produce or support non-LED lighting supply chains.
  • Join, support, or create educational programs that raise public awareness about the cost savings and energy-efficiency gains associated with LEDs.

Further information:

Philanthropists and International Aid Agencies

  • Retrofit existing operations for LEDs, replace inefficient bulbs, and purchase only LEDs going forward.
  • Take advantage of financial incentives such as tax breaks, subsidies, and grants to facilitate the transition to LED lighting.
  • Provide financing such as low-interest loans, grants, and micro-grants to help accelerate LED adoption.
  • Fund companies that provide retrofitting services (energy service companies).
  • Advocate for regulations to phase out energy-inefficient lighting sources and replace them with LEDs.
  • Call for regulations that encourage sufficient lighting to limit the overuse of LEDs (or rebound effects).
  • Start demonstration projects to promote LED lighting.
  • Help develop, support, or administer a certification program for LED lighting.
  • Create national catalogs of LED manufacturers, suppliers, and retailers.
  • Join, support, or create educational programs that raise public awareness about the cost savings and energy-efficiency gains associated with LEDs.

Further information:

Thought Leaders

  • Retrofit buildings for LED lighting, replace inefficient bulbs, and purchase only LEDs going forward.
  • Help create positive perceptions of LED lighting by highlighting your personal usage, cost and energy savings, and emissions reductions.
  • Help develop circular supply chains in renovating, remanufacturing, reusing, and redistributing materials.
  • Take advantage of, or advocate for, financial incentives such as tax breaks, subsidies, and grants to facilitate the transition to LED lighting.
  • Advocate for regulations to phase out energy-inefficient lighting sources and replace them with LEDs.
  • Advocate for LED standards.
  • Advocate for regulations that encourage sufficient lighting and guard against overuse of LEDs (or rebound effects).
  • Start demonstration projects to promote LED lighting.
  • Help develop, support, or administer a certification program for LED lighting.
  • Create national catalogs of LED manufacturers, suppliers, and retailers.
  • Join, support, or create educational programs that raise public awareness about the cost savings and energy-efficiency gains associated with LEDs.

Further information:

Technologists and Researchers

  • Develop circular supply chains in renovating, remanufacturing, reusing, and redistributing materials.
  • Improve the efficiency and cost of LEDs.
  • Improve LED lighting to imitate familiar lighting, offer customers settings, and augment color rendering.
  • Improve self-service of LEDs by reducing obstacles to installation and ensuring LEDs can be replaced individually.
  • Help develop standards for LEDs.
  • Create feedback mechanisms, such as apps that alert users to real-time benefits such as energy and cost savings.

Further information:

Communities, Households, and Individuals

  • Retrofit for LEDs, replace inefficient bulbs, and purchase only LEDs going forward.
  • Help create positive perceptions of LED lighting by highlighting your personal usage, cost and energy savings, and emissions reductions.
  • Help develop circular supply chains in renovating, remanufacturing, reusing, and redistributing materials.
  • Take advantage of or advocate for financial incentives such as tax breaks, subsidies, and grants to facilitate the transition to LED lighting.
  • Advocate for regulations to phase out and replace energy-inefficient lighting sources with LEDs.
  • Advocate for LED standards.
  • Advocate for regulations that encourage sufficient lighting to limit the overuse of LEDs (or rebound effects).
  • Join, support, or create educational programs that raise public awareness about the cost savings and energy-efficiency gains associated with LEDs.

Further information:

Evidence Base

Consensus of effectiveness in reducing GHG emissions from electricity generation: High

Using LEDs significantly minimizes the electricity required to light buildings, thereby reducing GHG emissions from electricity generation. Many countries are phasing out other lighting sources to reduce GHG emissions (Lane, 2023).

The IEA reported that global adoption of LEDs drove a nearly 30% reduction in annual electricity consumption for lighting in homes between 2010 and 2022 (Lane, 2023). Hasan et al. (2025) indicated that LEDs could reduce the lighting energy usage of buildings (and their resulting GHG emissions) in Bangladesh by 50%. Periyannan et al. (2023) recorded significant electricity savings after evaluating the impact of retrofitting hotels in Sri Lanka with LEDs. Forastiere et al. (2024)’s analysis of the retail buildings in Italy showed an 11% reduction in energy consumption from replacing other lamps with LEDs. Booysen et al., (2021) also achieved significant energy reduction with lighting retrofits in South African educational buildings.

The results presented in this document summarize findings from six original studies and three public sector/multilateral agency reports, which collectively reflect current evidence both globally and from six countries on four different continents. We recognize this limited geographic scope creates bias, and hope this work inspires research and data sharing on this topic in underrepresented regions.

Updated Date
Coming Soon Label
Coming Soon
Subscribe to Water quality