Deploy Utility-Scale Solar PV

Sector
Electricity
Image
Image
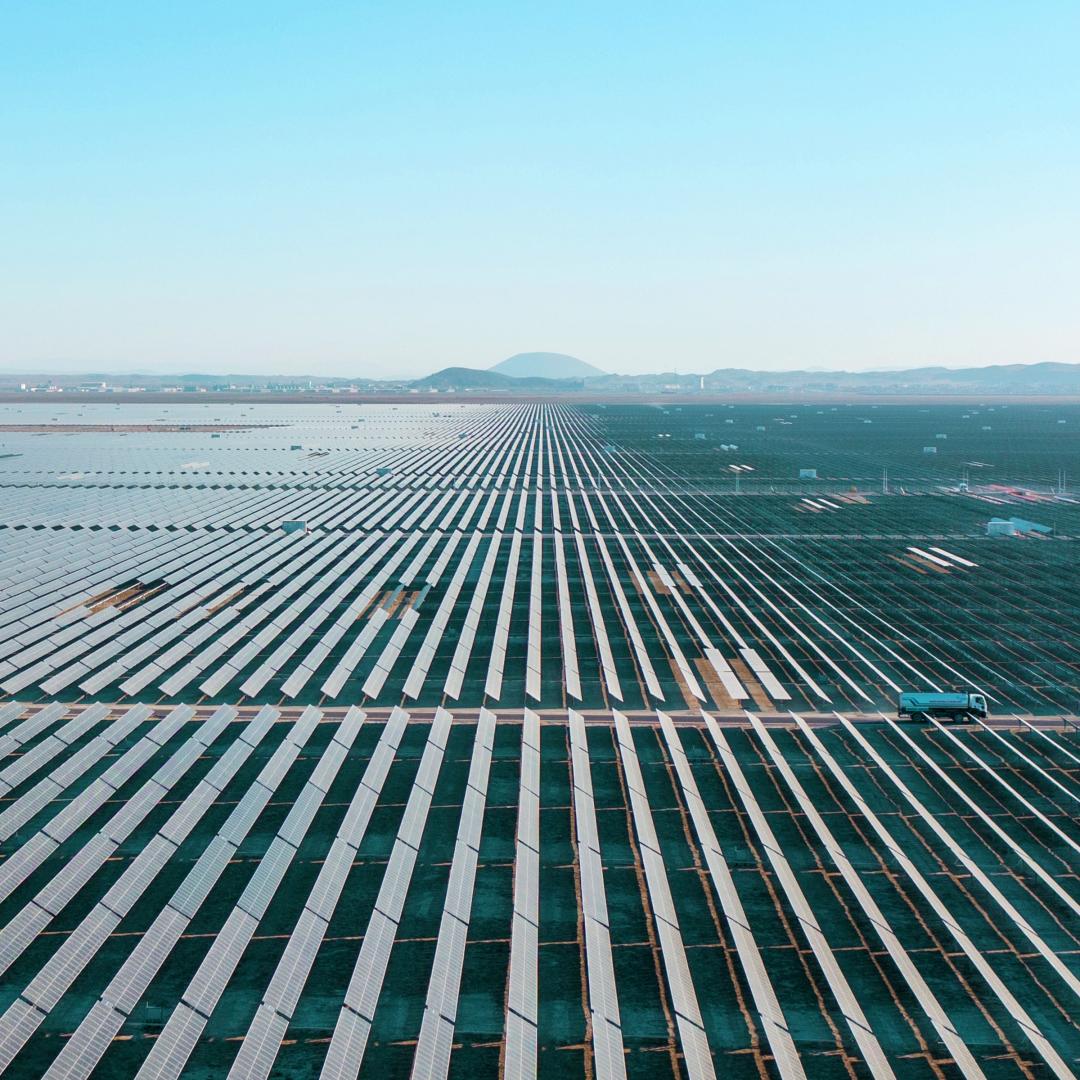
Utility-scale solar photovoltaic array
Coming Soon
Off
Summary

Utility-scale solar PV refers to large solar power systems, typically installed on open land and connected directly to a central electric grid, that generate electricity for widespread distribution. These systems generally have an installed capacity above 1 MW. There are various configurations of utility-scale solar PV systems and we include fixed-tilt and tracking systems in this solution. Systems on cropland are also considered in this solution, but dual production of crops and solar energy on the same land area is analyzed as a separate agrivoltaics solution.

Description for Social and Search
Deploy Utility-Scale Solar PV is a Highly Recommended climate solution. It reduces the need to generate electricity from fossil fuels and so reduces GHG emissions.
Overview

An estimated 23% of GHG emissions on a 100-year basis comes from electricity generation annually (Clarke et al., 2022), and in 2022, more than 60% of global electricity generation came from fossil fuel–based energy sources (International Energy Agency [IEA], 2024b). Since solar is a clean, renewable resource, utility-scale solar PV does not contribute to GHG emissions or air pollution while generating energy. Deploying utility-scale solar PV reduces the need for electricity generation from fossil fuels, which reduces CO₂ emissions, as well as smaller amounts of methane and nitrous oxide. 

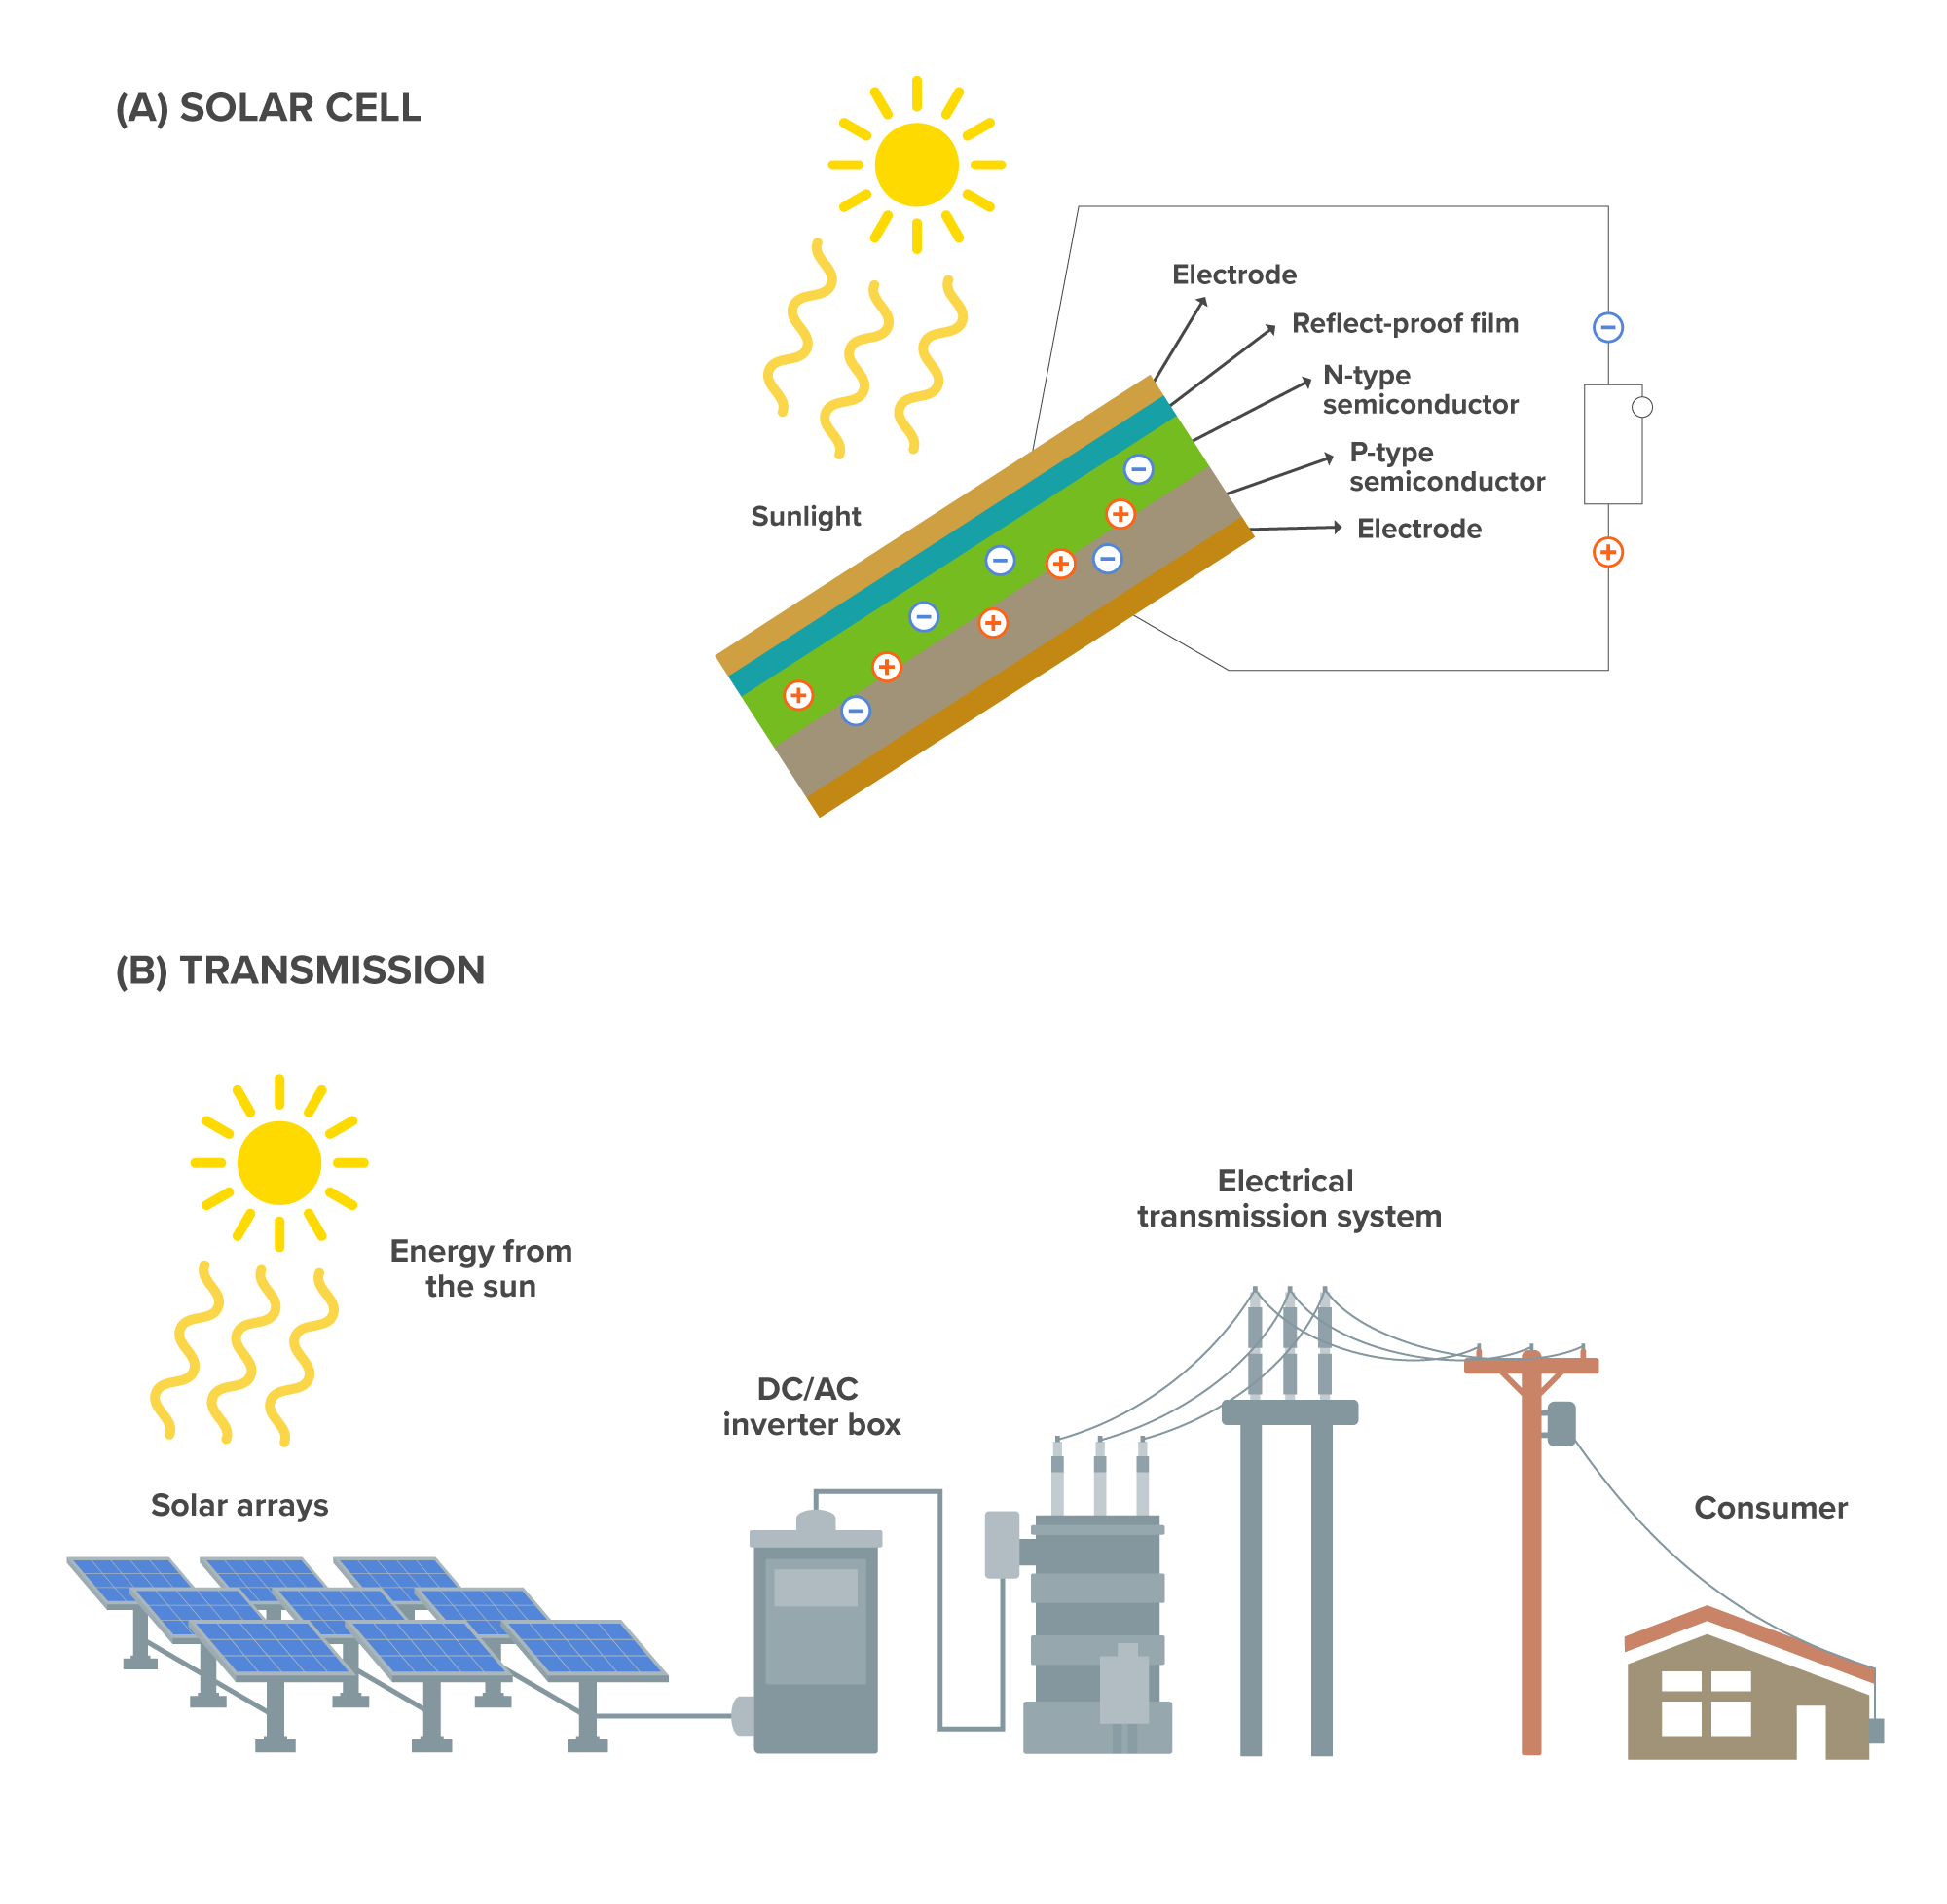
Utility-scale solar PV systems generate electricity by converting sunlight directly into electrical energy through the photovoltaic effect. These systems typically consist of large arrays of solar panels made from semiconductor materials (most commonly crystalline silicon), inverters that convert direct current (DC) electricity to alternating current (AC), structural mounting systems, and transformers. When sunlight strikes the surface of a solar panel, light energy is absorbed and transferred to electrons in the semiconductor material. If the energy is high enough, electrons then move between semiconductor layers producing a flow of electric current (US EIA, 2024). This electricity is routed through inverters, converted into grid-compatible AC power, and delivered to substations and transmission lines (Figure 1). The amount of electricity generated depends on the system size, the intensity of sunlight at the location (solar irradiance), panel efficiency, and the system’s capacity factor. Utility-scale solar PV achieves capacity factors of 9–35%, depending on geography, seasonal variation, and system design (Bolinger et al., 2023). 

There are two main categories of utility-scale systems – fixed-tilt installations, where solar panels are mounted in a static position, and tracking systems, which rotate to follow the sun’s path across the sky, improving energy yield. Newer advances in module design, including bifacial modules and cell technologies such as perovskite-silicon tandem cells, continue to improve system efficiency and lower overall costs of utility-scale solar PV (Gu et al., 2020; Mdallal et al., 2025). 

Utility-scale solar PV generates additional benefits, such as reduced air pollution, lower water use compared to thermal power plants, and relatively fewer public health impacts from energy production. While there are emissions associated with the manufacturing, transportation, and installation of utility-scale solar PV panels, these life-cycle emissions are more than 10 times lower than emissions from fossil fuel–based electricity generation (National Renewable Energy Laboratory [NREL], 2021). These life-cycle emissions are not quantified in this assessment but are typically addressed under industry- or supply chain-focused solutions. Because utility-scale solar PV produces no emissions during operation, the technology contributes significantly to clean energy transitions. 

Figure 1. (a) Anatomy of a solar cell. Two layers of semiconductor material – most commonly crystalline silicone – are sandwiched between electrodes. Both layers together create a silicon wafer. The layers of this silicon wafer are oppositely charged, which creates an electric field at the material interface. When energy from the sun is absorbed, electrons with sufficient energy cross the electric field and flow towards the electrodes, creating an electric current. (b) Solar panels are built by combining multiple solar cells into modules; multiple panels are used in a solar array. After electricity generation, inverters and transmission systems deliver power to consumers. Modified from (a) Husain et al. and (b) Renew Wisconsin.

Image
Diagrams demonstrating components of a solar cell and a utility-scale transmission system

Sources: Husain, A.A., Hasan, W.Z.W., Shafie, S., Hamidon, M.N., & Pandey, S.S. (2018). Renewable and Sustainable Energy Reviews, 94, 779–791; (b) Renew Wisconsin. (2018). Utility-scale solar in Wisconsin.

References

Abel, D., Holloway, T., Harkey, M., Rrushaj, A., Brinkman, G., Duran, P., Janssen, M., Denholm, P. (2018). Potential air quality benefits from increased solar photovoltaic electricity generation in the Eastern United States. Atmospheric Environment, 175, 65–74. Link to source: https://doi.org/10.1016/j.atmosenv.2017.11.049 

Adeh, E. H., Good, S. P., Calaf, M., & Higgins, C. W. (2019). Solar PV power potential is greatest over croplands. 9(1), Article 11442. Link to source: https://doi.org/10.1038/s41598-019-47803-3

Ahmad, A., Power, N., & Finegan, E. (2025). Maximising solar PV potential: A comprehensive review of factors affecting photovoltaic installation and generation in a mild temperate oceanic climate. Solar Energy Advances, 5, Article 100111. Link to source: https://doi.org/10.1016/J.SEJA.2025.100111 

Ahmad, M., Zeeshan, M., & Khan, J. A. (2023). Life cycle multi-objective (geospatial, techno-economic, and environmental) feasibility and potential assessment of utility scale photovoltaic power plants. Energy Conversion and Management, 291. Article 117260. Link to source: https://doi.org/10.1016/j.enconman.2023.117260

Badza, K., Soro, Y. M., & Sawadogo, M. (2023). Life cycle assessment of a 33.7 MW solar photovoltaic power plant in the context of a developing country. Sustainable Environment Research, 33(1), Article 38. Link to source: https://doi.org/10.1186/S42834-023-00201-X

Baik, E., Chawla, K. P., Jenkins, J. D., Kolster, C., Patankar, N. S., Olson, A., Benson, S. M., Long, J. C. S. (2021). What is different about different net-zero carbon electricity systems? Energy and Climate Change, 2, Article 100046. Link to source: https://doi.org/10.1016/j.egycc.2021.100046

Bajagain, R., Panthi, G., An, Y.-J., & Jeong, S.-W. (2020). Current practices on solar photovoltaic waste management: An overview of the potential risk and regulatory approaches of the photovoltaic waste. Journal of Korean Society of Environmental Engineers, 42(12) 690-708. Link to source: https://doi.org/https://doi.org/10.4491/KSEE.2020.42.12.690

Bamisile, O., Acen, C., Cai, D., Huang, Q., & Staffell, I. (2025). The environmental factors affecting solar photovoltaic output. Renewable and Sustainable Energy Reviews, 208, Article 115073. Link to source: https://doi.org/10.1016/J.RSER.2024.115073 

Beiter, P., Guillet, J., Jansen, M., Wilson, E., & Kitzing, L. (2024). The enduring role of contracts for difference in risk management and market creation for renewables. Nature Energy, 9, 20–26. Link to source: https://doi.org/10.1038/s41560-023-01401-w 

Bistline, J.E.T., Watten, A. (2025). Emissions reductions of rooftop solar are overstated by approaches that inadequately capture substitution effects. Nature Climate Change, 15, 1173–1175. Link to source: https://doi.org/10.1038/s41558-025-02459-y

Bolinger, M., Seel, J., Kemp, J. M., Warner, C., Katta, A., & Robson, D. (2023). Utility-scale solar, 2023 edition: Empirical trends in deployment, technology, cost, performance, PPA pricing, and value in the United States. Link to source: https://emp.lbl.gov/publications/utility-scale-solar-2023-edition

Bolinger, M., Wiser, R., & O’Shaughnessy, E. (2022). Levelized cost-based learning analysis of utility-scale wind and solar in the United States. iScience, 25(6). Link to source: https://doi.org/10.1016/J.ISCI.2022.104378

Brown, T. & Reichenberg, L. (2021). Decreasing market value of variable renewables can be avoided by policy action. Energy Economics, 100, Article 105354. Link to source: https://doi.org/10.1016/j.eneco.2021.105354

Buonocore, J. J., Hughes, E. J., Michanowicz, D. R., Heo, J., Allen, J. G., and Williams, A. (2019). Climate and health benefits of increasing renewable energy deployment in the United States. Environmental Research Letters, 14, Article 114010. Link to source: https://doi.org/10.1088/1748-9326/ab49bc

Chopdar, R. K., Sengar, N., Giri, N. C., & Halliday, D. (2024). Comprehensive review on agrivoltaics with technical, environmental and societal insights. Renewable and Sustainable Energy Reviews, 197. Article 114416. Link to source: https://doi.org/10.1016/j.rser.2024.114416

Chowdhury, M. S., Rahman, K. S., Chowdhury, T., Nuthammachot, N., Techato, K., Akhtaruzzaman, M., Tiong, S. K., Sopian, K., & Amin, N. (2020). An overview of solar photovoltaic panels’ end-of-life material recycling. Energy Strategy Reviews, 27, Article 100431. Link to source: https://doi.org/10.1016/J.ESR.2019.100431

Clarke, L., Wei, Y.-M., De La Vega Navarro, A., Garg, A., Hahmann, A. N., Khennas, S., Azevedo, I. M. L., Löschel, A., Singh, A. K., Steg, L., Strbac, G., & Wada, K. (2022). Energy Systems. In P. R. Shukla, J. Skea, R. Slade, A. Al Khourdajie, R. van Diemen, D. McCollum, M. Pathak, S. Some, P. Vyas, R. Fradera, M. Belkacemi, A. Hasija, G. Lisboa, S. Luz, & J. Malley (Eds.), Climate change 2022: Mitigation of climate change. Contribution of working group III to the sixth assessment report of the intergovernmental panel on climate change (pp. 613–746). Cambridge University Press. Link to source: https://doi.org/10.1017/9781009157926.008

Dato, P., Dioha, M., Hessou, H., Houenou, B., Mukhaya, B., Okyere, M. A., & Odarno, L. (2025). Computation of weighted average cost of capital (WACC) in the power sector for African countries and the implications for country-specific electricity technology cost. Applied Energy, 397, Article 126333. Link to source: https://doi.org/10.1016/J.APENERGY.2025.126333

de La Beaumelle, N. A., Blok, K., de Chalendar, J. A., Clarke, L., Hahmann, A. N., Huster, J., Nemet, G. F., Suri, D., Wild, T. B., & Azevedo, I. M. L. (2023). The global technical, economic, and feasible potential of renewable electricity. Annual Review of Environment and Resources, 48, 419–449. Link to source: https://www.annualreviews.org/content/journals/10.1146/annurev-environ-112321-091140

Deng, Y. Y., Haigh, M., Pouwels, W., Ramaekers, L., Brandsma, R., Schimschar, S., Grözinger, J., & de Jager, D. (2015). Quantifying a realistic, worldwide wind and solar electricity supply. Global Environmental Change, 31, 239–252. Link to source: https://doi.org/10.1016/J.GLOENVCHA.2015.01.005

Diffendorfer, J. E., Sergi, B., Lopez, A., Williams, T., Gleason, M., Ancona, Z., & Cole, W. (2024). The interplay of future solar energy, land cover change, and their projected impacts on natural lands and croplands in the US. Science of The Total Environment, 947, Article 173872. Link to source: https://doi.org/10.1016/J.SCITOTENV.2024.173872

Dimanchev, E., Gabriel, S. A., Reichenberg, L., & Korpås, M. (2024). Consequences of the missing risk market problem for power system emissions. Energy Economics, 136, Article 107639. Link to source: https://doi.org/10.1016/j.eneco.2024.107639 

Dioha, M. O. (2025). How can we finance a fair energy transition in Africa?Link to source: https://drawdown.org/insights/how-can-we-finance-a-fair-energy-transition-in-africa

DNV. (2024). Energy transition outlook 2024. Link to source: https://brandcentral.dnv.com/original/gallery/10651/files/original/5c2470ac-597c-43f9-87dd-4e6b238d7845.pdf 

Dupont, E., Koppelaar, R., & Jeanmart, H. (2020). Global available solar energy under physical and energy return on investment constraints. Applied Energy, 257, Article 113968. Link to source: https://doi.org/10.1016/J.APENERGY.2019.113968

Firoozi, A. A., Firoozi, A. A., & Maghami, M. R. (2025). Harnessing photovoltaic innovation: Advancements, challenges, and strategic pathways for sustainable global development. Energy Conversion and Management: X, 27, Article 101058. Link to source: https://doi.org/10.1016/J.ECMX.2025.101058

Frew, B., Sergi, B., Denholm, P., Cole, W., Gates, N., Levie, D., & Margolis, R. (2021). The curtailment paradox in the transition to high solar power systems. Joule, 5(5), 1143–1167. Link to source: https://doi.org/10.1016/J.JOULE.2021.03.021

Gadzanku, S., Kramer, A., and Smith, B., L. (2023). An updated review of the solar PV installation workforce literature. National Renewable Energy Laboratory. NREL/TP-7A40-83652. Link to source: https://www.nrel.gov/docs/fy23osti/83652.pdf

Gagnon, P. & O’Shaughnessy, E. (2024). Consequential analysis of the greenhouse gas emissions impacts of actions that influence the electric grid: The theory and practice of using marginal emissions rates. NREL/TP-6A40-91580. National Renewable Energy Laboratory. Link to source: https://www.nrel.gov/docs/fy25osti/91580.pdf

Gallagher, C. L. and Tracey, H. (2020). Integrating air quality and public health benefits in U.S. decarbonization strategies. Frontiers in Public Health, 8. Link to source: https://www.frontiersin.org/journals/public-health/articles/10.3389/fpubh.2020.563358

Giri, N. C., & Mohanty, R. C. (2022). Agrivoltaic system: Experimental analysis for enhancing land productivity and revenue of farmers. Energy for Sustainable Development, 70, 54–61. Link to source: https://doi.org/10.1016/J.ESD.2022.07.003

Gan, Y., Elgowainy, A., Lu, Z., Kelly, J. C., Wang, M., Boardman, R. D., & Marcinkoski, J. (2023). Greenhouse gas emissions embodied in the U.S. solar photovoltaic supply chain. Environmental Research Letters, 18(10), Article 104012. Link to source: https://doi.org/10.1088/1748-9326/ACF50D

Gorman, W., Kemp, J. M., Rand, J., Seel, J., Wiser, R., Manderlink, N., Kahrl, F., Porter, K., & Cotton, W. (2025). Grid connection barriers to renewable energy deployment in the United States. Joule, 9(2), Article 101791. Link to source: https://doi.org/10.1016/j.joule.2024.11.008

Gu, W., Ma, T., Ahmed, S., Zhang, Y., & Peng, J. (2020). A comprehensive review and outlook of bifacial photovoltaic (bPV) technology. Energy Conversion and Management, 223. Article 113283. Link to source: https://doi.org/10.1016/J.ENCONMAN.2020.113283

Haas, R., Sayer, M., Ajanovic, A., & Auer, H. (2023). Technological learning: Lessons learned on energy technologies. Wiley Interdisciplinary Reviews: Energy and Environment, 12(2), Article e463. Link to source: https://doi.org/10.1002/WENE.463

Hernandez, R. R., Easter, S. B., Murphy-Mariscal, M. L., Maestre, F. T., Tavassoli, M., Allen, E. B., Barrows, C. W., Belnap, J., Ochoa-Hueso, R., Ravi, S., & Allen, M. F. (2014). Environmental impacts of utility-scale solar energy. Renewable and Sustainable Energy Reviews, 29, 766–779. Link to source: https://doi.org/10.1016/J.RSER.2013.08.041

Hoogwijk, M. M. (2004). On the global and regional potential of renewable energy sources. Utrecht University. Link to source: https://research-portal.uu.nl/en/publications/on-the-global-and-regional-potential-of-renewable-energy-sources/

International Energy Agency. (2022). Solar PV global supply chains. Link to source: https://www.iea.org/reports/solar-pv-global-supply-chains 

International Energy Agency. (2023a). Solar PV power capacity in the net zero scenario, 2015-2030. Link to source: https://www.iea.org/data-and-statistics/charts/solar-pv-power-capacity-in-the-net-zero-scenario-2015-2030 

International Energy Agency. (2024a). World energy outlook 2024. Link to source: https://www.iea.org/reports/world-energy-outlook-2024

International Energy Agency. (2024b). World energy balances—Data product. Link to source: https://www.iea.org/data-and-statistics/data-product/world-energy-balances 

International Energy Agency PVPS. (2023). Trends in photovoltaic applications 2023. Link to source: https://iea-pvps.org/wp-content/uploads/2023/10/PVPS_Trends_Report_2023_WEB.pdf

International Energy Agency PVPS. (2024a). Best practices handbook for the collection and use of solar resource data for solar energy applications: Fourth edition 2024. Link to source: https://iea-pvps.org/wp-content/uploads/2024/09/Best-Practices-Handbook-for-the-Collection-and-Use-of-Solar-Resource-Data-for-Solar-Energy-Applications-Fourth-Edition-.pdf

International Energy Agency PVPS. (2024b). Trends in photovoltaic applications 2024. Link to source: https://iea-pvps.org/wp-content/uploads/2024/10/IEA-PVPS-Task-1-Trends-Report-2024.pdf

International Energy Agency-ETSAP and IRENA. (2015). Renewable energy integration in power grids: Technology brief. Link to source: https://www.irena.org/-/media/Files/IRENA/Agency/Publication/2015/IRENA-ETSAP_Tech_Brief_Power_Grid_Integration_2015.pdf

IPCC. (2023). Climate change 2023: Synthesis report. Contribution of working groups I, II and III to the Sixth Assessment Report of the Intergovernmental Panel on Climate Change. Link to source: https://www.ipcc.ch/report/ar6/syr/downloads/report/IPCC_AR6_SYR_SPM.pdf 

International Renewable Energy Agency. (2019). Future of solar photovoltaic: Deployment, investment, technology, grid integration and socio-economic aspects (A global energy transformation: paper). Link to source: https://www.irena.org/-/media/Files/IRENA/Agency/Publication/2019/Nov/IRENA_Future_of_Solar_PV_2019.pdf

International Renewable Energy Agency. (2024a). Renewable power generation costs in 2023. Link to source: https://www.irena.org/Publications/2024/Sep/Renewable-Power-Generation-Costs-in-2023

International Renewable Energy Agency. (2024b). Renewable energy capacity statistics 2024—Data product. Link to source: https://www.irena.org/Publications/2024/Mar/Renewable-capacity-statistics-2024

International Renewable Energy Agency. (2025). Renewable power generation costs in 2024. Link to source: https://www.irena.org/Publications/2025/Jun/Renewable-Power-Generation-Costs-in-2024

International Renewable Energy Agency and International Labour Organization. (2024). Renewable energy and jobs: Annual review 2024. Link to source: https://www.irena.org/-/media/Files/IRENA/Agency/Publication/2024/Oct/IRENA_Renewable_energy_and_jobs_2024.pdf 

International Renewable Energy Agency & International Energy Agency-PVPS. (2016). End-of-life management: Solar photovoltaic panels. Link to source: https://www.irena.org/-/media/Files/IRENA/Agency/Publication/2016/IRENA_IEAPVPS_End-of-Life_Solar_PV_Panels_2016.pdf

Lafitte, A., Sordello, R., Ouédraogo, D. Y., Thierry, C., Marx, G., Froidevaux, J., Schatz, B., Kerbiriou, C., Gourdain, P., & Reyjol, Y. (2023). Existing evidence on the effects of photovoltaic panels on biodiversity: a systematic map with critical appraisal of study validity. Environmental Evidence, 12(1), Article 25. Link to source: https://pubmed.ncbi.nlm.nih.gov/39294828/

Mdallal, A., Yasin, A., Mahmoud, M., Abdelkareem, M. A., Alami, A. H., & Olabi, A. G. (2025). A comprehensive review on solar photovoltaics: Navigating generational shifts, innovations, and sustainability. Sustainable Horizons, 13, Article 100137. Link to source: https://doi.org/10.1016/J.HORIZ.2025.100137

Mehedi, T. H., Gemechu, E., & Kumar, A. (2022). Life cycle greenhouse gas emissions and energy footprints of utility-scale solar energy systems. Applied Energy, 314, Article 118918. Link to source: https://doi.org/10.1016/J.APENERGY.2022.118918

Millstein, D., Wiser, R., Bolinger, M., & Barbose, G. (2017). The climate and air-quality benefits of wind and solar power in the United States. Nature Energy, 2(9), Article 17134. Link to source: http://dx.doi.org/10.1038/nenergy.2017.134

Millstein, D., O'Shaughnessy, E., & Wiser, R. (2024). Climate and air quality benefits of wind and solar generation in the United States from 2019 to 2022. Cell Reports Sustainability, 1(6), Article 100105. Link to source: https://doi.org/10.1016/j.crsus.2024.100105

NEA & IEA. (2020). Projected costs of generating electricity. Link to source: https://www.oecd-nea.org/upload/docs/application/pdf/2020-12/egc-2020_2020-12-09_18-26-46_781.pdf

NREL. (2021). Life cycle greenhouse gas emissions from electricity generation: Update. Link to source: https://docs.nrel.gov/docs/fy21osti/80580.pdf

Ovaitt, S., Mirletz, H., Seetharaman, S., & Barnes, T. (2022). PV in the circular economy, a dynamic framework analyzing technology evolution and reliability impacts. iScience, 25(1). Link to source: https://doi.org/10.1016/J.ISCI.2021.103488

Pehl, M., Arvesen, A., Humpenöder, F., Popp, A., Hertwich, E. G., & Luderer, G. (2017). Understanding future emissions from low-carbon power systems by integration of life-cycle assessment and integrated energy modelling. Nature Energy 2017, 2(12), 939–945. Link to source: https://doi.org/10.1038/s41560-017-0032-9

Peters, I. M. (2025). Strategic global deployment of photovoltaic technology: Balancing economic capacity and decarbonization potential. Advances in Atmospheric Sciences, 42, 261–268. Link to source: https://doi.org/10.1007/s00376-024-4176-9

Pincelli, I. P., Hinkley, J., & Brent, A. (2024). Carbon, materials and energy footprint of a utility-scale solar plant in Aotearoa New Zealand. Solar Energy, 273, Article 112535. Link to source: https://doi.org/10.1016/J.SOLENER.2024.112535

Reinsch, W. A., & Arrieta-Kenna, S. (2021). A dark spot for the solar energy industry: Forced labor in Xinjiang. Link to source: https://www.csis.org/analysis/dark-spot-solar-energy-industry-forced-labor-xinjiang

Rivera, N. M., Ruiz-Tagle, J. C., and Spiller, E. (2024). The health benefits of solar power generation: Evidence from Chile. Journal of Environmental Economics and Management, 126, Article 102999. Link to source: https://doi.org/10.1016/j.jeem.2024.102999

Shyu, C. W., & Yang, T. I. (2025). Socio-technical tensions from community acceptance, energy transition, and energy justice: Lessons from solar photovoltaic projects in Taiwan. Applied Energy, 384, Article 125415. Link to source: https://doi.org/10.1016/J.APENERGY.2025.125415

Smith, B. L., Sekar, A., Mirletz, H., Heath, G., & Margolis, R. (2024). An updated life cycle assessment of utility-scale solar photovoltaic systems installed in the United States. Link to source: https://www.nrel.gov/docs/fy24osti/87372.pdf

SolarPower Europe. (2025). Global market outlook for solar power 2025-2029. Link to source: https://api.solarpowereurope.org/uploads/Global_Market_Outlook_2025_v1_aaebd9698b.pdf

Suri, D., de Chalendar, J. & Azevedo, I.M.L. (2025). Assessing the real implications for CO2 as generation from renewables increases. Nature Communications, 16, Article 7124. Link to source: https://doi.org/10.1038/s41467-025-59800-4

Susskind, L., Chun, J., Gant, A., Hodgkins, C., Cohen, J., & Lohmar, S. (2022). Sources of opposition to renewable energy projects in the United States. Energy Policy, 165, Article 112922. Link to source: https://doi.org/10.1016/J.ENPOL.2022.112922

Tambari, I. T., Dioha, M. O., & Failler, P. (2020). Renewable energy scenarios for sustainable electricity supply in Nigeria. Energy and Climate Change, 1, Article 100017. Link to source: https://doi.org/10.1016/J.EGYCC.2020.100017

Tawalbeh, M., Al-Othman, A., Kafiah, F., Abdelsalam, E., Almomani, F., & Alkasrawi, M. (2021). Environmental impacts of solar photovoltaic systems: A critical review of recent progress and future outlook. Science of The Total Environment, 759, Article 143528. Link to source: https://doi.org/10.1016/J.SCITOTENV.2020.143528

Truitt, S., Elsworth, J., Williams, J., Keyser, D., Moe, A., Sullivan, J., and Wu, K. (2022). State-level employment projections for four clean energy technologies in 2025 and 2030. National Renewable Energy Laboratory. NREL/TP-5500-81486. Link to source: https://www.nrel.gov/docs/fy22osti/81486.pdf

US EIA. (2024). Photovoltaics and electricity - U.S. Energy Information Administration (EIA). Link to source: https://www.eia.gov/energyexplained/solar/photovoltaics-and-electricity.php 

van de Ven, D. J., Capellan-Peréz, I., Arto, I., Cazcarro, I., de Castro, C., Patel, P., & Gonzalez-Eguino, M. (2021). The potential land requirements and related land use change emissions of solar energy. Scientific Reports, 11(1), Article 2907. Link to source: https://doi.org/10.1038/S41598-021-82042-5

Wiser, R., Millstein, D., Mai, T., Macknick, J., Carpenter, A., Cohen, S., Cole, W., Frew, B., and Heath, G. (2016). The environmental and public health benefits of achieving high penetrations of solar energy in the United States. Energy, 113, 472–486. Link to source: https://doi.org/10.1016/j.energy.2016.07.068

Wolak, F. A. (2022). Long-term resource adequacy in wholesale electricity markets with significant intermittent renewables. Environmental and Energy Policy and the Economy, 3, 155–220. Link to source: https://doi.org/10.1086/717221 

Xu, Z., Li, Y., Qin, Y., & Bach, E. (2024). A global assessment of the effects of solar farms on albedo, vegetation, and land surface temperature using remote sensing. Solar Energy, 268, Article 112198. Link to source: https://doi.org/10.1016/J.SOLENER.2023.112198

Yavari, R., Zaliwciw, D., Cibin, R., & McPhillips, L. (2022). Minimizing environmental impacts of solar farms: a review of current science on landscape hydrology and guidance on stormwater management. Environmental Research: Infrastructure and Sustainability, 2(3), Article 032002. Link to source: https://doi.org/10.1088/2634-4505/AC76DD

Zubi, G., Parag, Y., & Wald, S. (2024). Implications of large-scale PV integration on grid operation, costs, and emissions: Challenges and proposed solutions. Energies, 18(1), Article 130. Link to source: https://doi.org/10.3390/EN18010130 

Credits

Lead Fellow

  • Michael Dioha, Ph.D.

Contributors

  • Al-Amin Bugaje, Ph.D.

  • Ruthie Burrows, Ph.D.

  • James Gerber, Ph.D.

  • Daniel Jasper

  • Megan Matthews, Ph.D.

  • Alex Sweeney

Internal Reviewers

  • James Gerber, Ph.D.

  • Amanda D. Smith, Ph.D.

Effectiveness

Table 1. Effectiveness at reducing emissions.

Unit: t CO₂‑eq/MW installed capacity/yr, 100-yr basis

Estimate 760
Left Text Column Width

Based on data provided by the IEA, global emissions from electricity generation accounted for an estimated 530 kg CO₂‑eq /MWh (540 kg CO₂‑eq /MWh, 20-yr basis) (IEA, 2024b; see Methodology: Appendix A for calculation details). To convert from MWh to MW, we used the global weighted average capacity factor for utility-scale solar PV of 16.2% (International Renewable Energy Agency [IRENA], 2024a). Utility-scale solar PV is estimated to reduce 760 t CO₂‑eq /MW (760 t CO₂‑eq /MW, 20-yr basis) of installed capacity annually (Table 1). 

To estimate the effectiveness of utility-scale solar PV, we assumed that newly installed utility-scale solar PV displaces an equivalent MWh of the global electricity grid mix. We then assumed the reduction in emissions from additional utility-scale solar PV capacity was equal to emissions (per MWh) from the 2023 global electricity grid mix (IEA, 2024b). Finally, we used the utility-scale solar PV capacity factor to convert to annual emissions per MW of installed capacity.

Actual avoided emissions will depend on the condition of the local grid at a particular time and place, including the level of solar already deployed (see Methodology, Appendix A). However, the relative emissions benefit from increased solar deployment depends on the energy sources it potentially displaces. Because solar energy output varies diurnally, demand peaks in the evenings need to be met by stored energy or other energy sources that can provide power as demand increases. In coal-dominated markets, increasing utility-scale solar PV generation could lead to overall increased emissions per MWh, even if coal plants operate less often because coal plants emit more during suboptimal operation and ramp-up/ramp-down phases (Suri et al., 2025). 

During operation, utility-scale solar PV emits negligible GHGs, so we assumed zero emissions per MW of installed capacity. However, emissions arise during manufacturing of components, transportation, installation, maintenance, and decommissioning, and are paid back within approximately 1–2 years (Ahmad et al., 2023; Badza et al., 2023; Mehedi et al., 2022; Pincelli et al., 2024; Smith et al., 2024). Studies from many different countries show that total emissions remain far below those of fossil fuel generation (Badza et al., 2023; Pincelli et al., 2024; NREL, 2021; Smith et al., 2024). Manufacturing using coal-intensive grids increases embodied emissions, highlighting the necessity of decarbonizing supply chains (Gan et al., 2023; Pehl et al., 2017).

In our analysis, we focused solely on emissions produced during electricity generation, so carbon payback time and embodied life-cycle emissions were not included in our estimates of effectiveness or climate impacts. 

Cost

We estimated a mean levelized cost of electricity (LCOE) for utility-scale solar PV of US$53/MWh based on three industry reports (IEA, 2024a; IRENA, 2025; NEA & IEA, 2020; see Methodology: Appendix A for details). LCOE values represent the average cost of producing one MWh of electricity over the operational lifetime of a power plant, allowing investors to compare their expected revenue to a standard set of costs. This cost metric has been used by international agencies for cost comparison across generation technologies, incorporating installed capital costs, operation and maintenance (O&M), project lifespan, and energy output. According to IRENA, between 2010 and 2024 the global weighted average LCOE for utility-scale solar PV fell by 90%, from US$417/MWh to US$43/MWh. This decline was driven by cost reductions across the PV value chain, with module and inverter price declines accounting for 55% of the LCOE drop (IRENA, 2025). Technological advances such as larger wafer sizes, improved ingot growth methods, diamond wire wafering, and new cell architectures supported these changes. Balance-of-system (BoS) hardware contributed another 8%, while engineering, procurement, construction, installation, development, and other soft costs accounted for 28% of the reduction in LCOE (IRENA, 2025). Better financing conditions, improved capacity factors, and lower O&M costs also played a role.

Recent macroeconomic conditions have slightly reversed the downward trend. Between 2023 and 2024, the global weighted average LCOE for utility-scale solar PV increased by 0.6%, with 13 of the 15 largest markets experiencing cost increases ranging from 7% in Poland to 36% in Australia. Higher financing costs from inflation and elevated interest rates helped drive these shifts. Despite these headwinds, utility-scale solar PV remains one of the cheapest options worldwide for generating electricity. Our estimated global mean LCOE (US$53/MWh) is lower than the 2023 weighted average LCOE for fossil fuels, which was US$70–176/MWh (IRENA, 2024a). However, since LCOE excludes revenue, real-world costs of utility-scale solar generation could be higher than estimated here.

Methods and Supporting Data

Learning Curve

Table 2. Learning rate: drop in cost per doubling of the installed utility-scale solar PV production capacity.

Unit: %

25th percentile 30
Mean 34
Median (50th percentile) 34
75th percentile 38
Left Text Column Width

Utility-scale solar PV exhibits a pronounced learning curve, most clearly reflected in the steady decline of solar module prices as global deployment expands. The median learning rate for PV modules is estimated at 34%, meaning module prices fall by roughly one-third with every doubling of installed capacity (Table 2). Our estimated learning rate is based on trends in the past decade, while a longer historical estimate would be lower. According to a single source, significant economies of scale over the last decade have driven an even steeper learning rate of 42% (Masson et al., 2023). According to DNV’s Energy Transition Outlook 2024, the current global learning rate for module costs is about 26%, but projections suggest this will slow to around 17% by 2050 as cost components stabilize and the largest gains from scaling are realized (DNV, 2024). 

While module prices have seen the most dramatic reductions, similar trends are evident in total system costs. Studies tracking installed costs and LCOE for PV in the United States since 2007 report a 24% learning rate based on normalized LCOE for utility-scale PV, with an accelerated 45% between 2014 and 2020 (Bolinger et al., 2022). Between 2010 and 2023, IRENA (2024a) found that utility-scale solar PV achieved the highest global weighted-average learning rate for total installed costs among major renewables at 33.4%. Haas et al. (2023) similarly estimated a 33% learning rate for installed costs between 2010 and 2019. Meanwhile, operational expenditure (OPEX) is also expected to benefit from incremental learning, with DNV (2024) projecting a 9% OPEX-based learning rate through 2050, supported by advances in digital monitoring and maintenance practices. 

The drivers of these declines include economies of scale, technology improvements, and manufacturing efficiencies such as larger wafer formats, improved cell architectures, and advanced wafer processing techniques. Given this strong and sustained learning dynamic, continued global deployment is likely to further reduce costs. However, the pace of cost decline will vary depending on the time period, geographic market conditions, and whether costs are measured at the module level or across the full system.

Speed of Action

Speed of action refers to how quickly a climate solution physically affects the atmosphere after it is deployed. This is different from speed of deployment, which is the pace at which solutions are adopted.

At Project Drawdown, we define the speed of action for each climate solution as emergency brake, gradual, or delayed.

Deploy Utility-Scale Solar PV is a GRADUAL climate solution. It has a steady, linear impact on the atmosphere. As installed capacity of utility-scale PV increases over time, emissions from electricity generation are expected to decrease, assuming solar and other renewables displace fossil-fuel sources.

Caveats

One limitation of our approach is the assumption that each additional MWh generated by utility-scale solar PV displaces an equivalent MWh of the existing grid mix. This simplification implies that new utility-scale solar PV may at times displace other renewables such as onshore wind, rather than fossil fuel–based sources. In reality, the extent of avoided emissions varies based on regional grid dynamics, marginal generation sources, and the timing and location of electricity production. Utility-scale solar PV displaces a relatively high share of fossil fuel generation in grids where renewables are supported by flexible energy sources, such as natural gas (Suri et al., 2025). However, fossil fuel displacement is lower in coal-dominated grids, grids with significant nuclear or geothermal capacity, or regions where existing renewable capacity is already high (Baik et al., 2021; Bistline & Watten, 2025). 

Implementing utility-scale solar PV involves several caveats. Technically, projects require large areas of suitable land and strong grid connections. Poor siting can reduce output due to shading, dust, or suboptimal solar resource (Bamisile et al., 2025; Sengupta et al., 2024). These challenges can be reduced through careful site selection, use of bifacial modules, use of tracking systems, and improved maintenance practices such as dry-cleaning technologies in arid regions. Another technical caveat is end-of-life management. Cumulative global PV waste is expected to reach 60–78 million metric tons by 2050 (IRENA & IEA-PVPS, 2016), so scaling up recycling infrastructure and circular design is essential (Ovaitt et al., 2022). 

High capital intensity and financing constraints remain important barriers, particularly in emerging markets where high interest rates, policy uncertainty, and limited investor confidence increase project risk. Addressing these challenges often requires stable regulatory frameworks, concessional finance, and public–private partnerships to de-risk investments (Dioha, 2025). Supply-chain concentration also presents a caveat, as China dominates polysilicon and module production (IEA, 2022). 

There are also ecological and social caveats. Large solar farms may compete with agriculture or alter local ecosystems, particularly in sensitive desert or grassland habitats (Hernandez et al., 2014; Lafitte et al., 2023; Xu et al., 2024). Mitigation strategies such as agrivoltaics and siting on degraded land are increasingly used to minimize conflicts and deliver additional benefits (Adeh et al., 2019; Giri & Mohanty, 2022; Tawalbeh et al., 2021; Yavari et al., 2022). Social resistance can also emerge around land rights, visual impacts, or perceived inequitable distribution of project benefits, highlighting the importance of community engagement and benefit-sharing (Shyu & Yang, 2025; Susskind et al., 2022).

Current Adoption

Table 3. Current adoption level, 2023.

Unit: MW installed capacity

25th percentile 917,000
Mean 918,000
Median (50th percentile) 918,000
75th percentile 918,000
Left Text Column Width

As of 2023, the global installed capacity for utility-scale solar PV reached approximately 918,000 MW (Table 3). We estimated current adoption of utility-scale solar PV based on IEA reports (IEA, 2023a; Masson et al., 2024). Although we use 2023 as our baseline for current adoption, in 2024 an estimated additional 308,300 MW of utility-scale solar PV capacity was installed, bringing the global total to 1,226,000 MW or more than 1 TW (IEA, 2023a). 

In 2023, utility-scale solar PV accounted for 269.9 GW of new capacity additions, representing 59% of total global solar PV installed capacity that year (Masson et al., 2024). China continues to lead by a wide margin, with more than 435 GW of installed capacity, more than half the global total (Masson et al., 2024). Utility-scale solar PV systems are driving the majority of new additions in several key markets where large projects dominate deployment, including the U.S., India, Spain, and South Korea. By contrast, other regions such as the Middle East and Africa are progressing more slowly, with relatively limited large-scale deployments despite vast solar energy potential (SolarPower Europe, 2025). These disparities highlight the uneven pace of adoption across markets. For further details, see the Geographic Guidance section.

Adoption Trend

Figure 2. Global adoption of utility-scale solar PV, 2015–2023

Source: International Energy Agency. (2023). Solar PV power capacity in the Net Zero Scenario, 2015-2030. https://www.iea.org/data-and-statistics/charts/solar-pv-power-capacity-in-the-net-zero-scenario-2015-2030 Licence: CC BY 4.0

Enable Download
On

Table 4. Adoption trend, 2015–2023.

Unit: MW installed capacity/yr

25th percentile 65,000
Mean 101,000
Median (50th percentile) 82,000
75th percentile 99,000
Left Text Column Width

Global utility-scale solar PV capacity has grown rapidly, expanding from 113 GW in 2015 to about 918 GW by 2023 (Figure 2), reflecting technological progress, supportive policies, and accelerating investment. 

We calculated the global adoption trend by summing global adoption for each year between 2015 and 2023 and taking the year-to-year difference. Comparing year-to-year global adoption, the median global adoption trend was adding 82,000 MW of installed capacity per year, but expansion was unevenly distributed geographically (Table 4, Figure 2). 

Global utility-scale solar PV capacity expanded more than eightfold between 2015 and 2023 (IEA, 2023a). Growth was steady during the mid-2010s, averaging about 60–70 GW added per year, but adoption accelerated sharply in 2020, with annual additions climbing from 90 GW to 243 GW in 2023 (IEA, 2023a). This means that in 2023 alone, installations were more than double the yearly average of the previous five years, pushing the mean trendline to ~100 GW of annual growth since 2015. The data show a clear shift from incremental to exponential deployment, with utility-scale solar PV now accounting for the majority of global new renewable capacity (IRENA, 2024b).

Adoption Ceiling

Table 5. Adoption ceiling: upper limit for adoption level.

Unit: MW installed capacity

25th percentile 224,000,000
Mean 252,000,000
Median (50th percentile) 252,000,000
75th percentile 279,000,000
Left Text Column Width

The adoption ceiling for utility-scale solar PV is determined by the technology’s global technical potential, based primarily on solar resource availability. Since sunlight is geographically widespread and virtually inexhaustible, solar PV has one of the highest technical potentials of all renewable energy technologies. However, realistic deployment could vary across regions depending on land use, transmission access, and electricity demand. 

Estimates of utility-scale solar PV potential vary widely across the literature. A meta-analysis found global technical potential ranging from 1.01 × 10² PWh/yr to 1.36 × 10⁴ PWh/yr, spanning two orders of magnitude; the median value was 4.65 × 10² PWh/yr while the average was 2.20 × 10³ PWh/yr (de La Beaumelle et al., 2023). Dupont et al. (2020) estimated the global net potential at 225 PWh/yr for poly-Si PV and 332 PWh/yr for mono-Si PV, while Deng et al. (2015), using a 1 km² global grid analysis, estimated realistic long-term potentials of 88–782 PWh/yr. 

Despite the abundant solar resource, the adoption ceiling is unlikely to be reached due to other constraints. Land availability as well as competition with agriculture, urbanization, and protected ecosystems can restrict deployment (Diffendorfer et al., 2024; van de Ven et al., 2021). Grid integration poses another challenge, as high penetration of variable solar requires substantial investment in storage, flexible generation, and transmission to ensure system reliability. Regional solar resource quality, siting regulations, and access to capital further influence adoption (Ahmad et al., 2025; Bamisile et al., 2025). Emerging technologies such as agrivoltaics and floating PV can help overcome some of these barriers, bringing practical adoption levels closer to the ceiling (Adeh et al., 2019). 

For our analysis, we estimated the median technical potential, which corresponds to an adoption ceiling of 252 million MW of installed capacity for utility-scale solar PV (Table 5). 

Achievable Adoption

Table 6. Range of achievable adoption levels.

Unit: MW installed capacity

Current adoption 918,000
Achievable – low 12,000,000
Achievable – high 15,000,000
Adoption ceiling 252,000,000
Left Text Column Width

The IEA’s World Energy Outlook (WEO) 2024 presents several scenarios that explore future energy pathways under different assumptions about policies, technologies, and markets. For this analysis, we define the adoption achievable range for utility-scale solar PV based on the Stated Policies Scenario (STEPS) and the Announced Pledges Scenario (APS) (IEA, 2024a). However, the WEO does not explicitly distinguish between utility-scale and distributed solar PV in its projections. To bridge this gap, we conducted a simple linear projection using historical deployment trends to estimate the likely share of utility-scale PV within total solar PV capacity. Our analysis suggests that by 2050, utility-scale solar PV could represent approximately 74% of all solar PV deployment. This finding is consistent with IRENA’s REmap analysis, which projects that utility-scale systems will account for 60–80% of global solar PV capacity by mid-century (IRENA, 2019). Accordingly, for our study we assume that 74% of the IEA’s projected solar PV deployment in 2050 will come from utility-scale systems. This provides a reasonable basis for estimating adoption levels, while aligning with both historical patterns and complementary international assessments.

Achievable – Low 

The low achievable adoption level is based on the Stated Policies Scenario (STEPS), which reflects the current trajectory of utility-scale solar PV expansion under existing and announced policies. In this scenario, assuming utility-scale projects account for 74% of total solar PV capacity, global capacity is projected to grow more than 13-fold; from 918,000 MW in 2023 to approximately 12 million MW by 2050 (Table 6). This corresponds to an average compound annual growth rate (CAGR) of 10%.

Achievable – High 

The high achievable adoption level is based on APS, which assumes the same policy framework as STEPS, plus full realization of announced national energy and climate targets, including net-zero commitments supported by stronger clean energy investments. Under this scenario, utility-scale solar PV capacity is projected to increase approximately 16-fold from 918,000 MW in 2023 to approximately 15 million MW by 2050 (Table 6), requiring a CAGR of 10.8% over the same period. 

Using our adoption ceiling of 252 million MW, the current adoption of utility-scale solar PV constitutes approximately 0.4% of its technical potential. The achievable adoption range, as calculated, lies between 4.8% and 5.9% of this potential.

Table 7. Climate impact at different levels of adoption.

Unit: Gt CO₂‑eq/yr, 100-yr basis

Current adoption 0.69
Achievable – low 9.2
Achievable – high 11.2
Adoption ceiling 190
Left Text Column Width

Using baseline global adoption and effectiveness, we estimated the current total climate impact of utility-scale solar PV to be approximately 0.70 Gt CO₂‑eq of reduced emissions per year (Table 7). 

We estimated climate impacts using the emissions from the 2023 baseline electricity grid. Actual emissions reductions could differ depending on how the emissions intensity of electricity generation changes over time. As solar and other renewables grow to represent an increasingly high percentage of power generation sources, grid emissions are expected to decrease over time (DNV, 2024; IEA, 2024a). As a result, the climate impacts presented here are likely overestimates. Assuming global policies on utility-scale solar PV – both existing and announced – are backed with adequate implementation provisions, global adoption could reach 12 million MW by 2050. This would result in an increased emissions reduction of approximately 9.2 Gt CO₂ ‑eq per year. If every nation’s energy and climate targets (including net-zero commitments backed by stronger clean energy investments) are realized, utility-scale solar PV adoption could reach 15 million MW by 2050, leading to an estimated 11 Gt CO₂ ‑eq of reduced emissions per year. 

We based the adoption ceiling solely on the technical potential of utility-scale solar PV, while neglecting social and economic constraints and realistic scenarios of future power demand (Dioha et al, 2025). Utility-scale solar PV installed capacity is unlikely to reach 252 million MW, but if current grid emissions remained constant while capacity increased, GHG emission reductions would be approximately 190 Gt CO₂‑eq/yr. This maximum is unrealistic as a forward-looking climate impact because it treats grid carbon intensity as permanently fixed at 2023 levels and ignores future decarbonization and corresponding decreases in marginal avoided emissions.

Additional Benefits

Income and Work

Solar PV can have a strong positive effect on the economy, as it accounts for 44% of renewable energy jobs globally and is the fastest-growing sector of renewable energy employment (IRENA & ILO, 2024). The majority of direct and indirect jobs in solar PV are found in China, followed by the European Union (IRENA & ILO, 2024). In the United States as of 2021, it was estimated that solar PV accounted for about 250,000 full-time jobs, with the majority of these jobs in the installation, project development, and manufacturing sectors (Gadzanku et al., 2023). While about half of solar PV jobs are in the distributed PV sector, utility-scale PV accounts for about 20% of these jobs and is expected to grow as installed capacities grow (Gadzanku et al., 2023). According to a report from NREL, about 509,000–757,000 jobs for both utility- and distributed-scale solar PV are projected to be added in the U.S. by 2030 (Truitt et al., 2022).

Health

Improvements in air quality offer health benefits from reduced air pollution exposure, including reduced premature mortality. The magnitude and distribution of these benefits depend on the local electricity grid mix, the fuels used to generate electricity, and atmospheric conditions that affect how far pollutants travel from emission sources (Buonocore et al., 2019). Regions with a higher proportion of coal-powered electricity generation will see more health benefits when utility-scale PV is deployed (Buonocore et al., 2019). These health benefits often translate into cost savings associated with reductions in hospital admissions, improved respiratory and cardiovascular conditions, and avoidance of lost work and school days (Millstein et al., 2017; Wiser et al., 2016). For example, a study from Chile found that when utility-scale solar PV projects were deployed, there was a reduction in hospital admissions for cardiovascular and respiratory conditions in cities downwind of fossil fuel–powered electricity plants (Rivera et al., 2024). 

Water Resources

Utility-scale solar PV systems have lower rates of water withdrawals and consumption than other fossil fuel–based electricity generation (Wiser et al., 2016). The majority of water use for PV electricity is for washing and dust suppression on the panels (Hernandez et al., 2014).

Land Resources

Although utility-scale PV projects require large areas of suitable land (see Caveats and Interactions), these projects can utilize degraded lands that may not be suitable for other uses (Diffendorfer et al., 2024; Hernandez et al., 2014).

Air Quality

Solar PV reduces air pollutants released from fossil fuel energy generation, thereby avoiding the emission of pollutants such as nitrogen oxides, sulfur dioxide, and PM2.5 associated with burning coal and natural gas (Abel et al., 2018; Millstein et al., 2024; Millstein et al., 2017; Wiser et al., 2016). Regional differences in the amount and type of air pollutants avoided will vary depending on the fossil fuel type that PV displaces (Gallagher & Holloway, 2020). For example, since coal has different emissions than gas, regions with higher levels of coal-powered electricity will experience different air quality benefits than regions with more gas-powered electricity (Millstein et al., 2017). Depending on meteorological conditions, pollutants can be transported for long distances after they are emitted, so air pollution benefits can be widespread (Millstein et al., 2024).

Risks

Several risks accompany the large-scale rollout of utility-scale solar PV. Rapid deployment without adequate storage, grid flexibility, or transmission can elevate curtailment rates, undermining both financial returns and emissions reductions (Firoozi et al., 2025; Zubi et al., 2024). However, financial risk from high solar deployment and integration can be avoided with various policy levers, such as carbon taxes (Brown & Reichenberg, 2021). Different policy levers are necessary at different levels of adoption. The combined impact of higher shares of renewables generating electricity and increased electrification of consumer services can lead to greater risk of the intermittent supply from renewables being unable to meet electricity demand at all hours of the year (Wolak, 2022). Since long-term forecasting of supply is more challenging for technologies like wind and solar, stable electricity prices are not always guaranteed. This higher investment risk can discourage generators from investing in clean energy deployment (Dimanchev et al., 2024) in the absence of policy mechanisms such as contracts for difference that can manage investment risks by supporting creation of electricity markets with stable long-term prices (Beiter et al., 2024). 

Concentrated supply chains also create vulnerabilities to trade disruptions, geopolitical tensions, and ethical risks, including documented concerns concerning forced labor in parts of the supply chain (IEA, 2022; Reinsch & Arrieta-Kenna, 2021). Environmental and health risks arise if end-of-life infrastructure and policies are inadequate; billions of metric tons of PV waste could otherwise end up in landfills, with additional concerns in some areas over water usage for panel cleaning or habitat disruption due to poorly sited installations (Bajagain et al., 2020; Chowdhury et al., 2020; IRENA & IEA-PVPS, 2016).

Interactions with Other Solutions

Reinforcing

Increased availability of renewable energy from utility-scale solar PV helps reduce emissions from the electricity grid as a whole. Reduced emissions from the electricity grid lead to lower downstream emissions for solutions that rely on electricity use. Deploying utility-scale solar PV also supports increased integration of wind power technologies by diversifying the renewable energy mix and reducing exposure to wind variability.

High penetration of utility-scale PV could incentivize increased adoption of automation systems that take advantage of times of high solar generation and lower electricity prices.

Electrification of transportation systems will be more beneficial in reducing global emissions if the underlying grid includes a higher proportion of non-emitting power sources. Electric transportation systems can also reduce curtailment of solar energy through controlled-time charging and other load-shifting technologies.

Competing

In regions where grid expansion is slow, prioritizing large-scale solar PV plants may delay distributed PV systems that are essential for rural or last-mile electrification.

Since wind and solar can generate electricity at the same times of day, deploying utility-scale solar PV could create competition for grid connections, reduce daytime electricity revenues, and suppress adoption of additional wind power.

Increased development and installation of utility-scale solar PV requires dedicated land use which limits land availability for other renewable energy technologies, raw material and food production, and conservation programs. For example, utility-scale solar PV competes with the following solutions for land:

Dashboard

Solution Basics

MW installed capacity

t CO₂-eq (100-yr)/unit/yr
760
units
Current 918,000 01.2×10⁷1.5×10⁷
Achievable (Low to High)

Climate Impact

Gt CO₂-eq (100-yr)/yr
Current 0.69 9.211
Gradual

CO₂ , CH₄, N₂O

Trade-offs

Utility-scale solar PV delivers substantial net emissions savings, but significant trade-offs persist. Curtailment often reflects economic policy outcomes and grid integration constraints rather than a technical necessity. Limited integration infrastructure may also necessitate reliance on backup fossil-powered plants, thereby shifting emissions elsewhere in the energy system (Frew et al., 2021). Land use also involves trade-offs, as large projects can disrupt ecosystems or agricultural land, though co-location strategies such as agrivoltaics and usage of degraded lands can help offset these impacts (Chopdar et al., 2024; Giri & Mohanty, 2022). 

The temporal variability of solar energy also creates trade-offs. When demand peaks in evening hours, non-solar energy sources ramp up generation, which could lead to increases in marginal emissions (Gagnon & O’Shaughnessy, 2024). In regions with high solar deployment, increased adoption of distributed PV could displace utility-scale solar generation, since both operate diurnally, resulting in no net reduction in grid emissions (Bistline & Watten, 2025).

kWh/m2/yr
5502400

Annual global horizontal irradiance (GHI)

Global horizontal irradiance (GHI) measures the intensity (energy per area per year) of all solar radiant energy on a horizontal surface. GHI limits the power output of fixed solar PV systems; however, panels can capture additional solar energy if tracking systems are incorporated. Here we show annual GHI averaged over the decade ending in 2025.

Copernicus Climate Change Service. (2022). ERA5-Land monthly averaged data from 1950 to present [Data set]. Copernicus Climate Change Service (C3S) Climate Data Store (CDS). Retrieved May 4, 2026, from Link to source: https://doi.org/10.24381/cds.adbb2d47 

kWh/m2/yr
5502400

Annual global horizontal irradiance (GHI)

Global horizontal irradiance (GHI) measures the intensity (energy per area per year) of all solar radiant energy on a horizontal surface. GHI limits the power output of fixed solar PV systems; however, panels can capture additional solar energy if tracking systems are incorporated. Here we show annual GHI averaged over the decade ending in 2025.

Copernicus Climate Change Service. (2022). ERA5-Land monthly averaged data from 1950 to present [Data set]. Copernicus Climate Change Service (C3S) Climate Data Store (CDS). Retrieved May 4, 2026, from Link to source: https://doi.org/10.24381/cds.adbb2d47 

Maps Introduction

Utility-scale solar PV deployment is driven by a variety of factors, some of which are spatial (such as total incident solar radiation) and some which may indirectly depend on geography, such as socioeconomic and market conditions.

More than 30 countries had more than 1 GW installed by the end of 2023 including new markets in the Middle East and Africa. Ten countries represented 84% of total solar markets in 2023, including distributed solar PV, with China, the United States, and India at the top of the list (IEA PVPS, 2023). Utility-scale solar PV dominated 2023 solar PV installations in both China and the United States, accounting for 65% and 70% of the Chinese and U.S. solar markets respectively (IEA PVPS, 2023).

In many regions, deployment of utility-scale solar PV lags significantly behind the economic and decarbonization potential, and large-scale deployment does not typically align with regions of maximal potential, as can be seen by comparing maps of installed capacity and irradiance. Brazil and Australia are notable exceptions, having significant deployment and high levels of GHI (Bamisile et al., 2025). However, utility-scale solar PV markets in Brazil and Australia are much smaller than in China and the United States. In emerging markets, solar PV competitiveness is stifled by limited access to capital, lack of technical talent, and persistent fossil-fuel subsidies. Targeted capital investments in sub-Saharan Africa can yield up to nine times the GHG emissions reduction of equivalent investments in more mature markets (Peters, 2025). In more mature markets like the U.S., barriers are primarily structural, including long grid interconnection timelines and high costs (Gorman et al., 2025). 

The emissions benefit from increased solar PV deployment depends on the energy sources it displaces. Displacing sources of electricity that emit more GHGs leads to greater emissions reductions. However, real-world emissions reductions also depend on which sources are able to provide power when solar PV is unable to meet peaks in demand. In addition to targeting regions with dirtier grids, increasing utility-scale solar PV in regions with more dispatchable power sources and robust storage infrastructure could increase emissions reductions (Bistline & Watten, 2025). Here we show a map of avoided emissions with each incremental addition of solar PV, calculated by WattTime (watttime.org).

Action Word
Deploy
Solution Title
Utility-Scale Solar PV
Classification
Highly Recommended

Lawmakers and Policymakers

  • Set ambitious long-term renewable energy goals, and incorporate them into national climate plans and multilateral agreements.
  • Ensure regulatory frameworks around solar are strong and enforced, while also being accessible and timely; coordinate solar power policies horizontally (e.g., across agencies) and vertically (e.g., across subnational, national, and international efforts); seek to align social and environmental safeguards and streamline permitting processes.
  • Adopt and progressively raise renewable energy procurement standards for the public sector to expand demand and investment in utility-scale solar PV.
  • Set renewable energy quotas for power companies; offer expedited permitting processes for renewable energy production, including solar where competitive, while maintaining social and environmental safeguards.
  • Develop long-term, flexible partnership frameworks with industry to align power supply contracts (such as adaptable or aggregated Purchase Power Agreements (PPAs) with national decarbonization targets and timelines.
  • Set adjustments for solar power on-grid pricing through schemes such as feed-in tariffs, renewable energy auctions, or other guaranteed pricing methods for solar energy.
  • Offer incentives to manufacturers, operators, developers, and other relevant actors, such as subsidies, feed-in tariffs, auctions, tax credits, and contracts-for-difference; as the market matures and becomes competitive, gradually reduce these incentives to create long-term market stability.
  • Implement carbon taxes and remove subsidies from fossil fuel infrastructure; redirect those funds into renewable energy.
  • Consider using green bonds to finance public projects and/or de-risk markets.
  • Invest in and subsidize improvements to grid integration and flexibility, storage, and transmission infrastructure to manage variable generation; deploy smart grid technologies.
  • Work with industry to diversify supply chains; design incentives and policies to stimulate local or regional production and advance R&D.
  • Provide incentives for consumers to adjust energy use in response to renewable availability and grid conditions, such as through dynamic or demand-responsive pricing models that complement solar PV generation and support decarbonization.
  • Earmark a percentage of financial incentives for low- and middle-income communities and/or countries.
  • Improve labor and human rights laws and environmental standards around solar PV supply chains; enforce standards with industry – particularly for the extraction and use of critical minerals and panel manufacturing.
  • Co-design utility-scale solar projects with the local community; ensure the community engagement process starts early and is transparent, inclusive, and ongoing; solicit feedback from the local community – including from opposition groups – on location, design, finance, and mitigation; ensure finalized projects address relevant sociological, agricultural, and ecological considerations.
  • Ensure projects operating in or with Indigenous communities only do so under free, prior, and informed consent; codify free, prior, and informed consent into legal systems.
  • Encourage utility-scale solar projects to distribute benefits to the local community, such as reduced utility rates; encourage developers to use Community Benefit Agreements (CBAs).
  • Create and/or incentivize pathways for community solar projects, such as community-shared and cooperative business models.
  • Regulate zoning and distance from existing houses, communities, and villages to prevent enclosing these spaces or interfering with the quality of life for local residents; avoid developing on sensitive ecosystems, such as wetlands and forests; require assessments and techniques to protect against negative impacts on biodiversity.
  • Ensure strong quality control requirements for all stages of deployment including resource extraction, manufacturing, installation, maintenance, and end-of-life service; create certification programs for each stage of the process.
  • Work with the private sector to develop workforce training programs, ensuring capacity development for all stages of deployment – including end-of-life services.
  • Ensure strong regulations are in place for end-of-life services; enact Extended Producer Responsibility (EPR) for manufacturers; work with industry to foster a market for used, refurbished, and recycled panels.
  • Join, create, or participate in public-private partnerships dedicated to de-risking markets, deployment, technology transfers, education, and other relevant areas.
  • Establish one-stop-shop educational programs that use online and in-person methods to educate the industry and public on regulations, the benefits of solar, best practices for development, and other relevant information: ensure the material is sufficient and appropriate for local contexts, paying particularly close attention to language barriers. 

Further information:

Practitioners

  • Enter into long-term flexible industry agreements, such as PPAs, with both public and private sectors.
  • If possible, work with government bodies, companies, and large institutions to provide renewable energy directly to their operations.
  • Take advantage of government incentives such as subsidies, feed-in tariffs, auctions, tax credits, and contracts-for-difference; as the market matures and becomes competitive, seek to gradually reduce reliance on these incentives to create long-term market stability.
  • Consider using green bonds to finance public projects or de-risk markets.
  • Invest in strengthening grid integration and flexibility through expanded energy storage, upgraded transmission infrastructure, and the deployment of smart grid technologies to effectively manage variable renewable generation.
  • Work with the public sector to diversify supply chains; take advantage of incentives and policies that stimulate local or regional production and advance R&D.
  • Ensure supply chains comply with international labor and human rights laws and standards – particularly, for the extraction of critical minerals and panel manufacturing.
  • Co-design utility-scale solar projects with the local community; ensure the community engagement process starts early and is transparent, inclusive, and ongoing; solicit feedback from the local community – including from opposition groups – on location, design, finance, and mitigation; ensure finalized projects address relevant sociological, agricultural, and ecological considerations.
  • Ensure projects operating in or with Indigenous communities only do so under free, prior, and informed consent; incorporate free, prior, and informed consent into bylaws and/or procedures.
  • Design utility-scale solar projects to support the development of the local community such as reduced utility rates; utilize CBAs.
  • Ensure development is a safe distance from existing houses, communities, and villages to prevent enclosing these spaces or interfering with the quality of life for local residents; avoid developing on sensitive ecosystems, such as wetlands and forests; conduct assessments and deploy techniques to protect negative impacts on biodiversity.
  • Seek to decarbonize the full life cycle including supply chains, production, installation, recycling, and disposal as much as possible.
  • Ensure strong quality control for all stages of deployment, including resource extraction, manufacturing, installation, maintenance, and end-of-life service.
  • Work with the public sector and private organizations to develop workforce training programs, ensuring capacity development for all stages of deployment – including end-of-life services.
  • Adhere to regulations regarding end-of-life servicing; adopt extended producer responsibility and high-integrity end-of-life servicing standards if no policy framework exists.
  • Use bifacial modules, tracking systems, and improved maintenance practices, such as dry-cleaning, when beneficial.
  • Invest directly into and help develop recycling infrastructure for solar panels.
  • Participate in, offer, or explore co-investments in electricity infrastructure (e.g., shared transmission).
  • Grant access to researchers and offer data, when possible, to advance deployment and refine best practices.
  • Participate in voluntary agreements with government bodies to increase policy support for solar capacity and power generation.
  • Stay abreast of and engage with changing policies, regulations, zoning laws, tax incentives, and related developments to help remove commercial barriers.
  • Join, create, or participate in public-private partnerships dedicated to de-risking markets, deployment, technology transfers, education, and other relevant areas.

Further information:

Business Leaders

  • Set ambitious long term renewable energy goals, incorporate them into corporate net zero strategies.
  • Enter into PPAs, long-term contracts between a company (the buyer) and a renewable energy producer (the seller).
  • Support long-term, stable contracts (e.g., PPAs or contracts for difference) that de-risk investment in solar technologies and incentivize local supply chain development.
  • Take advantage of government incentives, such as tax credits, if possible; seek to gradually reduce reliance on these incentives to create long-term market stability.
  • Purchase high-integrity renewable energy certificates (RECs) for solar energy; help create transparent, verified, and reliable REC markets.
  • Invest in companies that produce, deploy, or provide end-of-life servicing for solar panels; seek to diversify and localize supply chains.
  • Invest in R&D and related technology.
  • Support workforce development programs, offer employee scholarships, and/or sponsor training for careers in solar power; ensuring capacity development for all stages of deployment – including end-of-life services.
  • Participate in community engagement processes and co-design utility-scale solar projects with the local community; help educate the public and highlight the local economic benefits of solar and renewable energy.
  • Offer pro bono business advice or general support for community solar projects, such as community-shared and cooperative business models.
  • Join, create, or participate in public-private partnerships dedicated to de-risking markets, deployment, technology transfers, education, and other relevant areas.

Further information:

Nonprofit Leaders

  • Advocate for ambitious long-term national goals on solar and renewable energy; advocate to incorporate them into national climate plans and multilateral agreements.
  • Operate or help with equipment testing and certification systems, market information disclosures, and onsite supervision.
  • Coordinate voluntary agreements between governments and industry to increase utility-scale solar capacity and power generation.
  • Conduct open-access research to improve the performance of solar PVs, forecasting, and related technologies.
  • Advocate for strong regulatory frameworks that are also accessible and timely; recommend coordinated solar power policies – both horizontally (e.g., across agencies) and vertically (e.g., across subnational, national, and international efforts); help align social and environmental safeguards and pursue streamlined permitting processes.
  • Urge governments to provide incentives to manufacturers, operators, developers, and other relevant actors, such as subsidies, feed-in tariffs, auctions, tax credits, and contracts-for-difference; recommend gradual reductions of these incentives to create long-term market stability.
  • Campaign for public investments in improvements to grid integration and flexibility, storage, and transmission infrastructure to manage variable generation.
  • Call for a percentage of public financing to be earmarked for low- and middle-income communities and/or countries.
  • Help improve enforcement of labor and human rights laws and standards around solar PV supply chains – particularly for the extraction and use of critical minerals.
  • Call on governments and developers to use transparent, inclusive, and ongoing community engagement processes to co-design utility-scale solar installations; help solicit community feedback on location, design, finance, mitigation, and distribution of benefits; help ensure finalized projects address relevant sociological, agricultural, and ecological considerations.
  • Advocate and/or support for the use of free, prior, and informed consent with projects operating in or with Indigenous communities; advocate to codify free, prior, and informed consent into legal systems.
  • Advocate for distributed benefits to the local community from utility-scale solar projects, such as reduced utility rates; encourage developers to use CBAs.
  • Help create or support community solar projects, such as community-shared, third-party-owned, and cooperative business models.
  • Advocate for zoning laws to prevent enclosing communities or interfering with the quality of life for local residents; help developers avoid sensitive ecosystems, such as wetlands and forests; conduct site assessments and offer recommendations to prevent or mitigate negative impacts on biodiversity.
  • Create resources and/or standards to improve quality control for all stages of deployment, including resource extraction, manufacturing, installation, maintenance, and end-of-life service; create and/or administer certification programs for each stage of the process.
  • Work with the public and private sectors to develop workforce training programs, ensuring capacity development for all stages of deployment – including end-of-life services.
  • Urge governments and industry to adopt strong regulations for end-of-life services; call for extended producer responsibility; work with industry to foster a market for used, refurbished, or recycled panels.
  • Advocate for carbon taxes and the removal of subsidies from fossil fuel infrastructure; recommend those funds be redirected into renewable energy.
  • Join, create, or participate in public-private partnerships dedicated to de-risking markets, deployment, technology transfers, education, and other relevant areas.
  • Establish one-stop-shop educational programs that use online and in-person methods to educate the industry and public on regulations, the benefits of solar, best practices for development, and other relevant information; ensure the material is sufficient and appropriate for local contexts, paying particularly close attention to language barriers. 

Further information:

Investors

  • Offer low-interest loans and concessional financing for manufacturers, developers, operators, and recyclers.
  • Invest directly in the development of utility-scale solar projects; ensure projects include community engagement processes, seek to distribute benefits, and operate under free, prior, and informed consent when working with Indigenous communities.
  • Invest in companies that produce, deploy, or provide end-of-life servicing for solar panels; seek to diversify and localize supply chains.
  • Invest in supporting infrastructures, such as utility companies, grid development, and access roads.
  • Invest in green bonds and/or explore blended finance structures to mobilize capital for companies developing solar energy or supporting infrastructure.
  • Invest in the recycling infrastructure for solar panels and circular supply chains.
  • Invest in R&D, component technology, and related science, such as forecasting.
  • Help de-risk energy transitions in low- and middle-income countries by offering low-interest loans, concessional financing, and/or favorable terms.
  • Align investments with existing public-private partnerships, voluntary agreements, or voluntary guidance that may apply in the location of the investment (including those that apply to biodiversity).

Further information:

Philanthropists and International Aid Agencies

  • Provide catalytic financing for, or help develop, utility-scale solar projects.
  • Award grants to improve supporting infrastructures, such as utility companies, grid development, and access roads.
  • Support the development of component technology and related science, such as forecasting.
  • Award grants to improve the recycling infrastructure for solar panels and build circular supply chains.
  • Facilitate partnerships to share solar technology and best practices between established and emerging markets, promoting energy equity and access.
  • Foster cooperation and technology transfer between low- and middle-income countries with emerging solar sectors.
  • Award grants to enhance grid integration, flexibility, and reliability by supporting innovations in energy storage systems, advanced grid management, and transmission infrastructure that enable effective integration of solar PV generation.
  • Advocate for ambitious long-term national goals on solar and renewable energy; advocate to incorporate them into national climate plans and multilateral agreements.
  • Operate, fund, or support equipment testing and certification systems, market information disclosures, and onsite supervision.
  • Coordinate voluntary agreements between governments and industry to increase utility-scale solar capacity and power generation.
  • Conduct open-access research to improve the performance of solar PVs, forecasting, and related technologies.
  • Advocate for strong regulatory frameworks that are also accessible and timely; recommend coordinated solar power policies – both horizontally (e.g., across agencies) and vertically (e.g., across subnational, national, and international efforts); help align social and environmental safeguards and pursue streamlined permitting processes.
  • Advocate for a percentage of public financing to be earmarked for low- and middle-income communities and/or countries.
  • Help improve enforcement of labor and human rights laws and standards around solar PV supply chains – particularly for the extraction and use of critical minerals.
  • Call on governments and developers to use transparent, inclusive, and ongoing community engagement processes to co-design utility-scale solar installations; help solicit community feedback on location, design, finance, mitigation, and distribution of benefits; help ensure finalized projects address relevant sociological, agricultural, and ecological considerations.
  • Champion and/or support for the use of free, prior, and informed consent with projects operating in or with Indigenous communities; advocate to codify free, prior, and informed consent into legal systems.
  • Advocate for distributed benefits to the local community from utility-scale solar projects, such as reduced utility rates; encourage developers to use CBAs.
  • Help create or support community solar projects, such as community-shared and cooperative business models.
  • Create resources and/or standards to improve quality control for all stages of deployment, including resource extraction, manufacturing, installation, maintenance, and end-of-life service; create and/or administer certification programs for each stage of the process.
  • Work with the public and private sectors to develop workforce training programs; ensuring capacity development for all stages of deployment – including end-of-life services.
  • Urge governments and industry to adopt strong regulations for end-of-life services; call for extended producer responsibility; work with industry to foster a market for used, refurbished, or recycled panels.
  • Join, create, or participate in public-private partnerships dedicated to de-risking markets, deployment, technology transfers, education, and other relevant areas.
  • Establish one-stop-shop educational programs that use online and in-person methods to educate the industry and public on regulations, the benefits of solar, best practices for development, and other relevant information; ensure the material is sufficient and appropriate for local contexts, paying particularly close attention to language barriers. 

Further information:

Further information: 

Thought Leaders

  • Advocate for ambitious long-term national goals on solar and renewable energy; advocate to incorporate them into national climate plans and multilateral agreements.
  • Operate or help with equipment testing and certification systems, market information disclosures, and onsite supervision.
  • Conduct open-access research to improve the performance of solar PVs, forecasting, and related technologies.
  • Advocate for strong regulatory frameworks that are also accessible and timely; recommend coordinated solar power policies – both horizontally (e.g., across agencies) and vertically (e.g., across subnational, national, and international efforts); help align social and environmental safeguards and pursue streamlined permitting processes.
  • Urge governments to provide incentives to manufacturers, operators, developers, and other relevant actors, such as subsidies, feed-in tariffs, auctions, tax credits, and contracts-for-difference; recommend gradual reductions of these incentives to create long-term market stability.
  • Campaign for public investments in improvements to grid integration and flexibility, storage, and transmission infrastructure to manage variable generation.
  • Advocate for a percentage of public financing to be earmarked for low- and middle-income communities and/or countries.
  • Help improve enforcement of labor and human rights laws and standards around solar PV supply chains – particularly for the extraction and use of critical minerals.
  • Call on governments and developers to use transparent, inclusive, and ongoing community engagement processes to co-design utility-scale solar installations; help solicit community feedback on location, design, finance, mitigation, and distribution of benefits; help ensure finalized projects address relevant sociological, agricultural, and ecological considerations.
  • Champion and/or support for the use of free, prior, and informed consent with projects operating in or with Indigenous communities; advocate to codify free, prior, and informed consent into legal systems.
  • Advocate for distributed benefits to the local community from utility-scale solar projects, such as reduced utility rates; encourage developers to use CBAs.
  • Help create or support community solar projects, such as community-shared, third-party-owned, and cooperative business models.
  • Advocate for strong regulations for end-of-life services; advocate for extended producer responsibility; work with industry to foster a market for used, refurbished, or recycled panels.
  • Advocate for carbon taxes and the removal of subsidies from fossil fuel infrastructure; recommend those funds be redirected into renewable energy.
  • Join, create, or participate in public-private partnerships dedicated to de-risking markets, deployment, technology transfers, education, and other relevant areas.
  • Establish one-stop-shop educational programs that use online and in-person methods to educate the industry and public on regulations, the benefits of solar, best practices for development, and other relevant information; ensure the material is sufficient and appropriate for local contexts, paying particularly close attention to language barriers. 

Further information:

Technologists and Researchers

  • Continue advancing the performance of monocrystalline and polycrystalline silicon cells.
  • Continue advancing bifacial module designs and next-generation solar cell technologies, including perovskite-silicon tandem cells, organic photovoltaics, dye-sensitized solar cells, and passivated emitter and rear contact cells.
  • Advance energy storage systems technologies, such as battery, hydrogen, gravity-based, and other energy storage systems.
  • Improve manufacturing efficiencies, such as larger wafer formats, improved cell architectures, and advanced wafer processing techniques.
  • Continue developing agrivoltaics; improve scientific understanding of water drainage, runoff, and erosion under and near utility-scale solar PV; develop relevant best practices.
  • Advance technologies for floating solar PV installations; seek scalable solutions relevant for utility-scale.
  • Improve recycling infrastructure and scalable technologies to repair, reuse, or recover materials from solar panels.
  • Create more heat-tolerant PV technologies and systems to reduce heat exposure and/or absorption.
  • Create better protection and cleaning systems for PV to preserve functionality during extreme weather and in extreme environments, particularly in deserts.
  • Improve related mining technologies for critical minerals to be safer, less disruptive to local communities and ecosystems, and less energy-intensive.
  • Develop ways of eliminating, reducing, reusing, and/or safely disposing of hazardous byproducts of the PV manufacturing process.
  • Research and develop analytical tools for land allocation and development, taking into account human rights, environmental concerns, energy needs, agricultural demands, and other relevant factors, such as changing weather patterns.
  • Research factors that lead to community acceptance and energy justice for utility-scale solar.
  • Research the impact of utility-scale solar on biodiversity – particularly mammals, amphibians, reptiles, and microorganisms; examine methods to mitigate impacts on biodiversity; research optimal land allocation strategies, comparisons between installation methods and operations, best practices, and the potential for solar installations to provide habitats to some native species; examine relationship with and impacts on invasive species.
  • Research the impacts of floating PV installations on biodiversity – particularly terrestrial or semi-aquatic species.

Further information:

Communities, Households, and Individuals

  • Purchase high-integrity RECs, which track ownership of renewable energy generation.
  • If your utility company offers transparent green pricing – which charges a premium to cover the extra cost of renewable energy – and if it fits your budget, opt into it.
  • Help create or support community solar projects, such as community-shared, third-party-owned, and cooperative business models.
  • Call on governments and developers to use transparent, inclusive, and ongoing community engagement processes; participate in these processes when possible to co-design utility-scale solar installations; provide and help collect feedback on location, design, finance, mitigation, and distribution of benefits; help ensure finalized projects address relevant sociological, agricultural, and ecological considerations.
  • Advocate for a percentage of public financing to be earmarked for low- and middle-income communities and/or countries.
  • Champion and/or support for the use of free, prior, and informed consent with projects operating in or with Indigenous communities; advocate to codify free, prior, and informed consent into legal systems.
  • Advocate for distributed benefits to the local community from utility-scale solar projects, such as reduced utility rates; encourage developers to use CBAs.
  • Participate in public awareness campaigns focused on solar projects; share information with your community and networks.

Further information:

“Take Action” Sources

Evidence Base

Consensus of effectiveness of utility-scale solar PV in reducing greenhouse gas emissions: High

Utility-scale solar PV is firmly established as an efficient and effective electricity source. Increasing availability of energy produced from PV reduces the need for fossil fuel–derived energy sources such as coal and gas, leading to lower GHG emissions from the global electricity sector. The evidence base for utility-scale solar PV is robust and a wide range of peer-reviewed studies, international energy outlooks, and meta-analyses converge on the conclusion that solar PV is a cornerstone of sustainable global energy production. The IPCC (IPCC, 2023) identifies solar PV as indispensable in all mitigation scenarios, while the IEA’s World Energy Outlook 2024 (IEA, 2024a) highlights PV as the largest single source of electricity in net-zero aligned pathways. Similarly, IRENA documents how rapid cost declines, performance improvements, and policy support have enabled utility-scale solar PV to become one of the cheapest sources of new electricity in many regions (IRENA, 2025). Utility-scale solar PV projects have particularly benefited from economies of scale and competitive auctions, accelerating their role in global electricity markets (DNV, 2024; Masson et al., 2024).

The technical potential of solar PV refers to the maximum electricity generation achievable given solar resource availability, constrained only by physical and technological factors. Meta-analyses reveal wide ranges from 101 PWh/yr to more than 13,600 PWh/yr (de La Beaumelle et al., 2023). With only 1.29 PWh generated from solar PV in 2023, the sector is still far from its potential ceiling due to multiple barriers (IEA, 2024b). 

Integration into power systems requires significant investment in grid flexibility, storage, and transmission infrastructure to manage variable generation (Frew et al., 2021; IEA-ETSAP & IRENA, 2015; Tambari et al., 2020). Financing barriers, particularly in Africa and parts of the Global South, remain critical, with high capital costs and policy uncertainty slowing adoption despite abundant solar resource (Dato et al., 2025). 

Notwithstanding, there is high scientific agreement on the effectiveness of utility-scale solar PV as a core climate solution. The results presented here summarize findings from 11 reviews/meta-analyses, 45 research articles, and 25 institutional reports, covering evidence from different parts of the world. We acknowledge potential underrepresentation of insights from sub-Saharan Africa and Latin America, which could introduce regional bias in those regions where utility-scale solar PV deployment potential remains substantially underdeveloped.

Updated Date
Coming Soon Label
Coming Soon

Deploy LED Lighting

Sector
Electricity
Image
Image
Office building exterior showing many floors of indoor lit offices
Coming Soon
Off

Key Takeaways

  • Lighting indoor and outdoor spaces globally accounts for about 20% of the electricity used in buildings annually.
  • LEDs have a power rating 3–10 times lower than other lighting options. 
  • Substituting LED lighting for other lighting sources reduces GHG emissions from burning fossil fuels to generate electricity.
  • Deploying LED lighting globally can help avoid CO₂, methane, and nitrous oxide emissions, reducing GHG generation up to 0.65 Gt CO₂‑eq/yr.
  • Deploying LED lighting not only mitigates climate change, it also reduces air pollution and its associated health risks and helps to enhance visual and occupant well-being.


Summary

We define the Deploy LED Lighting solution as replacing energy-inefficient light sources with light-emitting diodes (LEDs). Lighting accounts for 15–20% of electricity use in buildings. Using LEDs reduces the electricity that building lighting consumes, and thereby cuts GHG emissions from global electricity generation.

Description for Social and Search
Using LEDs reduces the electricity that building lighting consumes, and thereby cuts GHG emissions from global electricity generation.
Overview

LED technology for lighting indoor and outdoor spaces is more energy-efficient than other lighting sources currently on the market (Zissis et al., 2021). This is because LEDs are solid-state semiconductors that emit light generated through a direct conversion of the flow of electricity (electroluminescence) rather than heating a tungsten filament to make it glow. More of the electrical energy goes to producing light in an LED lamp than in less-efficient alternative lighting technologies such as incandescent light bulbs or compact fluorescent lamps (CFLs) (Koretsky, 2021; Nair & Dhoble, 2021a). This difference offers significant energy-efficiency gains (see Figure 1).

Globally, lighting-related electricity consumption can account for as much as 20% of the total annual electricity used in buildings (Gayral, 2017; Pompei et al., 2020; Pompei et al., 2022). In 2022, the IEA estimated that total electricity consumption for lighting buildings globally was 1,736 TWh (Lane, 2023). Schleich et al. (2014) and others have argued that buildings consume more electricity for lighting due to a rebound effect when occupants perceive a lighting source as efficient. However, the growing adoption of LED lighting over the years has significantly optimized electricity consumption from building lighting, especially in residential buildings (Lane, 2023).

According to the Intergovernmental Panel on Climate Change (IPCC, 2006), generating electricity from fossil fuels emits CO₂,  methane, and nitrous oxide. Replacing inefficient lamps with LEDs cuts these emissions by reducing electricity demand. LEDs often have a power rating of 4–10 W, which is 3–10 times lower than alternatives. LEDs also last significantly longer: With a lifespan that can exceed 25,000 hours, they vastly outperform incandescent bulbs (1,000 hours) and CFLs (10,000 hours), as shown in Figure 1. LED’s longevity leads to potential long-term savings due to fewer replacements. The amount of light produced per energy input (luminous efficacy) is up to 10 times greater than alternative lighting sources. This means substantially more lighting for less energy.

Figure 1. A comparison of light sources for building lighting (data from Lane, 2023; Mathias et al., 2023; Nair & Dhoble, 2021b; Xu, 2019).

Light source type Power rating (watts) Luminous efficacy (lumens/watt) Lifespan (hours)
Incandescent 40–100 10–15 1,000
CFL 12–20 60–63 10,000
LED 4–10 110–150 25,000–100,000

The International Energy Agency (IEA) and other international bodies report LED market penetration in terms of percentages of the global lighting market (Lane, 2023). We chose this approach to track the impact of adopting LEDs.

Take Action Intro

Would you like to help deploy LED lighting? Below are some ways you can make a difference, depending on the roles you play in your professional or personal life.

These actions are meant to be starting points for involvement and may or may not be the most important, impactful, or doable actions you can take. We encourage you to explore, get creative, and take a step that is right for you!

References

Albatayneh, A., Juaidi, A., Abdallah, R., & Manzano-Agugliaro, F. (2021). Influence of the advancement in the LED lighting technologies on the optimum windows-to-wall ratio of Jordanians residential buildings. Energies, 14(17), 5446. Link to source: https://www.mdpi.com/1996-1073/14/17/5446

Amann, J. T., Fadie, B., Mauer, J., Swaroop, K., & Tolentino, C. (2022). Farewell to fluorescent lighting: How a phaseout can cut mercury pollution, protect the climate, and save money. Link to source: https://www.aceee.org/research-report/b2202

Behar-Cohen, F., Martinsons, C., Viénot, F., Zissis, G., Barlier-Salsi, A., Cesarini, J. P.,Enouf, O., Garcia, M., Picaud, S., & Attia, D.. (2011). Light-emitting diodes (LED) for domestic lighting: Any risks for the eye? Progress in Retinal and Eye Research, 30(4), 239–257. Link to source: https://doi.org/10.1016/j.preteyeres.2011.04.002

Booysen, M. J., Samuels, J. A., & Grobbelaar, S. S. (2021). LED there be light: The impact of replacing lights at schools in South Africa. Energy and Buildings, 235, 110736. Link to source: https://doi.org/10.1016/j.enbuild.2021.110736

Bose-O'Reilly, S., McCarty, K. M., Steckling, N., & Lettmeier, B. (2010). Mercury exposure and children's health. Current Problems in Pediatric and Adolescent Health Care, 40(8), 186–215. Link to source: https://doi.org/10.1016/j.cppeds.2010.07.002

Build Up. (2019). Overview_Decarbonising the non-residential building stock. European Commission. Retrieved 05 March 2025 from Link to source: https://build-up.ec.europa.eu/en/resources-and-tools/articles/overview-decarbonising-non-residential-building-stock

Cenci, M. P., Dal Berto, F. C., Schneider, E. L., & Veit, H. M. (2020). Assessment of LED lamps components and materials for a recycling perspective. Waste Management, 107, 285-293. Link to source: https://doi.org/10.1016/j.wasman.2020.04.028

Environmental Protection Agency (EPA). (2024). Power sector programs - progress report. Link to source: https://www.epa.gov/power-sector/progress-report

Forastiere, S., Piselli, C., Silei, A., Sciurpi, F., Pisello, A. L., Cotana, F., & Balocco, C. (2024). Energy efficiency and sustainability in food retail buildings: Introducing a novel assessment framework. Energies, 17(19), 4882. Link to source: https://www.mdpi.com/1996-1073/17/19/4882

Fu, X., Feng, D., Jiang, X., & Wu, T. (2023). The effect of correlated color temperature and illumination level of LED lighting on visual comfort during sustained attention activities. Sustainability, 15(4), 3826. Link to source: https://www.mdpi.com/2071-1050/15/4/3826

Gao, W., Sun, Z., Wu, Y., Song, J., Tao, T., Chen, F., Zhang, Y., & Cao, H.(2022). Criticality assessment of metal resources for light-emitting diode (LED) production – a case study in China. Cleaner Engineering and Technology, 6, 100380. Link to source: https://doi.org/10.1016/j.clet.2021.100380

Gasparotto, J., & Da Boit Martinello, K. (2021). Coal as an energy source and its impacts on human health. Energy Geoscience, 2(2), 113–120. Link to source: https://doi.org/10.1016/j.engeos.2020.07.003

Gayral, B. (2017). LEDs for lighting: Basic physics and prospects for energy savings. Comptes Rendus Physique, 18(7), 453–461. Link to source: https://doi.org/10.1016/j.crhy.2017.09.001

Hasan, M. M., Moznuzzaman, M., Shaha, A., & Khan, I. (2025). Enhancing energy efficiency in Bangladesh's readymade garment sector: The untapped potential of LED lighting retrofits. International Journal of Energy Sector Management, 19(3), 569–588. Link to source: https://doi.org/10.1108/ijesm-05-2024-0009

Henneman, L., Choirat, C., Dedoussi, I., Dominici, F., Roberts, J., & Zigler, C. (2023). Mortality risk from United States coal electricity generation. 382(6673), 941–946. Link to source: https://doi.org/doi:10.1126/science.adf4915

Intergovernmental Panel on Climate Change (IPCC). (2006). 2006 IPCC guidelines for national greenhouse gas inventories volume 2: Energy; Chapter 2: Stationary combustion. Link to source: https://www.ipcc-nggip.iges.or.jp/public/2006gl/pdf/2_Volume2/V2_2_Ch2_Stationary_Combustion.pdf

International Energy Agency (IEA). (2022). Targeting 100% LED lighting sales by 2025. Link to source: https://www.iea.org/reports/targeting-100-led-lighting-sales-by-2025

International Energy Agency (IEA). (2023). Global floor area and buildings energy intensity in the net zero scenario, 2010-2030. Retrieved 06 March 2025 from Link to source: https://www.iea.org/data-and-statistics/charts/global-floor-area-and-buildings-energy-intensity-in-the-net-zero-scenario-2010-2030

International Energy Agency (IEA). (2024). World energy balances. IEA. Link to source: https://www.iea.org/data-and-statistics/data-product/world-energy-balances

Iskra-Golec, I., Wazna, A., & Smith, L. (2012). Effects of blue-enriched light on the daily course of mood, sleepiness and light perception: A field experiment. 44(4), 506-513. Link to source: https://doi.org/10.1177/1477153512447528

Kamat, A. S., Khosla, R., & Narayanamurti, V. (2020). Illuminating homes with LEDs in India: Rapid market creation towards low-carbon technology transition in a developing country. Energy Research & Social Science, 66, 101488. Link to source: https://doi.org/10.1016/j.erss.2020.101488

Khan, N., & Abas, N. (2011). Comparative study of energy saving light sources. Renewable and Sustainable Energy Reviews, 15(1), 296–309. Link to source: https://doi.org/10.1016/j.rser.2010.07.072

Koretsky, Z. (2021). Phasing out an embedded technology: Insights from banning the incandescent light bulb in europe. Energy Research & Social Science, 82, 102310. Link to source: https://doi.org/10.1016/j.erss.2021.102310

Lane, K. (2023, 11 July 2023). Lighting. International Energy Agency (IEA). Retrieved 13 December 2024 from Link to source: https://www.iea.org/energy-system/buildings/lighting

Lee, K., Donnelly, S., & Phillips, G. (2024). 2020 U.S. Lighting market characterization. Link to source: https://www.osti.gov/biblio/2371534

Lee, K., Nubbe, V., Rego, B., Hansen, M., & Pattison, M. (2021). 2020 LED manufacturing supply chain. U. S. DOE. Link to source: https://www.energy.gov/sites/default/files/2021-05/ssl-2020-led-mfg-supply-chain-mar21.pdf

Mathias, J. A., Juenger, K. M., & Horton, J. J. (2023). Advances in the energy efficiency of residential appliances in the US: A review. Energy Efficiency, 16(5), 34. Link to source: https://doi.org/10.1007/s12053-023-10114-8

Miah, M. A. R., & Kabir, R. (2023). Energy savings forecast for solid-state lighting in residential and commercial buildings in Bangladesh. IEEE PES 15th Asia-Pacific Power and Energy Engineering Conference (APPEEC), pp. 1-6. Link to source: https://doi.org/10.1109/APPEEC57400.2023.10561921

Moadab, N. H., Olsson, T., Fischl, G., & Aries, M. (2021). Smart versus conventional lighting in apartments - electric lighting energy consumption simulation for three different households. Energy and Buildings, 244, 111009. Link to source: https://doi.org/10.1016/j.enbuild.2021.111009

Moyano, D. B., Moyano, S. B., López, M. G., Aznal, A. S., & Lezcano, R. A. G. (2020). Nominal risk analysis of the blue light from LED luminaires in indoor lighting design. Optik, 223, 165599. Link to source: https://doi.org/10.1016/j.ijleo.2020.165599

Nair, G. B., & Dhoble, S. J. (2021a). 2 - fundamentals of LEDs. In G. B. Nair & S. J. Dhoble (Eds.), The fundamentals and applications of light-emitting diodes (pp. 35–57). Woodhead Publishing. Link to source: https://doi.org/10.1016/B978-0-12-819605-2.00002-1

Nair, G. B., & Dhoble, S. J. (2021b). 6 - general lighting. In G. B. Nair & S. J. Dhoble (Eds.), The fundamentals and applications of light-emitting diodes (pp. 155–176). Woodhead Publishing. Link to source: https://doi.org/10.1016/B978-0-12-819605-2.00006-9

Pattison, M., Hansen, M., Bardsley, N., Elliott, C., Lee, K., Pattison, L., & Tsao, J. (2020). 2019 lighting R&D opportunities. Link to source: https://www.osti.gov/biblio/1618035

Periyannan, E., Ramachandra, T., & Geekiyanage, D. (2023). Assessment of costs and benefits of green retrofit technologies: Case study of hotel buildings in Sri Lanka. Journal of Building Engineering, 78, 107631. Link to source: https://doi.org/10.1016/j.jobe.2023.107631

Placek, M. (2023). LED lighting in the United States - statistics & facts. Statista. Retrieved 09 February 2025 from Link to source: https://www.statista.com/topics/1144/led-lighting-in-the-us/#topicOverview

Pompei, L., Blaso, L., Fumagalli, S., & Bisegna, F. (2022). The impact of key parameters on the energy requirements for artificial lighting in Italian buildings based on standard en 15193-1:2017. Energy and Buildings, 263, 112025. Link to source: https://doi.org/10.1016/j.enbuild.2022.112025

Pompei, L., Mattoni, B., Bisegna, F., Blaso, L., & Fumagalli, S. (2020, 9–12 June 2020). Evaluation of the energy consumption of an educational building, based on the uni en 15193–1:2017, varying different lighting control systems. 2020 IEEE International Conference on Environment and Electrical Engineering and 2020 IEEE Industrial and Commercial Power Systems Europe (EEEIC / I&CPS Europe), Madrid, Spain, 2020, pp. 1-6. Link to source: https://doi.org/10.1109/EEEIC/ICPSEurope49358.2020.9160588

Sarigiannis, D. A., Karakitsios, S. P., Antonakopoulou, M. P., & Gotti, A. (2012). Exposure analysis of accidental release of mercury from compact fluorescent lamps (CFLs). Science of The Total Environment, 435–436, 306–315. Link to source: https://doi.org/10.1016/j.scitotenv.2012.07.026

Saunders, H. D., & Tsao, J. Y. (2012). Rebound effects for lighting. Energy Policy, 49, 477-478. Link to source: https://doi.org/10.1016/j.enpol.2012.06.050

Schleich, J., Mills, B., & Dütschke, E. (2014). A brighter future? Quantifying the rebound effect in energy efficient lighting. Energy Policy, 72, 35–42. Link to source: https://doi.org/10.1016/j.enpol.2014.04.028

Schratz, M., Gupta, C., Struhs, T. J., & Gray, K. (2016). A new way to see the light: Improving light quality with cost-effective led technology. IEEE Industry Applications Magazine, 22(4), 55–62. Link to source: https://doi.org/10.1109/MIAS.2015.2459089

United Nations Industrial Development Organization (UNIDO). (2021). SADC member states welcome the introduction of new efficient lighting standards. UNIDO. Retrieved 05 March 2025 from Link to source: https://www.unido.org/news/sadc-member-states-welcome-introduction-new-efficient-lighting-standards

U.S. Department of Energy. (2016). Solid-state lighting R&D plan. Link to source: https://www.energy.gov/sites/prod/files/2016/06/f32/ssl_rd-plan_%20jun2016_2.pdf

U.S. Department of Energy (2024). 2020 U.S. lighting market characterization. Link to source: https://www.energy.gov/sites/default/files/2024-08/ssl-lmc2020_apr24.pdf

World Furniture Online (2017). The lighting fixtures market in Australia and New Zealand. Link to source: https://www.worldfurnitureonline.com/report/the-lighting-fixtures-market-in-australia-and-new-zealand/

Xiong, Y., Guo, H., Nor, D. D. M. M., Song, A., & Dai, L. (2023). Mineral resources depletion, environmental degradation, and exploitation of natural resources: Covid-19 aftereffects. Resources Policy, 85, 103907. Link to source: https://doi.org/10.1016/j.resourpol.2023.103907

Xu, Y. (2019). Chapter 2.1 - nature and source of light for plant factory. In M. Anpo, H. Fukuda, & T. Wada (Eds.), Plant factory using artificial light (pp. 47–69). Elsevier. Link to source: https://doi.org/10.1016/B978-0-12-813973-8.00002-6

Zhang, H., Cai, J., & Braun, J. E. (2023). A whole building life-cycle assessment methodology and its application for carbon footprint analysis of U.S. commercial buildings. Journal of Building Performance Simulation, 16(1), 38–56. Link to source: https://doi.org/10.1080/19401493.2022.2107071

Zissis, G., Bertoldi, P., & Serrenho, T. (2021). Update on the status of LED-lighting world market since 2018. Publications Office of the European Union. Link to source: https://publications.jrc.ec.europa.eu/repository/handle/JRC122760

Credits

Lead Fellow

  • Henry Igugu, Ph.D.

Contributors

  • Ruthie Burrows, Ph.D.

  • James Gerber, Ph.D.

  • Daniel Jasper

  • Alex Sweeney

Internal Reviewers

  • Aiyana Bodi

  • Hannah Henkin

  • Megan Matthews, Ph.D.

  • Ted Otte

  • Amanda D. Smith, Ph.D.

  • Christina Swanson, Ph.D.

Effectiveness

Replacing 1% of the building lighting market with LED lamps avoids approximately 7.09 Mt CO₂‑eq/yr emissions on a 100-yr basis (Table 1) or 7.15 Mt CO₂‑eq/yr on a 20-yr basis.

We estimated this solution’s effectiveness (Table 1) by multiplying the global electricity savings intensity (kWh/%) by an emissions intensity for each GHG emitted (in g/kWh)  due to electricity generation. Using the IEA (2024)’s energy balances data, we estimated emissions intensities of approximately 529 g/kWh for CO₂, 0.07 g/kWh for methane, and 0.01 g/kWh for nitrous oxide. Country-specific data were limited. Therefore, we developed the savings intensity using the IEA’s adoption trend (%/yr) and electricity consumption reduction (kWh/yr) for residential buildings globally (Lane, 2023). We then scaled up the savings intensity to represent all buildings (since LEDs are applicable in all types of buildings), but we could not find global data specifying the energy savings potential of converting the lighting market in nonresidential buildings to LEDs. Notably, artificial lighting’s energy consumption varies across building types (Moadab et al., 2021) and is typically greater in nonresidential buildings (Build Up, 2019). This presents some level of uncertainty, but also suggests that our estimates could be conservative – and that there is potential for even greater savings in nonresidential buildings.

Table 1. Effectiveness at reducing emissions.

Unit: t CO₂‑eq/% lamps LED/yr, 100-yr basis

Estimate 7090000
Left Text Column Width
Cost

Our lifetime initial cost estimate of switching 1% of the global building lighting market to LEDs is approximately US$1.5 billion. Because LEDs use less electricity than alternative lamps, they cost less to operate, resulting in operating costs of –US$1.3 billion/yr (i.e., cost savings). Building owners typically are not paid to use LED lighting; therefore, the revenue is zero. After we amortize the initial cost over 30 years, the net annual cost for this solution is –US$1.2 billion/yr globally. Thus, replacing other bulbs with LEDs saves money despite the initial cost.

We estimated the cost (Table 2) by first identifying initial and operating costs from studies that retrofitted buildings with LEDs, such as Periyannan et al. (2023), Hasan et al. (2025), and Forastiere et al. (2024). We then divided the costs by the impact of the LED retrofit on the amount of electricity consumed by lighting in each study and multiplied this by the global electricity savings intensity (kWh/%) we estimated during the effectiveness analysis. The result was the cost per percent of lamps in buildings converted to LED lighting (US$/% lamps LED).

We estimated the cost per unit climate impact by dividing the annual cost savings per adoption unit by the CO₂‑eq emissions reduced yearly per adoption unit (Table 2).

Table 2. Cost per unit climate impact.

Unit: 2023 US$/t CO₂‑eq, 100-yr basis

Median -175.0

Negative values reflect cost savings.

Left Text Column Width

Methods and Supporting Data

Learning Curve

As LEDs became more common in building lighting, costs dropped significantly in recent years.

Trends based on LED adoption data (Lane, 2023) and the cost of LED lighting (Pattison et al., 2020) showed a 29.7% drop in cost as LED adoption doubled between 2016 and 2019.

The cost data we used to identify the learning curve for this solution (Table 3) are specific to the United States and limited to pre-2020. More recent LED cost data may show additional benefits with respect to cost, but this value may not be applicable for other countries. However, the cost data we analyzed do provide a useful sample of the broader LED cost-reduction trend.

Table 3. Learning rate: drop in cost per doubling of the installed solution base

Units: %

Estimate 29.7
Left Text Column Width
Speed of Action

Speed of action refers to how quickly a climate solution physically affects the atmosphere after it is deployed. This is different from speed of deployment, which is the pace at which solutions are adopted.

At Project Drawdown, we define the speed of action for each climate solution as emergency brake, gradual, or delayed.

Deploy LED Lighting is a GRADUAL climate solution. It has a steady, linear impact on the atmosphere. The cumulative effect over time builds as a straight line.

Caveats

Our effectiveness analysis is based on the current state of LED technology. If the adoption ceiling is attained, further improvements to the amount of light that LEDs generate per unit electricity could enhance the solution’s impact through further reductions in electricity use.

The rebound effect – where building occupants use more lighting in response to increased energy-efficiency of lamps – is a well-established concern (Saunders and Tsao, 2012; Schleich et al., 2014). We attempted to address this concern by using IEA data on actual electricity consumption originating from building lighting to determine both its effectiveness and cost implications (Lane, 2023).

We did not fully account for the cost savings that potentially arise from fewer bulb replacements, since LEDs may replace various types of lamps. Because LEDs last significantly longer than all alternative lamp technologies, building owners may require fewer replacements when using LED lamps compared with other lighting sources.

Current Adoption

Lane (2023) found that LED lamps represented 50.5% of the lighting market globally for residential buildings in 2022, but does not provide adoption data specific to nonresidential buildings. Studies that provide global or geographically segmented LED adoption data for all building types are also limited. Therefore, we assume 50.5% to be representative of LED adoption across all buildings globally (Table 4).

Other studies highlight adoption levels across various countries. The data captured in these studies and reports provide context with specific adoption levels from different regions (see Geographic Guidance).

The IEA and U.S. Department of Energy (DOE) report that LEDs are increasingly the preferred choice of homeowners and the general building lighting market. This preference is evident in the growing market share of LED lamps sold and installed annually (Lane, 2023; Lee et al., 2024).

In general, the solution’s current adoption globally is substantial, and we recognize that some countries possess more room for the solution to scale. While adoption barriers vary across regions, many countries are establishing lighting standards to drive LED adoption, especially across Africa [(IEA, 2022; United Nations Industrial Development Organization (UNIDO), 2021].

Table 4. Current (2022) adoption level.

Units: % lamps LED

Estimate 50.5
Left Text Column Width
Adoption Trend

Adoption of LEDs has grown approximately 3.75%/yr over the past two decades.

Lane (2023) found that the proportion of lamps sold annually for building lighting that are LEDs grew from 1.1% in 2010 to 50.5% in 2022 (Figure 2). We estimated the adoption trend (Table 5) by determining the percentage growth between successive years, and calculating the variances.

Figure 2. Trend in LED adoption between 2010 and 2022 (adapted from Lane, 2023).

Source: Lane, K. (2023, 11 July 2023). Lighting. International Energy Agency (IEA). Retrieved 13 December 2024 from https://www.iea.org/energy-system/buildings/lighting

Enable Download
On

Data on the growth of LEDs across regional building lighting markets are limited. Lee et al. (2024)’s analysis of the U.S. lighting market found 46.5% growth 2010–2020, which translates to 4.65% annually. Zissis et al. (2021) reported 26% growth for France for 2017–2020, which averages 8.67% annually.

Table 5. 2010–2022 adoption trend.

Units: % lamps LED market share growth/yr

25th percentile 2.85
Mean 4.12
Median (50th percentile) 3.75
75th percentile 5.4
Left Text Column Width
Adoption Ceiling

The adoption ceiling (Table 6) is 100%, meaning all lamps in buildings are LEDs. Lane (2023) projects 100% LED market penetration by 2030. If current adoption trends continue, 100% LED adoption is a practical and achievable upper limit. However, countries will need to overcome challenges such as regulatory enforcement, financial, and technology access issues, while preventing the entrance of inferior quality LEDs into their lighting market (IEA, 2022).

Table 6. Adoption ceiling

Units: % lamps LED

Estimate 100
Left Text Column Width
Achievable Adoption

We estimate a low achievable adoption scenario of 87% based on Statista’s projections about LED lighting market penetration by 2030 (Placek, 2023). The values were similar in Zissis et al. (2021).

For the high achievable scenario, we projected 10 years beyond the 2022 adoption level using the mean adoption trend of 4.12%/yr. This translates to a 41% growth on top of the current adoption level of 50.5%, summing up to a 92% LED adoption level (Table 7).

Table 7. Range of achievable adoption levels.

Unit: % lamps LED

Current adoption 50.5
Achievable – low 87
Achievable – high 92
Adoption ceiling 100
Left Text Column Width

We estimated that current adoption cuts about 0.36 Gt CO₂‑eq emissions on a 100-yr basis compared with the previous alternative lighting sources (Table 8). The low achievable adoption scenario of 87% LED lamps could cut emissions 0.62 Gt CO₂‑eq/yr due to reduced electricity consumption, while a high achievable adoption scenario of 92% LED lamps could cut emissions 0.65 Gt CO₂‑eq/yr. If the adoption ceiling of 100% LEDs for lighting buildings is reached, we estimate that 0.71 Gt CO₂‑eq/yr could be avoided (Table 8).

LED lighting could further cut electricity consumption as LED technology continues to improve. However, the technology’s future climate impacts will depend on the emissions of future electricity-generation systems.

Table 8. Climate impact at different levels of adoption.

Unit: Gt CO₂‑eq/yr, 100-yr basis

Current adoption 0.36
Achievable – low 0.62
Achievable – high 0.65
Adoption ceiling 0.71
Left Text Column Width
Additional Benefits

Income and Work

Because LEDs use less electricity than fluorescent and incandescent light bulbs (Khan & Abas, 2011), households and businesses using LED technology can save money on electricity costs. The payback period for the initial investment from lower utility bills is about one year for residential buildings and about two months for commercial buildings (Amann et al., 2022). LED lighting can contribute to savings by minimizing energy demand for cooling, since LEDs emit less heat than fluorescent and incandescent bulbs (Albatayneh et al., 2021; Schratz et al., 2016). However, it could also lead to a greater need for space heating in some regions. LED lights also last longer than alternative lighting technologies, which can lead to lower maintenance costs (Schratz et al., 2016).

Health

Reductions in air pollution due to LED lighting’s lower electricity demand decrease exposures to pollutants such as mercury and fine particulate matter generated from fossil fuel-based power plants, improving the health of nearby communities [Environmental Protection Agency (EPA), 2024]. These pollutants have been linked to increased morbidity from cardiovascular and respiratory disease, asthma, infections, and cancer, and to increased risk of mortality (Gasparotto & Martinello, 2021; Henneman et al., 2023). Because LEDs do not contain mercury, they can mitigate small health risks associated with mercury exposure when fluorescent light bulbs break (Bose-O’Reilly et al., 2010; Sarigiannis et al., 2012). Switching to LEDs can also enhance a visual environment and improve occupants’ well-being, visual comfort, and overall productivity when lamps with the appropriate lighting quality and correlated color temperature are selected (Fu et al., 2023; Iskra-Golec et al., 2012; Nair & Dhoble, 2021b).

Air and Water Quality

The lower electricity demand of LEDs could help reduce emissions from power plants and improve air quality (Amann et al., 2022). Additionally, LEDs can mitigate small amounts of mercury found in fluorescent lights (Amann et al., 2022). Mercury contamination from discarded bulbs in landfills can leach into surrounding water bodies and accumulate in aquatic life. LEDs also have longer lifespans than fluorescent and incandescent bulbs (Nair & Dhoble, 2021b) which can reduce the amount of discarded bulbs and further mitigate environmental degradation from landfills. 

Risks

We found limited data indicating risks with choosing LEDs over other lighting sources. Concerns about eye health raised in the early days of LED adoption (Behar-Cohen et al., 2011) have been allayed by studies that found that LEDs do not pose a greater risk to the eye than comparable lighting sources (Moyano et al., 2020). 

LED manufacturing uses metals like gold, indium, and gallium (Gao et al., 2022). This creates environmental risks due to mining (Xiong et al., 2023) and makes LED supply chains susceptible to macroeconomic uncertainties (Lee et al., 2021). With growing adoption of LED lights, there is also the risk of greater electronic waste at the end of the LED’s lifespan. Therefore, recycling is increasingly important (Cenci et al., 2020). 

Interactions with Other Solutions

Competing

Some studies demonstrate an increase in the indoor heating requirements when switching to LED lighting from other lighting sources, such as incandescent lamps, that produce more heat than LEDs. The difference is often small, but worth taking into account when adopting LEDs in a building with previously energy-inefficient lighting.

Dashboard

Solution Basics

% lamps LED

t CO₂-eq (100-yr)/unit/yr
7.09×10⁶
units
Current 50.5 08792
Achievable (Low to High)

Climate Impact

Gt CO₂-eq (100-yr)/yr
Current 0.36 0.620.65
US$ per t CO₂-eq
-175
Gradual

CO₂ , CH₄, N₂O

Trade-offs

LED lamp manufacturing creates more emissions than manufacturing other types of lamps. For example, Zhang et al. (2023) compared the manufacturing emissions of a 12.5W LED lamp with a 14W CFL and a 60W incandescent bulb. These light sources provided similar levels of illumination (850–900 lumens). The production of one LED bulb resulted in 9.81 kg CO₂‑eq emissions, while the CFL and incandescent resulted in 2.29 and 0.73 kg CO₂‑eq emissions, respectively. However, LEDs are preferred because their longevity results in fewer LED lamps required to provide the same amount of lighting over time. LEDs can last 25 times longer than incandescent lamps with an identical lumen output (Nair & Dhoble, 2021b; Xu, 2019; Zhang et al., 2023). 

% lamps LED
< 20
20–40
40–60
> 60
No data

Percentage of lamps that are LEDs, circa 2020

The percentage of lamps used to light buildings that are LEDs varies around the world, with limited data available on a per-country basis.

Miah, M. A. R., & Kabir, R. (2023). Energy savings forecast for solid-state lighting in residential and commercial buildings in Bangladesh. IEEE PES 15th Asia-Pacific Power and Energy Engineering Conference (APPEEC), pp. 1-6, Link to source: https://doi.org/10.1109/APPEEC57400.2023.10561921

U.S. Department of Energy (2024). 2020 U.S. lighting market characterization. Link to source: https://www.energy.gov/sites/default/files/2024-08/ssl-lmc2020_apr24.pdf

World Furniture Online (2017). The lighting fixtures market in Australia and New Zealand. Link to source: https://www.worldfurnitureonline.com/report/the-lighting-fixtures-market-in-australia-and-new-zealand/

Zissis, G., Bertoldi, P., & Serrenho, T. (2021). Update on the status of LED-lighting world market since 2018. Publications Office of the European Union. Link to source: https://publications.jrc.ec.europa.eu/repository/handle/JRC122760

% lamps LED
< 20
20–40
40–60
> 60
No data

Percentage of lamps that are LEDs, circa 2020

The percentage of lamps used to light buildings that are LEDs varies around the world, with limited data available on a per-country basis.

Miah, M. A. R., & Kabir, R. (2023). Energy savings forecast for solid-state lighting in residential and commercial buildings in Bangladesh. IEEE PES 15th Asia-Pacific Power and Energy Engineering Conference (APPEEC), pp. 1-6, Link to source: https://doi.org/10.1109/APPEEC57400.2023.10561921

U.S. Department of Energy (2024). 2020 U.S. lighting market characterization. Link to source: https://www.energy.gov/sites/default/files/2024-08/ssl-lmc2020_apr24.pdf

World Furniture Online (2017). The lighting fixtures market in Australia and New Zealand. Link to source: https://www.worldfurnitureonline.com/report/the-lighting-fixtures-market-in-australia-and-new-zealand/

Zissis, G., Bertoldi, P., & Serrenho, T. (2021). Update on the status of LED-lighting world market since 2018. Publications Office of the European Union. Link to source: https://publications.jrc.ec.europa.eu/repository/handle/JRC122760

Maps Introduction

The Deploy LED Lighting solution can be equally effective at reducing electricity use across global regions because the efficiency gained by replacing other bulbs with LEDs is functionally identical. However, its climate impact will vary with the emissions intensity of each region’s electricity grid. Secondary considerations associated with uptake of LED lighting also can vary with climate and hence geography. In particular, the decrease in heating associated with LED lighting can reduce demands on air conditioning, leading to increased incentive for solution uptake in warmer climates.

Historically, a few countries typically account for the bulk of LEDs purchased. For example, 30% of the 5 billion LEDs sold globally in 2016 were sold in China. In the same period, North America accounted for 15% while Western Europe, Japan, and India represented 11%, 10%, and 8% of the LEDs sold, respectively (Kamat et al., 2020; U.S. DOE, 2016). Essentially, the growing sales of LEDs drove global adoption levels from 17.6% of the building lighting market in 2016 to 50.5% in 2022 (Lane, 2023). However, current adoption still varies considerably around the world. For instance, Lee et al. (2024) reported that LED market penetration in the U.S. was 47.5% in 2020, compared with 43.3% globally in the same period (Lane, 2023). Meanwhile, LED adoption in France was 35% in 2017, and countries in the Middle East such as the United Arab Emirates, Saudi Arabia, and Turkey had over 70% LED adoption that same year; residential buildings in the United Kingdom had 13% LED adoption in 2018, while Japan had 60% LED adoption as of 2019 (Zissis et al., 2021). This demonstrates potential to scale LED adoption in the future, especially in low- and middle-income countries where the bulk of new building occurs (IEA, 2023).

Action Word
Deploy
Solution Title
LED Lighting
Classification
Highly Recommended

Lawmakers and Policymakers

  • Use regulations to phase out and replace energy-inefficient lighting sources with LEDs.
  • Set regulations that encourage sufficient lighting to limit the overuse of LEDs (or rebound effects).
  • Require that public lighting use LEDs.
  • Use financial incentives such as tax breaks, subsidies, and grants to facilitate the transition to LEDs.
  • Revise building energy-efficiency standards to reflect energy savings of LEDs.
  • Develop production standards and mandate labeling for LEDs.
  • Build sufficient inspection capacity for LED manufacturers and penalize noncompliance with standards.
  • Use energy-efficiency purchase agreements to help support utility companies during the transition to LED lighting.
  • Invest in research and development that improves the cost and efficiency of LED lighting.
  • Develop a certification program for LED lighting.
  • Create exchange programs or buy-back programs for inefficient light bulbs.
  • Start demonstration projects to promote LED lighting.
  • Join, support, or create educational programs that raise public awareness about the cost savings and energy-efficiency gains associated with LEDs.

Further information:

Practitioners

  • Take advantage of or advocate for financial incentives such as tax breaks, subsidies, and grants to facilitate the production of LED lighting.
  • Help develop circular supply chains in renovating, remanufacturing, reusing, and redistributing materials.
  • Invest in research and development to improve efficiency and cost of LEDs.
  • Adhere to, or advocate for, national LED standards.
  • Develop, produce, and sell LED lighting that imitates incandescent or other familiar lighting.
  • Consider bundling services with retrofitting companies and collaborating with utility companies to offer rebates or other incentives.
  • Improve self-service of LEDs by reducing obstacles to installation and ensuring LEDs can be easily replaced.
  • Help create positive perceptions of LED lighting by showcasing usage, cost savings, and emissions reductions.
  • Create feedback mechanisms, such as apps that alert users to real-time benefits such as energy and cost savings.
  • Start demonstration projects to promote LED lighting.
  • Join, support, or create educational programs that raise public awareness about the cost savings and energy-efficiency gains associated with LEDs.

Further information:

Business Leaders

  • Retrofit existing operations for LEDs, replace inefficient bulbs, and purchase only LEDs going forward.
  • Help develop circular supply chains in renovating, remanufacturing, reusing, and redistributing LED lighting materials.
  • Take advantage of financial incentives such as tax breaks, subsidies, and grants to facilitate the transition to LED lighting.
  • Invest in research and development that improves the cost and efficiency of LED lighting.
  • Join, support, or create educational programs that raise public awareness about the cost savings and energy-efficiency gains associated with LEDs.

Further information:

Nonprofit Leaders

  • Retrofit existing operations for LEDs, replace inefficient bulbs, and purchase only LEDs going forward.
  • Help develop circular supply chains in renovating, remanufacturing, reusing, and redistributing LED lighting materials.
  • Take advantage of, or advocate for, financial incentives such as tax breaks, subsidies, and grants to facilitate the transition to LED lighting.
  • Advocate for regulations to phase out and replace energy-inefficient lighting sources with LEDs.
  • Advocate for production standards and labeling for LEDs.
  • Call for regulations that encourage sufficient lighting to limit the overuse of LEDs (or rebound effects).
  • Start demonstration projects to promote LED lighting.
  • Help develop, support, or administer a certification program for LED lighting.
  • Create national catalogs of LED manufacturers, suppliers, and retailers.
  • Join, support, or create educational programs that raise public awareness about the cost savings and energy-efficiency gains associated with LEDs.

Further information:

Investors

  • Retrofit existing operations for LEDs, replace inefficient bulbs, and purchase only LEDs going forward.
  • Take advantage of financial incentives such as tax breaks, subsidies, and grants to facilitate the transition to LED lighting.
  • Invest in LED manufacturers, supply chains, and supportive industries.
  • Support research and development to improve the efficiency and cost of LEDs.
  • Invest in LED companies.
  • Fund companies that provide retrofitting services (energy service companies).
  • Invest in businesses dedicated to advancing LED use.
  • Ensure portfolio companies do not produce or support non-LED lighting supply chains.
  • Join, support, or create educational programs that raise public awareness about the cost savings and energy-efficiency gains associated with LEDs.

Further information:

Philanthropists and International Aid Agencies

  • Retrofit existing operations for LEDs, replace inefficient bulbs, and purchase only LEDs going forward.
  • Take advantage of financial incentives such as tax breaks, subsidies, and grants to facilitate the transition to LED lighting.
  • Provide financing such as low-interest loans, grants, and micro-grants to help accelerate LED adoption.
  • Fund companies that provide retrofitting services (energy service companies).
  • Advocate for regulations to phase out energy-inefficient lighting sources and replace them with LEDs.
  • Call for regulations that encourage sufficient lighting to limit the overuse of LEDs (or rebound effects).
  • Start demonstration projects to promote LED lighting.
  • Help develop, support, or administer a certification program for LED lighting.
  • Create national catalogs of LED manufacturers, suppliers, and retailers.
  • Join, support, or create educational programs that raise public awareness about the cost savings and energy-efficiency gains associated with LEDs.

Further information:

Thought Leaders

  • Retrofit buildings for LED lighting, replace inefficient bulbs, and purchase only LEDs going forward.
  • Help create positive perceptions of LED lighting by highlighting your personal usage, cost and energy savings, and emissions reductions.
  • Help develop circular supply chains in renovating, remanufacturing, reusing, and redistributing materials.
  • Take advantage of, or advocate for, financial incentives such as tax breaks, subsidies, and grants to facilitate the transition to LED lighting.
  • Advocate for regulations to phase out energy-inefficient lighting sources and replace them with LEDs.
  • Advocate for LED standards.
  • Advocate for regulations that encourage sufficient lighting and guard against overuse of LEDs (or rebound effects).
  • Start demonstration projects to promote LED lighting.
  • Help develop, support, or administer a certification program for LED lighting.
  • Create national catalogs of LED manufacturers, suppliers, and retailers.
  • Join, support, or create educational programs that raise public awareness about the cost savings and energy-efficiency gains associated with LEDs.

Further information:

Technologists and Researchers

  • Develop circular supply chains in renovating, remanufacturing, reusing, and redistributing materials.
  • Improve the efficiency and cost of LEDs.
  • Improve LED lighting to imitate familiar lighting, offer customers settings, and augment color rendering.
  • Improve self-service of LEDs by reducing obstacles to installation and ensuring LEDs can be replaced individually.
  • Help develop standards for LEDs.
  • Create feedback mechanisms, such as apps that alert users to real-time benefits such as energy and cost savings.

Further information:

Communities, Households, and Individuals

  • Retrofit for LEDs, replace inefficient bulbs, and purchase only LEDs going forward.
  • Help create positive perceptions of LED lighting by highlighting your personal usage, cost and energy savings, and emissions reductions.
  • Help develop circular supply chains in renovating, remanufacturing, reusing, and redistributing materials.
  • Take advantage of or advocate for financial incentives such as tax breaks, subsidies, and grants to facilitate the transition to LED lighting.
  • Advocate for regulations to phase out and replace energy-inefficient lighting sources with LEDs.
  • Advocate for LED standards.
  • Advocate for regulations that encourage sufficient lighting to limit the overuse of LEDs (or rebound effects).
  • Join, support, or create educational programs that raise public awareness about the cost savings and energy-efficiency gains associated with LEDs.

Further information:

Evidence Base

Consensus of effectiveness in reducing GHG emissions from electricity generation: High

Using LEDs significantly minimizes the electricity required to light buildings, thereby reducing GHG emissions from electricity generation. Many countries are phasing out other lighting sources to reduce GHG emissions (Lane, 2023).

The IEA reported that global adoption of LEDs drove a nearly 30% reduction in annual electricity consumption for lighting in homes between 2010 and 2022 (Lane, 2023). Hasan et al. (2025) indicated that LEDs could reduce the lighting energy usage of buildings (and their resulting GHG emissions) in Bangladesh by 50%. Periyannan et al. (2023) recorded significant electricity savings after evaluating the impact of retrofitting hotels in Sri Lanka with LEDs. Forastiere et al. (2024)’s analysis of the retail buildings in Italy showed an 11% reduction in energy consumption from replacing other lamps with LEDs. Booysen et al., (2021) also achieved significant energy reduction with lighting retrofits in South African educational buildings.

The results presented in this document summarize findings from six original studies and three public sector/multilateral agency reports, which collectively reflect current evidence both globally and from six countries on four different continents. We recognize this limited geographic scope creates bias, and hope this work inspires research and data sharing on this topic in underrepresented regions.

Updated Date
Coming Soon Label
Coming Soon

Deploy District Cooling

Sector
Electricity
Image
Image
A large district cooling facility
Coming Soon
Off

Key Takeaways

  • District cooling consists of a centralized cooling system that distributes chilled water to multiple buildings through a network of insulated underground pipes.
  • Cooled water for district cooling can come from electric chillers, solar cooling, and natural cooling sources, including seawater, lake water, rivers, and groundwater. Even waste heat from industry can be used to generate cooling. 
  • District cooling reduces GHG emissions because cooling with natural sources is more efficient than conventional cooling and because district cooling uses refrigerants with lower global warming potential.
  • Deploying district cooling systems has high up-front costs and requires extensive planning and coordination among a wide range of stakeholders.
Summary

Deploying district cooling is the process of connecting multiple buildings in a dense area to a single, highly efficient source of cooling. The increased energy efficiency and reduction in use of high global warming potential refrigerants can translate into substantial emissions reductions and lower operating expenses (International Energy Agency [IEA], 2018; Energy Sector Management Assistance Program, 2020). District cooling systems that integrate cool thermal storage have the potential to significantly reduce electricity demand during peaks when demand for cooling can strain electricity grids (Al-Nini et al.,2023; Voswinkel, 2025). However, the high upfront cost, long-term planning, and large number of stakeholders involved make this a challenging solution, especially in low- and middle-income countries where new demand for cooling is growing (Eveloy & Ayou, 2019). Lack of publicly available data also makes this potential solution difficult to explore in greater depth. Based on our assessment, we will “Keep Watching” this potential solution.

Description for Social and Search
District cooling systems that integrate cool thermal storage can significantly reduce electricity demand during peaks.
Overview

What is our assessment?

Based on our analysis, deploying district cooling is a potentially impactful option for reducing emissions from buildings as demand for cooling continues to grow. However, upfront cost and project complexity are major barriers to deployment, and a lack of data is a barrier to deeper analysis. This potential solution is therefore classified as “Keep Watching.”

Plausible Could it work? Yes
Ready Is it ready? Yes
Evidence Are there data to evaluate it? No
Effective Does it consistently work? Yes
Impact Is it big enough to matter? Yes
Risk Is it risky or harmful? No
Cost Is it cheap? No

What is it?

District cooling consists of a centralized cooling system that distributes chilled water to multiple buildings through a network of insulated underground pipes (International District Energy Association [IDEA], 2008). The cooled water absorbs heat from the buildings, replacing the need for air conditioners or chillers in each building (IDEA, 2008). District cooling can produce cooled water from a variety of renewable sources, such as renewable electricity, solar cooling, and natural cooling sources, including seawater, lakewater, rivers, and groundwater. It can even use waste heat from industry to generate cooling  (Al-Nini, 2023; Eveloy & Ayou, 2019; IEA District Heating and Cooling [IEA DHC], 2019). Many systems include thermal energy storage facilities where frozen water, cold water, or phase change materials are cooled when electricity prices are low for use during peak hours to save costs and reduce strain on the electricity grid (Al-Nini et al.,2023; Voswinkel, 2025). District cooling is best applied to high-density areas and can be combined with district heating to provide year-round conditioning (Eveloy & Ayou, 2019; Werner, 2017). 

Does it work?

When district cooling replaces conventional standalone systems in residential and commercial buildings, it can reduce emissions through two main mechanisms. First, many district cooling systems exchange heat with natural sources of cooling such as oceans, deep lakes, and rivers, a process that can be many times more energy efficient than conventional cooling systems. This results in reduced energy use and reduced emissions from the electricity used to operate the system (Eveloy & Ayou, 2019; IEA DHC, 2019). Second, district cooling systems can reduce the use of refrigerants with high global warming potentials, which can leak at all stages of a cooling system’s lifespan. When replacing standalone systems, district cooling can significantly reduce the total volume of refrigerants used (IEA, 2018; IEA DHC, 2019). In addition, some district cooling systems do not use any refrigerants at all (e.g., exchanging heat with ocean or deep lake water), and many are able to use refrigerants with low global warming potential (Eveloy & Ayou, 2019; IEA DHC, 2019). For instance, the Zuidas International Business Hub in the Netherlands adopted a district cooling system that uses lake cooling combined with chillers, reducing emissions by 75% compared to conventional cooling systems (IEA DHC, 2019). 

Why are we excited?

According to the IEA (2023), global carbon emissions from cooling buildings reached 1.02 Gt CO₂‑eq in 2022. The majority of emissions associated with cooling are from standalone systems such as window air conditioners and chillers that serve a single building. District cooling systems are relatively rare at this time, with most capacity found in the United States and the Gulf Arab States (Eveloy & Ayou, 2019). While existing district cooling systems can be made less emitting, there may be greater potential for new systems because demand for cooling is increasing by ~4%/yr as global temperatures rise and as standards of living improve in regions that experience high temperatures (Voswinkel, 2025). This is raising concerns about the new electricity generating capacity needed when demand peaks on very hot days. District cooling systems can reduce overall energy use for cooling relative to standalone systems, and when paired with cool thermal storage, can significantly reduce demand during peak hours and on hot days (Al-Nini et al.,2023; Voswinkel, 2025). Building owners can enjoy less maintenance costs, more reliable cooling, and increased floor space when district cooling systems replace bulkier standalone cooling systems (IDEA, 2008; IEA DHC, 2019; Lienard, 2025). In dense areas with good access to natural or low-cost cooling sources, district cooling systems can cost less to operate and offer lifetime savings despite the higher upfront costs (Eveloy & Ayou, 2019). 

Why are we concerned?

Deploying district cooling systems has high upfront costs and requires extensive planning and coordination among a wide range of stakeholders (Eveloy & Ayou, 2019; IEA DHC, 2019). These projects can face challenges in getting financing due to a lack of confidence for both investors and customers, uncertainty about future loads, and regulatory barriers (Eveloy & Ayou, 2019). These can be especially challenging in low- and middle-income countries where demand for cooling is growing rapidly (ESMAP, 2020). Many buildings are likely to invest in standalone systems in the near term, locking them into alternatives and weakening the business case for district systems in the area. Meanwhile, the full potential is difficult to assess due to a lack of data on district cooling systems globally.

References

Al-Nini, A., Ya, H. H., Al-Mahbashi, N., & Hussin, H. (2023). A Review on Green Cooling: Exploring the Benefits of Sustainable Energy-Powered District Cooling with Thermal Energy Storage. Sustainability, 15(6), 5433. Link to source: https://doi.org/10.3390/su15065433  

Energy Sector Management Assistance Program. (2020). Primer for space cooling (Knowledge Series). World Bank. Link to source: https://documents1.worldbank.org/curated/en/131281601358070522/pdf/Primer-for-Space-Cooling.pdf 

Eveloy, V., & Ayou, D. S. (2019). Sustainable District Cooling Systems: Status, Challenges, and Future Opportunities, with Emphasis on Cooling-Dominated Regions. Energies, 12(2), 235. Link to source: https://doi.org/10.3390/en12020235  

IEA. (2018). The future of cooling: Opportunities for energy-efficient air conditioning. Link to source: https://iea.blob.core.windows.net/assets/0bb45525-277f-4c9c-8d0c-9c0cb5e7d525/The_Future_of_Cooling.pdf  

IEA. (2023). Final energy consumption and carbon emissions for space cooling by region in the net zero scenario, 2000-2030. Link to source: https://www.iea.org/data-and-statistics/charts/final-energy-consumption-and-carbon-emissions-for-space-cooling-by-region-in-the-net-zero-scenario-2000-2030 

IEA District Heating and Cooling. (2019). Sustainable district cooling guidelines. International Energy Agency. Link to source: https://iea.blob.core.windows.net/assets/a5da464f-8310-4e0d-8385-0d3647b46e30/2020_IEA_DHC_Sustainable_District_Cooling_Guidelines_new_design.pdf  

International district energy association. (2008). District cooling best practice guide, first edition. Link to source: https://higherlogicdownload.s3.amazonaws.com/DISTRICTENERGY/998638d1-8c22-4b53-960c-286248642360/UploadedImages/Conferences/District_Cooling_Best_Practice_Guide.pdf  

Lienard, V. (n.d.). How can we cool our cities? Euroheat and Power. Retrieved August 18, 2025, from Link to source: https://energy-cities.eu/wp-content/uploads/2025/03/District-cooling_Euro-Heat-and-Power.pdf  

Voswinkel, F., Senat, D., Valle, N. D., D’Angiolini, G., & Callioni, F. (2025, July 28). Staying cool without overheating the energy system. IEA. Link to source: https://www.iea.org/commentaries/staying-cool-without-overheating-the-energy-system  

Werner, S. (2017). International review of district heating and cooling. Energy, 137, 617–631. Link to source: https://doi.org/10.1016/j.energy.2017.04.045  

Credits

Lead Fellow

  • Heather McDiarmid, Ph.D.

Internal Reviewers

  • Christina Swanson, Ph.D.
Action Word
Deploy
Solution Title
District Cooling
Classification
Keep Watching
Updated Date
Coming Soon Label
Coming Soon

Deploy Cool Roofs

Sector
Electricity
Image
Image
An image of a white house with a cool roof
Coming Soon
Off
Summary

Cool roofs cut GHG emissions from electricity generation by lowering the amount of cooling required to condition indoor spaces, thereby decreasing the use of air conditioners. Using cool roofs in building design lowers electricity use, improves thermal comfort for building occupants, and is relatively cheap to deploy. However, its potential climate impact is relatively small, and its relevance is largely limited to hot climates where buildings need more cooling than heating to be thermally comfortable. Its application has mostly been in pilot projects, but we conclude that this solution is “Worthwhile” with potential for large-scale deployment.

Description for Social and Search
The Use Cool Roofs solution is coming soon.
Overview

What is our assessment?

Our analysis concludes that the projected climate impact of using cool roofs on buildings is not large enough to be globally significant (>0.1 Gt CO₂‑eq/yr ). However, we consider it “Worthwhile” because it helps reduce electricity consumption in buildings, makes indoor spaces more thermally comfortable, and lessens the urban heat island effect.

Plausible Could it work? Yes
Ready Is it ready? Yes
Evidence Are there data to evaluate it? Limited
Effective Does it consistently work? Yes
Impact Is it big enough to matter? No
Risk Is it risky or harmful? No
Cost Is it cheap? Yes

What is it?

Using cool roofs reduces the amount of electricity needed to cool indoor spaces, thereby cutting GHG emissions from electricity generation. Cool roofs are generally defined as light-colored roofs designed to reflect more sunlight and transfer less solar energy into the interior compared to traditional roofs, thereby reducing cooling loads. Cool roofs can be achieved by applying coatings or using roofing materials with a high solar reflectance index (SRI), which results from high solar reflectance and thermal emittance. These properties ensure that surface temperatures on cool roofs remain substantially cooler than conventional roofs.

Does it work?

Using cool roofs can effectively reduce the amount of air conditioning needed to cool indoor spaces, though their potential to cut annual electricity use in buildings and resulting GHG emissions is minimal. Nonetheless, evidence from real-world applications demonstrates that the surface temperatures of cool roofs can be as much as 28–30°C cooler than conventional roofs on extremely hot afternoons. Other studies have shown that cool roofs can decrease indoor air temperatures by 2–3°C while simultaneously reducing surrounding outdoor air temperatures by about 10°C, thereby minimizing the urban heat island effect.

Several organizations are deploying initiatives to drive cool roof adoption as a passive cooling strategy in the building sector. For example, C40 Cities previously launched a cool roofs program across New York City. Over a six-year period (2009–2015), the initiative resulted in nearly 530,000 m2 of building roof tops being retrofitted as cool roofs. As of 2023, the United States is estimated to have over 232 million m2 of installed cool roofs. Recently, the Million Cool Roofs Challenge organized by the Global Cool Cities Alliance resulted in 1.1 million m2 of additional cool roofs in 2022 across 10 countries, including Indonesia, Mexico, and Rwanda.

Some studies estimate that about 229 billion m2 of roof space existed as of 2022. Given the existing building stock – and the fact that the bulk of projected new construction by 2050 is expected in regions with hot climates – the impact of this potential solution could grow.

Why are we excited?

There are several advantages to using cool roofs in buildings. First, it is cheap to implement, and the incremental cost of applying new coatings or selecting light-colored roofing materials during construction is often minimal compared to conventional roofs. Second, it is expedient as a cooling strategy when buildings are not mechanically air-conditioned or designed to be naturally ventilated. This is important because many countries in hot climates (where cooling is generally required for indoor thermal comfort more than heating) also lack access to reliable electricity, thereby necessitating the use of passive measures in building design. 

In addition, a recent analysis of 77 low- and middle-income countries determined that cooling systems are not readily available, sustainable, or affordable, especially for building applications, placing nearly 4 billion people at risk. Deploying scalable strategies such as cool roofs in buildings helps reduce exposure to these risks, which could lead to greater adoption and climate impact. Several studies have also shown that using cool roofs can help reduce indoor heat stress, especially in hot and humid environments. Others are exploring the concept of cool-colored roofs, where non-white roof materials can provide similar cooling effects while preserving aesthetic choice for building owners and developers. 

Why are we concerned?

Despite the advantages of using cool roofs as a potential climate solution, a few challenges exist. Some studies have shown that cool roofs can slightly increase heating loads during winter, especially in cold climates. However, other studies conclude that the increase is marginal and often inconsequential. Another concern is that cool roofs can produce glare as the incident sunlight is reflected. This could adversely impact building users if the buildings with cool roofs are surrounded by taller structures with daytime occupancy, such as offices, which is an increasing reality in urban spaces. Lastly, we found examples of pilot projects and resources for cool roofs, but could not find reliable datasets for a comprehensive assessment of their current impact. Addressing such data gaps could help drive cool roofs research, integration into industry practices and building codes, and, ultimately, greater adoption.

References

Bamdad, K. (2023). Cool roofs: A climate change mitigation and adaptation strategy for residential buildings. Building and Environment, 236, Article 110271. Link to source: https://doi.org/10.1016/j.buildenv.2023.110271 

C40 Cities. (2015, January). NYC CoolRoofs. C40 Cities Leadership Group, Inc. Link to source: https://www.c40.org/case-studies/nyc-coolroofs/#:~:text=The%20NYC%20%C2%B0CoolRoofs%20program%2C%20launched%20in%202009%2C,(GHG)%20and%20also%20directly%20cooling%20the%20city.

Challenge Works. (n.d.). Million cool roofs challenge. Retrieved January 16, 2026, from Link to source: https://challengeworks.org/challenge-prizes/million-cool-roofs-challenge/

Cool Roof Paint. (2025, November). Cool roof vs conventional roof. Link to source: https://www.coolroofpaint.com/cool-roof-vs-conventional-roof/

Cool Roof Rating Council. (n.d.). Resources: What is a cool roof? Retrieved December 22, 2025, from Link to source: https://coolroofs.org/resources/what-is-a-cool-roof

Energy Star. (n.d.). Cool roofs. U.S. Environmental Protection Agency. Retrieved January 05, 2026, from Link to source: https://www.energystar.gov/products/cool-roofs

Heat Island Group. (n.d.). Cool science. Energy Technologies Area, Berkeley Lab.  Retrieved December 23, 2025, from Link to source: https://heatisland.lbl.gov/coolscience/cool-roofs

Hosseini, M., Lee, B., & Vakilinia, S. (2017). Energy performance of cool roofs under the impact of actual weather data. Energy and Buildings, 145, 284–292. Link to source: https://doi.org/10.1016/j.enbuild.2017.04.006

Market Reports World. (2025, December 29). Cool Roofs Market Size, Share, Growth, and Industry Analysis, By Type (PVC(Polyvinyl Chloride), EPDM(Rubber), TPO(Thermoplastic)), By Application (Residential Buildings, Non-Residential Buildings), Regional Insights and Forecast to 2033. Link to source: https://www.marketreportsworld.com/market-reports/cool-roofs-market-14716807

Nutkiewicz, A., Mastrucci, A., Rao, N. D., & Jain, R. K. (2022). Cool roofs can mitigate cooling energy demand for informal settlement dwellers. Renewable and Sustainable Energy Reviews, 159, Article 112183. Link to source: https://doi.org/10.1016/j.rser.2022.112183

Sustainable Energy For All. (2022). Chilling prospects 2022: The million cool roofs challenge. Link to source: https://www.seforall.org/data-stories/million-cool-roofs-challenge

Sustainable Energy For All. (2025, July). Chilling prospects: Tracking sustainable cooling for all 2025. Link to source: https://www.seforall.org/data-stories/chilling-prospects-2025

U.S. Department of Energy. (n.d.). Cool roofs. Retrieved December 22, 2025, from Link to source: https://www.energy.gov/energysaver/cool-roofs

U.S. Environmental Protection Agency. (2025, May 30). Using cool roofs to reduce heat islands. Link to source: https://www.epa.gov/heatislands/using-cool-roofs-reduce-heat-islands

Ürge-Vorsatz, D., Chatterjee, S., Cabeza, L. F., & Molnár, G. (2025). Global and regional estimation and evaluation of suitable roof area for solar and green roof applications. Developments in the Built Environment, 21, Article 100607. Link to source: https://doi.org/10.1016/j.dibe.2025.100607

Credits

Lead Fellow

  • Henry Igugu, Ph.D.

Internal Reviewer

  • Christina Swanson, Ph.D.

Action Word
Deploy
Solution Title
Cool Roofs
Classification
Worthwhile
Updated Date
Coming Soon Label
Coming Soon

Use Heat Pumps

Image
Image
Heat pumps
Coming Soon
Off

Key Takeaways

  • A single all-electric residential heat pump for space heating reduces GHG emissions an average of 0.95 t CO₂‑eq/yr.
  • A heat pump’s potential to reduce GHG emissions depends on the heating source it replaces and the emissions intensity of the electricity used to run it.
  • Roughly 130 million heat pumps are currently used for space heating, largely in Europe, Canada, the United States, China, and Japan. 
  • We estimated that 600–960 million heat pumps could be in operation by 2050, reducing GHG emissions 0.57–0.91 Gt CO₂‑eq/yr.  
  • Because heat pumps often provide cooling as well as heating, adoption can increase resilience to heat stress. 
Summary

Heat pumps use electricity to efficiently move heat from one place to another. This solution focuses on the replacement of fossil fuel–based heating systems with electric heat pumps. Heat pumps are remarkably efficient because they collect heat from the outside air, ground, or water using a refrigerant and use a pump to move the heat into buildings to keep them warm in colder months. Heat pumps typically replace heating systems such as boilers, furnaces, and electric resistance heaters. Many will also replace air conditioners, because the same pump can move heat out of a building in warmer months (see Five ways heat pumps are more awesome than you think). 

Description for Social and Search
Heat pumps are a Highly Recommended climate solution. They replace heating systems that burn fossil fuels; many can also provide cooling in hotter months.
Overview

Heat pumps use a refrigerant cycle to move heat. When the liquid refrigerant enters a low pressure environment, it absorbs heat from the surrounding air (air-source heat pumps), water, or ground (ground-source heat pumps) as it evaporates. When the refrigerant vapor is compressed, it condenses back into a liquid, releasing the stored heat into the building. By passing the refrigerant through this cycle, a heat pump can move heat from outside to inside a building. 

Absorbing heat from the outside gets more difficult as temperatures drop. However, modern cold-climate heat pumps are designed to work effectively at temperatures approaching –30 °C (–22 °F) (Gibb et al., 2023). The freezer in your home uses the same technology, moving heat out of the cold box into the warm room to keep your food frozen. In most systems, the refrigerant cycle in a heat pump can be reversed in warmer months, moving heat out of a building to ensure its occupants are comfortable year-round. 

Heat pumps are very efficient at using electricity for heating. This is because they move heat rather than generating heat (e.g., by combustion). For example, a heat pump may have a seasonal coefficient of performance (SCOP) of 3, meaning it can move an average of three units of heat energy for every unit of electrical energy that it consumes. Conventional combustion and electric resistance heaters cannot produce more than one unit of heat energy for every unit of fuel energy or electrical energy provided. 

Heat pump systems may be all-electric or hybrid, where a secondary fossil fuel-based heating system takes over in colder weather. 

A heat pump’s potential to reduce GHG emissions depends on the heating source it replaces and the emissions intensity of the electricity used to run it. When heat pumps replace fossil fuel-based heating, they displace the GHG emissions – primarily CO₂ – generated when the fuel is burned. When replacing electric resistance heaters, heat pumps reduce the GHG emissions from the electricity to power the system because heat pumps are much more energy efficient. As electrical grids decarbonize, the GHG emissions from operating heat pumps will decrease. 

All-electric heat pumps provide the most climate benefit because they can be powered with clean energy, but hybrid heat pumps also play an important emissions-reduction role. Hybrids consist of a smaller electric heat pump system that switches to fuel-based heating systems in colder weather. They may be attractive due to lower up-front costs and because they have lower peak power demand on cold days, but hybrids also have a smaller emissions impact. Our cost and emissions analyses assumed all-electric air-source heat pumps, while the data used in the adoption analysis included all types of heat pumps with the expectation that all-electric versions will dominate in the longer term. 

In this analysis, we calculated effectiveness and cost outcomes from specific countries with high heat-pump adoption (European countries, Canada, the United States, Japan, and China) to avoid comparing research studies that use different assumptions. The analysis used global assumptions for heating system efficiency: 90% for fueled systems (International Gas Union, 2019), 100% for electric resistance (U.S. Department of Energy [U.S. DOE], n.d.), and SCOP of 3 for heat pumps (Crownhart, 2023). We also assumed all existing fueled systems use natural gas, which is currently the dominant fossil fuel used for space heating globally (International Energy Agency [IEA], 2023b). The analysis did not include emissions or costs from cooling but did assume the heat pump is replacing both a heating and cooling system. 

The cost and effectiveness analyses focused on residential heating systems due to availability of data and also because large variations in the cost and size of commercial systems make it more challenging to estimate their global impacts. Commercial heating systems are typically larger than residential systems, and their emissions impacts are expected to be proportionally greater per unit. Cost savings may be different due the greater complexity of heating and cooling systems (Tejani & Toshniwal, 2023). Available data on heat pump adoption, on the other hand, typically include both residential and commercial units. Our adoption analysis therefore included both residential and commercial buildings, with greater adoption assumed in the residential sector. 

References

Air-Conditioning, Heating, and Refrigeration Institute. (2025). AHRI releases November 2024 U.S. heating and cooling equipment shipment data. Link to source: https://www.ahrinet.org/sites/default/files/Stat%20Release%20Nov%2024/November%202024%20Statistical%20Release.pdf 

Asahi, T. (2023, July 3). The role of heat pumps toward decarbonization [PowerPoint slides]. Japan Refrigeration and Air Conditioning Industry Association. Link to source: https://www.jraia.or.jp/english/relations/file/2023_July_OEWG45_JRAIA_side_event_Presentation_4.pdf 

Benz, S. A., & Burney, J. A. (2021). Widespread race and class disparities in surface urban heat extremes across the United States. Earth’s Future, 9(7), Article e2021EF002016. Link to source: https://doi.org/10.1029/2021EF002016 

Bloess, A., Schill, W.-P., & Zerrahn, A. (2018). Power-to-heat for renewable energy integration: A review of technologies, modeling approaches, and flexibility potentials. Applied Energy, 212, 1611–1626. Link to source: https://doi.org/10.1016/j.apenergy.2017.12.073 

Canadian Climate Institute. (2023). Heat pumps pay off [Report]. Link to source: https://climateinstitute.ca/wp-content/uploads/2023/09/Heat-Pumps-Pay-Off-Unlocking-lower-cost-heating-and-cooling-in-Canada-Canadian-Climate-Institute.pdf 

Carella, A., & D’Orazio, A. (2021). The heat pumps for better urban air quality. Sustainable Cities and Society, 75, Article 103314. Link to source: https://doi.org/10.1016/j.scs.2021.103314 

City of Vancouver. (n.d.). Climate change adaptation strategy [Report]. Retrieved September 2, 2025, from Link to source: https://vancouver.ca/files/cov/vancouver-climate-change-adaptation-strategy-2024-25.pdf 

Congedo, P. M., Baglivo, C., D’Agostino, D., & Mazzeo, D. (2023). The impact of climate change on air source heat pumps. Energy Conversion and Management, 276, Article 116554. Link to source: https://doi.org/10.1016/j.enconman.2022.116554 

Cooper, S. J. G., Hammond, G. P., McManus, M. C., & Pudjianto, D. (2016). Detailed simulation of electrical demands due to nationwide adoption of heat pumps, taking account of renewable generation and mitigation. IET Renewable Power Generation, 10(3), 380–387. Link to source: https://doi.org/10.1049/iet-rpg.2015.0127 

Crownhart, C. (2023, February 14). Everything you need to know about the wild world of heat pumps. MIT Technology Review. Link to source: https://www.technologyreview.com/2023/02/14/1068582/everything-you-need-to-know-about-heat-pumps/ 

Davis, L. W., & Hausman, C. (2022). Who will pay for legacy utility costs? Journal of the Association of Environmental and Resource Economists, 9(6), 1047-1085. Link to source: https://doi.org/10.1086/719793 

European Commission. (2022). REPowerEU: Joint European action for more affordable, secure and sustainable energy. Link to source: https://build-up.ec.europa.eu/en/resources-and-tools/publications/repowereu-joint-european-action-more-affordable-secure-and 

European Heat Pump Association. (2024, February 27). Heat pump sales fall by 5% while EU delays action. Link to source: https://www.ehpa.org/news-and-resources/news/heat-pump-sales-fall-by-5-while-eu-delays-action/ 

Gaur, A. S., Fitiwi, D. Z., & Curtis, J. (2021). Heat pumps and our low-carbon future: A comprehensive review. Energy Research & Social Science, 71, Article 101764. Link to source: https://doi.org/10.1016/j.erss.2020.101764 

Gibb, D., Rosenow, J., Lowes, R., & Hewitt, N. J. (2023). Coming in from the cold: Heat pump efficiency at low temperatures. Joule, 7(9), 1939–1942. Link to source: https://doi.org/10.1016/j.joule.2023.08.005 

Global Petrol Prices. (2024). Retail energy price data. Retrieved Feb 2, 2024, from Link to source: https://www.globalpetrolprices.com/ 

Intergovernmental Panel On Climate Change (Ed.). (2023). Climate change 2022: Mitigation of climate change. Working group III contribution to the sixth assessment report of the intergovernmental panel on climate change (1st ed.). Cambridge University Press. Link to source: https://doi.org/10.1017/9781009157926 

International Energy Agency. (2020). Sustainable recovery—World energy outlook special report (revised version). Link to source: https://iea.blob.core.windows.net/assets/c3de5e13-26e8-4e52-8a67-b97aba17f0a2/Sustainable_Recovery.pdf 

International Energy Agency. (2022). The future of heat pumps. Link to source: https://iea.blob.core.windows.net/assets/4713780d-c0ae-4686-8c9b-29e782452695/TheFutureofHeatPumps.pdf 

International Energy Agency. (2023a). Net zero roadmap: A global pathway to keep the 1.5 °C goal in reach—2023 update (revised version). Link to source: https://iea.blob.core.windows.net/assets/8ad619b9-17aa-473d-8a2f-4b90846f5c19/NetZeroRoadmap_AGlobalPathwaytoKeepthe1.5CGoalinReach-2023Update.pdf 

International Energy Agency. (2023b, June 15). Buildings-related energy demand for heating and share by fuel in the Net Zero Scenario 2022-2030. Link to source: https://www.iea.org/data-and-statistics/charts/buildings-related-energy-demand-for-heating-and-share-by-fuel-in-the-net-zero-scenario-2022-2030 

International Energy Agency. (2024). Clean energy market monitor. Link to source: https://iea.blob.core.windows.net/assets/d718c314-c916-47c9-a368-9f8bb38fd9d0/CleanEnergyMarketMonitorMarch2024.pdf 

International Energy Agency. (2025). Electricity 2025 (revised version). Link to source: https://iea.blob.core.windows.net/assets/0f028d5f-26b1-47ca-ad2a-5ca3103d070a/Electricity2025.pdf 

International Gas Union. (2019). Global gas insights 2019 gas & efficiency. Link to source: https://www.igu.org/advocacy/graphics-data/ggi-energy-efficiency 

International Renewable Energy Agency. (2022). Renewable solutions in end-uses: Heat pump costs and markets [Report]. Link to source: https://www.irena.org/-/media/Files/IRENA/Agency/Publication/2022/Nov/IRENA_Heat_Pumps_Costs_Markets_2022.pdf 

International Renewable Energy Agency. (2024). World energy transitions outlook 2024: 1.5°C pathway [Report]. Link to source: https://www.irena.org/-/media/Files/IRENA/Agency/Publication/2024/Nov/IRENA_World_energy_transitions_outlook_2024.pdf 

Jakob, M., Reiter, U., Krishnan, S., Louwen, A., & Junginger, M. (2020). Chapter 11 - Heating and cooling in the built environment. In M. Junginger & A. Louwen (Eds.), Technological learning in the transition to a low-carbon energy system (pp. 189–219). Academic Press. Link to source: https://doi.org/10.1016/B978-0-12-818762-3.00011-X  

Knobloch, F., Hanssen, S. V., Lam, A., Pollitt, H., Salas, P., Chewpreecha, U., Huijbregts, M. A. J., & Mercure, J.-F. (2020). Net emission reductions from electric cars and heat pumps in 59 world regions over time. Nature Sustainability, 3(6), 437–447. Link to source: https://doi.org/10.1038/s41893-020-0488-7 

Malmquist, A., Hjerpe, M., Glaas, E., Karlsson-Larsson, H., & Lassi, T. (2022). Elderly people’s perceptions of heat stress and adaptation to heat: An interview study. International Journal of Environmental Research and Public Health, 19(7), Article 3775. Link to source: https://doi.org/10.3390/ijerph19073775 

Mattiuzzi, C., & Lippi, G. (2020). Worldwide epidemiology of carbon monoxide poisoning. Human & Experimental Toxicology, 39(4), 387-392. Link to source: https://doi.org/10.1177/0960327119891214 

McDiarmid, H. (2023). An analysis of the impacts of all-electric heat pumps and peak mitigation technologies on peak power demand in Ontario [Report]. Ontario Clean Air Alliance. Link to source: https://www.cleanairalliance.org/wp-content/uploads/2023/12/Heat-Pump-Peak-Report-ONLINE-dec-11.pdf 

McDiarmid, H., & Parker, P. (2024). Retrofitting homes in Ontario entails significant embodied emissions: New policies needed. Climate Policy, 25(3), 388–400. Link to source: https://doi.org/10.1080/14693062.2024.2390520 

Renaldi, R., Hall, R., Jamasb, T., & Roskilly, A. P. (2021). Experience rates of low-carbon domestic heating technologies in the United Kingdom. Energy Policy, 156, Article 112387. Link to source: https://doi.org/10.1016/j.enpol.2021.112387 

Romanello, M., Walawender, M., Hsu, S.-C., Moskeland, A., Palmeiro-Silva, Y., Scamman, D., Ali, Z., Ameli, N., Angelova, D., Ayeb-Karlsson, S., Basart, S., Beagley, J., Beggs, P. J., Blanco-Villafuerte, L., Cai, W., Callaghan, M., Campbell-Lendrum, D., Chambers, J. D., Chicmana-Zapata, V., … Costello, A. (2024). The 2024 report of the Lancet Countdown on health and climate change: Facing record-breaking threats from delayed action. The Lancet, 404(10465), 1847–1896. Link to source: https://doi.org/10.1016/S0140-6736(24)01822-1 

Sandoval, N., Harris, C., Reyna, J. L., Fontanini, A. D., Liu, L., Stenger, K., White, P. R., & Landis, A. E. (2024). Achieving equitable space heating electrification: A case study of Los Angeles. Energy and Buildings, 317, Article 114422. Link to source: https://doi.org/10.1016/j.enbuild.2024.114422 

Sovacool, B. K., Evensen, D., Kwan, T. A., & Petit, V. (2023). Building a green future: Examining the job creation potential of electricity, heating, and storage in low-carbon buildings. The Electricity Journal, 36(5), Article 107274. Link to source: https://doi.org/10.1016/j.tej.2023.107274 

Tejani, A., & Toshniwal, V. (2023). Differential energy consumption patterns of HVAC systems in residential and commercial structures: A comparative study. International Journal of Advancements in Science & Technology, 1(3), 47–58. 

U.S. Department of Energy. (2022). Residential cold-climate heat pump technology challenge. Link to source: https://www.energy.gov/eere/buildings/articles/residential-cold-climate-heat-pump-technology-challenge-fact-sheet 

U.S. Department of Energy. (n.d.). Electric resistance heating. Retrieved September 2, 2025, from Link to source: https://www.energy.gov/energysaver/electric-resistance-heating 

U.S. Energy Information Administration. (2023). Updated buildings sector appliance and equipment costs and efficiencies [Report]. Link to source: https://www.eia.gov/analysis/studies/buildings/equipcosts/pdf/full.pdf 

Van Someren, C., Visser, M., & Slootweg, H. (2021). Impacts of electric heat pumps and rooftop solar panels on residential electricity distribution grids. 2021 IEEE PES Innovative Smart Grid Technologies Europe (ISGT Europe), 01–06. Link to source: https://doi.org/10.1109/ISGTEurope52324.2021.9640090 

Wilson, E. J. H., Munankarmi, P., Less, B. D., Reyna, J. L., & Rothgeb, S. (2024). Heat pumps for all? Distributions of the costs and benefits of residential air-source heat pumps in the United States. Joule, 8(4), 1000–1035. Link to source: https://doi.org/10.1016/j.joule.2024.01.022 

Zahiri, S., & Gupta, R. (2023). Examining the risk of summertime overheating in UK social housing dwellings retrofitted with heat pumps. Atmosphere, 14(11), Article 1617. Link to source: https://doi.org/10.3390/atmos14111617 

Zhang, Q., Zhang, L., Nie, J., & Li, Y. (2017). Techno-economic analysis of air source heat pump applied for space heating in northern China. Applied Energy, 207, 533–542. Link to source: https://doi.org/10.1016/j.apenergy.2017.06.083 

Zhou, M., Liu, H., Peng, L., Qin, Y., Chen, D., Zhang, L., & Mauzerall, D. L. (2022). Environmental benefits and household costs of clean heating options in northern China. Nature Sustainability, 5(4), 329–338. Link to source: https://doi.org/10.1038/s41893-021-00837-w 

Credits

Lead Fellow

  • Heather McDiarmid, Ph.D.

Contributors

  • Stephen Agyeman, Ph.D.

  • Ruthie Burrows, Ph.D.

  • James Gerber, Ph.D.

  • Sarah Gleeson, Ph.D.

  • Yusuf Jameel, Ph.D.

  • Daniel Jasper

  • Jason Lam

  • Cameron Roberts, Ph.D.

  • Alex Sweeney

  • Eric Wilczynski

Internal Reviewers

  • Aiyana Bodi

  • Hannah Henkin

  • Jason Lam

  • Zoltan Nagy, Ph.D.

  • Ted Otte

  • Amanda D. Smith, Ph.D.

Effectiveness

Our analysis showed that each all-electric residential heat pump for space heating reduces emissions by an average of 0.97 t CO₂‑eq /heat pump system/yr (20-yr and 100-yr basis, Table 1). 

Heat pumps reduce emissions by reducing the amount of fossil fuels burned for space heating or by reducing the use of less efficient electric resistance heating. Operating a heat pump generates no on-site emissions except refrigerant leaks, which are addressed by the Improve Refrigerant Management solution. Our analysis included the emissions from the electricity used to power heat pumps. Thus, the emissions reduction from heat pump adoption is expected to improve as electricity generation incorporates more renewable energy (Knobloch et al., 2020). 

There are significant regional differences in heat pump effectiveness due to the electricity mix, climate, and types of heating systems used today (Knobloch et al., 2020). The global average is weighted based on regional heating requirements and existing heating technologies. 

We did not quantify the reduction in pollutants such as nitrogen oxides, sulfur oxides, and particulate matter, which are released when fossil fuels are burned for space heating. We also refrained from estimating the global warming impacts of refrigerant leaks associated with the use of heat pumps, which is addressed by our Improve Refrigerant Management solution, or natural gas leaks associated with the use of fossil fuels for heating. 

Table 1. Effectiveness at reducing emissions from space heating.

Unit: t CO₂‑eq/heat pump system/yr, 100-yr basis

Mean 0.97
Left Text Column Width
Cost

A residential air-source heat pump has a mean initial installed cost of US$6,800 and an estimated US$540/yr operational cost for heating. Over a 15-year lifespan, this results in a net cost of US$990/yr. A heat pump generally replaces both a heating and cooling system with a combined mean installed cost of US$5,300. Operating a baseline heating system costs US$830/yr (operational cooling cost was not included in this analysis). Over a 15-year lifespan, the baseline case has a net cost of US$1,180/yr. This results in a net US$190 savings for households that switch to a heat pump. This translates to US$200 savings/t CO₂‑eq reduced (Table 2).

These values include the average annual cost to operate the equipment for heating and the annualized up-front cost of a heat pump relative to both a heating and cooling system that it replaces. There can be significant variability in the up-front cost of equipment based on the type of heat pump installed, the size of the building, and the climate in which it is designed to operate. We assumed the cost to operate the equipment for cooling to be the same with heat pumps and the air conditioners they replace. 

There are significant regional differences in the operational cost of heating systems due to climate, utility rates, and the heating systems in use today. The global average outcomes described here are weighted averages from Europe, Canada, the United States, China, and Japan based on regional heating requirements and existing heating technologies. 

Utility cost estimates are from June 2023 (Global Petrol Prices, 2024) and may vary substantially over time due to factors such as volatile fossil fuel prices, changing carbon prices, and heat pump incentives. Additional installation costs, such as upgrades to electrical systems, ductwork, or radiators, are not included. 

Table 2. Cost per unit climate impact. Negative values reflect cost savings.

Unit: 2023 US$/t CO₂‑eq , 100-yr basis

Mean –200
Left Text Column Width

Methods and Supporting Data

Learning Curve

Insufficient data exist to quantify the learning curve for heat pumps. 

The cost of installing a heat pump includes both equipment costs and the labor cost of installation. According to the U.S. Energy Information Administration ([U.S. EIA] 2023), retail equipment costs are 60–80% of the total installed cost of residential air-source heat pumps (central and ductless). 

Equipment costs can decrease with economies of scale and as local markets mature, but may be confounded by technological advances as well as equipment and/or refrigerant regulations that can also increase costs (IEA, 2022). European estimated learning rates for heat pump equipment costs range from 3.3% for ground-source heat pumps (Renaldi et al., 2021) to 18% for air-source heat pumps (Jakob et al., 2020). Ease and cost of installation is a research and development goal for manufacturers (IEA, 2022). 

The installed cost is also affected by rising labor costs and projected labor shortages (IEA, 2022). Renaldi et al. (2021) showed negative learning rates for the total installed costs in the United Kingdom due to increasing installation costs: –2.3% and –0.8% for air-source and ground-source heat pumps, respectively.

Heat pump manufacturer efforts to improve the performance of the technology may impact learning curves as well. In North America, the Residential Heat Pump Technology Challenge has supported the development of heat pumps with improved cold-climate performance (U.S. DOE, 2022). 

Speed of Action

Speed of action refers to how quickly a climate solution physically affects the atmosphere after it is deployed. This is different from speed of deployment, which is the pace at which solutions are adopted.

At Project Drawdown, we define the speed of action for each climate solution as emergency brake, gradual, or delayed.

Use Heat Pumps is a GRADUAL climate solution. It has a steady, linear impact on the atmosphere. The cumulative effect over time builds as a straight line.

Caveats

Heat pumps can increase demand for electricity and can therefore increase demand for fossil fuel-based power generation. In areas where power generation relies heavily on fossil fuels, heat pumps may generate more emissions than gas heating systems. As the electricity sector adopts more renewables and phases out fossil fuel-based generation, the emissions impact of heat pumps will decrease. Once a building has been designed or retrofitted to accommodate a heat pump it is likely that new heat pumps will be installed at the end of equipment life, perpetuating the benefit.

Efforts are underway to retrofit buildings by improving insulation, air-sealing, and upgrading windows. When done alongside heat pump adoption, retrofits can reduce the size of heat pump needed and increase total energy, emissions, and cost savings. 

As heat pump adoption grows, so too will the manufacture of refrigerants, some of which have high global warming potentials when they escape to the atmosphere. See Deploy Alternative Refrigerants and Improve Refrigerant Management solutions for more on accelerating change in this sector.

Current Adoption

Our analysis suggests that 130 million heat pumps for heating are currently in operation primarily based on data in Europe, Canada, the United States, China, and Japan (Table 3). These include both all-electric heat pumps and hybrid heat pumps. The IEA (2023a) estimated that 12% of global space heating demand was met by heat pumps in 2022. 

This value is based on market reports and national data sources plus IEA (2022) estimates of total GW of installed capacity. To convert installed capacity to the number of heat pumps, we used the median from the range of suggested average capacities (7.5 kW for Europe and North America, 4 kW in Japan and China, 5 kW global average). In Japan, where heat pump units typically heat only one room, we assumed 2.4 units per heat pump (International Renewable Energy Agency [IRENA], 2022).

Table 3. Current heat pump adoption level (2020–2022).

Unit: Heat pump systems in operation

Mean 130,000,000
Left Text Column Width
Adoption Trend

Our estimates put the median adoption trend at 17 million new all-electric and hybrid heat pumps in operation per year (Table 4). This analysis is based on product shipment data (used as a proxy for installed heat pumps), market reports, national statistics, and IEA data for growth in installed capacity. For the IEA data (2010–2023), we assumed a global average of 5 kW of heat capacity per heat pump unit (IEA, 2024).

Shipment and market analysis reports consistently show growing markets for heat pumps in much of the world (Asahi, 2023; European Heat Pump Association, 2024; IEA, 2024). In the United States, shipments of heat pumps have outnumbered gas furnaces since at least 2022 (Air-Conditioning, Heating, and Refrigeration Institute, 2025).

Table 4. Heat pump adoption trend (2010–2023).

Unit: Heat pump systems in operation/yr

25th percentile 12,000,000
Mean 15,000,000
Median (50th percentile) 17,000,000
75th percentile 18,000,000
Left Text Column Width
Adoption Ceiling

Our adoption ceiling is set at 1.200 billion heat pumps for space heating by 2050 (Table 5), most of which are expected to be in residential buildings. This is based on the IEA’s Net Zero Roadmap projection that heat pumps will represent 6,500 GW of heating capacity globally by 2050, covering 55% of space heating demand (IEA, 2023a). Our adoption ceiling assumes all-electric heat pumps cover all space heating demand. 

We assumed that average heat pump sizes (capacities) will increase over time as heat pumps cover a greater portion of a building’s heating load and as more commercial buildings with larger heating loads install heat pumps. Using a global average of 10 kW per heat pump, the IEA projections imply 650 million heat pumps will be in operation by 2050 with the technical adoption ceiling for 1,200 million heat pumps if all heating demand were met by heat pumps.

Table 5. Heat pump adoption ceiling: upper limit for adoption level.

Unit: Heat pump systems in operation by 2050

Mean 1,200,000,000
Left Text Column Width
Achievable Adoption

We estimate the achievable range for heat pump adoption to be 600–960 million heat pumps in operation by 2050 (Table 6).

Most existing space heating systems will be replaced at least once between now and 2050 because this equipment typically has lifetimes of 15–30 years (U.S. EIA, 2023). Policies that encourage high efficiency heat pumps alongside insulation upgrades have the potential to provide lifetime savings, greater comfort, and energy efficiency benefits (Wilson et al., 2024). Given the available timelines and potential benefits, near full adoption is technically feasible. 

We have set the Achievable – High heat pump adoption at 80% of the adoption ceiling to account for systems that are difficult to electrify due to very cold climates, policy, economic barriers, and grid constraints. This high achievable value assumes that some systems may be replaced before their end of life to meet climate and/or financial goals. 

We have set the Achievable – Low heat pump adoption at 50% of the adoption ceiling. This is roughly consistent with the current adoption trend continuing out to 2050. 

Our heat pump units adopted include both all-electric and hybrid heat pumps. This analysis assumes that hybrid heat pumps will become less common as fuels are phased out and that all-electric heat pumps will dominate by 2050. 

Table 6. Range of achievable adoption levels.

Unit: Heat pump systems installed

Current adoption 130,000,000
Achievable – low 600,000,000
Achievable – high 960,000,000
Adoption ceiling 1,200,000,000
Left Text Column Width

Our estimates show the global impact of existing heat pumps for space heating to be a reduction of 0.13 Gt CO₂‑eq/yr (100- and 20-yr basis) based on current adoption and today’s electricity grid emissions (Table 7). Because electricity grid emissions are decreasing for each kWh of electricity generated (IEA, 2025), the actual impact will be greater than our estimates when future electricity generation emissions are lower.

For the adoption ceiling, assuming heat pumps supply all of the IEA’s projected global heating demand in 2050 (IEA, 2023a), 1.2 Gt CO₂‑eq/yr (100- and 20-yr basis) could be avoided per year with today’s electricity grid emissions.

A high-end achievable target is 80% of the adoption ceiling, accounting for systems that might continue to use fossil fuels for heating due to factors such as cold climates, economic barriers, and grid constraints. This would result in avoiding 0.93 Gt CO₂‑eq/yr (100- and 20-yr basis) with today’s electricity grid emissions. 

A low-end achievable target is 50% of the adoption ceiling, roughly equivalent to heat pump adoption continuing at today’s rate. This would result in avoiding 0.58 Gt CO₂‑eq/yr (100- and 20-yr basis) with today’s electricity grid emissions. 

Table 7. Climate impact at different levels of heat pump systems adoption.

Unit: Gt CO₂‑eq/yr, 100-yr basis

Current adoption 0.13
Achievable – low 0.58
Achievable – high 0.93
Adoption ceiling 1.2
Left Text Column Width
Additional Benefits

Heat Stress

Heat waves and extreme heat are becoming increasingly significant factors of morbidity and mortality worldwide (Romanello et al., 2024). Some buildings that replace heating systems with heat pumps will gain access to cooling (Congedo et al., 2023; Wilson et al., 2024; Zhang et al., 2017; also see Let’s turbo-boost heat pump sales by making heat pumps the default for cooling). This can provide protection from heat stress in regions experiencing increasingly hotter summers (where air conditioning was not previously necessary) and for populations that are vulnerable to heat stress, such as the elderly (Malmquist et al., 2022). Some jurisdictions incentivize heat pumps for this reason. For example, the United Kingdom plans to install 600,000 heat pumps by 2028 (Zahiri & Gupta, 2023), and local climate adaptation plans in Canada recommend the installation of heat pumps to provide space cooling that can reduce morbidity and mortality during heat waves (Canadian Climate Institute, 2023; City of Vancouver, n.d.). Because exposure to extreme heat is disproportionately higher for minority communities – particularly in urban environments – access to cooling has important implications for environmental justice (Benz & Burney, 2021). 

Income and Work

Installing heat pumps can lead to greater household savings on electricity. Research has shown that across the United States, heat pumps can reduce electricity bills for 49 million homes with an average savings of US$350–600 per year, depending on the efficiency of the heat pump (Wilson et al., 2024). Wilson et al. (2024) found that higher efficiency heat pumps could be cost-effective for about 65 million households in the United States. Heat pumps also create jobs (Sovacool et al., 2023). In its post-COVID-19 recovery plan, the IEA (2020) estimated that every US$1 million investment in heat pumps could generate 9.1 new jobs and reduce 0.8 jobs in the fossil fuel industry. About half of the new jobs will be in manufacturing, with the remaining distributed between installation and maintenance.

Health

Burning fossil fuels for heating directly emits health-harming particulates and can generate carbon monoxide. Replacing fossil gas heating with heat pumps can reduce air pollution (Carella & D’Orazio, 2021) and contribute to improving health outcomes (Zhou et al., 2022). A study in China showed that as the power grid moves to incorporate renewable energy, the air quality and health benefits of heat pumps will increasingly outweigh the benefits of gas heaters (Zhou et al., 2022). The risk of carbon monoxide poisoning also decreases in buildings that switch from fuel-burning space heating to heat pumps. In buildings that burn fuels for applications such as space heating, carbon monoxide can pose serious health risks, including poisoning and death (Mattiuzzi & Lippi, 2020). 

Risks

Heat pumps contain refrigerants that often have high global warming potentials. Refrigerant leaks can occur during installation, operation, and end of life (McDiarmid & Parker, 2024). As more heat pumps are adopted, there is a risk of increased emissions from refrigerant leaks during operation as well as refrigerant release at the end of equipment life. Alternate refrigerants with lower global warming potentials are being phased in due to an international agreement to reduce hydrofluorocarbons, including many refrigerants (Kigali Amendment). 

Higher rates of heat pump installation will require upscaling heat pump manufacturing and training, plus certification of skilled labor to install them. Skilled labor shortages are already creating bottlenecks for heat pump adoption in some countries, some of which can be met by reskilling other heating technicians (IEA, 2022).

Interactions with Other Solutions

Reinforcing

Advancements in heat pump technology will support the development and adoption of heat pump technology for industrial applications.

The increased adoption of heat pumps will increase the market for alternative refrigerants and refrigerant management.

Competing

Heat pumps reduce the emissions from heating and cooling buildings. This reduces the effectiveness of technologies that reduce heating and/or cooling demands.

Adoption of heat pumps for space heating is likely to generate seasonal peaks in power demand during cold days that may require building out extra generating capacity that decrease grid efficiency (Bloess et al., 2018). Heat pumps can compete with electric cars for power during peak times (Van Someren et al., 2021).

Dashboard

Solution Basics

heat pump systems

t CO₂-eq (100-yr)/unit/yr
0.97
units
Current 1.3×10⁸ 06.0×10⁸9.6×10⁸
Achievable (Low to High)

Climate Impact

Gt CO₂-eq (100-yr)/yr
Current 0.13 0.580.93
US$ per t CO₂-eq
-200
Gradual

CO₂ , CH₄, N₂O

Trade-offs

Enhanced grid infrastructure will be required to support widespread building electrification and the greater demand for electricity, especially on cold days when heat pumps are less efficient at moving heat (Cooper et al., 2016). Demand-side management, thermal storage, home batteries, bidirectional chargers, and greater adoption of ground-source heat pumps can all help to reduce this increased demand (Cooper et al., 2016; McDiarmid, 2023).

In general, heat pumps have higher up-front costs than do fueled alternatives but will save a building owner money over the lifetime of the system. This can create economic barriers to accessing the benefits of heat pumps, with low-income homeowners and renters who pay for their utilities being particularly vulnerable to being left behind in the transition (Sandoval et al., 2024). Equity advocates are also concerned that the cost of maintaining gas and other fossil fuel infrastructure may increasingly fall on lower-income building owners who struggle to afford the upfront cost of electrifying with heat pumps (Davis & Hausman, 2022). 

°C days
015,000

Space heating demand (18 °C basis)

Heating degree days are an indicator of total space-heating demand to maintain an indoor temperature above 18 °C. Here we show annual average heating degree days for the decade ending in 2025.

Copernicus Climate Change Service. (2023). ERA5 hourly data on single levels from 1940 to present [Data set]. Copernicus Climate Change Service (C3S) Climate Data Store (CDS). Retrieved January 13, 2026 from Link to source: https://doi.org/10.24381/cds.adbb2d47     

Hersbach, H., Bell, B., Berrisford, P., Hirahara, S., Horányi, A., Muñoz‐Sabater, J., Nicolas, J., Peubey, C., Radu, R., Schepers, D., Simmins, A., Soci, C., Abdalla, S., Abellan, X., Balsamo, G., Bechtold, P., Biavati, G., Bidlot, J., Bonavita, M., … Thépaut, J. N. (2020). The ERA5 global reanalysis. Quarterly Journal of the Royal Meteorological Society, 146(730), 1999–2049. Link to source: https://doi.org/10.1002/qj.3803  

°C days
015,000

Space heating demand (18 °C basis)

Heating degree days are an indicator of total space-heating demand to maintain an indoor temperature above 18 °C. Here we show annual average heating degree days for the decade ending in 2025.

Copernicus Climate Change Service. (2023). ERA5 hourly data on single levels from 1940 to present [Data set]. Copernicus Climate Change Service (C3S) Climate Data Store (CDS). Retrieved January 13, 2026 from Link to source: https://doi.org/10.24381/cds.adbb2d47     

Hersbach, H., Bell, B., Berrisford, P., Hirahara, S., Horányi, A., Muñoz‐Sabater, J., Nicolas, J., Peubey, C., Radu, R., Schepers, D., Simmins, A., Soci, C., Abdalla, S., Abellan, X., Balsamo, G., Bechtold, P., Biavati, G., Bidlot, J., Bonavita, M., … Thépaut, J. N. (2020). The ERA5 global reanalysis. Quarterly Journal of the Royal Meteorological Society, 146(730), 1999–2049. Link to source: https://doi.org/10.1002/qj.3803  

Maps Introduction

In this solution, heat pumps replace space-heating options that rely on fossil fuels. This primarily applies to North America, Asia, and Europe. Limited data are available for some regions, so this analysis focuses on European countries, Canada, the United States, Japan and China. 

The effectiveness of heat pumps at reducing GHG emissions is influenced by the heating needs of the region and the generation mix of the electricity grid. Areas with higher heating needs will generally show greater emissions reduction because more energy is needed to keep buildings warm. However, this is partially offset because heat pumps are less energy efficient on colder days. The local electricity grid mix matters because heat pumps are powered by electricity. Given the same outside temperature, regions with a largely emissions-free grid (e.g., France or Canada) will have higher emissions impacts from heat pump adoption than areas where electricity is  largely generated from fossil fuels (e.g., China). The type of heat pumps (all-electric vs. hybrid) best suited to each region depends on technological and economic factors.

Action Word
Use
Solution Title
Heat Pumps
Classification
Highly Recommended

Lawmakers and Policymakers

  • Introduce zero-carbon ready building codes, clearly designating heat pumps as the default for all new buildings.
  • Incentivize purchases with grants, loans, or tax rebates.
  • Increasing training and support for heat pump installers.
  • Expand the electrical grid and increase renewable energy generation.
  • Streamline permitting processes.
  • Incentivize complementary solutions such as better insulation, thermal storage, and air sealing.
  • Institute a clean heat standard (similar to a renewable energy standard) with a well-defined implementation timeline.
  • Launch performance labels for heating technology.
  • Roll out new energy efficiency programs.

Practitioners

  • Commit to zero-carbon construction, clearly designating heat pumps as the default for all new buildings.
  • Increase the available workforce by encouraging trade organizations to promote career and workforce development programs.
  • Design heat pumps that are simpler, faster, and cheaper to install.
  • Educate customers on the benefits and train them on usage.
  • Connect with users and early adopters to understand and adapt to consumer sentiment.
  • Create appealing incentives and financing programs.
  • Partner with builders and developers to improve product adoption and increase market demand for heat pumps.

Business Leaders

  • Commit to zero-carbon construction, clearly designating heat pumps as the default for all new buildings.
  • Deploy heat pumps in all owned and operated facilities.
  • Encourage building owners and managers to switch to heat pumps in leased facilities.
  • Promote the benefits of heat pumps and share government incentives with leased facilities and networks.
  • Encourage employees to reduce emissions at home by providing educational resources on the benefits of domestic heat pumps.

Further information:

Nonprofit Leaders

  • Advocate for zero-carbon construction and building codes that clearly designate heat pumps as the default for all new buildings.
  • Deploy heat pumps in owned and operated facilities.
  • Encourage building owners and managers to switch to heat pumps in leased facilities.
  • Educate businesses and communities on the benefits of installing heat pumps and any tax incentives in their region.
  • Advocate to policymakers for improved policies and incentives.
  • Educate community leaders on the need for adoption.

Investors

  • Commit to only finance zero-carbon construction with clear requirements for heat pumps as the default for all new development investments.
  • Deploy capital to efforts that improve heat pump performance and reduce material, installation, and maintenance costs.
  • Explore investment opportunities that address supply chain concerns.
  • Consider investments that mitigate non-manufacturing barriers to scaling.
  • Finance heat pump installations via low-interest loans.

Philanthropists and International Aid Agencies

  • Directly distribute heat pumps, prioritizing locations where heat pumps maximize emissions reductions, and improve housing affordability.
  • Advocate for zero-carbon construction and building codes that clearly designate heat pumps as the default for all new buildings.
  • Fund R&D efforts and competitions to improve technology, reduce costs, and address supply chain concerns.
  • Support consumer advocacy and education campaigns on heat pumps and how to maximize regulatory incentives.
  • Support training or incentive programs for distributors and installers.

Thought Leaders

  • Advocate for zero-carbon construction and building codes that clearly designate heat pumps as the default for all new buildings.
  • Highlight the need to transition away from fossil-fuel-fired heating.
  • Educate the public on the benefits of heat pumps and how they work.
  • Provide case studies that present successes and lessons learned.
  • Increase consumer comfort by including heat pumps in communication content on topics such as home remodeling and construction, technology, health, self-sufficiency, and personal finance.
  • Provide up-to-date user information on available models.

Technologists and Researchers

  • Identify safe, cost-effective, and suitable alternative refrigerants.
  • Design systems that require less refrigerant.
  • Work to increase the longevity of heat pumps.
  • Improve heat pumps’ efficiency and capacity at low temperatures as well as their ability to deliver higher temperature heat.
  • Research external social factors critical to adoption.
  • Identify appropriate methods for recycling and disposing of heat pumps and responsibly recovering their refrigerant chemicals at the end of the product life cycle. 

Further information:

Communities, Households, and Individuals

  • Install heat pumps when possible and encourage local heating, ventilation, and air conditioning (HVAC) retailers and installers to sell services and equipment.
  • Increase consumer comfort by sharing your experience and tips for troubleshooting technologies.
  • Advocate for zero-carbon construction and building codes that clearly designate heat pumps as the default for all new buildings.
  • Build support networks for new users and connect to explore innovations.
  • Encourage your property management company, employers, and government officials to accelerate adoption. 

Further information:

Evidence Base

Consensus of effectiveness in reducing GHG emissions: High

Electric heat pumps are generally viewed as the primary strategy for reducing GHG emissions from buildings. The Intergovernmental Panel on Climate Change ([IPCC] 2023) noted that heat pumps drive electrification in buildings and help decrease emissions. The European Commission (2022) claimed that heat pumps are an essential way of decreasing reliance on gas in heating while increasing the use of renewable energy in the heating sector. The IEA (2022) reported that heat pumps powered by electricity generated with renewable energy “are the central technology in the global transition to secure and sustainable heating.” IRENA (2024) claimed heat pumps in buildings “will play a crucial role in reducing reliance on fossil fuels.” 

In one of the largest scientific reviews on the topic, Gaur et al. (2021) concluded that heat pumps “have the potential to play a substantial role in the transition to low carbon heating,” and noted that emissions impacts of heat pumps are dependent on the type of heat pump technology, their location, and the electricity grid mix. Knobloch et al. (2020) studied 59 world regions and found that electrification of the heating sector via heat pumps will reduce emissions in most world regions where they are adopted.

The results presented in this document summarize findings from 46 reports, reviews and meta-analyses and 13 original studies reflecting current evidence from 30 countries, primarily European countries, Canada, the United States, Japan, and China. We recognize this limited geographic and technology scope creates bias, and hope this work inspires research and data sharing on this topic in underrepresented regions and in the commercial sector.

Updated Date
Coming Soon Label
Coming Soon

Deploy Building Automation Systems

Image
Image
Automate Building Systems
Coming Soon
Off

Key Takeaways

  • Building automation systems (BASs) include controls for heating, cooling, ventilation, plug loads and lighting for the purposes of saving energy in commercial buildings. 
  • Approximately 18% of global commercial floor area currently uses BASs.
  • Building types vary substantially with respect to energy usage and energy savings potential. That said, we estimate that BASs can reduce GHG emissions an estimated 0.011 t CO₂‑eq/yr on average for every square meter of building space.
  • We estimate that in high-income countries, 100% of floor space could be controlled by BAS, while low- and middle-income countries could achieve the current level of adoption in the United States, for a combined reduction of up to 0.36 Gt CO₂‑eq/yr.  
Summary

We define Deploy Building Automation Systems (BASs) as reducing commercial (i.e., nonresidential or industrial) building energy use and associated GHG emissions by using sensors to monitor a building in operation and control systems such as heating, cooling, ventilation, plug loads, and lighting for the purpose of saving energy. This solution does not include automated building systems that control security, safety, and other functions, and applies to existing buildings only. 

Description for Social and Search
Automating building systems for heating, cooling, and lighting reduce energy-related GHG emissions from commercial buildings.
Overview

BASs (also referred to as building energy management systems, building management systems, or building automation control systems) use automation to optimize system performance and reduce the energy needed to operate commercial buildings. This cuts emissions generated by the energy sources, including emissions from fuels burned to provide heating as well as emissions from generating the electricity used to power air conditioners, plug loads, and lighting. Together, these contribute to an estimated 3.7 Gt of energy-related emissions associated with operating nonresidential buildings per year (International Energy Agency [IEA], 2023b). This solution reduces critical climate pollutants, primarily CO₂, but also methane and nitrous oxides. 

The energy savings from BASs are the outcome of processes such as scheduled and occupancy-based control of heating, cooling, ventilation and lighting; optimization of set-point temperatures; predictive maintenance; and fault detection and diagnostics (Akbulut et al., 2025). Some BAS include smart controls that learn from occupant behaviors to optimize performance and energy savings (O’Grady et al., 2021). 

BASs can reduce commercial energy use by an estimated 5–40% (IEA, 2025). Local climate conditions, the type of BAS and how it is operated, building type and condition, and user behaviors can affect this outcome (Fernandez et al., 2017; Morkunaite et al., 2022). For example, modeling of U.S. buildings showed an average potential 23.3% energy savings with a BAS in supermarkets but a 48.8% energy savings for secondary schools and 29% savings for commercial buildings overall (Fernandez et al., 2017). These outcomes also included measures to correct for operational faults such as miscalibrated sensors and problems with seals. 

BASs typically consist of three architectural layers (Domingues et al., 2016) (Figure 1). At the field layer, sensors monitor conditions such as temperature, air flow, humidity, and lighting levels within a space and actuators adjust equipment in response to control signals. The control layer receives and processes incoming sensor data and sends control signals to the actuators according to programmed control logic and set parameters. The management layer is where data are logged, monitored, and analyzed to track and optimize performance, identify trends, and adjust automation settings. 

Figure 1. A typical BAS has three layers: a field layer, which senses the environment and adjusts equipment as needed; a control layer, which handles communication between the sensors and actuators; and a management layer, which logs and analyzes data to optimize performance. Modified from dos Santos et al. (2021) and Fluke (2009).

Image
Diagram demonstrating Automated Building Systems functions of management, controllers, and devices in the field.

Sources: dos Santos, D. R., Dagrada, M., & Costante, E. (2021). Leveraging operational technology and the Internet of things to attack smart buildings. Journal of Computer Virology and Hacking Techniques, 17(1), 1–20; Fluke (2009). Troubleshooting communications problems in building control systems. Fluke Corporation. 

References

ABI Research. (2025). Number of commercial buildings with automation systems by region [Report]. Link to source: https://www.abiresearch.com/news-resources/chart-data/forecast-number-of-automated-commercial-buildings-by-region 

Abuimara, T., Hobson, B. W., Gunay, B., O’Brien, W., & Kane, M. (2021). Current state and future challenges in building management: Practitioner interviews and a literature review. Journal of Building Engineering, 41, Article 102803. Link to source: https://doi.org/10.1016/j.jobe.2021.102803 

Akbulut, L., Taşdelen, K., Atılgan, A., Malinowski, M., Coşgun, A., Şenol, R., Akbulut, A., & Petryk, A. (2025). A systematic review of building energy management systems (BEMSs): Sensors, IoT, and AI integration. Energies, 18(24), Article 6522. Link to source: https://doi.org/10.3390/en18246522 

Ayorinde, E., & Kekana, L. I. (2025). Exploring the barriers facing the adoption of building automation systems for energy efficiency in a developing economy. Journal of Construction Project Management and Innovation, 15(2), 40–47. Link to source: https://doi.org/10.36615/jcpmi.v15i2.4371 

Backman, M. (2021). The commercial building automation market [Report]. Berg Insight. Link to source: https://media.berginsight.com/2021/02/07173719/bi-buildingautomation2-ps.pdf 

Domingues, P., Carreira, P., Vieira, R., & Kastner, W. (2016). Building automation systems: Concepts and technology review. Computer Standards & Interfaces, 45, 1–12. Link to source: https://doi.org/10.1016/j.csi.2015.11.005 

dos Santos, D. R., Dagrada, M., & Costante, E. (2021). Leveraging operational technology and the Internet of things to attack smart buildings. Journal of Computer Virology and Hacking Techniques, 17(1), 1–20. Link to source: https://doi.org/10.1007/s11416-020-00358-8 

Ebuy, H. T., Bril El Haouzi, H., Benelmir, R., & Pannequin, R. (2023). Occupant behavior impact on building sustainability performance: A literature review. Sustainability, 15(3), Article 2440. Link to source: https://doi.org/10.3390/su15032440 

European Parliament, & Council of the European Union. (2024). Directive (EU) 2024/1275 of the European parliament and of the council of 24 April 2024 on the energy performance of buildings (Document No. 32024L1275). Official Journal of the European Union. Link to source: https://eur-lex.europa.eu/legal-content/EN/TXT/?uri=OJ:L_202401275 

Fernandez, N., Xie, Y., Katipamula, S., Zhao, M., Wang, W., & Corbin, C. (2017). Impacts of commercial building controls on energy savings and peak load reduction (Report No. PNNL-25985). Pacific Northwest National Laboratory. Link to source: https://www.pnnl.gov/main/publications/external/technical_reports/PNNL-25985.pdf 

Fluke Coporation. (2009). Troubleshooting communications problems in building control systems. Fluke Corporation. Retrieved April 7, 2026, from Link to source: http://www.wecl.com.hk/Fluke/solutions/building-control-systems.pdf 

Garzia, F., Verbeke, S., Pozza, C., & Audenaert, A. (2023). Meeting user needs through building automation and control systems: A review of impacts and benefits in office environments. Buildings, 13(10), Article 2530. Link to source: https://doi.org/10.3390/buildings13102530 

Global Growth Insights. (2026). Building automation and control system market size, share, growth and industry analysis, by types (access control, electronic security and safety, energy management systems, fire and life safety, heating ventilation & air conditioning, other products), by applications (commercial, government, hospitality, industrial, institutional, IT/ITEs, residential, retail), regional insights and forecast to 2035 [Report GGI109442]. Retrieved February 12, 2026, from Link to source: https://www.globalgrowthinsights.com/market-reports/building-automation-and-control-system-market-109442 

Henneman, L., Choirat, C., Dedoussi, I., Dominici, F., Roberts, J., & Zigler, C. (2023). Mortality risk from United States coal electricity generation. Science, 382(6673), 941–946. Link to source: https://doi.org/10.1126/science.adf4915 

International Energy Agency. (2023a). Energy consumption in buildings by fuel in the net zero scenario, 2010-2030. Link to source: https://www.iea.org/data-and-statistics/charts/energy-consumption-in-buildings-by-fuel-in-the-net-zero-scenario-2010-2030-2 

International Energy Agency. (2023b). Global CO2 emissions from the operation of buildings in the net zero scenario, 2010-2030. Link to source: https://www.iea.org/data-and-statistics/charts/global-co2-emissions-from-the-operation-of-buildings-in-the-net-zero-scenario-2010-2030 

International Energy Agency. (2023c). Global floor area and buildings energy intensity in the net zero scenario, 2010-2030. Link to source: https://www.iea.org/data-and-statistics/charts/global-floor-area-and-buildings-energy-intensity-in-the-net-zero-scenario-2010-2030 

International Energy Agency. (2023d). Total floor area by use in the net zero scenario, 2010-2030. Link to source: https://www.iea.org/data-and-statistics/charts/total-floor-area-by-use-in-the-net-zero-scenario-2010-2030-2 

International Energy Agency. (2025). Energy efficiency 2025. Link to source: https://iea.blob.core.windows.net/assets/23a80bb2-6985-4507-ab99-c1d700f6548b/EnergyEfficiency2025.pdf 

Li, G., Ren, L., Fu, Y., Yang, Z., Adetola, V., Wen, J., Zhu, Q., Wu, T., Candan, K. S., & O’Neill, Z. (2023). A critical review of cyber-physical security for building automation systems. Annual Reviews in Control, 55, 237–254. Link to source: https://doi.org/10.1016/j.arcontrol.2023.02.004 

Morkunaite, L., Pupeikis, D., Jurelionis, A., Fokaides, P. A., & Papadopoulos, A. (2022). An analytical model for the impact of building control and automation upgrade on space heating energy efficiency. Buildings, 12(8), Article 1074. Link to source: https://doi.org/10.3390/buildings12081074 

Mulayim, O. B., Prakash, A. K., Paul, L., & Pritoni, M. (2025). Extraction and analysis of time series data from building automation systems using large language models. Lawrence Berkeley National Laboratory. Link to source: https://doi.org/10.20357/B73W4C 

O’Grady, T., Chong, H.-Y., & Morrison, G. M. (2021). A systematic review and meta-analysis of building automation systems. Building and Environment, 195, Article 107770. Link to source: https://doi.org/10.1016/j.buildenv.2021.107770 

Oliveira, A. P., Carraquico, T., & Martinez-Perez, C. (2026). Beyond efficiency: A systematic review of energy consumption and carbon footprint across the AI lifecycle. Sustainability, 18(3), Article 1359. Link to source: https://doi.org/10.3390/su18031359 

Poyyamozhi, M., Murugesan, B., Rajamanickam, N., Shorfuzzaman, M., & Aboelmagd, Y. (2024). IoT—A promising solution to energy management in smart buildings: A systematic review, applications, barriers, and future scope. Buildings, 14(11), Article 3446. Link to source: https://doi.org/10.3390/buildings14113446 

Rai, A. (2026). Building automation systems market analysis & forecast: 2026-2033. Coherent Market Insights. Retrieved February 12, 2026, from Link to source: https://www.coherentmarketinsights.com/market-insight/building-automation-systems-market-1350 

Taboada-Orozco, A., Yetongnon, K., & Nicolle, C. (2024). Smart buildings: A comprehensive systematic literature review on data-driven building management systems. Sensors, 24(13), Article 4405. Link to source: https://doi.org/10.3390/s24134405 

Trenbath, K., Meyer, R., Woldekidan, K., Maisha, K., & Harris, M. (2022). Commercial building sensors and control systems—Barriers, drivers, and costs [Technical report NREL/TP-6A50-82117]. National Renewable Energy Laboratory. Link to source: https://docs.nlr.gov/docs/fy22osti/82117.pdf 

U.S. Energy Information Administration. (2022a). Table B7. Building size, floorspace, 2018 [Data set]. Link to source: https://www.eia.gov/consumption/commercial/data/2018/bc/pdf/b7.pdf 

U.S. Energy Information Administration. (2022b). Table B12. Selected principal building activity: Part 1, floorspace, 2018 [Data set]. Link to source: https://www.eia.gov/consumption/commercial/data/2018/bc/pdf/b12.pdf 

U.S. Energy Information Administration. (2022c). Table B14. Selected principal building activity: Part 2, floorspace, 2018 [Data set]. Link to source: https://www.eia.gov/consumption/commercial/data/2018/bc/pdf/b14.pdf 

U.S. Environmental Protection Agency. (2026). Power sector programs—Progress report. Link to source: https://www.epa.gov/power-sector/progress-report 

van Roosmale, S., Audenaert, A., & Meysman, J. (2024). Understanding the opportunities and challenges of building automation and control systems to support facility management – An extensive literature review. Facilities, 42(7-8), 677–693. Link to source: https://doi.org/10.1108/F-05-2023-0042 

Van Thillo, L., Verbeke, S., & Audenaert, A. (2022). The potential of building automation and control systems to lower the energy demand in residential buildings: A review of their performance and influencing parameters. Renewable and Sustainable Energy Reviews, 158, Article 112099. Link to source: https://doi.org/10.1016/j.rser.2022.112099 

Vandenbogaerde, L., Verbeke, S., & Audenaert, A. (2023). Optimizing building energy consumption in office buildings: A review of building automation and control systems and factors influencing energy savings. Journal of Building Engineering, 76, Article 107233. Link to source: https://doi.org/10.1016/j.jobe.2023.107233 

Zarco-Soto, F. J., Zarco-Soto, I. M., Ali, S. S. S., & Zarco-Periñán, P. J. (2025). Energy consumption in buildings: A compilation of current studies. Energy Reports, 13, 1293–1307. Link to source: https://doi.org/10.1016/j.egyr.2024.12.069 

Credits

Lead Fellow

  • Heather McDiarmid Ph.D

Contributors

  • Ruthie Burrows, Ph.D.

  • James Gerber, Ph.D.

  • Daniel Jasper

  • Alex Sweeney

Internal Reviewers

  • Henry Igugu, Ph.D.

  • Amanda D. Smith, Ph.D.

  • Christina Swanson, Ph. D.

Effectiveness

We estimate that BASs reduce GHG emissions by 0.011 t CO₂‑eq/yr (20- and 100-yr basis) for every m2 of building space (Table 1) by reducing fuels and electricity used for heating, cooling and lighting. 

BASs reduce more emissions when installed in buildings that are energy intensive (e.g., hotels) or that use highly polluting fuels (e.g., heating oil) than in buildings that have low energy intensity (e.g., educational facilities) or that use renewable energy (Zarco-Soto et al., 2025).

We assumed 21% energy savings with BASs, which represents the median from 11 estimates, models, or measurements of whole-building energy savings from installed BASs. The effectiveness value is an average that was weighted for annual energy use per m2 by commercial building type and by the mix of fuels used for energy in buildings (IEA, 2023a). The analysis assumes that the relative proportion of commercial building space by type in the U.S. (U.S. Energy Information Administration [U.S. EIA], 2022b, 2022c) is representative of the proportions globally. 

Table 1. Effectiveness at reducing emissions.

Unit: t CO₂‑eq (100-year basis)/m2 using BAS/yr

Mean 0.011
Left Text Column Width
Cost

We determined that a BAS will cost US$0 per t CO₂‑eq reduced (Table 2) because the up-front cost is recovered through operational savings over the system’s lifetime. Buildings where energy savings are higher than average will show net savings because of higher operational savings, while more energy-efficient buildings may see a net cost.

The median up-front cost of the system is US$46/m2 building space but once installed, the system will save a building owner US$3.00/m2/yr in energy costs. Assuming a 15-year lifespan for the system, this results in a net cost of US$0/m2/yr. In other words, the system pays for itself in 15 years through operational savings.

The up-front cost includes the installed cost of the sensors, controllers, and networking infrastructure (Domingues et al., 2016). Operational costs consider only the cost savings from the 21% energy savings weighted by annual energy use per m2 by commercial building type, and relative building energy consumption by energy source (IEA, 2023a). The ongoing maintenance, software, and personnel costs are not included in this analysis. Additional savings may also be achieved through automated fault detection and diagnostics or other BAS features such as security. 

Table 2. Cost per unit climate impact.

Unit: US$ (2023) per t CO₂‑eq (100-year basis)

Median 0
Left Text Column Width

Methods and Supporting Data

Learning Curve

Insufficient data exists to assess the learning rate for BASs. However, market analyses suggest prices will decline due to competition and economies of scale, especially for midsize commercial buildings (Rai, 2026).

Speed of Action

Speed of action refers to how quickly a climate solution physically affects the atmosphere after it is deployed. This is different from speed of deployment, which is the pace at which solutions are adopted.

At Project Drawdown, we define the speed of action for each climate solution as emergency brake, gradual, or delayed.

Deploy Building Automation Systems is a GRADUAL climate solution. It has a steady, linear impact on the atmosphere. 

Caveats

Energy savings outcomes can differ based on whether they are derived from real world measurements or models, with modeled values often overestimating energy savings (Van Thillo et al., 2022; Vandenbogaerde et al., 2023). Model assumptions and simplifications, occupant behavior, real world conditions, and other factors contribute to the discrepancy (Van Thillo et al., 2022). Due to a lack of observed data, this analysis relies heavily on modeled energy savings. 

There can be very significant differences between building types in terms of total energy usage and energy savings potential. A U.S. study of BAS savings in commercial buildings modeled 4% energy savings in an efficient retail strip mall and 59% for an inefficient secondary school, with an aggregated average of 29% for all building types (Fernandez et al., 2017). Some building types, such as health-care facilities and technology centres, are underrepresented in studies of energy consumption in buildings (Zarco-Soto et al., 2025). 

Current Adoption

We estimated that 10 billion m2 of commercial building space use BASs (Table 3). We estimated this represents 18% of total commercial floor area based on collected data (ABI research, 2025; Global Growth Insights, 2026; IEA, 2023c; U.S. EIA, 2022a). This value is comparable to ABI research (2025) estimates that 15% of global commercial building stock use BASs, with highest adoption in North America and Western Europe.

These estimates were based on market reports from 2025 plus U.S. statistics from 2018 (ABI research, 2025; Global Growth Insights, 2026; U.S. EIA, 2022a). Market reports may overestimate BAS adoption as we defined it because they include BASs that focus on security and other applications. We expected most BASs to be ones that control the energy use of equipment. Adoption rates in the market reports are also expressed as a percentage of commercial buildings with BASs. We used this as a proxy for percentage of floor area, although this may be an underestimate because large buildings are more likely than small ones to use BASs (Trenbath et al., 2022).

Common barriers to BAS adoption are largely economic and technical ones such as high up-front costs, challenges with estimating savings, system complexity, and lack of interoperability (Trenbath et al., 2022). In low-income countries, there can be additional barriers such as power supply issues, limited access to technology, lack of awareness, and lack of trained workers (Ayorinde & Kekana, 2025). 

Table 3. Current adoption level (2025).

Unit: m2 using BASs

Mean 10,000,000,000
Left Text Column Width
Adoption Trend

We estimate that commercial building spaces add BASs at a rate of 730 million m2/yr (Table 4). This is based on a single market research report that estimated the percent of the global commercial buildings with BASs in 2024 and projected values for 2030 (ABI research, 2025). 

This value may not be an accurate indicator of the actual adoption trend for three reasons. First, it is based on a market report used to project future adoption. Second, we assume the percentage of the number of commercial buildings with BASs is a proxy for the percentage of building space with BASs, although larger commercial buildings may be more likely to adopt BASs. Finally, the market analysis did not differentiate between BASs that focus on energy savings and those that serve other purposes such as security. 

Market research groups are generally optimistic that BAS sales will see strong growth in the foreseeable future, especially in North America and Europe (Backman, 2021; Global Growth Insights, 2026).

Table 4. Adoption trend (2024–2030).

Unit: m2 BASs installed per year

Estimate 730,000,000
Left Text Column Width
Adoption Ceiling

If all existing commercial building space used BASs, they would serve 55 billion m2 of floor space globally (Table 5). This is based on the IEA’s estimate of total floor area for nonresidential buildings in 2022 (IEA, 2023d). 

Table 5. Adoption ceiling: upper limit for adoption level. 

Unit: m2 using BASs 

Estimate 55,000,000,000
Left Text Column Width
Achievable Adoption

We estimate that 17 to 34 billion m2 of existing commercial building space could be served by BASs (see Table 6). 

For the low achievable value, we applied Global Growth Insights’ (2026) estimate that 66% of U.S. commercial building stock use BASs to all high-income countries and applied ABI Research’s (2025) estimate that 12% of Asia Pacific buildings use BASs to all low- and middle-income countries. We used the percent of buildings with BASs as a proxy for the percent of commercial building area with BASs. The estimated low achievable adoption for BASs is consistent with our adoption trend applied over 10 years. 

For the high achievable value, we assumed all building space in high-income countries use BASs and applied the reported U.S. 2018 adoption rate of BASs for heating, cooling and ventilation to low- and middle-income countries (U.S. EIA, 2022a). The European Union’s Energy Performance of Buildings Directive requires all commercial buildings above a threshold output for heating and cooling to install BASs by the end of 2029 (European Parliament & Council of the European Union, 2024).

The high achievable adoption for BASs is consistent with an accelerated adoption trend, similar to that projected by market research (Backman, 2021; Global Growth Insights, 2026).

Table 6. Range of achievable adoption levels.

Unit: m2 using BASs

Current adoption 10,000,000,000
Achievable – low 17,000,000,000
Achievable – high 34,000,000,000
Adoption ceiling 55,000,000,000
Left Text Column Width

Current use of BASs reduces emissions by an estimated 0.11 Gt CO₂‑eq/yr (100- and 20-year basis, Table 7). If all existing commercial building space were served by BASs, it would reduce emissions by 0.58 Gt CO₂‑eq/yr (100- and 20-year basis). The estimated achievable range for existing buildings is 0.18–0.36 Gt CO₂‑eq/yr (100- and 20-year basis).

Table 7. Climate impact at different levels of adoption. 

Unit: Gt CO₂‑eq (100-year basis)/yr

Current adoption 0.11
Achievable – low 0.18
Achievable – high 0.36
Adoption ceiling 0.58
Left Text Column Width
Additional Benefits

Health

Reducing energy use may lower air pollution and limit exposure to pollutants such as lead and fine particulate matter generated by fossil fuels, thereby improving the health of nearby communities (Henneman et al., 2023; U.S. Environmental Protection Agency [U.S. EPA], 2026). There is limited evidence that building automation systems can improve visual and thermal comfort, leading to a better employee experience and increased productivity (Garzia et al., 2023; Trenbath et al., 2022). 

Air Quality

Reducing energy use can reduce climate and air pollutants associated with burning fossil fuels, such as CO₂, nitrogen oxides, methane, lead, and fine particulate matter (U.S. EPA, 2026).

Risks

Installing a BAS is no guarantee that the system will be used optimally. The complexity of BASs means that facility managers may not have the skills to realize the potential of the system (Mulayim et al., 2025). Occupant behavior is also a well-documented reason for why BASs fail to achieve energy savings. Occupant overrides of thermostats, opening of windows and blinds, etc., can significantly increase energy use (Ebuy et al., 2023). 

Interoperability is a major challenge for BASs. New subsystems and controls are not always able to interact with existing BASs due to lack of universal standards. This can leave building owners locked into a single vendor for projects and services and can increase system complexity (Taboada-Orozco et al., 2024; Van Roosmale et al., 2024). 

Existing buildings risk seeing their BASs becoming obsolete as the technology advances and technical support for legacy equipment disappears (Van Roosmale et al., 2024). In addition, the reliance of BASs on data collection and communication leaves systems vulnerable to reliability and security issues (Van Roosmale et al., 2024).

Artificial Intelligence (AI) and big data analytic tools are increasingly being combined with BAS to improve performance. However, AI and associated data centers are energy intensive and, because emissions associated with AI computing are higher than emissions associated with rule-based automation tools, emissions savings at the building may not overcome the significant emissions from AI data centers (Oliveira et al., 2026). 

Interactions with Other Solutions

Reinforcing

BASs can be used to increase or decrease electricity demand during critical times to facilitate integration of renewable energy and minimize grid peak events (Fernandez et al., 2017).

Competing

There are diminishing returns when solutions that reduce building heating and cooling energy use are combined. Thus the climate impact of these solutions will be reduced when combined with BASs. 

Dashboard

Solution Basics

square meter (m2) of commercial building space in which operational systems are controlled by a building automation system for the purpose of saving energy

t CO₂-eq (100-yr)/unit/yr
0.011
units
Current 1.0×10¹⁰ 01.7×10¹⁰3.4×10¹⁰
Achievable (Low to High)

Climate Impact

Gt CO₂-eq (100-yr)/yr
Current 0.11 0.180.36
US$ per t CO₂-eq
0
Gradual

CO₂ , CH₄, N₂O

Trade-offs

BASs add complexity and new costs to building management even while overall saving operational costs and emissions. Operating BASs effectively to maximize savings requires competencies in both the technical aspects of building operation and also data management and even programming, skill sets that often require ongoing training (Abuimara et al., 2021). Many BASs are internet connected which increases vulnerability to cyberattacks (Li et al., 2023). Depending on the priorities of the owners and operators and the characteristics of the building, investments in alternative energy efficiency measures such as building envelope upgrades and improved windows could provide a better return on investment.

°C – day
015,000

Space heating demand (18 °C basis)

Heating degree days are an indicator of total space-heating demand to maintain an indoor temperature above 18 °C. Here we show annual average heating degree days for the decade ending in 2025.

Copernicus Climate Change Service. (2023). ERA5 hourly data on single levels from 1940 to present [Data set]. Copernicus Climate Change Service (C3S) Climate Data Store (CDS). Retrieved January 13, 2026, from Link to source: https://doi.org/10.24381/cds.adbb2d47 

Hersbach, H., Bell, B., Berrisford, P., Hirahara, S., Horányi, A., Muñoz‐Sabater, J., Nicolas, J., Peubey, C., Radu, R., Schepers, D., Simmins, A., Soci, C., Abdalla, S., Abellan, X., Balsamo, G., Bechtold, P., Biavati, G., Bidlot, J., Bonavita, M., … Thépaut, J. N. (2020). The ERA5 global reanalysis. Quarterly Journal of the Royal Meteorological Society, 146(730), 1999–2049. Link to source: https://doi.org/10.1002/qj.3803 

°C – day
015,000

Space heating demand (18 °C basis)

Heating degree days are an indicator of total space-heating demand to maintain an indoor temperature above 18 °C. Here we show annual average heating degree days for the decade ending in 2025.

Copernicus Climate Change Service. (2023). ERA5 hourly data on single levels from 1940 to present [Data set]. Copernicus Climate Change Service (C3S) Climate Data Store (CDS). Retrieved January 13, 2026, from Link to source: https://doi.org/10.24381/cds.adbb2d47 

Hersbach, H., Bell, B., Berrisford, P., Hirahara, S., Horányi, A., Muñoz‐Sabater, J., Nicolas, J., Peubey, C., Radu, R., Schepers, D., Simmins, A., Soci, C., Abdalla, S., Abellan, X., Balsamo, G., Bechtold, P., Biavati, G., Bidlot, J., Bonavita, M., … Thépaut, J. N. (2020). The ERA5 global reanalysis. Quarterly Journal of the Royal Meteorological Society, 146(730), 1999–2049. Link to source: https://doi.org/10.1002/qj.3803 

Maps Introduction

BASs can save energy and GHG emissions in all geographies. We expect buildings in climates with high heating or cooling demand to show higher-than-average energy and emissions savings. Emissions savings will be lower in geographies that use cleaner heating fuels and low carbon electricity grids. 

BAS adoption is currently focused in high-income countries, but we expect it to grow in all parts of the world. Adoption is projected to increase significantly in the Asia-Pacific region due to rapid urban development and high uptake in new construction (ABI research, 2025; Global Growth Insights, 2026). In the Middle East and Africa, BASs are becoming common in new commercial buildings, driven in part by regional government mandates (Global Growth Insights, 2026). Meanwhile, the EU is requiring BASs in all commercial buildings with high heating and cooling needs (European Union, 2024) and more than 67% of new commercial buildings in North America now contain BASs (Global Growth Insights, 2026).

Action Word
Deploy
Solution Title
Building Automation Systems
Classification
Highly Recommended

Lawmakers and Policymakers

  • Set clear and measurable targets for building efficiency, emissions reduction, and the deployment of BASs.
  • Ensure public procurement standards require BASs for new commercial construction; require retrofits for existing public buildings.
  • Focus broader policies on energy efficiency through the use of intelligent control.
  • Create building codes that incentivize, facilitate, and/or phase in requirements for installing BASs in commercial buildings, in consultation with stakeholders and key actors; ensure building codes are consistent, offer clear guidelines, and are enforced; offer additional incentives for buildings that exceed requirements.
  • Create data security and privacy protection regulations for software and hardware; legally require periodic review to keep pace with technological advances and update policies as necessary; ensure legal liabilities are placed on equipment manufacturers and data managers, not building managers.
  • Work with international scientific bodies to establish standards for protocols, universal compatibility, data security, and privacy protection; align domestic with international standards.
  • Create regulations to discourage planned obsolescence and lock-in contracts for BAS maintenance, incentivize increased longevity for BAS hardware, and ensure data sharing between BAS operators and building owners.
  • Consider offering subsidies, tax breaks, or other financial incentives for the deployment of BASs; ensure financial incentives cover both new installations and retrofits.
  • Create regulatory frameworks that encourage the use of recycled materials for necessary hardware; require or encourage future models to be recyclable and/or modular to facilitate upgrades and reduce e-waste.
  • Simultaneously invest in energy and telecommunication infrastructure to facilitate connectivity; create backup power supplies and surge protection measures for electricity networks.
  • Create workforce training programs; create certification programs for retailers and installers; require periodic retraining to keep pace with technological developments.
  • Offer one-stop educational resources for BASs; offer demonstrations for installation and programming, and clear instructions on how to integrate the necessary components through online videos and in-person demos; offer building managers simplified recommendations for BAS hardware and software with comparisons to alternatives; clearly state benefits of BASs, highlighting the cost savings, social benefits, and environmental impacts.
  • Create or join green building certification schemes, green building councils, and/or public-private partnerships that offer information, training, and general support for BASs.

Practitioners

  • Adhere to – and endeavor to exceed – minimum building code requirements for integrating BASs into commercial building design, where available.
  • Properly train facility managers and offer free, easy-to-read instructional material; provide ongoing support, maintenance, and retraining when necessary; ensure training offers ample instruction on maintaining security and data privacy.
  • Help make systems interoperable and, when possible, universally compatible with other BASs.
  • Offer pay-as-you-go (PAYG) services to reduce initial financial burdens of BASs.
  • Offer recommendations or bundled services to increase capacity of a building's network infrastructure, ensuring it can accommodate a large number of devices.
  • Ensure data management protocols offer top-of-the-line security measures; identify appropriate data storage solutions, allowing for considerable data expansion; share building data with building owners and operators. 
  • Ensure technicians and employees are well versed in the complexity of integrating the different components of BASs and can offer accurate quotes for services.
  • Create workforce training programs; create certification programs for retailers and installers; require periodic retraining to keep pace with technological developments.
  • Work with other vendors and industry leaders to standardize terminology to improve customer service and increase adoption. Use open data formats and open data protocols to control costs and avoid vendor lock-in.
  • Offer digital displays that provide real-time feedback for automated operations and take into account manual overrides, showing managers the impacts of overrides such as adjusting thermostats.
  • Offer trade-in programs for old equipment and work with recycling facilities to recover as much material as possible; work with manufacturers to incorporate as much recycled material as possible into new products.
  • Offer one-stop educational resources for BASs; offer demonstrations for installation and programming, and clear instructions on how to integrate the necessary components through online videos and in-person demos; offer building managers simplified recommendations for BAS hardware and software with comparisons to alternatives; clearly state benefits of BASs highlighting the cost savings, social benefits, and environmental impacts.
  • Create or join green building certification schemes, green building councils, and/or public-private partnerships that offer information, training, and general support for BASs.

Business Leaders

  • Ensure corporate building and indoor spaces use BASs; take advantage of public incentives such as subsidies or tax credits for installation.
  • Refrain from overriding the system by addressing the needs of the building’s occupants and ensure facility managers are well trained to optimize energy and cost savings while maintaining comfort.
  • Help socialize the importance of BASs by incorporating these systems and related green building practices into corporate net zero strategies; highlight the use of BASs in public communications.
  • Invest in research and development to determine optimal user interfaces, protocols, compatibility, and/or algorithms for BASs.
  • Offer employees information on BASs and how to work with them to optimize cost and energy savings while preserving comfort.
  • Offer company grants to suppliers to improve energy use in their operations with BASs and related equipment.
  • Provide professional development opportunities to building management employees for training in BASs and other related fields.
  • Create or join green building certification schemes, green building councils, and/or public-private partnerships that offer information, training, and general support for BASs.

Further information:

Nonprofit Leaders

  • Ensure operations use BASs; take advantage of public incentives such as subsidies or tax credits for installation.
  • Refrain from overriding the system by addressing the needs of the building’s occupants and ensure facility managers are well trained to optimize energy and cost savings while maintaining comfort.
  • Help policymakers set clear and measurable targets for building efficiency, emissions reduction, and the deployment of BASs.
  • Help shift the focus of policymakers to broader policies on energy efficiency through the use of intelligent control.
  • Help create building codes that incentivize, facilitate, and/or phase in requirements for installing BASs in commercial buildings; help ensure building codes are enforced, are consistent, and offer clear guidelines; recommend additional incentives for buildings that exceed requirements.
  • Help design data security and privacy protection regulations for software and hardware; advocate for legal requirements for periodic reviews to keep pace with technological advances and require updates to policies as necessary; help ensure legal liabilities are placed on equipment manufacturers and data managers, not building managers.
  • Work with international scientific bodies to establish standards for protocols, universal compatibility, data security, and privacy protection; help align domestic with international standards.
  • Advocate for regulatory frameworks that discourage business practices that reduce adoption such as planned obsolescence; help create regulatory standards that incentivize increasing the longevity of the hardware required for BASs.
  • Advocate for subsidies, tax breaks, or other financial incentives for the deployment of BASs; help target subsidies to low- and middle-income communities and recommend policymakers simultaneously offer incentives for broadband and digital connectivity; help ensure financial incentives cover both new installations and retrofits.
  • Help create regulatory frameworks that encourage the use of recycled materials for necessary hardware; advocate for requirements or incentives for future models to be recyclable and/or modular to facilitate upgrades and reduce e-waste.
  • Simultaneously advocate for investments in energy and telecommunication infrastructure to facilitate connectivity; help policymakers plan and create backup power supplies and surge protection measures for electricity networks.
  • Create workforce training programs; create certification programs for retailers and installers; offer periodic retraining to keep pace with technological developments.
  • Offer one-stop educational resources for BASs; offer demonstrations for installation and programming, and clear instructions on how to integrate the necessary components through online videos and in-person demos; offer building managers simplified recommendations for BAS hardware and software with comparisons to alternatives; clearly state benefits of BASs highlighting the cost savings, social benefits, and environmental impacts.
  • Create or join green building certification schemes, green building councils, and/or public-private partnerships that offer information, training, and general support for BASs.

Further information:

Investors

  • Finance only new commercial construction and retrofits that use BASs as well as other green building practices.
  • Invest in research and development to improve BAS hardware and software compatibility and user experience for building managers.
  • Invest in start-ups seeking to deploy BASs; offer preferential loan agreements for developers using BASs, energy efficient building practices, and other related climate solutions.
  • Invest in businesses seeking to improve the longevity of BAS hardware and equipment; invest in companies improving the recyclability of hardware and/or incorporating recycled materials into new products; invest in projects seeking to make BAS hardware more resilient to climatic conditions such as high heat and humidity.
  • Invest in companies seeking to improve data security and privacy protection measures for BAS hardware and/or software; invest in companies seeking to simplify software to create a better user experience for building managers.
  • Issue or buy green bonds to deploy capital to projects that use BASs and integrate other green building practices.
  • Create or join green building certification schemes, green building councils, and/or public-private partnerships that offer information, training, and general support for BASs.

Further information:

Philanthropists and International Aid Agencies

  • Ensure operations use BASs; take advantage of public incentives such as subsidies or tax credits for installation.
  • Refrain from overriding the system by addressing the needs of the building’s occupants and ensure facility managers are well trained to optimize energy and cost savings while maintaining comfort.
  • Finance only new commercial construction and retrofits that use BASs as well as other green building practices.
  • Offer grants or preferential loan agreements for commercial developers using BASs, energy efficient building practices, and other related climate solutions.
  • Offer grants or invest in businesses seeking to improve the longevity of BAS hardware and equipment; offer financing for companies improving the recyclability of hardware and/or incorporating recycled materials into new products; invest in projects seeking to make BAS hardware more resilient to climatic conditions such as high heat and humidity.
  • Offer financing to companies seeking to improve data security and privacy protection measures for BAS hardware and/or software; provide grants or invest in companies seeking to simplify software to create a better user experience for building managers. Support the development of open data standards and control protocols.
  • Issue or buy green bonds to deploy capital to projects that use BASs and integrate other green building practices.
  • Help policymakers set clear and measurable targets for building efficiency, emissions reduction, and the deployment of BASs in commercial buildings.
  • Help shift the focus of policymakers to broader policies on energy efficiency through the use of intelligent control.
  • Help create building codes that incentivize, facilitate, and/or phase in requirements for installing BASs in commercial buildings; help ensure building codes are enforced, are consistent, and offer clear guidelines; recommend additional incentives for buildings that exceed requirements.
  • Help design data security and privacy protection regulations for software and hardware; advocate for legal requirements for periodic reviews to keep pace with technological advances and require updates to policies as necessary; help ensure legal liabilities are placed on equipment manufacturers and data managers, not building managers.
  • Work with international scientific bodies to establish standards for protocols, universal compatibility, data security, and privacy protection; help align domestic with international standards.
  • Advocate for regulatory frameworks that discourage business practices that reduce adoption, such as planned obsolescence; help create regulatory standards that incentivize increasing the longevity of the hardware required for BASs.
  • Advocate for subsidies, tax breaks or other financial incentives for the deployment of BASs in commercial buildings; help target subsidies to low- and middle-income communities and recommend policymakers simultaneously offer incentives for broadband and digital connectivity; help ensure financial incentives cover both new installations and retrofits.
  • Help create regulatory frameworks that encourage the use of recycled materials for necessary hardware; advocate for requirements or incentives for future models to be recyclable and/or modular to facilitate upgrades and reduce e-waste.
  • Simultaneously advocate for investments in energy and telecommunication infrastructure to facilitate connectivity; help policymakers plan and create backup power supplies and surge protection measures for electricity networks.
  • Create workforce training programs; create certification programs for retailers and installers; offer periodic retraining to keep pace with technological developments.
  • Offer one-stop educational resources for BASs; offer demonstrations for installation and programming, and clear instructions on how to integrate the necessary components through online videos and in-person demos; offer building managers simplified recommendations for BAS hardware and software with comparisons to alternatives; clearly state benefits of BASs highlighting the cost savings, social benefits, and environmental impacts.
  • Create or join green building certification schemes, green building councils, and/or public-private partnerships that offer information, training, and general support for BASs.

Further information:

Thought Leaders

  • Help policymakers set clear and measurable targets for building efficiency, emissions reduction, and BAS deployment in commercial buildings.
  • Help shift the focus of policymakers to broader energy efficiency policies through the use of intelligent control.
  • Help create building codes that incentivize, facilitate, and/or phase in requirements for installing BASs in commercial buildings; help ensure building codes are enforced, are consistent, and offer clear guidelines; recommend additional incentives for buildings that exceed requirements.
  • Help design data security and privacy protection regulations for software and hardware; advocate for legal requirements for periodic reviews to keep pace with technological advances and require updates to policies as necessary; help ensure legal liabilities are placed on equipment manufacturers and data managers, not building managers.
  • Work with international scientific bodies to establish standards for protocols, universal compatibility, data security, and privacy protection; help align domestic and international standards.
  • Advocate for regulatory frameworks that discourage business practices that reduce adoption such as planned obsolescence; help create regulatory standards that incentivize increasing the longevity of the hardware required for BASs.
  • Advocate for subsidies, tax breaks or other financial incentives for the deployment of BASs in commercial buildings; help target subsidies to low- and middle-income communities and recommend policymakers simultaneously offer incentives for broadband and digital connectivity; help ensure financial incentives cover both new installations and retrofits.
  • Help create regulatory frameworks that encourage the use of recycled materials for necessary hardware; advocate for requirements or incentives for future models to be recyclable and/or modular to facilitate upgrades and reduce e-waste.
  • Simultaneously advocate for investments in energy and telecommunication infrastructure to facilitate connectivity; help policymakers plan and create backup power supplies and surge protection measures for electricity networks.
  • Create workforce training programs; create certification programs for retailers and installers; offer periodic retraining to keep pace with technological developments.
  • Offer one-stop educational resources for BASs; offer demonstrations for installation and programming, and clear instructions on how to integrate the necessary components through online videos and in-person demos; offer building managers simplified recommendations for BAS hardware and software with comparisons to alternatives; clearly state benefits of BASs highlighting the cost savings, social benefits, and environmental impacts.
  • Create or join green building certification schemes, green building councils, and/or public-private partnerships that offer information, training, and general support for BASs.

Further information:

Technologists and Researchers

  • Help create building automation protocols; make systems interoperable and, when possible, universally compatible with other BASs; help ensure product lines don’t lock facility managers into single vendor products and services; help resolve discrepancies in data formats and architectures to facilitate data exchange, integration, and efficiency.
  • Design BASs to facilitate upgrades in both software and hardware; create long-lasting products that are widely compatible with other necessary technology to decrease e-waste.
  • Help design BASs to be recyclable, use recycled materials, and require low amounts of raw materials.
  • Help create security measures for necessary software and hardware to protect privacy and data.
  • Create open-source platforms to allow for development and improve integration of BAS software.
  • Help design environmentally resilient hardware that can operate effectively in high temperatures and humidity. 
  • Help create more accurate models for building managers to determine energy and cost savings compared to initial costs for transitioning to BASs.
  • Help create simplified processes for software updates to allow building managers to carry out updates without needing a professional technician to assist.
  • Incorporate charging for electric vehicles into BASs to optimize energy and cost savings.

Further information:

Communities, Households, and Individuals

  • Inquire about the use of BASs in local public buildings and facilities and at your place of employment; encourage building owners and managers to adopt them.
  • Advocate for regulatory frameworks that discourage business practices that reduce adoption such as planned obsolescence; help create regulatory standards that incentivize increasing the longevity of the hardware required for BASs.
  • Advocate for subsidies, tax breaks, or other financial incentives to deploy BASs in commercial buildings; help ensure financial incentives cover both new installations and retrofits.
  • Simultaneously advocate for investments in energy and telecommunication infrastructure to facilitate connectivity; help policymakers plan and create backup power supplies and surge protection measures for electricity networks.

Further information:

Evidence Base

Consensus of effectiveness in reducing GHG emissions: High. 

The IEA (2025)’s report on energy efficiency highlighted the importance of digital optimization using automation to boost efficiency gains in commercial buildings worldwide. 

O’Grady et al. (2021)’s review showed consistent energy and peak power savings plus improved human comfort with BASs. Most studies relied on models and there was a noted lack of field case studies to understand discrepancies between measured and modeled values. 

Fernandez et al. (2017) modeled the energy savings potential with advanced building control systems focussing on heating, cooling, and ventilation across 14 commercial building types and 16 U.S. climate regions. They reported an aggregated average of 29% annual energy savings with building control systems. 

Taboada-Orozco et al. (2024)’s comprehensive review of BAS studies noted discrepancies between model predictions and real world measures due to occupant behaviors. They highlighted emerging applications of BASs such as health-care assistance, indoor navigation, and improving indoor air quality. 

Poyyamozhi et al. (2024) profiled how the use of Internet of Things (IoT) technology in BASs has the potential to enhance its energy savings through machine learning and adjustments based on real-time data.

The results presented in this document summarize findings from two reviews and meta-analyses, five original studies, six technical reports, four market reports, eight product information webpages, and four databases reflecting current evidence from the U.S. and for the world as a whole. We recognize this limited geographic scope creates bias, and hope this work inspires research and data sharing on this topic in underrepresented regions.

Updated Date
Coming Soon Label
Coming Soon

Improve Windows & Glass

Image
Image
Building with many windows
Coming Soon
Off
Summary

We define Improve Windows & Glass as reducing the heat transferred through typical windows used in residential and nonresidential buildings by improving the thermal insulation capacity of the glass. Windows typically constitute a small portion of a building envelope but account for a substantial portion of the heat transferred (gained or lost) between the indoor space and the external environment. Using double-glazed rather than single-glazed windows cuts GHG emissions by reducing the energy required to heat or cool a building’s interior and improves the thermal comfort of its occupants.

Description for Social and Search
Improve Windows & Glass is a Highly Recommended climate solution. Upgrading single-glazed windows to double-glazing saves money, improves comfort, and cuts GHG emissions.
Overview

Windows represent 15–40% of a building's total envelope surface area (Shah et al., 2024). A significant amount of the heat transmitted through the building envelope occurs via windows (Basok et al., 2022; Cuce & Riffat, 2015), and the uncontrolled flow of heat due to poor thermal insulation capabilities of windows and glass can generally increase the energy required for heating or cooling indoor spaces by 30–50% (Arasteh et al., 2006; Balali et al., 2023; Gustavsen et al., 2011). Improving windows and glass helps reduce heat gain in warm climates and heat loss in cold climates, thereby reducing the energy required to thermally condition indoor spaces and cutting energy-related emissions while improving occupant comfort.

Operating buildings accounts for approximately 30% of global energy consumption (Delmastro & Chen, 2023). The International Energy Agency (IEA, 2023e) stated that heating indoor spaces accounted for more than 41 EJ of energy in 2022 (an equivalent of about 11,400 TWh). This energy is mainly fossil fuel–based (oil, natural gas, and coal), but also includes electricity, modern bioenergy, and solar thermal (IEA, 2023b; 2023e) (Figure 1). Space cooling is largely achieved through air conditioners. In 2022, cooling buildings used approximately 2,111 TWh (an equivalent of about 8 EJ) (IEA, 2023d; Ritchie, 2024). According to the IEA (2018), annual space-cooling energy consumption in 2016 (2,020 TWh) was more than three times its levels in 1990. Considering the mix of energy sources (IEA, 2023b), this solution potentially cuts CO₂, methane, and nitrous oxide emissions and reduces black carbon and F-gas refrigerant emissions from operating heating and cooling systems (Richardson, 2024; Pistochini et al., 2022).

Figure 1. Energy used in buildings globally largely originates from fossil fuel–based sources.

Source: International Energy Agency. (2023b, June 15). Energy consumption in buildings by fuel in the net zero scenario, 2010-2030. 

The properties of a window determine the rate of heat transfer (i.e., its thermal transmittance or U-value) and thus its efficacy at decreasing the flow of heat between the indoors and outdoors (Aguilar-Santana, 2020; Saint-Gobain, 2018). Window types such as double-glazed, double-glazed with low emissivity (low-e) coating, or triple-glazed (Figure 2) perform better than single-glazed windows due to their lower U-values (Aguilar-Santana et al., 2020; Li et al., 2023; Salazar et al., 2024). In more resourced countries or regions such as the United States, Canada, and the European Union, a minimum of double glazing is considered standard practice, accounting for a growing share of the number of windows installed or sold annually (Hermelink et al., 2017; Janssens, 2021). However, the minimum glazing U-value standards set by building energy regulations in most low- and middle-income countries, where the bulk of new construction occurs (IEA, 2023c), often do not mandate the use of better performing windows in buildings (Gaum, 2023). 

Improve Windows and Glass assesses the impact of retrofitting single-glazed windows in the current (2022) global building stock, focusing on scaling up the use of double glazing as the minimum. Retrofitting extends the lifespan of building components and helps these buildings remain in use. The U-value of 2.7 W/m2K we used for double glazing during our analysis also includes other double pane window types with similar U-values such as secondary glazing where a second window is added to the outside of the existing one.

Figure 2. Multiple-glazed windows reduce heat transmission better than single glazed windows and so create less demand for GHG-producing fuels. Modified from Aguilar-Santana et al. (2020) and Moghaddam et al. (2023).

Image
A description of different glazing types.

Sources: Aguilar-Santana, J. L., Jarimi, H., Velasco-Carrasco, M., & Riffat, S. (2020). Review on window-glazing technologies and future prospects. International Journal of Low-Carbon Technologies, 15(1), 112–120; Moghaddam, S. A., Serra, C., Gameiro da Silva, M., & Simões, N. (2023). Comprehensive review and analysis of glazing systems towards nearly zero-energy buildings: Energy performance, thermal comfort, cost-effectiveness, and environmental impact perspectives. Energies, 16(17), Article 6283.

References

Aguilar-Santana, J. L., Jarimi, H., Velasco-Carrasco, M., & Riffat, S. (2020). Review on window-glazing technologies and future prospects. International Journal of Low-Carbon Technologies, 15(1), 112–120. Link to source: https://doi.org/10.1093/ijlct/ctz032

Ahmed, A. E., Suwaed, M. S., Shakir, A. M., & Ghareeb, A. (2025). The impact of window orientation, glazing, and window-to-wall ratio on the heating and cooling energy of an office building: The case of hot and semi-arid climate. Journal of Engineering Research, 13(1), 409–422. Link to source: https://doi.org/10.1016/j.jer.2023.10.034

Arasteh, D., Selkowitz, S., Apte, J., & LaFrance, M. (2006). Zero energy windows. Lawrence Berkeley National Laboratory. Link to source: https://escholarship.org/uc/item/2zp5m6x8

Aroul, R., & Hansz, J. A. (2011). The role of dual-pane windows and improvement age in explaining residential property values. Journal of Sustainable Real Estate, 3(1), 142–161. Link to source: https://doi.org/10.1080/10835547.2011.12091822

Aruta, G., Ascione, F., Iovane, T., & Mastellone, M. (2025). Double-skin façades for the refurbishment of historic buildings: Energy-economic feasibility for different types of glazing and ventilation rates. Journal of Building Engineering, 103, Article 112125. Link to source: https://doi.org/10.1016/j.jobe.2025.112125

Asahi India Glass Ltd. (2025, April 25). Top benefits of float glass in modern homes. Link to source: https://www.aisglass.com/blog/top-benefits-of-float-glass-in-modern-homes/

Balali, A., Yunusa-Kaltungo, A., & Edwards, R. (2023). A systematic review of passive energy consumption optimisation strategy selection for buildings through multiple criteria decision-making techniques. Renewable and Sustainable Energy Reviews, 171, Article 113013. Link to source: https://doi.org/10.1016/j.rser.2022.113013

Balasbaneh, A. T., Yeoh, D., Ramli, M. Z., & Valdi, M. H. T. (2022). Different alternative retrofit to improving the sustainability of building in tropical climate: Multi-criteria decision-making. Environmental Science and Pollution Research, 29(27), 41669–41683. Link to source: https://doi.org/10.1007/s11356-022-18647-8

Basok, B., Davydenko, B., Novikov, V., Pavlenko, A. M., Novitska, M., Sadko, K., & Goncharuk, S. (2022). Evaluation of heat transfer rates through transparent dividing structures. Energies, 15(13), Article 4910. Link to source: https://doi.org/10.3390/en15134910

Bulut, M., Wilkinson, S., Khan, A., Jin, X.-H., & Lee, C. L. (2021). Perceived benefits of retrofitted residential secondary glazing: An exploratory Australian study. International Journal of Building Pathology and Adaptation, 39(5), 720–733. Link to source: https://doi.org/10.1108/IJBPA-09-2020-0083

Calautit, J. K., Sun, H., Li, J., Dik, A., & Mohammadi, M. (2025). Keeping it simple: Field testing and techno-economic assessment of a low-cost secondary quad glazing for enhanced energy efficiency in buildings [Corrected proof]. Energy and Built Environment. Link to source: https://doi.org/10.1016/j.enbenv.2025.03.004

Cuce, E., & Riffat, S. B. (2015). Aerogel-assisted support pillars for thermal performance enhancement of vacuum glazing: A CFD research for a commercial product. Arabian Journal for Science and Engineering, 40(8), 2233–2238. Link to source: https://doi.org/10.1007/s13369-015-1727-5

Delmastro, C., & Chen, O. (2023, July 11). Energy system: Buildings. International Energy Agency. Link to source: https://www.iea.org/energy-system/buildings

Department for Levelling Up, Housing and Communities. (2023, December 14). Accredited official statistics chapter 5: Energy efficiency. GOV.UK. Link to source: https://www.gov.uk/government/statistics/chapters-for-english-housing-survey-2022-to-2023-headline-report/chapter-5-energy-efficiency#contents

DIY Double Glaze. (n.d.). 6 problems with double glazed windows and how you can resolve them. Retrieved September 13, 2025, from Link to source: https://www.diydoubleglaze.com.au/6-problems-with-double-glazed-windows-and-how-you-can-resolve-them/

Duan, Q., Hinkle, L., Wang, J., Zhang, E., & Memari, A. (2021). Condensation effects on energy performance of building window systems. Energy Reports, 7, 7345–7357. Link to source: https://doi.org/10.1016/j.egyr.2021.10.096

Es-sakali, N., Kaitouni, S. I., Laasri, I. A., Mghazli, M. O., Cherkaoui, M., & Pfafferott, J. (2022). Assessment of the energy efficiency for a building energy model using different glazing windows in a semi-arid climate. Proceedings of the 13th International Renewable Energy Congress (IREC), 1–5. Link to source: https://doi.org/10.1109/IREC56325.2022.10001934

Gasparotto, J., & Da Boit Martinello, K. (2021). Coal as an energy source and its impacts on human health. Energy Geoscience, 2(2), 113–120. Link to source: https://doi.org/10.1016/j.engeos.2020.07.003

Gaum, T. (2023). Building energy codes in the Global South: Comparing selected variables to develop a decision-making model to address climate-change guidelines [Spreadsheet]. SLIM3. Link to source: https://docs.google.com/spreadsheets/d/1aP4zaeDvfwSI-3Abuj8Z_VUUEHJzjMZS/edit?gid=988383392#gid=988383392

Gaum, T., & Laubscher, J. (2022). Building energy codes: Reviewing the status of implementation strategies in the Global South. International Journal of Built Environment and Sustainability, 9(1), 39–53. Link to source: https://doi.org/10.11113/ijbes.v9.n1.871

Global Alliance for Buildings and Construction, International Energy Agency, & the United Nations Environment Programme. (2020). GlobalABC regional roadmap for buildings and construction in Africa 2020-2050: Towards a zero-emission, efficient and resilient buildings and construction sector [Report]. International Energy Agency. Link to source: https://globalabc.org/sites/default/files/inline-files/Africa_Buildings%20Roadmap_FINAL_1.pdf

Gomaa, M. M., Abdallah, A. S. H., Aloshan, M. A., & Ragab, A. (2025). A comparative analysis of advanced glazing technologies for energy-efficient buildings in Jeddah city, Saudi Arabia. Buildings, 15(9), Article 1477. Link to source: https://doi.org/10.3390/buildings15091477

Gustavsen, A., Grynning, S., Arasteh, D., Jelle, B. P., & Goudey, H. (2011). Key elements of and material performance targets for highly insulating window frames. Energy and Buildings, 43(10), 2583–2594. Link to source: https://doi.org/10.1016/j.enbuild.2011.05.010

Harkouss, F., Fardoun, F., & Biwole, P. H. (2018). Multi-objective optimization methodology for net zero energy buildings. Journal of Building Engineering, 16, 57–71. Link to source: https://doi.org/10.1016/j.jobe.2017.12.003

Henneman, L., Choirat, C., Dedoussi, I., Dominici, F., Roberts, J., & Zigler, C. (2023). Mortality risk from United States coal electricity generation. Science, 382(6673), 941–946. Link to source: https://doi.org/10.1126/science.adf4915

Hermelink, A., von Manteuffel, B., & Grözinger, J. (2017). Minimum performance requirements for window replacement in the residential sector [Report]. ECOFYS. Link to source: https://glassforeurope.com/wp-content/uploads/2018/04/Minimum-performance-requirements-for-window-replacement-in-the-residential-sector.pdf

International Energy Agency. (2018). The future of cooling: Opportunities for energy-efficient air conditioning. Link to source: https://www.iea.org/reports/the-future-of-cooling

International Energy Agency. (2022a, September 1). Global buildings sector CO2 emissions and floor area in the net zero scenario, 2020-2050. Link to source: https://www.iea.org/data-and-statistics/charts/global-buildings-sector-co2-emissions-and-floor-area-in-the-net-zero-scenario-2020-2050

International Energy Agency. (2022b). Renovation of near 20% of existing building stock to zero-carbon-ready by 2030 is ambitious but necessary. Link to source: https://www.iea.org/reports/renovation-of-near-20-of-existing-building-stock-to-zero-carbon-ready-by-2030-is-ambitious-but-necessary

International Energy Agency. (2023b, June 15). Energy consumption in buildings by fuel in the net zero scenario, 2010-2030. Link to source: https://www.iea.org/data-and-statistics/charts/energy-consumption-in-buildings-by-fuel-in-the-net-zero-scenario-2010-2030-2

International Energy Agency. (2023c, June 15). Global floor area and buildings energy intensity in the net zero scenario, 2010-2030. Link to source: https://www.iea.org/data-and-statistics/charts/global-floor-area-and-buildings-energy-intensity-in-the-net-zero-scenario-2010-2030

International Energy Agency. (2023d). Space cooling: Net zero emissions guide. Link to source: https://www.iea.org/reports/space-cooling-2

International Energy Agency. (2023e). Space heating: Net zero emissions guide. Link to source: https://www.iea.org/reports/space-heating

International Energy Agency. (2023f, July 11). Total floor area by use in the net zero scenario, 2010-2030. Link to source: https://www.iea.org/data-and-statistics/charts/total-floor-area-by-use-in-the-net-zero-scenario-2010-2030-2

International Energy Agency. (2024). World energy balances. Link to source: https://www.iea.org/data-and-statistics/data-product/world-energy-balances

Janssens, C. (2021, September 27). Minimum energy performance requirements for window replacement in the 28 EU member states. Glassonweb. Link to source: https://www.glassonweb.com/article/minimum-energy-performance-requirements-window-replacement-28-eu-member-states 

Karabay, H., & Arici, M. (2012). Multiple pane window applications in various climatic regions of Turkey. Energy and Buildings, 45, 67–71. Link to source: https://doi.org/10.1016/j.enbuild.2011.10.020

Krarti, M., & Ihm, P. (2016). Evaluation of net-zero energy residential buildings in the MENA region. Sustainable Cities and Society, 22, 116–125. Link to source: https://doi.org/10.1016/j.scs.2016.02.007

Li, N., Meng, Q., Zhao, L., Li, H., Wang, J., Zhang, N., Wang, P., & Lu, S. (2023). Thermal performance study of multiple thermal insulating glazings with polycarbonate films as interval layers. Journal of Building Engineering, 76, Article 107159. Link to source: https://doi.org/10.1016/j.jobe.2023.107159

Likins-White, M., Tenent, R. C., & Zhai, Z. (2023). Degradation of insulating glass units: Thermal performance, measurements and energy impacts. Buildings, 13(2), Article 551. Link to source: https://doi.org/10.3390/buildings13020551

Lozinsky, C. H., Casquero-Modrego, N., & Walker, I. S. (2025). The health and indoor environmental quality impacts of residential building envelope retrofits: A literature review. Building and Environment, 270, Article 112568. Link to source: https://doi.org/10.1016/j.buildenv.2025.112568

Magraoui, C., Derradji, L., Hamid, A., Oukaci, S., Limam, A., & Merabtine, A. (2025). A smart roller shutters control for enhancing thermal comfort and sustainable energy efficiency in office buildings. Sustainability, 17(5), Article 2116. Link to source: https://doi.org/10.3390/su17052116

Menzies, G. F., & Wherrett, J. R. (2005). Multiglazed windows: Potential for savings in energy, emissions and cost. Building Services Engineering Research & Technology, 26(3), 249–258. Link to source: https://doi.org/10.1191/0143624405bt132tn

MLI Building Products. (2023, February 27). Are glass prices set to rise in 2023? Link to source: https://www.mlibuildingproducts.co.uk/glass-prices-rise-2023/

Moghaddam, S. A., Serra, C., Gameiro da Silva, M., & Simões, N. (2023). Comprehensive review and analysis of glazing systems towards nearly zero-energy buildings: Energy performance, thermal comfort, cost-effectiveness, and environmental impact perspectives. Energies, 16(17), Article 6283. Link to source: https://doi.org/10.3390/en16176283

Natural Resources Canada. (n.d.). Table 4.5a – Windows by region. Government of Canada. Retrieved July 23, 2025, from Link to source: https://oee.nrcan.gc.ca/corporate/statistics/neud/dpa/showTable.cfm?type=SH&sector=aaa&juris=ca&year=2019&rn=35&page=1

Owolabi, A. B., Suh, D., & Pignatta, G. (2023). Investigating the energy use in an Australian building: A case study of a west-facing apartment in Sydney. Ain Shams Engineering Journal, 14(8), Article 102040. Link to source: https://doi.org/10.1016/j.asej.2022.102040

Paarhammer. (n.d.). New building regulations coming soon. Paarhammer windows and doors. Retrieved August 15, 2025, from Link to source: https://www.paarhammer.com.au/blog/new-building-regulations-coming-soon

Pistochini, T., Dichter, M., Chakraborty, S., Dichter, N., & Aboud, A. (2022). Greenhouse gas emission forecasts for electrification of space heating in residential homes in the US. Energy Policy, 163, Article 112813. Link to source: https://doi.org/10.1016/j.enpol.2022.112813

Procurement Resource. (n.d.). Float glass price trend and forecast. Retrieved September 19, 2025, from Link to source: https://www.procurementresource.com/resource-center/glass-price-trends

Ren, Z., Wang, X., & Chen, D. (2014). Heat stress within energy efficient dwellings in Australia. Architectural Science Review, 57(3), 227–236. Link to source: https://doi.org/10.1080/00038628.2014.903568

Richardson, J. (2024, December 31). CO2 carbon savings of a heat pump and their environmental cost. The Renewable Energy Hub UK. Link to source: https://www.renewableenergyhub.co.uk/main/heat-pumps-information/co2-carbon-savings-of-a-heat-pump-and-their-environmental-cost#:~:text=Fluorinated%20hydrocarbons%20such%20as%20HFCs,warming%20potential

Ritchie, H. (2024). Air conditioning causes around 3% of greenhouse gas emissions. How will this change in the future? Our World in Data. Link to source: https://archive.ourworldindata.org/20251125-173858/air-conditioning-causes-around-greenhouse-gas-emissions-will-change-future.html 

Saadatian, S., Freire, F., & Simões, N. (2021). Embodied impacts of window systems: A comparative assessment of framing and glazing alternatives. Journal of Building Engineering, 35, Article 102042. Link to source: https://doi.org/10.1016/j.jobe.2020.102042

Saint-Gobain. (2018). Solar & thermal 1e thermal insulation. Link to source: https://www.saint-gobain-glass.co.uk/wp-content/uploads/2022/05/Solar-Thermal-1E-Thermal-Insulation-19-09-2018.pdf

Salazar, S. L., Simá, E., Vargas-López, R., Yang, R., Li, D., & Hernández-López, I. (2024). Assessing different glazing types for energy savings and CO2 reduction in a tropical climate: A comparative study. Journal of Building Engineering, 82, Article 108188. Link to source: https://doi.org/10.1016/j.jobe.2023.108188

Shah, B., Bhandari, M., & Tang, M. (2024). Importance of window installation in residential building envelopes having continuous external insulation in order to realize energy efficiency. Energies, 17(17), Article 4273. Link to source: https://doi.org/10.3390/en17174273

U.S. Energy Information Administration. (2018, May). 2015 Residential Energy Consumption Survey (RECS) survey data: Housing characteristics tables - structural and geographic characteristics - by housing unit type (HC2.1). Retrieved August 15, 2025, from Link to source: https://www.eia.gov/consumption/residential/data/2015/hc/php/hc2.1.php

U.S. Energy Information Administration. (2023). Table HC2.1 Structural and geographic characteristics of U.S. homes by housing unit type, 2020. Link to source: https://www.eia.gov/consumption/residential/data/2020/hc/pdf/HC%202.1.pdf

U.S. Environmental Protection Agency. (2024). Climate change indicators in the United States. Link to source: https://www.epa.gov/system/files/documents/2024-07/climate_indicators_2024.pdf 

U.S. Environmental Protection Agency. (2025). Power sector programs – Progress report. Link to source: https://www.epa.gov/power-sector/progress-report

Yuk, H., Choi, J. Y., Yang, S., & Kim, S. (2024). Balancing preservation and utilization: Window retrofit strategy for energy efficiency in historic modern building. Building and Environment, 259, Article 111648. Link to source: https://doi.org/10.1016/j.buildenv.2024.111648

Credits

Lead Fellow

  • Henry Igugu, Ph.D.

Contributors

  • Ruthie Burrows, Ph.D.

  • James Gerber, Ph.D.

  • Daniel Jasper

  • Alex Sweeney

Internal Reviewers

  • Sarah Gleeson, Ph.D.

  • Heather McDiarmid, Ph.D.

  • Amanda D. Smith, Ph.D.

Effectiveness

Each 1 m2 of single-glazed window glass in buildings that is upgraded to double glazing has the potential to cut GHG emissions by approximately 0.07 t CO₂‑eq/yr (20-yr and 100-yr basis).

To determine the solution’s effectiveness (Table 1), we evaluated the emissions cut from reducing space heating and space cooling. Since studies often capture different U-value ratings for similar window glass, we weighted the energy saved (kWh/yr) from improving the glass using consistent U-values for the baseline and solution (see Figure 2). Thereafter, we weighted the energy impact by the total area of glass substituted (m2) to determine the savings intensity (kWh/m2/yr) and multiplied the estimate by emission intensities of heating and cooling fuels based on the IEA’s world energy balances data (IEA, 2024).

This solution cuts CO₂, methane, and nitrous oxide emissions by reducing the amount of fossil fuels used for heating and for producing electricity used for cooling. The analysis includes studies from countries representative of heating-dominated and cooling-dominated climates such as the United States (Calautit et al., 2025) and Malaysia (Balasbaneh et al., 2022), respectively. Notably, the solution is also effective in other climates (Magraoui et al., 2025).

Table 1. Effectiveness at reducing emissions.

Unit: t CO₂‑eq /m2/yr, 100-yr basis

25th percentile 0.043
Mean 0.095
Median (50th percentile) 0.065
75th percentile 0.13
Left Text Column Width
Cost

Our estimate of the cost per unit climate impact (Table 2) indicates that replacing single-glazed windows with double-glazed windows in buildings globally results in considerable savings of approximately US$123/t CO₂‑eq.

We found that the solution’s initial cost varies considerably, from about US$31/m2 in Malaysia (Balasbaneh et al., 2022) to US$257–684/m2 in France (Harkouss et al., 2018), highlighting regional price differences that could affect adoption. Ultimately, we chose an initial cost of approximately US$144/m2 for double glazing. Using the cost of single glazing we found in studies from different regions (Aruta et al., 2025; Krarti & Ihm, 2016), our analysis determined a baseline initial cost of approximately US$35/m2. While the solution cost is more than four times the baseline, less energy is used for space heating or cooling, reducing the annual operating cost from US$23/m2 to approximately US$12/m2. After amortizing the initial cost over 30 years, the solution resulted in a net savings of US$8/m2/yr, compared with the baseline.

During our analysis, we normalized the initial cost by the baseline and solution U-value (see Figure 2) to ensure consistency. We assumed the initial cost includes the glass component alone, but some of our sources were ambiguous about the scope of the investment and may have also included frames and installation costs. To determine the cost per adoption unit, we weighted the amount of energy consumed for heating and cooling in each data source using the total area of windows upgraded in the respective case study buildings. The analysis does not include revenues because building owners typically do not generate any revenue from window glass installed. 

Table 2. Cost per unit of climate impact.

Unit: 2023 US$/t CO₂‑eq , 100-yr basis

Median -123
Left Text Column Width

Methods and Supporting Data

Learning Curve

We found no definitive data on the solution’s learning rate. While the adoption of double glazing grows, some studies have reported rising cost of glass in recent periods (MLI Building Products, 2023). In an assessment of regional float glass price trends, Procurement Resource (n.d.) argued that rising material, energy, and labor costs amid other economic pressures are driving up the cost of glass. Since modern windows are often made using float glass (Asahi India Glass Ltd., 2025), the initial cost could become more expensive.

Speed of Action

Speed of action refers to how quickly a climate solution physically affects the atmosphere after it is deployed. This is different from speed of deployment, which is the pace at which solutions are adopted.

At Project Drawdown, we define the speed of action for each climate solution as emergency brake, gradual, or delayed.

Improve Windows and Glass is a GRADUAL climate solution. It has a steady, linear impact on the atmosphere.

Caveats

Our analysis for this solution focused on the U-value of the glass component alone. It did not include other parameters such as the material type of the window frames or coatings on windows, though these also impact space heating and cooling energy use (Owolabi et al., 2023). We ensured that the data used in our analysis aligned with our approach (i.e., indicated the impact of solely substituting double-glazed or better glass for single-glazed). Due to limited data, we assumed that current adoption in LMICs is 5%. The adoption scenarios and climate impact may be influenced if the actual percentage is higher or lower.

A window’s orientation impacts the solar heat gain. Thus, the influence of upgrading to double-glazing on heating or cooling loads is affected by window placement. We found limited data that incorporates orientation and did not account for this difference.

Recently, some studies have indicated concerns about the payback period of upgrading to double glazing for building owners (Calautit et al., 2025), especially in LMICs, where higher initial costs could be a barrier. Creative initiatives such as incentive schemes can improve the payback period (Aruta et al., 2025). 

Current Adoption

To determine the current adoption of double-glazed windows, we first estimated the total amount of window glass installed in buildings by applying window-to-floor area ratios from studies to the currently existing 198.1 billion m2 residential and 54.6 billion m2 nonresidential building floor space (IEA, 2023f). This yielded approximately 23.3 billion m2 and 42.2 billion m2 of window glass installed in high-income countries (HICs) and low- and middle-income countries (LMICs), respectively (IEA, 2023c). 

We found limited data for the proportion of minimum double-glazed windows in HICs. The U.S. Energy Information Administration (U.S. EIA, 2023) reported that 80 million housing units (65%) in the U.S. have double-glazed windows installed. Percentages reported for other countries include 88% of housing units in the United Kingdom (Department for Levelling Up, Housing and Communities, 2023), 90% in Canada (Natural Resources Canada, n.d.), and 15% in Australia (Paarhammer, n.d.). Using these percentages, we estimated a 76% (median) solution adoption rate in HICs.

Since we found no definitive data for the solution’s adoption in LMICs, and considering a few LMICs have building energy codes that either mandate or encourage the use of higher performing windows (Gaum, 2023; Gaum & Laubscher, 2022), we assumed that double-glazed windows represent a conservative underestimate of 5%. 

All told, we estimate that as of 2022, installed double-glazed windows in buildings cover roughly 19.9 billion m2 globally (Table 3).

Table 3. Current (2022) adoption level.

Unit: m2 windows minimum double-glazed

25th percentile 14,300,000,000
Mean 17,100,000,000
Median (50th percentile) 19,900,000,000
75th percentile 22,700,000,000
Left Text Column Width
Adoption Trend

According to the Department for Levelling Up, Housing and Communities (2023), the percentage of UK homes that have double-glazed windows increased by 9% between 2012 and 2022. Similarly, adoption grew by about 6% in five years (2015–2020) in the United States (U.S. EIA, 2018). Using these countries as representatives, this growth translates to approximately 438–448 million m2 of double-glazed or better windows being added every year in HICs.

We found limited data for adoption trends in LMICs. Based on our assumption for the current adoption in LMICs, we assumed that the percentage adoption of double-glazed windows grew by 4% over 10 years (2012–2022). This assumption, which is likely a conservative underestimate, translates to an annual addition of about 178 million m2/yr of double glazing.

Based on these findings, we estimate that the adoption of double glazing or better windows has grown globally by nearly 622 million m2 annually (Table 4).

Historically, the bulk of the solution’s adoption has occurred in HICs. However, the Global Alliance for Buildings and Construction, IEA, and the United Nations Environment Programme (UNEP) emphasize that adopting double-glazed windows is a necessary sustainability strategy for the building sector, especially in Africa and LMICs (GlobalABC/IEA/UNEP, 2020). This indicates considerable potential for scaling the solution, with 76% of the global building sector’s growth in the past 12 years occurring in LMICs (IEA, 2023f), where there has been less adoption of double glazing or better windows.

Table 4. 2010–2022 adoption trend.

Unit: m2/yr

25th percentile 620,000,000
Mean 622,000,000
Median (50th percentile) 622,000,000
75th percentile 624,000,000
Left Text Column Width
Adoption Ceiling

We estimated an adoption ceiling (Table 5) of approximately 46.7 billion m2 of double-glazed windows globally. For this adoption scenario, 90% and 61% of window glass that existed in 2022 will be retrofitted to double-glazed or better by 2050 in buildings in HICs and buildings in LMICs, respectively.

In our analysis, we used the current double-glazed windows ratio of 90% in Canada (Natural Resources Canada, n.d) as a benchmark for the building sector’s adoption ceiling in HICs. For buildings in LMICs, we used the IEA’s recommended 2%/yr retrofit rate (IEA, 2022b) over 28 years (2022–2050). This estimated 56% growth was added to the current adoption of 5% to determine the region’s adoption ceiling. The analysis results in about 21 billion m2 and 26 billion m2 of double-glazed windows installed in buildings in HICs and LMICs, respectively.

Table 5. Adoption ceiling.

Unit: m2 windows minimum double-glazed

Estimate 46,700,000,000
Left Text Column Width
Achievable Adoption

Our analysis estimated a low achievable adoption of approximately 32.9 billion m2 of double-glazed or better windows installed in buildings globally (Table 6). For this scenario, we estimate that the percentage of windows that were at minimum double-glazed as of 2022 in buildings in HICs (76%) and buildings in LMICs (5%) grows to 81% and 33%, respectively.

Under the high achievable scenario, 86% of window glass in buildings in HICs and 47% of window glass in buildings in LMICs is at minimum double-glazed. This translates to a total of nearly 40.0 billion m2 of double glazing or better installed by 2050.

The achievable adoption scenarios are largely driven by the growth that is possible in LMICs. We assumed a retrofit rate of 1%/yr for the Achievable – Low scenario, which is the current global retrofit rate in the building industry (IEA, 2022b); for Achievable – High, we used 1.5%/yr. We also assumed that the current (2022) building stock will still be in use by 2050.

Table 6. Range of achievable adoption levels.

Unit: m2 windows minimum double-glazed

Current adoption 19,900,000,000
Achievable – low 32,900,000,000
Achievable – high 40,000,000,000
Adoption ceiling 46,700,000,000
Left Text Column Width

The current adoption of double-glazed windows in buildings reduces global GHG emissions by approximately 1.3 Gt CO₂‑eq/yr on a 100-yr and 20-yr basis (Table 7). If the low achievable adoption scenario is reached, this solution could potentially cut about 2.1 Gt CO₂‑eq/yr (100-yr and 20-yr basis). The high achievable scenario would decrease global emissions 2.6 Gt CO₂‑eq/yr year (100-yr and 20-yr basis). We estimated that the adoption ceiling could avoid up to 3.0 Gt CO₂‑eq/yr of emissions on a 100-yr basis (3.1 Gt CO₂‑eq/yr, 20-yr basis).

This solution only accounts for the impact of retrofitting the building stock that exists as of 2022. However, the current global built floor area (252.7 billion m2) is projected to grow by an additional 183 billion m2, by 2050 (IEA, 2022a; 2023b). This means a possible addition of 1.6 billion m2 of new window glass every year, indicating that the potential for scaling the climate impact exists.

Table 7. Climate impact at different levels of adoption.

Unit: Gt CO₂‑eq/yr, 100-yr basis

Current adoption 1.3
Achievable – low 2.1
Achievable – high 2.6
Adoption ceiling 3.0
Left Text Column Width
Additional Benefits

Income and Work

While multi-glazed windows are often more of an initial investment than single-pane windows, improved performance of these windows is associated with more energy and cost savings (Menzies & Wherrett, 2005). Regional climates often affect the most appropriate window type and the amount of savings (Karabay & Arici, 2012). In residential buildings, double-glazed windows can add value to homes and increase property values (Aroul & Hansz, 2011). 

Health

Reductions in air pollution due to lower heating and cooling demand decrease exposures to pollutants such as mercury and fine particulate matter generated from fossil fuel–based power plants, improving the health of nearby communities (U.S. Environmental Protection Agency [EPA], 2025). These pollutants have been linked to increased morbidity from cardiovascular and respiratory disease, asthma, infections, and cancer (Gasparotto & Martinello, 2021) and to increased risk of mortality (Henneman et al., 2023). 

Better-performing windows can benefit health through improved thermal comfort (Bulut et al., 2021). When combined with other measures to reduce cooling loads, double-glazed windows can help with the risk of indoor heat stress (Ren et al., 2014). Improved windows may also reduce condensation and mold growth in buildings (Lozinsky et al., 2025). Residents of households with double-glazed windows have reported improvements in noise insulation after retrofitting single-pane windows (Bulut et al., 2021). 

Air Quality

Higher-performing glass can reduce air pollution by lowering gas and electricity demand for heating and cooling, which can decrease pollutants such as CO₂, nitrogen oxides, methane, mercury, and fine particulate matter generated from fossil fuel–based power plants (U.S. EPA, 2025).

Risks

Faulty installation could compromise the expected benefits of double glazing. It could also lead to condensation on the inner pane if the sealant deteriorates, affecting visibility, aesthetics, and performance and resulting in a potential shorter lifespan than single glazing (Duan et al., 2021; Likins-White, 2023). Additional costs may be incurred when attempting to secure adequate expertise and equipment to ensure proper handling and installation (DIY Double Glaze, n.d.). Depending on the extent of the retrofits, this may drive up construction costs, which is a concern for building developers. However, it also represents opportunities to improve available technical expertise in regions where these services are unavailable or underdeveloped.

Interactions with Other Solutions

Reinforcing

Improve Windows and Glass reduces the amount of space heating and cooling required. This may reduce the required size and complexity of heating and cooling systems, making them more economically accessible.

Upgrading window glass can motivate building owners to improve other elements of the building envelope. This could improve the cost efficiency of the upgrades when approached holistically. 

Competing

The potential climate impact of deploying these solutions could be lower due to the reduced amount of space heating and cooling required in buildings from improving window glass.

Dashboard

Solution Basics

m2 windows minimum double-glazed

t CO₂-eq (100-yr)/unit/yr
00.040.065median
units
Current 1.99×10¹⁰ 03.29×10¹⁰4.0×10¹⁰
Achievable (Low to High)

Climate Impact

Gt CO₂-eq (100-yr)/yr
Current 1.3 2.12.6
US$ per t CO₂-eq
-123
Gradual

CO₂ , CH₄, N₂O

Trade-offs

Manufacturing double-glazed or better windows generates more industrial sector emissions than does manufacturing single-glazed windows due to the additional materials used. However, life-cycle analysis studies such as Balasbaneh et al. (2022) compared different glazing options ranging from single to triple glazing and determined that the emissions reduced by using better windows outweighs the embodied emissions. Although it is outside the scope of this solution, window frames account for as much as 46–80% of a window's embodied emissions, especially when using conventional window frame materials such as polyvinyl chloride and aluminum (Saadatian et al., 2021). Despite the higher embodied emissions, the emissions reductions from implementing the solution are substantial.

°C days
015,000

Space heating demand (18 °C basis)

Heating degree days are an indicator of total space-heating demand to maintain an indoor temperature above 18 °C. Here we show annual average heating degree days for the decade ending in 2025.

Copernicus Climate Change Service. (2023). ERA5 hourly data on single levels from 1940 to present [Data set]. Copernicus Climate Change Service (C3S) Climate Data Store (CDS). Retrieved January 13, 2026 from Link to source: https://doi.org/10.24381/cds.adbb2d47 

Hersbach, H., Bell, B., Berrisford, P., Hirahara, S., Horányi, A., Muñoz‐Sabater, J., Nicolas, J., Peubey, C., Radu, R., Schepers, D., Simmins, A., Soci, C., Abdalla, S., Abellan, X., Balsamo, G., Bechtold, P., Biavati, G., Bidlot, J., Bonavita, M., … Thépaut, J. N. (2020). The ERA5 global reanalysis. Quarterly Journal of the Royal Meteorological Society, 146(730), 1999–2049. Link to source: https://doi.org/10.1002/qj.3803

°C days
015,000

Space heating demand (18 °C basis)

Heating degree days are an indicator of total space-heating demand to maintain an indoor temperature above 18 °C. Here we show annual average heating degree days for the decade ending in 2025.

Copernicus Climate Change Service. (2023). ERA5 hourly data on single levels from 1940 to present [Data set]. Copernicus Climate Change Service (C3S) Climate Data Store (CDS). Retrieved January 13, 2026 from Link to source: https://doi.org/10.24381/cds.adbb2d47 

Hersbach, H., Bell, B., Berrisford, P., Hirahara, S., Horányi, A., Muñoz‐Sabater, J., Nicolas, J., Peubey, C., Radu, R., Schepers, D., Simmins, A., Soci, C., Abdalla, S., Abellan, X., Balsamo, G., Bechtold, P., Biavati, G., Bidlot, J., Bonavita, M., … Thépaut, J. N. (2020). The ERA5 global reanalysis. Quarterly Journal of the Royal Meteorological Society, 146(730), 1999–2049. Link to source: https://doi.org/10.1002/qj.3803

Maps Introduction

The effectiveness of replacing single-glazed windows in buildings to mitigate climate change varies depending on how buildings are heated and the emissions intensity of electricity used for cooling in each region. We used regional data for the share of heating fuel in buildings (IEA, 2023a). For the electricity used to provide cooling in buildings, we used a global estimate for emission intensity. While the need for heating has historically outweighed the need for cooling, global trends show a steady increase in cooling degree days and a decline in heating degree days, even in colder climates (Eurostat, 2024; U.S. Environmental Protection Agency (U.S. EPA), 2024). Nonetheless, studies such as Kennard et al. (2022) claim that population growth, especially in cooling-dominated climates, will drive rising cooling demand. This growth could potentially drive up the amount of electricity needed to air condition buildings (Waite et al. 2017).

Building energy efficiency codes, especially mandatory regulations, could help drive the adoption of the solution via higher U-value requirements for windows and glass, particularly in low- and middle-income countries (Gaum, 2023). Our analysis also shows that the cost of double-glazed windows varies by country and region.

Action Word
Improve
Solution Title
Windows & Glass
Classification
Highly Recommended

Lawmakers and Policymakers

  • Set clear and measurable targets for building efficiency, emissions reduction, and the deployment of improved windows.
  • Enact holistic policy plans and building codes to reduce GHG emissions from buildings through improved windows and framing systems.
  • Set public procurement standards for windows and glass, using double-glazed windows, at minimum, for public buildings.
  • Amend building codes to include minimum requirements based on window performance; gradually increase the standards over time if necessary.
  • Periodically update codes, policies, and public guidance to keep pace with research and development.
  • Make double-glazed windows the minimum standard option through a range of policy interventions, including regulations, subsidies, and educational programs where relevant; extend incentives to high performing secondary-, double- or triple-glazed windows, if relevant.
  • Offer financial incentives such as subsidies, tax credits, and grants for consumers, manufacturers, start-ups, and improved window installers.
  • Ensure financial incentives reach, and offer additional incentives for, low- and middle-income communities.
  • Ensure financial incentives cover both new installations and retrofits.
  • Create financial disincentives such as higher taxes and fines for lower performing windows.
  • Subsidize workforce or skills development and/or work with businesses to identify gaps and needs such as technical knowledge or the advantages of new technology.
  • Invest in research and development to improve window design, manufacturing, adoption, supply chain access, and circularity.
  • Create green building certification schemes and/or public-private partnerships that offer information, training, and general support for improved windows.
  • Offer educational resources, one-stop shops for windows, and demonstrations for installation and retrofits; offer tours of model builds that feature improved windows for commercial and private developers, highlighting the cost savings, and environmental benefits.

Further information:

Practitioners

  • Finance or develop only new construction and retrofits that use improved windows and other low-carbon practices.
  • Take advantage of financial incentives such as subsidies, tax credits, and grants for installing improved windows.
  • Seek or negotiate preferential loan agreements for developers using improved windows and other climate-friendly practices.
  • Use double-glazed windows as the most basic standard and offer a variety of better-performing options such as triple-glazed.
  • Work with designers and architects who integrate efficient windows and other efficient materials into their designs.
  • Integrate improved window designs into construction databases, including listing prices, thermal insulation properties, and environmental benefits.
  • Advocate for financial incentives, improved building codes, and educational programs advancing the use of improved windows.
  • Use educational resources, one-stop shops for retrofitting and weatherization, installation demonstrations, and tours of model builds.
  • Conduct research to improve the manufacturing, adoption, supply chain access, and circularity of windows.
  • Create or join green building certification schemes, green building councils, and/or public-private partnerships that offer information, training, and general support for improving windows.

Further information:

Business Leaders

  • Finance only new construction and retrofits that use improved windows and other low-carbon practices.
  • Expand product lines to include improved window designs.
  • Integrate improved window designs into construction databases, listing prices, thermal insulation properties, and environmental benefits.
  • Invest in research and development to improve window design, manufacturing, adoption, supply chain access, and circularity.
  • Advocate for financial incentives, improved building codes, and educational programs advancing the use of improved windows.
  • Join green building certification schemes and/or public-private partnerships that offer information, training, and general support for improved windows.
  • Create long-term purchasing agreements with improved window manufacturers to support stable demand and improve economies of scale.
  • Create or join green building certification schemes, green building councils, and/or public-private partnerships that offer information, training, and general support for improved windows.

Further information:

Nonprofit Leaders

  • Finance or develop only new construction and retrofits that use improved windows and other low-carbon practices.
  • Advocate for clear and measurable public targets for building efficiency, emissions reduction, and deployment of improved windows.
  • Advocate for holistic policy plans and building codes to reduce GHG emissions from buildings that include improved windows and framing systems.
  • Advocate for financial incentives, improved building codes, and educational programs advancing the use of improved windows.
  • Conduct research to improve window design, manufacturing, adoption, supply chain access, and circularity.
  • Work with businesses for workforce or skills development.
  • Offer educational resources, one-stop shops for windows, and demonstrations for installation and retrofits; offer tours of model builds that feature improved windows for commercial and private developers, highlighting the cost savings and environmental benefits.
  • Create, join, or administer green building certification schemes and/or public-private partnerships that offer information, training, and general support for improved windows.

Further information:

Investors

  • Finance only new construction and retrofits that use improved windows and other low-carbon practices.
  • Invest in research and development and start-ups to improve window design, manufacturing, adoption, supply chain access, and circularity.
  • Issue green bonds to invest in projects that use improved windows and integrate other climate-friendly construction practices.
  • Offer preferential loan agreements for developers using improved windows and other climate-friendly practices.
  • Join green building certification schemes and/or public-private partnerships that offer information, training, and general support for improved windows.

Further information:

Philanthropists and International Aid Agencies

  • Finance only new construction and retrofits that use improved windows and other low-carbon practices.
  • Offer grants for developers using improved windows and other climate-friendly practices.
  • Create financing programs for private construction in low-income or under-resourced communities requiring the use of improved windows.
  • Advocate for clear and measurable public targets for building efficiency, emissions reduction, and the deployment of improved windows.
  • Advocate for holistic policy plans and building codes to reduce GHG emissions from buildings that include improved windows and framing systems.
  • Advocate for financial incentives, improved building codes, and educational programs for improved windows.
  • Fund research to improve window design, manufacturing, adoption, supply chain access, and circularity.
  • Offer educational resources, one-stop shops for retrofitting and weatherization, installation demonstrations, and tours of model builds for commercial and private developers, highlighting the cost savings and environmental benefits.
  • Create, join, or administer green building certification schemes and/or public-private partnerships that offer information, training, and general support for improved windows.

Further information:

Thought Leaders

  • Advocate for clear and measurable public targets for building efficiency, emissions reduction, and the deployment of improved windows.
  • Advocate for holistic policy plans and building codes to reduce GHG emissions from buildings that include improved windows and framing systems.
  • Advocate for financial incentives, improved building codes, and educational programs for improved windows.
  • Conduct research to improve window design, manufacturing, adoption, supply chain access, and circularity.
  • Contract with businesses for workforce or skills development.
  • Offer or support educational resources, one-stop shops for retrofitting and weatherization, installation demonstrations, and tours of model builds for commercial and private developers, highlighting the cost savings and environmental benefits of improved windows.
  • Create, join, or administer green building certification schemes and/or public-private partnerships that offer information, training, and general support for improved windows.

Further information:

Technologists and Researchers

  • Research and develop high-performance window technologies such as vacuum glazing, aerogel applications, potential integration of solar photovoltaic glass, and the use of unconventional gases to fill multi-pane windows and improve performance.
  • Create improved alternatives to common practices for air and vapor sealing.
  • Find alternative materials for spacers with reduced thermal conductivity in double- and triple-glazed windows.
  • Research and develop alternative window frame designs to improve thermal performance, structural insulating materials, and improve ease of installation (e.g., out-of-the-box window installation kits).
  • Improve efficiency of the window manufacturing process, supply chain access, and the circular economy of glass.

Communities, Households, and Individuals

  • Finance or develop only new construction and retrofits that use improved windows and other low-carbon practices.
  • Take advantage of financial incentives such as subsidies, tax credits, and grants for installing improved windows.
  • Advocate for clear and measurable public targets for building efficiency, emissions reduction, and the deployment of improved windows.
  • Advocate for holistic policy plans and building codes to reduce GHG emissions from buildings that include improved windows and framing systems.
  • Advocate for financial incentives, improved building codes, and educational programs for improved windows.
  • Organize local “green home tours” and open houses to showcase climate-friendly builds, fostering demand by highlighting cost savings and environmental benefits of improved windows.
  • Capture community feedback and share it with local policymakers to address barriers such as permitting logistics or up-front costs, helping to shape policies that drive adoption.
  • Create, join, or administer green building certification schemes and/or public-private partnerships that offer information, training, and general support for improved windows.

Further information:

Evidence Base

Consensus of effectiveness in reducing GHG emissions: High

Improving windows and glass helps optimize the amount of heating required in buildings by reducing heat loss. Calautit et al. (2025) reported that energy used for heating in a United Kingdom residence dropped nearly 23% after reducing the glass U-value from 5.6 W/m2K to 2.8 W/m2K. Using the same building parameters, the study tested the impact of reducing the U-value by 1.35 W/m2K in the climatic conditions of Netherlands, Japan, United States, Sweden and Australia. The outcomes were similar, with about a 10–12% reduction in heating loads (Calautit et al., 2025). The results from Yuk et al. (2024), Magraoui et al. (2025), and Ahmed et al. (2025) further support these findings. 

Similarly, the solution reduces heat gained from the outdoors into buildings, thereby cutting cooling loads. Gomaa et al. (2025) reported that energy use in a Saudi Arabian residence was reduced by 1,265 kWh/yr (49%) after improving the glass U-value from 5.6 to 0.9 W/m2K (84%). Es-sakali et al. (2022) recorded 36% less electricity consumed after reducing the U-value by 1.44 W/m2K in Morocco’s climate.

The results presented in this document summarize findings from 10 original studies reflecting current evidence from 13 countries. We recognize this limited geographic scope creates bias, and hope this work inspires research and data sharing on this topic in underrepresented regions. The studies we found used simulations to assess the impact of retrofitting windows due to the inherent difficulty of real-world experiments. However, we used studies that include field measurements and calibration of the building simulations to validate their models.

Updated Date
Coming Soon Label
Coming Soon

Improve Building Envelopes

Image
Image
Improve building envelopes
Coming Soon
On

Key Takeaways

  •  Improving building envelopes cuts GHG emissions by increased thermal resistance,  which reduces unwanted heat exchange through the envelope, thus lessening the heating and cooling energy and associated emissions required to keep indoor spaces thermally comfortable.

  • Improving building envelopes reduces heating and cooling costs, helps maintain indoor thermal comfort, reduces heat stress risk and air pollution, and aids climate mitigation and adaptation in new builds and retrofits.

  • Improving building envelopes likely has a globally significant climate impact, but the adoption data required for a thorough analysis is limited.

Summary

Improve Building Envelopes cuts GHG emissions by enhancing the thermal resistance of the building shell, reducing unwanted heat exchange between the external environment and indoor spaces. These thermal improvements help decrease the amount of energy required to heat and cool buildings and the associated emissions. The solution’s effectiveness is well documented but it varies depending on the climate, the envelope's design, and emissions intensity of local electricity generation. Where available, building energy codes that specify minimum thermal requirements for envelopes and their deployment could help scale the solution. However, adoption data are limited. The solution has a climate impact that is likely globally significant along with meaningful additional benefits, but due to the data gap we categorize it as “Worthwhile.”

Description for Social and Search
The Improve Building Envelopes solution is coming soon.
Overview

What is our assessment?

We found strong evidence that improving the thermal performance of building envelopes reduces heating and cooling loads. However, effectiveness typically varies depending on the climate. While the solution’s potential climate impact is likely globally significant (>0.1 Gt CO₂‑eq/yr ), data are not available to confirm this. We consider the solution “Worthwhile” because it can reduce energy use in both retrofits and new construction, and helps provide thermally comfortable indoor spaces.

Plausible Could it work? Yes
Ready Is it ready? Yes
Evidence Are there data to evaluate it? Limited
Effective Does it consistently work? Yes
Impact Is it big enough to matter? ?
Risk Is it risky or harmful? No
Cost Is it cheap? Yes

What is it?

Improve Building Envelopes cuts GHG emissions from burning fossil fuels for direct indoor heating, district heating, or to generate electricity to power cooling systems. Thermal performance upgrades to the envelope can be achieved through various design and material interventions. Our assessment focuses on thermal insulation added to the roofs, external walls, and floors of buildings (Conley et al., 2018; McDiarmid et al., 2024). Such upgrades give the envelope a higher thermal resistance, which means that the envelope reduces heat gain better in hot periods and minimizes heat loss in cold seasons (Brunoro, 2024; Gupta & Deb, 2023).

Does it work? 

Improving the thermal resistance of building envelopes is widely used and has been strongly demonstrated to enhance indoor thermal comfort and reduce GHG emissions. Since the emission intensity of fuels (International Energy Agency (IEA), 2024), and heating and cooling demand vary, so does this solution’s potential effectiveness. Various studies provide evidence of substantial heating energy savings. For example, work in China, Australia, Denmark, and Canada demonstrated that energy use reduced 17–62% due to added insulation in external walls and roofs (Abuseif et al., 2023; Jradi et al., 2017; Khayrullaev et al., 2026; Luo et al., 2024). Evidence also substantiates that envelope improvements significantly reduce cooling loads in warmer regions (Abdeen et al., 2024; Shittu et al., 2020). Despite the benefits, thermal improvements to building envelopes tend to have diminishing returns (Luo et al., 2024). For example, adding insulation to a building that has none will have a greater influence on reducing energy use than it would if some insulation is already present in the building, and even less if the envelope has a lot of insulation.

 Why are we excited?

Improve building envelopes and other climate solutions that enhance buildings’ thermal performance (see Improve Windows and Glass) can offer both climate mitigation and adaptation benefits. First, they are applicable to existing buildings and new construction, help save heating and cooling energy costs, and improve occupant comfort. Studies show that the lower energy costs often offset the price of the improvements, with relatively low payback periods depending on the scope of intervention and insulation materials. For example, work in Türkiye, Italy, Morocco, and Saudi Arabia determined payback periods fewer than two years, reaching up to five or seven years (Akyüz, 2025; Dlimi et al., 2019; Makawi et al., 2025; Scrucca & Palladino, 2023). Second, improving the thermal performance of building envelopes increases resilience to heat waves and power outages in cold climates, especially for vulnerable populations like the elderly (Howden-Chapman et al., 2007; Ham et al., 2024, Jain 2024). Third, it could help reduce energy poverty, as well as noise infiltration and mold growth, improving the quality of lived spaces (Evin & Ucar, 2019; Janssen et al., 2023; Kattenberg et al., 2026). Finally, it reduces air pollution by lowering the demand for energy generated using fossil fuels (Levy et al., 2016).

 Analysis of building energy codes across 88 countries shows that some regions (largely in colder climates, which are often high-income countries) have stringent or mandatory thermal performance requirements for building envelopes (World Bank, n.d.). Thus, the greatest opportunities may be in countries that lack codes or minimum thermal performance requirements for building envelopes, or where such requirements are poorly implemented and enforced (Gaum, 2023; Gaum et al., 2026; World Bank, n.d.). This highlights the potential for greater future adoption and ample opportunity to scale the solution’s climate impact, where it is globally significant (>0.1 Gt CO₂ eq/yr).

Why are we concerned?

Improve Building Envelopes carries a few challenges and tradeoffs. First, it typically requires using more building material (e.g., to achieve better insulated walls or roofs). This often leads to buildings with greater embodied emissions, depending on the materials (Füchsl et al., 2022). Other climate solutions have explored alternatives which could potentially alleviate this concern (see Deploy Alternative Insulation Materials and Improve Other Building Materials). Second, insulation may be easily added to a new building during construction but can require extensive renovations in existing buildings such as opening up walls, and could include losing living space in the process (Conley et al., 2018). If not done well, adding insulation can create new problems with moisture control (Craven & Garber-Slaght, 2014). This is particularly significant in regions (especially high-income countries in cold climates) where the rate of new construction has slowed compared to that of low- and middle-income countries (IEA, 2023) and building energy codes already specify high thermal resistance requirements. In such cases, greater heating and cooling energy efficiency improvements in buildings may be derived from implementing other solutions such as Use Heat Pumps. Third, building energy codes can either be mandatory or voluntary and are not always enforced effectively (Gaum et al., 2026). This means that buildings may not always be developed with the specified envelope requirements, which could limit the solution’s adoption. Despite these challenges, the solution likely has a climate impact that is globally significant. However, our analysis could not arrive at a conclusive climate impact estimate because the data required to determine current adoption and estimate future adoption scenarios are severely limited.

References

Abdeen, A., Mushtaha, E., Hussien, A., Ghenai, C., Maksoud, A., & Belpoliti, V. (2024). Simulation-based multi-objective genetic optimization for promoting energy efficiency and thermal comfort in existing buildings of hot climate. Results in Engineering, 21, Article 101815. https://doi.org/10.1016/j.rineng.2024.101815

Abuseif, M., Jamei, E., & Chau, H.-W. (2023). Simulation-based study on the role of green roof settings on energy demand reduction in seven Australian climate zones. Energy and Buildings, 286, Article 112938.

Akyüz, M. K. (2025). Enviroeconomic optimization of insulation thickness for building exterior walls through thermoeconomic and life cycle assessment analysis. Case Studies in Thermal Engineering, 65, Article 105606. Link to source: https://doi.org/10.1016/j.csite.2024.105606

Brunoro, S. (2024). Passive envelope measures for improving energy efficiency in the energy retrofit of buildings in Italy. Buildings, 14(7), 1–17. https://doi.org/10.3390/buildings14072128

Conley, B., Cruickshank, C. A., & Baldwin, C. (2018). 2.24 insulation materials. In I. Dincer (Ed.), Comprehensive energy systems (pp. 760–795). Elsevier. Link to source: https://doi.org/10.1016/B978-0-12-809597-3.00252-2

Craven, C., & Garber-Slaght, R. (2014). Exterior insulation envelope retrofits in cold climates: Implications for moisture control. HVAC&R Research, 20(4), 384–394. Link to source: https://doi.org/10.1080/10789669.2014.887028

Dlimi, M., Iken, O., Agounoun, R., Kadiri, I., & Sbai, K. (2019). Dynamic assessment of the thermal performance of hemp wool insulated external building walls according to the Moroccan climatic zoning. Journal of Energy Storage, 26, Article 101007. Link to source: https://doi.org/10.1016/j.est.2019.101007

Evin, D., & Ucar, A. (2019). Energy impact and eco-efficiency of the envelope insulation in residential buildings in Turkey. Applied Thermal Engineering, 154, 573–584. https://doi.org/10.1016/j.applthermaleng.2019.03.102

Füchsl, S., Rheude, F., & Röder, H. (2022). Life cycle assessment (LCA) of thermal insulation materials: A critical review. Cleaner Materials, 5, Article 100119. https://doi.org/10.1016/j.clema.2022.100119

Gaum, T. (2023). Building energy codes in the global south: Comparing selected variables to develop a decision-making model to address climate-change guidelines [spreadsheet] https://docs.google.com/spreadsheets/d/1aP4zaeDvfwSI-3Abuj8Z_VUUEHJzjMZS/edit?gid=988383392#gid=988383392

Gaum, T., Laubscher, J., & Igugu, H. O. (2026). The real-world use of building energy regulations as a mechanism to accelerate climate resilience in the global south. Encyclopedia, 6(5), 1–32. https://doi.org/10.3390/encyclopedia6050107

Gupta, V., & Deb, C. (2023). Envelope design for low-energy buildings in the tropics: A review. Renewable and Sustainable Energy Reviews, 186, Article 113650. https://doi.org/10.1016/j.rser.2023.113650

Ham, H. J., Lee, S., & Kim, H.-J. (2024). The impact of residential building insulation standards on indoor thermal environments and heat-related illness risks during heatwaves: A case study in Korea. Sustainability, 16(22), 1–31. Link to source: https://doi.org/10.3390/su16229831

Howden-Chapman, P., Matheson, A., Crane, J., Viggers, H., Cunningham, M., Blakely, T., Cunningham, C., Woodward, A., Saville-Smith, K., O'Dea, D., Kennedy, M., Baker, M., Waipara, N., Chapman, R., & Davie, G. (2007). Effect of insulating existing houses on health inequality: Cluster randomised study in the community. Bmj, 334(7591), 1–9. Link to source: https://doi.org/10.1136/bmj.39070.573032.80

International Energy Agency. (2023). Global floor area and buildings energy intensity in the net zero scenario, 2010-2030. Link to source: https://www.iea.org/data-and-statistics/charts/global-floor-area-and-buildings-energy-intensity-in-the-net-zero-scenario-2010-2030

International Energy Agency. (2024). World energy balances. Link to source: https://www.iea.org/data-and-statistics/data-product/world-energy-balances

International Energy Agency. (2025). Breakthrough agenda report 2025 [report]. Link to source: https://www.iea.org/reports/breakthrough-agenda-report-2025/building

Jain, H. (2024). Critical insights into thermal comfort optimization and heat resilience in indoor spaces. City and Built Environment, 2(1), 1–26. Link to source: https://doi.org/10.1007/s44213-024-00038-z

Janssen, H., Ford, K., Gascoyne, B., Hill, R., Roberts, M., Bellis, M. A., & Azam, S. (2023). Cold indoor temperatures and their association with health and well-being: A systematic literature review. Public Health, 224, 185–194. Link to source: https://doi.org/10.1016/j.puhe.2023.09.006

Jradi, M., Veje, C., & Jørgensen, B. N. (2017). Deep energy renovation of the mærsk office building in denmark using a holistic design approach. Energy and Buildings, 151, 306–319. Link to source: https://doi.org/10.1016/j.enbuild.2017.06.047

Kattenberg, L., Eichholtz, P., & Kok, N. (2026). The efficacy of energy efficiency: Measuring the returns to home insulation. Energy Economics, 158, Article 109366. Link to source: https://doi.org/10.1016/j.eneco.2026.109366

Khayrullaev, H., Zain, A., Omle, I., & Kovács, E. (2026). Impact of climate variability on optimal thickness of wall insulation: A numerical study across five cold cities using long-term numerical simulations. Applications in Engineering Science, 25, Article 100294. Link to source: https://doi.org/10.1016/j.apples.2026.100294

Levy, J. I., Woo, M. K., Penn, S. L., Omary, M., Tambouret, Y., Kim, C. S., & Arunachalam, S. (2016). Carbon reductions and health co-benefits from US residential energy efficiency measures. Environmental Research Letters, 11(3), Article 034017. Link to source: https://doi.org/10.1088/1748-9326/11/3/034017

Luo, X., Xu, D., Bing, Y., He, Y., & Chen, Q. (2024). Thermal performance and building energy simulation of precast insulation walls in two climate zones. Buildings, 14(9), 1–22. Link to source: https://doi.org/10.3390/buildings14092612

Makawi, M. A., Ahmed, W., Kenawy, H. S., & Abd El Fattah, A. (2025). A novel validated method to determine the relationship between insulation thickness and the annual cooling cost in desert climates. Applied Sciences, 15(5), 1–26. Link to source: https://doi.org/10.3390/app15052839

McDiarmid, H., Bonner Septien, A., & Parker, P. (2024). Achieving rapid decarbonisation of Canada's residential sector requires a strategic approach. Energy and Buildings, 308, Article 113999. Link to source: https://doi.org/10.1016/j.enbuild.2024.113999

Scrucca, F., & Palladino, D. (2023). Integration of energy simulations and life cycle assessment in building refurbishment: An affordability comparison of thermal insulation materials through a new sustainability index. Sustainability, 15(2), 1–22. Link to source: https://doi.org/10.3390/su15021412

Shittu, E., Stojceska, V., Gratton, P., & Kolokotroni, M. (2020). Environmental impact of cool roof paint: Case-study of house retrofit in two hot islands. Energy and Buildings, 217, Article 110007. Link to source: https://doi.org/10.1016/j.enbuild.2020.110007

World Bank. (n.d., 13 May 2024). Building green [spreadsheet]. Retrieved May 25, 2026 from Link to source: https://www.worldbank.org/content/dam/sites/buildinggreen/doc/Building-green-dataset-final-05-13-2024.xlsx

Credits

Lead Fellow

Henry Igugu, Ph.D.

Internal Reviewers

Nina-Francesca Farac, Ph.D.

Sarah Gleeson, Ph.D.

Megan Matthews, Ph.D.

Heather McDiarmid, Ph.D.

Amanda D. Smith, Ph.D.

Christina Swanson, Ph.D.

Methods and Supporting Data

Action Word
Improve
Solution Title
Building Envelopes
Classification
Highly Recommended
Updated Date
Coming Soon Label
Coming Soon

Improve District Heating: Buildings

Image
Image
District heating facility
Coming Soon
On
Description for Social and Search
The Deploy District Heating solution is coming soon.

Methods and Supporting Data

Action Word
Improve
Solution Title
District Heating: Buildings
Classification
Highly Recommended
Updated Date
Coming Soon Label
Coming Soon
Subscribe to Cut Emissions