Sufficient, nutritious, and safe nourishment that is physically and economically accessible at all times.

Icon

Reduce Food Loss & Waste

Image
Image
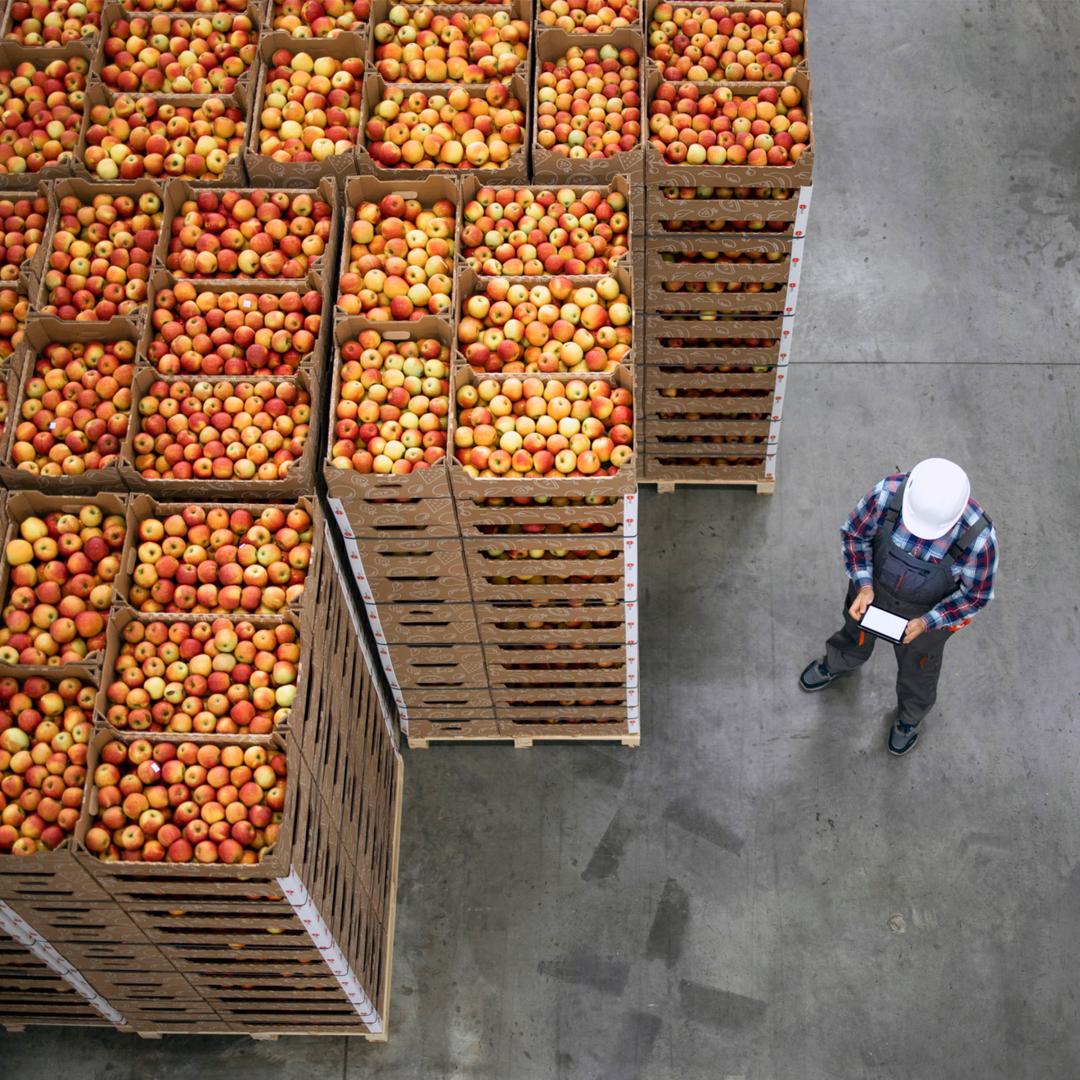
Apples in crates with worker on tablet
Coming Soon
Off

Key Takeaways

  • More than one-third of all food produced for human consumption is lost or wasted.
  • Reducing food loss and waste is one of the most impactful climate solutions.
  • Wasting food not only generates landfill methane, it also wastes all of the emissions that went into producing food, including those from agricultural production, food processing, transportation, and storage.
  • Food loss and waste contribute 4.9 Gt CO₂‑eq per year, or about 8% of global emissions.
  • On average, every metric ton of food saved reduces GHG emissions by 2.82 t CO₂‑eq.
Summary

More than one-third of all food produced for human consumption is lost or wasted before it can be eaten. This means that the GHGs emitted during the production and distribution of that particular food – including emissions from agriculture-related deforestation and soil management, methane emissions from livestock and rice production, and nitrous oxide emissions from fertilizer management – are also wasted. This solution reduces emissions by lowering the amount of food and its associated emissions that are lost or wasted across the supply chain, from production through consumption.

Description for Social and Search
Reduce Food Loss and Waste is a Highly Recommended climate solution. It avoids the GHG emissions embodied in produced but uneaten food.
Overview

The global food system, including land use, production, storage, and distribution, generates more than 25% of global GHG emissions (Poore and Nemecek, 2018). More than one-third of this food is lost or wasted before it can be eaten, with estimated associated emissions being recorded at 4.9 Gt CO₂‑eq/yr (our own calculation). FLW emissions arise from supply chain embodied emissions (i.e., the emissions generated from producing food and delivering to consumers). Reducing food loss and waste avoids the embodied emissions while simultaneously increasing food supply and reducing pressure to expand agricultural land use and intensity.

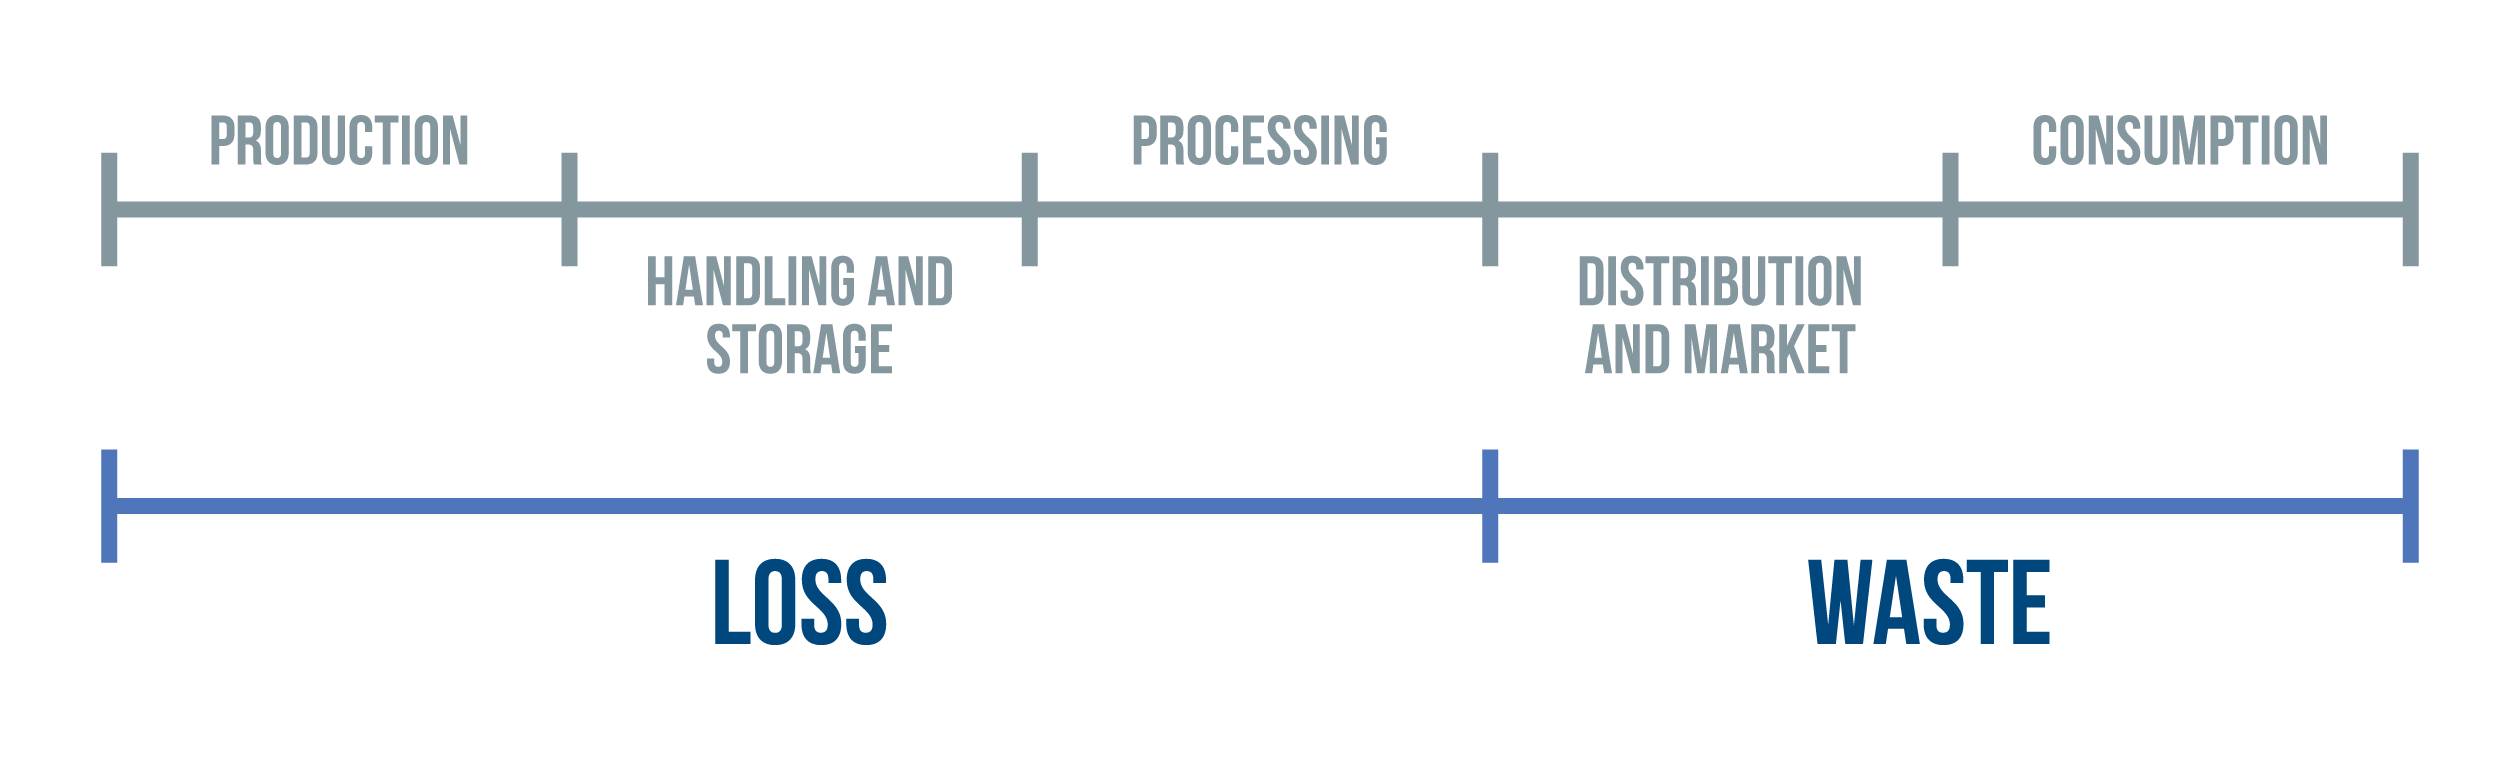
FLW occurs at each stage of the food supply chain (Figure 1). Food loss refers to the stages of production, handling, storage, and processing within the supply chain. Food waste occurs at the distribution, retail, and consumer stages of the supply chain.

Figure 1. GHG emissions occur at each stage of the food supply chain. Food loss occurs at the pre-consumer stages of the supply chain, whereas food waste occurs at the distribution, market, and consumption stages. Credit: Project Drawdown

Image
Diagram showing five stages: Production, Handling and Storage, Processing, Distribution and Market, and Consumption, with Loss occurring in the first three stages, and waste occurring in the last two stages.

Food loss can be reduced through improved post-harvest management practices, such as increasing the number and storage capacity of warehouses, optimizing processes and equipment, and improving packaging to increase shelf life. Retailers can reduce food waste by improving inventory management, forecasting demand, donating unsold food to food banks, and standardizing date labeling. Consumers can reduce food waste by educating themselves, making informed purchasing decisions, and effectively planning meals. The type of interventions to reduce FLW will depend on the type(s) of food product, the supply chain stage(s), and the location(s). 

When FLW cannot be prevented, organic waste can be managed in ways that limit its GHG emissions. Waste management is not included in this solution but is addressed in other Drawdown Explorer solutions (see Deploy Methane Digesters, Improve Landfill Management, and Increase Centralized Composting).

References

Almaraz, M., Houlton, B. Z., Clark, M., Holzer, I., Zhou, Y., Rasmussen, L., Moberg, E., Manaigo, E., Halpern, B. S., Scarborough, C., Lei, X. G., Ho, M., Allison, E., Sibanda, L., & Salter, A. (2023). Model-based scenarios for achieving net negative emissions in the food system. PLOS Climate 2(9), Article e0000181. Link to source: https://doi.org/10.1371/journal.pclm.0000181

Amicarelli, V., Lagioia, G., & Bux, C. (2021). Global warming potential of food waste through the life cycle assessment: An analytical review. Environmental Impact Assessment Review, 91, Article 106677. Link to source: https://doi.org/10.1016/j.eiar.2021.106677

Anríquez, G., Foster, W., Santos Rocha, J., Ortega, J., Smolak, J., & Jansen, S. (2023). Reducing food loss and waste in the Near East and North Africa – Producers, intermediaries and consumers as key decision-makers. Food and Agriculture Organization of the United Nations. Link to source: https://doi.org/10.4060/cc3409en

Babiker, M., Berndes, G., Blok, K., Cohen, B., Cowie, A., Geden, O., Ginzburg, V., Leip, A., Smith, P., Sugiyama, M., & Yamba, F. (2022). Cross-sectoral perspectives. In P. R. Shukla, J. Skea, R. Slade, A. Al Khourdajie, R. van Diemen, D. McCollum, M. Pathak, S. Some, P. Vyas, R. Fradera, M. Belkacemi, A. Hasija, G. Lisboa, S. Luz, & J. Malley (Eds.), Climate change 2022: Mitigation of climate change. Contribution of working group III to the sixth assessment report of the intergovernmental panel on climate change (pp. 1245–1354). Cambridge University Press. Link to source: https://doi.org/10.1017/9781009157926.014

Byrne, F., Medina, M. K., Mosqueda, E., Salinas, E., Suarez Peña, A. C., Suarez, J. D., Raimondi, G., & Molina, M. (2024). Sustainability impacts of food recovery & redistribution organizations. The Global FoodBanking Network. Link to source: https://www.foodbanking.org/wp-content/uploads/2024/08/FRAME-Methodology_Food-Recovery-to-Avoid-Methane-Emissions_GFN.pdf

Cattaneo, A., Federighi, G., & Vaz, S. (2021). The environmental impact of reducing food loss and waste: A critical assessment. Food Policy, 98, Article 101890. Link to source: https://doi.org/10.1016/j.foodpol.2020.101890

Cattaneo, A., Sánchez, M. V., Torero, M., & Vos, R. (2021). Reducing food loss and waste: Five challenges for policy and research. Food Policy, 98, Article 101974. Link to source: https://doi.org/10.1016/j.foodpol.2020.101974

Chen, C., Chaudhary, A., & Mathys, A. (2020). Nutritional and environmental losses embedded in global food waste. Resources, Conservation and Recycling, 160, Article 104912. Link to source: https://doi.org/10.1016/j.resconrec.2020.104912

Creutzig, F., Niamir, L., Bai, X., Callaghan, M., Cullen, J., Díaz-José, J, Figueroa, M., Grubler, A., Lamb, W.F., Leip, A., Masanet, E., Mata, É., Mattauch, L., Minx, J., Mirasgedis, S., Mulugetta, Y., Nugroho, S.B., Pathak, M., Perkins, P., Roy, J., de la Rue du Can, S., Saheb, Y., Some, S., Steg, L., Steinberger, J., & Ürge-Vorsatz, D. (2021). Demand-side solutions to climate change mitigation consistent with high levels of well-being. Nature Climate Change, 12(1), 36-46. Link to source: https://doi.org/10.1038/s41558-021-01219-y 

Crippa, M., Solazzo, E., Guizzardi, D., Monforti-Ferrario, F., Tubiello, F. N., & Leip, A. (2021). Food systems are responsible for a third of global anthropogenic GHG emissions. Nature Food, 2(3), 198-209. Link to source: https://doi.org/10.1038/s43016-021-00225-9

Davidenko, V., & Sweitzer, M. (2024, November 19). U.S. households that earn less spend a higher share of income on food. USDA Economic Research Service. Link to source: https://www.ers.usda.gov/data-products/charts-of-note/chart-detail?chartId=110391#:~:text=U.S.%20households%20were%20divided%20into,32.6%20percent%20of%20their%20income

de Gorter, H., Drabik, D., Just, D. R., Reynolds, C., & Sethi, G. (2021). Analyzing the economics of food loss and waste reductions in a food supply chain. Food Policy, 98, Article 101953. Link to source: https://doi.org/10.1016/j.foodpol.2020.101953

Delgado, L., Schuster, M., & Torero, M. (2021). Quantity and quality food losses across the value chain: A comparative analysis. Food Policy, 98, Article 101958. Link to source: https://doi.org/10.1016/j.foodpol.2020.101958

Eurostat (2024). Food waste and food waste prevention by NACE Rev. 2 activity [Dataset]. Link to source: https://ec.europa.eu/eurostat/databrowser/view/env_wasfw/default/table?lang=en&category=env.env_was.env_wasst 

European Commission Knowledge Center for Bioeconomy (2024). EU Bioeconomy Monitoring System [Dataset]. Link to source: https://knowledge4policy.ec.europa.eu/bioeconomy/monitoring_en 

Fabi, C., Cachia, F., Conforti, P., English, A., & Rosero Moncayo, J. (2021). Improving data on food losses and waste: From theory to practice. Food Policy, 98, Article 101934. Link to source: https://doi.org/10.1016/j.foodpol.2020.101934

Food and Agriculture Organization of the United Nations. (2014). Food wastage footprint: Full-cost accounting. Link to source: https://openknowledge.fao.org/server/api/core/bitstreams/6a266c4f-8493-471c-ab49-30f2e51eec8c/content

Food and Agriculture Organization of the United Nations. (2019). The state of food and agriculture 2019: Moving forward on food loss and waste reduction. Link to source: https://openknowledge.fao.org/server/api/core/bitstreams/11f9288f-dc78-4171-8d02-92235b8d7dc7/content

Food and Agriculture Organization of the United Nations. (2023). Tracking progress on food and agriculture-related SDG indicators 2023. Link to source: https://doi.org/10.4060/cc7088en

Food Waste Coalition of Action. (2024). Driving emissions down and profit up by reducing food waste. The Consumer Goods Forum and AlixPartners. Link to source: https://www.theconsumergoodsforum.com/wp-content/uploads/2024/06/Driving-Emissions-Down-Profit-Up-By-Reducing-Food-Waste-FWReport2024-1.pdf

Gatto, A., & Chepeliev, M. (2024). Reducing global food loss and waste could improve air quality and lower the risk of premature mortality. Environmental Research Letters, 19, Article 014080. Link to source: https://doi.org/10.1088/1748-9326/ad19ee

Goossens, Y., Wegner, A., & Schmidt, T. (2019). Sustainability assessment of food waste prevention measures: Review of existing evaluation practices. Frontiers in Sustainable Food Systems, 3(90). Link to source: https://doi.org/10.3389/fsufs.2019.00090

Guo, X., Broeze, J., Groot, J. J., Axmann, H., & Vollebregt, M. (2020). A worldwide hotspot analysis on food loss and waste, associated greenhouse gas emissions, and protein losses. Sustainability, 12(18), Article 7488. Link to source: https://doi.org/10.3390/su12187488

Hanson, C., & Mitchell, P. (2017). The Business Case for Reducing Food Loss and Waste. Link to source: https://champions123.org/sites/default/files/2020-08/business-case-for-reducing-food-loss-and-waste.pdf

Hegnsholt, E., Unnikrishnan, S., Pollmann-Larsen, M., Askelsdottir, B., & Gerard, M. (2018). Tackling the 1.6-billion-ton food loss and waste crisis. The Boston Consulting Group, Food Nation, State of Green. Link to source: https://web-assets.bcg.com/img-src/BCG-Tackling-the-1.6-Billion-Ton-Food-Waste-Crisis-Aug-2018%20%281%29_tcm9-200324.pdf

Hegwood, M., Burgess, M. G., Costigliolo, E. M., Smith, P., Bajzelj, B., Saunders, H., & Davis, S. J. (2023). Rebound effects could offset more than half of avoided food loss and waste. Nature Food, 4(7), 585-595. Link to source: https://doi.org/10.1038/s43016-023-00792-z

Jaglo, K., Kelly, S., & Stephenson, J. (2021). From farm to kitchen: The environmental impacts of U.S. food waste (Report No. EPA 600-R21 171). U.S. Environmental Protection Agency. Link to source: https://www.epa.gov/land-research/farm-kitchen-environmental-impacts-us-food-waste

Karl, K., Tubiello, F. N., Crippa, M., Poore, J., Hayek, M. N., Benoit, P., Chen, M., Corbeels, M., Flammini, A., Garland, S., Leip, A., McClelland, S., Mencos Contreras, E., Sandalow, D., Quadrelli, R., Sapkota, T., and Rosenzweig, C. (2024). Harmonizing food systems emissions accounting for more effective climate action. Environmental Research: Food Systems, 2(1), Article 015001. Link to source: https://doi.org/10.1088/2976-601X/ad8fb3

Kaza, Silpa, Lisa Yao, Perinaz Bhada-Tata, and Frank Van Woerden (2018). What a waste 2.0: A global snapshot of solid waste management to 2050. Urban Development Series. World Bank. Link to source: http://hdl.handle.net/10986/30317

Kenny, S. (2025). Estimating the Cost of Food Waste to American Consumers. (No. EPA/600/R25-048). U.S. Environmental Protection Agency Office of Research and Development. Link to source: https://www.epa.gov/system/files/documents/2025-04/costoffoodwastereport_508.pdf 

Kenny, S., Stephenson, J., Stern, A., Beecher, J., Morelli, B., Henderson, A., Chiang, E., Beck, A., Cashman, S., Wexler, E., McGaughy, K., & Martell, A. (2023). From Field to Bin: The Environmental Impact of U.S. Food Waste Management Pathways (No. EPA/600/R-23/065). U.S. Environmental Protection Agency Office of Research and Development. Link to source: https://www.epa.gov/land-research/field-bin-environmental-impacts-us-food-waste-management-pathways

Kummu, M., De Moel, H., Porkka, M., Siebert, S., Varis, O., & Ward, P. J. (2012). Lost food, wasted resources: Global food supply chain losses and their impacts on freshwater, cropland, and fertiliser use. Science of The Total Environment, 438, 447-489. Link to source: https://doi.org/10.1016/j.scitotenv.2012.08.092

Lipinski, B. (2024). SDG target 12.3 on food loss and waste: 2024 progress report. Champions 12.3. Link to source: https://champions123.org/sites/default/files/2024-09/champions-12-3-2024-progress-report.pdf

Mbow, C., Rosenzweig, C., Barioni, L. G., Benton, T. G., Herrero, M., Krishnapillai, M., Liwenga, E., Pradhan, P., Rivera-Ferre, M. G., Sapkota, T., Tubiello, F. N., & Xu, Y. (2019). Food security. In P. R. Shukla, J. Skea, E. Calvo Buendia, V. Masson-Delmotte, H.-O. Pörtner, D. C. Roberts, P. Zhai, R. Slade, S. Connors, R. van Diemen, M. Ferrat, E. Haughey, S. Luz, S. Neogi, M. Pathak, J. Petzold, J. Portugal Pereira, P. Vyas, E. Huntley, K. Kissick, M. Belkacemi, & J. Malley (Eds.), Climate change and land: An IPCC special report on climate change, desertification, land degradation, sustainable land management, food security, and greenhouse gas fluxes in terrestrial ecosystems (pp. 437–550). Cambridge University Press. Link to source: https://doi.org/10.1017/9781009157988.007

Marston, L. T., Read, Q. D., Brown, S. P., & Muth, M. K. (2021). Reducing water scarcity by reducing food loss and waste. Frontiers in Sustainable Food Systems, 5. Link to source: https://doi.org/10.3389/fsufs.2021.651476

Moraes, N. V., Lermen, F. H., & Echeveste, M. E. S. (2021). A systematic literature review on food waste/loss prevention and minimization methods. Journal of Environmental Management, 286. Link to source: https://doi.org/10.1016/j.jenvman.2021.112268

Nabuurs, G.-J., Mrabet, R., Hatab, A. A., Bustamante, M., Clark, H., Havlík, P., House, J. I., Mbow, C., Ninan, K. N., Popp, A., Roe, S., Sohngen, B., & Towprayoon, S. (2022). Agriculture, forestry and other land uses (AFOLU). In P. R. Shukla, J. Skea, R. Slade, A. Al Khourdajie, R. van Diemen, D. McCollum, M. Pathak, S. Some, P. Vyas, R. Fradera, M. Belkacemi, A. Hasija, G. Lisboa, S. Luz, & J. Malley (Eds.), Climate change 2022: Mitigation of climate change. Contribution of working group III to the sixth assessment report of the intergovernmental panel on climate change (pp. 747–860). Cambridge University Press. Link to source: https://doi.org/10.1017/9781009157926.009

Neff, R. A., Kanter, R., & Vandevijvere, S. (2015). Reducing food loss and waste while improving the public’s health. Health Affairs, 34(11), 1821-1829. Link to source: https://doi.org/10.1377/hlthaff.2015.0647

Nutrition Connect. (2023). Reducing waste from farm to plate: A multi-stakeholder recipe to reduce food loss and waste. Global Alliance for Improved Nutrition (GAIN). Link to source: https://nutritionconnect.org/news-events/reducing-food-loss-waste-farm-plate-stakeholder-recipe-compendium

Poore, J., & Nemecek, T. (2018). Reducing food’s environmental impacts through producers and consumers. Science, 360(6392), 987-992. Link to source: https://doi.org/10.1126/science.aaq0216

Porter, S. D., Reay, D. S., Higgins, P., & Bomberg, E. (2016). A half-century of production-phase greenhouse gas emissions from food loss & waste in the global food supply chain. Science of the Total Environment, 571, 721-729. Link to source: https://doi.org/10.1016/j.scitotenv.2016.07.041

Read, Q. D., Brown, S., Cuellar, A. D., Finn, S. M., Gephart, J. A., Marston, L. T., Meyer, E., Weitz, K.A., & Muth, M. K. (2020). Assessing the environmental impacts of halving food loss and waste along the food supply chain. Science of the Total Environment, 712, Article 136255. Link to source: https://doi.org/10.1016/j.scitotenv.2019.136255

Read, Q. D., & Muth, M. K. (2021). Cost-effectiveness of four food waste interventions: Is food waste reduction a “win–win?”. Resources, Conservation and Recycling, 168. Link to source: https://doi.org/10.1016/j.resconrec.2021.105448 

ReFED. (2024). The methane impact of food loss and waste in the United States. Link to source: https://refed.org/uploads/refed-methane-report-final.pdf

Reynolds, C., Goucher, L., Quested, T., Bromley, S., Gillick, S., Wells, V. K., Evans, D., Koh, L., Carlsson Kanyama, A., Katzeff, C., Svenfelt, A., & Jackson, P. (2019). Review: Consumption-stage food waste reduction interventions – What works and how to design better interventions. Food Policy, 83, 7-27. Link to source: https://doi.org/10.1016/j.foodpol.2019.01.009

Rolker, H., Eisler, M., Cardenas, L., Deeney, M., & Takahashi, T. (2022). Food waste interventions in low-and-middle-income countries: A systematic literature review. Resources, Conservation and Recycling, 186. Link to source: https://doi.org/10.1016/j.resconrec.2022.106534 

Searchinger, T., Waite, R., Hanson, C., & Ranganathan, J. (2019). Creating a sustainable food future. World Resources Institute. Link to source: https://research.wri.org/sites/default/files/2019-07/WRR_Food_Full_Report_0.pdf

Sheahan, M., & Barrett, C. B. (2017). Review: Food loss and waste in Sub-Saharan Africa. Food Policy, 70, 1-12. Link to source: https://doi.rog/10.1016/j.foodpol.2017.03.012

Swannell, R., Falconer Hall, M., Tay, R., & Quested, T. (2019). The food waste atlas: An important tool to track food loss and waste and support the creation of a sustainable global food system. Resources, Conservation and Recycling, 146, 534-545. Link to source: https://doi.org/10.1016/j.resconrec.2019.02.006

Thi, N. B. D., Kumar, G., & Lin, C.-Y. (2015). An overview of food waste management in developing countries: Current status and future perspective. Journal of Environmental Management, 157, 220-229. Link to source: https://doi.org/10.1016/j.jenvman.2015.04.022

Tubiello, F. N., Karl, K., Flammini, A., Gütschow, J., Obli-Laryea, G., Conchedda, G., Pan, X., Qi, S. Y., Halldórudóttir Heiðarsdóttir, H., Wanner, N., Quadrelli, R., Rocha Souza, L., Benoit, P., Hayek, M., Sandalow, D., Mencos Contreras, E., Rosenzweig, C., Rosero Moncayo, J., Conforti, P., & Torero, M. (2022). Pre- and post-production processes increasingly dominate greenhouse gas emissions from agri-food systems. Earth System Science Data, 14(4), 1795-1809. Link to source: https://doi.org/10.5194/essd-14-1795-2022

United Nations Environment Programme. (2024). Food waste index report 2024. Think eat save: Tracking progress to halve global food waste. Link to source: https://wedocs.unep.org/xmlui/handle/20.500.11822/45230

U.S. Food and Drug Administration. (2019). Food facts: How to cut food waste and maintain food safety. Link to source: https://www.fda.gov/food/consumers/how-cut-food-waste-and-maintain-food-safety

Wilson, N. L. W., Rickard, B. J., Saputo, R., & Ho, S.-T. (2017). Food waste: The role of date labels, package size, and product category. Food Quality and Preference, 55, 35-44. Link to source: https://doi.org/10.1016/j.foodqual.2016.08.004 

World Bank. (2020). Addressing food loss and waste: A global problem with local solutions. Link to source: https://openknowledge.worldbank.org/entities/publication/1564bf5c-ed24-5224-b5d8-93cd62aa3611

WRAP (2023). UK Food System Greenhouse Gas Emissions: Progress towards the Courtauld 2030 target. Link to source: https://www.wrap.ngo/sites/default/files/2024-05/WRAP-MIANZW-Annual-Progress-Summary-report-22-23-Variation-1-2024-04-30.pdf

WRAP (2024). UK food system greenhouse gas emissions: Progress towards the Courtauld 2030 target. Link to source: https://www.wrap.ngo/sites/default/files/2024-12/WRAP-Courtauld-2030-GHG-2324.pdf

WWF-UK. (2021). Driven to waste: The global impact of food loss and waste on farms. :Link to source: https://files.worldwildlife.org/wwfcmsprod/files/Publication/file/5p58sxloyr_technical_report_wwf_farm_stage_food_loss_and_waste.pdf

WWF-WRAP. (2020). Halving food loss and waste in the EU by 2030: The major steps needed to accelerate progress. Link to source: https://www.wrap.ngo/resources/report/halving-food-loss-and-waste-eu-2030-major-steps-needed-accelerate-progress

Xue, L., Liu, G., Parfitt, J., Liu, X., Herpen, E. V., O’Connor, C., Östergren, K., & Cheng, S. 2017. Missing food, missing data? A critical review of global food losses and food waste data. Env Sci Technol. 51, 6618-6633. Link to source: https://doi.org/10.1021/acs.est.7b00401 

Ziervogel, G., & Ericksen, P. J. (2010). Adapting to climate change to sustain food security. WIREs Climate Change, 1(4), 525-540. Link to source: https://doi.org/10.1002/wcc.56

Zhu, J., Luo, Z., Sun, T., Li, W., Zhou, W., Wang, X., Fei, X., Tong, H., & Yin, K. (2023). Cradle-to-grave emissions from food loss and waste represent half of total greenhouse gas emissions from food systems. Nature Food, 4(3), 247-256. Link to source: https://doi.org/10.1038/s43016-023-00710-3

Credits

Lead Fellows

  • Erika Luna

  • Aishwarya Venkat, Ph.D.

Contributors

  • Ruthie Burrows, Ph.D.

  • Emily Cassidy, Ph.D.

  • James Gerber, Ph.D.

  • Yusuf Jameel, Ph.D.

  • Daniel Jasper

  • Alex Sweeney

  • Eric Toensmeier

  • Paul C. West, Ph.D.

Internal Reviewers

  • Aiyana Bodi

  • Hannah Henkin

  • Megan Matthews, Ph.D.

  • Heather McDiarmid, Ph.D.

  • Ted Otte

  • Christina Swanson, Ph.D.

  • Paul C. West, Ph.D.

Effectiveness

Our analysis estimates that reducing FLW reduces emissions 2.82 t CO₂‑eq (100-yr basis) for every metric ton of food saved (Table 1). This estimate is based on selected country and global assessments from nongovernmental organizations (NGOs), public agencies, and development banks (ReFED, 2024; World Bank, 2020; WRAP, 2024). All studies included in this estimate reported a reduction in both volumes of FLW and GHG emissions. However, it is important to recognize that the range of embodied emissions varies widely across foods (Poore & Nemecek, 2018). For example, reducing meat waste can be more effective than reducing fruit waste because the embodied emissions are much higher.

Effectiveness is only reported on a 100-yr time frame here because our data sources did not include enough information to separate out the contribution of different GHGs and calculate the effectiveness on a 20-yr time frame.

Table 1. Effectiveness at reducing emissions.

Unit: t CO₂‑eq /t reduced FLW, 100-yr basis

25th percentile 2.75
Mean 3.11
Median (50th percentile) 2.82
75th percentile 3.30
Left Text Column Width
Cost

The net cost of baseline FLW is US$932.56/t waste, based on values from the Food and Agriculture Organization of the United Nations (FAO, 2014) and Hegensholt et al. (2018). The median net cost of implementing strategies and practices that reduce FLW is US$385.5/t waste reduced, based on values from ReFED (2024) and Hanson and Mitchell (2017). These costs include, but are not limited to, improvements to inventory tracking, storage, and diversion to food banks. Therefore, the net cost of the solution compared to baseline is a total savings of US$547.0/t waste reduced. 

Therefore, reducing emissions for FLW is cost-effective, saving US$194.0/t avoided CO₂‑eq on a 100-yr basis (Table 2).

Table 2. Net cost per unit climate impact.

Unit: US$/t CO₂‑eq , 2023

Median (100-yr basis) -194.0
Left Text Column Width

Methods and Supporting Data

Learning Curve

Learning curve data were not yet available for this solution.

Speed of Action

Speed of action refers to how quickly a climate solution physically affects the atmosphere after it is deployed. This is different from speed of deployment, which is the pace at which solutions are adopted.

At Project Drawdown, we define the speed of action for each climate solution as emergency brake, gradual, or delayed.

Reduce Food Loss and Waste is an EMERGENCY BRAKE climate solution. It has the potential to deliver a more rapid impact than nominal and delayed solutions. Because emergency brake solutions can deliver their climate benefits quickly, they can help accelerate our efforts to address dangerous levels of climate change. For this reason, they are a high priority.

Caveats

Reducing FLW through consumer behavior, supply chain efficiencies, or other means can lead to lower food prices, creating a rebound effect that leads to increased consumption and GHG emissions (Hegwood et al., 2023). This rebound effect could offset around 53–71% of the mitigation benefits (Hegwood et al., 2023). Population and economic growth also increase FLW. The question remains however, who should bear the cost of implementing FLW solutions. A combination of value chain investments by governments and waste taxes for consumers may be required for optimal FLW reduction (Gatto, 2023; Hegwood, 2023; The World Bank, 2020). 

Strategies for managing post-consumer waste through composting and landfills are captured in other Project Drawdown solutions (see Improve Landfill Management, Increase Centralized Composting, and Deploy Methane Digesters).

Current Adoption

Due to a lack of data we were not able to quantify current adoption for this solution.

Adoption Trend

Data on adoption trends were not available.

Adoption Ceiling

We assumed an adoption ceiling of 1.75 Gt of FLW reduction in 2023, which reflects a 100% reduction in FLW (Table 3). While reducing FLW by 100% is unrealistic because some losses and waste are inevitable (e.g., trimmings, fruit pits and peels) and some surplus food is needed to ensure a stable food supply (HLPE, 2014), we kept that simple assumption because there wasn’t sufficient information on the amount of inevitable waste, and it is consistent with other research used in this assessment.

Table 3. Adoption ceiling.

Unit: t reduced FLW/yr

Median 1,750,000,000
Left Text Column Width
Achievable Adoption

Studies consider that halving the reduction in FLW by 2050 is extremely ambitious and would require “breakthrough technologies,” whereas a 25% reduction is classified as highly ambitious, and a 10% reduction is more realistic based on coordinated efforts (Searchinger, 2019; Springmann et al., 2018). With our estimate of 1.75 Gt of FLW per year, a 25% reduction equals 0.48 Gt, while a 50% reduction would represent 0.95 Gt of reduced FLW.

It is important to acknowledge that, 10 years after the 50% reduction target was set in the Sustainable Development Goals (SDGs, Goal 12.3), the world has not made sufficient progress. The challenge has therefore become larger as the amounts of FLW keep increasing at a rate of 2.2%/yr (Gatto & Chepeliev, 2023; Hegnsholt, et al. 2018; Porter et al., 2016).

As a result of these outcomes, we have selected a 25% reduction in FLW as our Achievable – Low and 50% as our Achievable – High. Reductions in FLW are 437.5, 875.0, and 1,750 Mt FLW/year for Achievable – Low, Achievable – High, and Adoption Ceiling, respectively (Table 4).

Table 4. Adoption levels.

Unit: t reduced FLW/yr

Current adoption (baseline) Not determined
Achievable – low (25% of total FLW) 437,500,000
Achievable – high (50% of total FLW) 875,000,000
Adoption ceiling (100% of total FLW) 1,750,000,000
Left Text Column Width

An Achievable – Low (25% FLW reduction) could represent 1.23 Gt CO₂‑eq/yr (100-yr basis) of reduced emissions, whereas an Achievable – High (50% FLW reduction) could represent up to 2.47 Gt CO₂‑eq/yr. The adoption potential (100% FLW reduction) would result in 4.94 Gt CO₂‑eq/yr (Table 5). We only report emissions outcomes on a 100-yr basis here because most data sources did not separate the percentage of type of food wasted or disaggregate their associated emissions factors by GHG type. Estimated impacts would be higher on a 20-yr basis due to the higher GWP of methane associated with meat and rice production. 

Table 5. Climate impact at different levels of adoption.

Unit: Gt CO₂‑eq/yr, 100-yr basis

Current adoption (1.5% of total FLW) Not determined
Achievable – low (25% of total FLW) 1.23
Achievable – high (50% of total FLW) 2.47
Adoption ceiling (100% of total FLW) 4.94
Left Text Column Width

We also compiled studies that have modeled the climate impacts of different FLW reduction scenarios, from 10% to 75%. For an achievable 25% reduction, Scheringer (2019) estimated a climate impact of 1.6 Gt CO₂‑eq/yr. Studies that modeled the climate impact of a 50% reduction by 2050 estimated between 0.5 Gt CO₂‑eq/yr (excluding emissions from agricultural production and land use change; Roe at al., 2021) to 3.1–4.5 Gt CO₂‑eq/yr (including emissions from agricultural production and land use change; Roe at al., 2021; Searchinger et al., 2019).

Multiple studies stated that climate impacts from FLW reduction would be greater when combined with the implementation of dietary changes (see the Improve Diets solution; Almaraz et al., 2023; Babiker et al.; 2022; Roe et al., 2021; Springmann et al., 2018; Zhu et al., 2023).

Additional Benefits

Extreme Weather Events

Households and communities can strengthen adaptation to climate change by improving food storage, which helps reduce food loss (Ziervogel & Ericksen, 2010). Better food storage infrastructure improves food security from extreme weather events such as drought or floods which make it more difficult to grow food and can disrupt food distribution (Mbow et al., 2019). 

Income and Work

FLW accounts for a loss of about US$1 trillion annually (World Bank, 2020). In the United States, a four-person household spends about US$2,913 on food that is wasted (Kenny, 2025). These household-level savings are particularly important for low-income families because they commonly spend a higher proportion of their income on food (Davidenko & Sweitzer, 2024). Reducing FLW can improve economic efficiency (Jaglo et al., 2021). In fact, a report by Champions 12.3 found efforts to reduce food waste produced positive returns on investments in cities, businesses, and households in the United Kingdom (Hanson & Mitchell, 2017). FLW in low- and middle-income countries mostly occurs during the pre-consumer stages, such as storage, processing, and transport (Kaza et al., 2018). Preventive measures to reduce these losses have been linked to improved incomes and profits (Rolker et al., 2022). 

Food Security

Reducing FLW increases the amount of available food, thereby improving food security without requiring increased production (Neff et al., 2015). The World Resources Institute estimated that halving the rate of FLW could reduce the projected global need for food approximately 20% by 2050 (Searchinger et al., 2019). In the United States, about 30–40% of food is wasted (U.S. Food and Drug Administration [U.S. FDA], 2019) with this uneaten food accounting for enough calories to feed more than 150 million people annually (Jaglo et al., 2021). These studies demonstrate that reducing FLW can simultaneously decrease the demand for food production while improving food security.

Health

Policies that reduce food waste at the consumer level, such as those that improve food packaging and require clearer information on shelf life and date labels, can reduce the number of foodborne illnesses (Neff et al., 2015; U.S. FDA, 2019). Additionally, efforts to improve food storage and food handling can further reduce illnesses and improve working conditions for food-supply-chain workers (Neff et al., 2015). Reducing FLW can lower air pollution from food production, processing, and transportation and from disposal of wasted food (Nutrition Connect, 2023). Gatto and Chepeliev (2024) found that reducing FLW can improve air quality (primarily through reductions in carbon monoxide, ammonia, nitrogen oxides, and particulate matter), which lowers premature mortality from respiratory infections. These benefits were primarily observed in China, India, and Indonesia, where high FLW-embedded air pollution is prevalent across all stages of the food supply chain (Gatto & Chepeliev, 2024).

Land Resources

For a description of the land resources benefits, please refer to the “water resources” subsection below. 

Water Resources

Reducing FLW can conserve resources and improve biodiversity (Cattaneo, Federighi, & Vaz, 2021). A reduction in FLW reflects improvements in resource efficiency of freshwater, synthetic fertilizers, and cropland used for agriculture (Kummu et al., 2012). Reducing the strain on freshwater resources is particularly relevant in water-scarce areas such as North Africa and West-Central Asia (Kummu et al., 2012). In the United States, halving the amount of FLW could reduce approximately 290,000 metric tons of nitrogen from fertilizers, thereby reducing runoff, improving water quality, and decreasing algal blooms (Jaglo et al., 2021).

Risks

Interventions to address FLW risk ignoring economic factors such as price transmission mechanisms and cascading effects, both upstream and downstream in the supply chain. The results of a FLW reduction policy or program depend greatly on the commodity, initial FLW rates, and market integration (Cattaneo, 2021; de Gorter, 2021).

On the consumer side, there is a risk of a rebound effect: Avoiding FLW can lower food prices, leading to increased consumption and net increase in GHG emissions (Hegwood et al., 2023). Available evidence is highly contextual and often difficult to scale, so relevant dynamics must be studied with care (Goossens, 2019).

The production site is a critical loss point, and farm incomes, scale of operations, and expected returns to investment affect loss reduction interventions (Anriquez, 2021; Fabi, 2021; Sheahan and Barrett, 2017).

Interactions with Other Solutions

Reducing FLW can lower new demand for high-emissions foods, like ruminant meat.

Reducing FLW can lower demand for new production of livestock and crops, reducing the use of fertilizers or manure and therefore associated emissions.

Reducing FLW can reduce the demand to expand agriculture, support land conservation and restoration, and benefit water quality.

Reducing food loss and waste can reduce the demand for wild-harvested macroalgae.

(mixed) Reducing FLW can increase demand for cold storage, more efficient appliances, and optimized transport, which could reinforce the adoption of solutions targeting these improvements. However, reducing FLW could compete with other solutions if loss reductions are achieved mainly from producing less food, which could lead to lower refrigeration demand.

Competing

Food waste is used as raw material for methane digestors and composting. Reducing FLW may reduce the impact of those solutions as a result of decreased feedstock availability.

Dashboard

Solution Basics

t reduced FLW

t CO₂-eq (100-yr)/unit
02.752.82median
units/yr
Current Not Determined 04.375×10⁸8.75×10⁸
Achievable (Low to High)

Climate Impact

Gt CO₂-eq (100-yr)/yr
Current Not Determined 1.232.47
US$ per t CO₂-eq
-194
Emergency Brake

CO₂ , CH₄ , N₂O

Trade-offs

Some FLW reduction strategies have trade-offs for emission reductions (Cattaneo, 2021; de Gorter et al., 2021). For example, improved cold storage and packaging are important interventions for reducing food loss, yet they require additional electricity and refrigerants, which can increase GHG emissions (Babiker et al., 2022; FAO, 2019).

%
10–15
15–20
20–25
25–30
≥ 30

Food loss from farming to manufacturing stages

Approximately ¼–⅓ of all food that is produced is lost or wasted. This map shows the percentage of loss before the market stage of the supply chain. This food loss is from agricultural production, storage, and handling through manufacture.

Food and Agriculture Organization of the United Nations. (2026). FAOSTAT: Food balances (2010-) [Data set]. Retrieved September 22, 2026, from Link to source: https://www.fao.org/faostat/en/#data/FBS 

Gatto, A., & Chepeliev, M. (2024). Global food loss and waste estimates show increasing nutritional and environmental pressures. Nature Food, 5(2), 136–147. Link to source: https://doi.org/10.1038/s43016-023-00915-6

%
10–15
15–20
20–25
25–30
≥ 30

Food loss from farming to manufacturing stages

Approximately ¼–⅓ of all food that is produced is lost or wasted. This map shows the percentage of loss before the market stage of the supply chain. This food loss is from agricultural production, storage, and handling through manufacture.

Food and Agriculture Organization of the United Nations. (2026). FAOSTAT: Food balances (2010-) [Data set]. Retrieved September 22, 2026, from Link to source: https://www.fao.org/faostat/en/#data/FBS 

Gatto, A., & Chepeliev, M. (2024). Global food loss and waste estimates show increasing nutritional and environmental pressures. Nature Food, 5(2), 136–147. Link to source: https://doi.org/10.1038/s43016-023-00915-6

Maps Introduction

Approximately one-quarter to one-third of all food is lost or wasted in the stages from farming to transport and manufacturing to consumption. These maps show the food loss and waste in different stages of the food system, including in production, distribution, and consumption. 

Food loss occurs before food reaches the market, whereas food waste occurs during food distribution and in homes and restaurants. 

Food loss can occur during production, storage, and handling through manufacture. It is common (in terms of percent of total production) in North African, Middle Eastern and some Asian countries (see Context – Loss map).  The type of interventions needed to reduce FLW depend on the type of food, where it is produced, and the supply chain stage in which it is lost. 

Food waste occurs in the distribution and consumption stages, in homes, supermarkets and restaurants. It is more common in higher income countries, such as the United States, Australia, and Japan (see Context – Waste map). 

Food loss and waste emissions differ by region. In 2020, the countries with the highest FLW emissions were China, the United States, India, and Brazil. Production of meat and dairy generates more emissions than production of grains, fruits, and vegetables, and places with diets high in animal products – especially beef – have outsized FLW emissions. Targeted efforts to reduce food loss and waste for animal products could disproportionately reduce emissions.

Several countries have made progress in reducing food loss and waste. The UK Food and Drink Pact, signed by 200 organizations, developed guidelines for measuring food waste and avenues for redistributing millions of meals. According to a 2020 report from Waste and Resources Action Programme (WRAP), the pact led to a 15% reduction in food waste from 2007–2018. A similar pact in Australia reported a 13% reduction in food waste by its 37 signatories from 2022–2025, resulting in 16,000 metric tons of prevented waste.

Action Word
Reduce
Solution Title
Food Loss & Waste
Classification
Highly Recommended

Lawmakers and Policymakers

  • Ensure public procurement uses strategies to reduce FLW at all stages of the supply chain; consider using the Food Loss and Waste Protocol.
  • Use financial incentives and regulations to promote efficient growing practices, harvesting methods, and storage technologies.
  • Utilize financial instruments such as taxes, subsidies, or exemptions to support infrastructure, technology, and enforcement.
  • Implement bans on food waste in landfills.
  • Standardize food date labels.
  • Mandate FLW reporting and reduction targets for major food businesses.
  • Prioritize policies that divert FLW toward human consumption first, then prioritize animal feed or compost.
  • Fund research to improve monitoring technologies, food storage, and resilient crop varieties.
  • Invest or expand extension services to work with major food businesses to reduce FLW.
  • Invest in and improve supportive infrastructure including electricity, public storage facilities, and roads to facilitate compost supply chains.
  • Create, support, or join education campaigns and/or public-private partnerships that facilitate stakeholder discussions.

Practitioners

  • Ensure operations reduce FLW at all stages of the supply chain; consider using the Food Loss and Waste Protocol.
  • Set ambitious targets to reduce FLW, reevaluate them regularly, and use thorough measurements that capture FLW, associated GHG emissions, and financial data.
  • Take advantage of extension services and financial incentives such as tax rebates and subsidies that promote FLW reduction strategies.
  • Work with policymakers, peers, and industry leaders to standardize date labeling.
  • Promote cosmetically imperfect food through marketing, discounts, or offtake agreements.
  • Utilize behavior change mechanisms such as signage saying “eat what you take,” offer smaller portion sizes, use smaller plates for servings, and visibly post information on the impact of FLW and best practices for prevention.
  • Engage with frontline workers to identify and remedy FLW.
  • Institute warehouse receipt systems and tracking techniques.
  • Use tested storage devices and facilities such as hermetic bags and metal silos.
  • Utilize Integrated pest management (IPM) during both pre- and post-harvest stages.
  • Create, support, or join education campaigns and/or public-private partnerships that facilitate stakeholder discussions.

Business Leaders

  • Ensure procurement uses strategies to reduce FLW at all stages of the supply chain; consider using the Food Loss and Waste Protocol.
  • Set ambitious targets to reduce FLW, reevaluate them regularly, and use thorough measurements that capture FLW, associated GHG emissions, and financial data.
  • Utilize or work with companies that utilize efficient growing practices, harvesting methods, and storage technologies that reduce FLW.
  • Enter into offtake agreements for diverted food initiatives.
  • Promote cosmetically imperfect food through marketing, discounts, or offtake agreements.
  • Work with policymakers and industry peers to standardize date labeling and advocate for bans on food waste in landfills.
  • Appoint a senior executive responsible for FLW goals and ensure they have the resources and authority for effective implementation.
  • Utilize behavior change mechanisms such as signage saying, “eat what you take,” offer smaller portion sizes, use smaller plates for servings, and visibly post information on the impact of FLW and best practices for prevention.
  • Engage with frontline workers to identify and remedy FLW.
  • Institute warehouse receipt systems and tracking techniques.
  • Fund research or startups that aim to improve monitoring technologies, food storage, packaging materials, stocking practices, and resilient crop varieties.
  • Create, support, or join education campaigns and/or public-private partnerships that facilitate stakeholder discussions.

Nonprofit Leaders

  • Ensure procurement uses strategies to reduce FLW at all stages of the supply chain; consider using the Food Loss and Waste Protocol.
  • Advocate for bans on food waste in landfills.
  • Work with policymakers and industry leaders to standardize date labeling.
  • Help food and agricultural companies use efficient growing practices, harvesting methods, and storage technologies that reduce FLW.
  • Advocate for financial instruments such as taxes, subsidies, or exemptions to support infrastructure, technology, and enforcement.
  • Use cosmetically imperfect and diverted food for food banks.
  • Help companies track and report FLW and monitor goals, and offer input for improvement.
  • Help transfer capacity, knowledge, and infrastructure to support FLW management in low- and middle-income communities.
  • Create, support, or join education campaigns and/or public-private partnerships that facilitate stakeholder discussions.

Investors

  • Ensure portfolio companies and company procurement use strategies to reduce FLW at all stages of the supply chain; consider using the Food Loss and Waste Protocol.
  • Require portfolio companies to measure and report on FLW GHG emissions.
  • Fund startups which aim to improve monitoring technologies, food storage, packaging materials, stocking practices, and resilient crop varieties.
  • Offer financial services, notably rural financial market development, including low-interest loans, micro-financing, and grants to support FLW prevention initiatives.
  • Create, support, or join education campaigns and/or public-private partnerships, such as the Food Waste Funder Circle, that facilitate stakeholder discussions.

Philanthropists and International Aid Agencies

  • Ensure procurement uses strategies to reduce FLW at all stages of the supply chain; consider using the Food Loss and Waste Protocol.
  • Advocate for bans on food waste in landfills.
  • Work with policymakers and industry leaders to standardize date labeling.
  • Help food and agricultural companies use efficient growing practices, harvesting methods, and storage technologies that reduce FLW.
  • Advocate for financial instruments such as taxes, subsidies, or exemptions to support infrastructure, technology, and enforcement.
  • Use cosmetically imperfect and diverted food for food banks.
  • Help companies tracking and report FLW and monitor goals, and offer input for improvement.
  • Help transfer capacity, knowledge, and infrastructure to support FLW management in low- and middle-income communities.
  • Fund startups that aim to improve monitoring technologies, food storage, packaging materials, stocking practices, and resilient crop varieties.
  • Offer financial services, especially for rural financial market development, including low-interest loans, micro-financing, and grants to support FLW initiatives.
  • Create, support, or join education campaigns and/or public-private partnerships, such as the Food Waste Funder Circle, that facilitate stakeholder discussions.

Thought Leaders

  • Adopt behaviors to reduce FLW, including portion control, “eating what you take,” and reducing meat consumption.
  • Advocate for bans on food waste in landfills.
  • Help food and agricultural companies use efficient growing practices, harvesting methods, and storage technologies that reduce FLW.
  • Work with policymakers and industry leaders to standardize date labeling.
  • Advocate for financial instruments such as taxes, subsidies, or exemptions to support infrastructure, technology, and enforcement.
  • Help companies or independent track and report FLW data and emissions.
  • Help transfer capacity, knowledge, and infrastructure to support FLW management in low- and middle-income communities.
  • Create, support, or join education campaigns and/or public-private partnerships that facilitate stakeholder discussions.

Technologists and Researchers

  • Research and develop more efficient growing and harvesting practices.
  • Develop new crop varieties to increase land productivity, shelf life, durability during transportation, and resistance to contamination.
  • Improve the efficiency of cold chains for transportation and storage.
  • Design software that can optimize the harvesting, storage, transportation, stocking, and shelf life of produce.
  • Improve data collection on FLW, associated GHG emissions, and financial data across the supply chain.
  • Develop new non-plastic, biodegradable, low-carbon packaging materials.
  • Improve storage devices and facilities such as hermetic bags and metal silos.
  • Research technologies, practices, or nonharmful substances to prolong the lifespan of food.

Communities, Households, and Individuals

  • Adopt behaviors to reduce FLW, including portion control, “eating what you take,” and reducing meat consumption.
  • Donate food that won’t be used or, if that’s not possible, use the food for animals or compost.
  • Advocate for bans on food waste in landfills.
  • Advocate for financial instruments such as taxes, subsidies, or exemptions to support infrastructure, technology, and enforcement.
  • Demand transparency around FLW from public and private organizations.
  • Educate yourself and those around you about the impacts and solutions.
  • Create, support, or join education campaigns and/or public-private partnerships that facilitate stakeholder discussions.
Evidence Base

A large volume of scientific research exists regarding reducing emissions of FLW effectively. The IPCC Sixth Assessment Report (AR6) estimates the mitigation potential of FLW reduction (through multiple reduction strategies) to be 2.1 Gt CO₂‑eq/yr (with a range of 0.1–5.8 Gt CO₂‑eq/yr ) (Nabuurs et al., 2022). This accounts for savings along the whole value chain.

Following the 2011 FAO report – which estimated that around one-third (1.3 Gt) of food is lost and wasted worldwide per year – global coordination has prioritized the measurement of the FLW problem. This statistic has served as a baseline for multiple FLW reduction strategies. However, more recent studies suggest that the percentage of FLW may be closer to 40% (WWF, 2021). The median of the studies included in our analysis is 1.75 Gt/yr of FLW (FAO, 2024; Gatto & Chepeliev, 2024; Guo et al., 2020; Porter et al., 2016; UNEP, 2024; WWF, 2021; Zhu et al., 2023), with an annual increasing trend of 2.2%.

Only one study included in our analysis calculated food embodied emissions from all stages of the supply chain, while the rest focused on the primary production stages. Zhu et al. (2023) estimated 6.5 Gt CO₂‑eq/yr arising from the supply chain side, representing 35% of total food system emissions.

When referring to food types, meat and animal products were estimated to emit 3.5 Gt CO₂‑eq/yr compared to 0.12 Gt CO₂‑eq/yr from fruits and vegetables (Zhu et al., 2023). Although meat is emissions-intensive, fruits and vegetables are the most wasted types of food by volume, making up 37% of total FLW by mass (Chen et al., 2020). The consumer stage is associated with the highest share of global emissions at 36% of total supply-embodied emissions from FLW, compared to 10.9% and 11.5% at the retail and wholesale levels, respectively (Zhu et al., 2023). 

While efforts to measure the FLW problem are invaluable, critical gaps exist regarding evidence of the effectiveness of different reduction strategies across supply chain stages ( Cattaneo, 2021; Goossens, 2019; Karl et al., 2025). To facilitate impact assessments and cost-effectiveness, standardized metrics are required to report actual quantities of FLW reduced as well as resulting GHG emissions savings (Food Loss and Waste Protocol, 2024).

The results presented in this document summarize findings across 22 studies. These studies are made up of eight academic reviews and original studies, eight reports from NGOs, and six reports from public and multilateral organizations. This reflects current evidence from five countries, primarily the United States and the United Kingdom. We recognize this limited geographic scope creates bias, and hope this work inspires research for meta-analyses and data sharing on this topic in underrepresented regions and stages of the supply chain.

Updated Date
Coming Soon Label
Coming Soon

Improve Diets

Image
Image
Plates of food
Coming Soon
Off

Key Takeaways

  • Reducing beef consumption to one serving per week could reduce GHG emissions and improve health outcomes. 
  • Beef and lamb are especially emissions-intensive because ruminant animals emit methane, a powerful GHG, during digestion.
  • Producing beef and other red meat generates 30% of food-related GHG emissions but provides only 5% of global dietary calories. 
  • If everyone in high and middle-income countries reduced beef to one serving a week – and ate any other protein-rich food instead – up to 2.8 Gt CO₂‑eq/yr of GHG emissions could be avoided.
Summary

Agriculture produces about 12 Gt CO₂‑eq/yr, or 21% of total human-caused GHG emissions (Intergovernmental Panel on Climate Change [IPCC], 2023). Animal agriculture contributes more than half of these emissions (Halpern et al., 2022; Poore and Nemecek, 2018). 

Ruminant animals, such as cattle, sheep, and goats produce methane – a GHG with 80 times the warming potential of CO₂ in the near term – in their digestive system (Jackson et al., 2024). Since agriculture is the leading driver of tropical deforestation, particularly for cattle and animal feed production, reducing ruminant meat consumption can avoid additional forest loss and associated GHG emissions.

We define improved diets as a reduction in ruminant meat consumption and a replacement with other protein-rich foods. Such a diet shift can be adopted incrementally through small behavioral changes that together lead to globally significant reductions in GHG emissions.

Description for Social and Search
Improve Diets is a Highly Recommended climate solution. Reducing ruminant meat consumption reduces methane production and pressure to destroy tropical forests.
Overview

Reducing ruminant meat consumption, especially in high-consuming regions, has a globally significant potential for climate change mitigation. Red meat production (including beef, lamb, and pork) contributes 30% of food-related emissions but generates only 5% of global dietary calories (Li et al., 2024). 

Ruminant animals have digestive systems with multiple chambers that allow them to ferment grass and leaves. However, this digestion generates methane emissions through a process called enteric fermentation. In addition, clearing forests and grasslands for pastures and cropland to feed livestock emits CO₂, and livestock manure emits methane and nitrous oxide. 

In 2019, an international team of scientists called the EAT-Lancet Commission developed benchmarks for a healthy, sustainable diet based on peer-reviewed information on human health and environmental sustainability (Willett et al., 2019). The commission estimated that red meat (beef, lamb, and pork) should be limited to 14 grams (30 calories) per day per person, or 5.1 kg/person/yr. Although the EAT-Lancet diet includes pork, our analysis looked specifically at limiting ruminant meat to 5.1 kg/person/yr because it has much higher GHG emissions than pork (Figure 1).

Figure 1. Greenhouse gas emissions associated with the production of protein-rich foods. Beef has the highest emissions per kilogram. These emissions data are from Poore & Nemecek (2018), with the exception of  "Ruminant meat," which was calculated based on the amount of beef and lamb consumed in 2022. 

Poore, J., &  Nemecek, T. (2018). Reducing food’s environmental impacts through producers and consumers. Science, 360(6392), 987–992.

In this solution, we explored reducing ruminant meat consumption in middle- and high-income countries in which consumption exceeds 5.1 kg/person/yr. Furthermore, our analysis assumed ruminant meat is replaced with approximately the same amount of protein-rich plant- or animal-based foods, which are estimated to be about 20% protein by weight (Poore and Nemecek, 2018).

References

Bai, Y., Alemu, R., Block, S. A., Headey, D., & Masters, W. A. (2021). Cost and affordability of nutritious diets at retail prices: Evidence from 177 countries. Food policy, 99, Article 101983. Link to source: https://doi.org/10.1016/j.foodpol.2020.101983

Bouvard, V., Loomis, D., Guyton, K. Z., Grosse, Y., Ghissassi, F. E., Benbrahim-Tallaa, L., Guha, N., Mattock, H., & Straif, K. (2015). Carcinogenicity of consumption of red and processed meat. The Lancet Oncology, 16(16), 1599–1600. https://doi.org/10.1016/S1470-2045(15)00444-1 

Bradbury, K. E., Murphy, N., & Key, T. J. (2020). Diet and colorectal cancer in UK Biobank: A prospective study. International Journal of Epidemiology, 49(1), 246–258. Link to source: https://doi.org/10.1093/ije/dyz064 

Casey, J. A., Curriero, F. C., Cosgrove, S. E., Nachman, K. E., & Schwartz, B. S. (2013). High-density livestock operations, crop field application of manure, and risk of community-associated methicillin-resistant Staphylococcus aureus infection in Pennsylvania. JAMA Internal Medicine, 173(21), 1980–1990. Link to source: https://doi.org/10.1001/jamainternmed.2013.10408

Domingo, N. G. G., Balasubramanian, S., Thakrar, S. K., Clark, M. A., Adams, P. J., Marshall, J. D., Muller, N. Z., Pandis, S. N., Polasky, S., Robinson, A. L., Tessum, C. W., & Hill, J. D. (2021). Air quality–related health damages of food. Proceedings of the National Academy of Sciences, 118(20), Article e2013637118. Link to source: https://doi.org/10.1073/pnas.2013637118

Foley, J. A., Ramankutty, N., Brauman, K. A., Cassidy, E. S., Gerber, J. S., Johnston, M., Mueller, N. D., O’Connell, C., Ray, D. K., West, P. C., Balzer, C., Bennett, E. M., Carpenter, S. R., Hill, J., Monfreda, C., Polasky, S., Rockström, J., Sheehan, J., Siebert, S., ... Zaks, D. P. M. (2011). Solutions for a cultivated planet. Nature, 478, 337–342. Link to source: https://doi.org/10.1038/nature10452

Food and Agriculture Organization of the United Nations (FAO). (2025). FAO‑FAOSTAT: Food balances (2010-) [Data set]. Food balances for individual countries for the year 2022 (most recent year available). Retrieved March 25, 2025, from Link to source: https://www.fao.org/faostat/en/#data/FBS

Food and Agriculture Organization of the United Nations (FAO). (2023). Low-Income Food-Deficit Countries (LIFDCs) - List updated June 2023. Retrieved March 25, 2025, from Link to source: https://www.fao.org/member-countries/lifdc/en 

Food and Agriculture Organization of the United Nations (FAO). (2017). Livestock solutions for climate change [Technical paper]. Link to source: https://www.fao.org/family-farming/detail/en/c/1634679/

Gerber, P. J., Steinfeld, H., Henderson, B., Mottet, A., Opio, C., Dijkman, J., Falcucci, A., & Tempio, G. (2013). Tackling climate change through livestock: A global assessment of emissions and mitigation opportunities [Report]. Food and Agriculture Organization of the United Nations. Link to source: https://www.fao.org/4/i3437e/i3437e00.htm 

Godfray, H. C. J., Aveyard, P., Garnett, T., Hall, J. W., Key, T. J., Lorimer, J., Pierrehumbert, R. T., Scarborough, P., Springmann, M., & Jebb, S. A. (2018). Meat consumption, health, and the environment. Science, 361(6399), Article eaam5324. Link to source: https://doi.org/10.1126/science.aam5324

Gupta, S., Vemireddy, V., Singh, D. K., & Pingali, P. (2021). Ground truthing the cost of achieving the EAT lancet recommended diets: Evidence from rural India. Global Food Security, 28, Article 100498. Link to source: https://doi.org/10.1016/j.gfs.2021.100498

Halpern, B. S., Frazier, M., Verstaen, J., Rayner, P.-E., Clawson, G., Blanchard, J. L., Cottrell, R. S., Froehlich, H. E., Gephart, J. A., Jacobsen, N. S., Kuempel, C. D., McIntyre, P. B., Metian, M., Moran, D., Nash, K. L., Többen, J., & Williams, D. R. (2022). The environmental footprint of global food production. Nature Sustainability, 5, 1027–1039. Link to source: https://doi.org/10.1038/s41893-022-00965-x 

Harter, T., Lund, J. R., Darby, J., Fogg, G. E., Howitt, R., Jessoe, K. K., Pettygrove, G. S., Quinn, J. F., Viers, J. H., Boyle, D. B., Canada, H. E., De La Mora, N., Dzurella, K. N., Fryjoff-Hung, A., Hollander, A. D., Honeycutt, K. L., Jenkins, M. W., Jensen, V. B., King, A. M., ... Rosenstock, T. S. (2012). Addressing nitrate in California’s drinking water with a focus on Tulare Lake Basin and Salinas Valley groundwater [Report]. Center for Watershed Sciences, University of California. Link to source: https://ucanr.edu/sites/default/files/2012-03/138956.pdf 

Heederik, D., Sigsgaard, T., Thorne, P. S., Kline, J. N., Avery, R., Bønløkke, J. H., Chrischilles, E. A., Dosman, J. A., Duchaine, C., Kirkhorn, S. R., Kulhanková, K., & Merchant, J. A. (2007). Health effects of airborne exposures from concentrated animal feeding operations. Environmental Health Perspectives, 115(2), 298–302. Link to source: https://doi.org/10.1289/ehp.8835

Herrero, M., Henderson, B., Havlík, P., Thornton, P. K., Conant, R. T., Smith, P., Wirsenius, S., Hristov, A. N., Gerber, P., Gill, M., Butterbach-Bahl, K., Valin, H., Garnett, T., & Stehfest, E. (2016). Greenhouse gas mitigation potentials in the livestock sector. Nature Climate Change, 6(5), 452–461. Link to source: https://doi.org/10.1038/nclimate2925 

Hirvonen, K., Bai, Y., Headey, D., & Masters, W. A. (2020). Affordability of the EAT–Lancet reference diet: A global analysis. The Lancet Global Health, 8(1), e59–e66. Link to source: https://doi.org/10.1016/S2214-109X(19)30447-4 

Intergovernmental Panel on Climate Change. (2023). Climate change 2023: Synthesis report. Contribution of working groups I, II and III to the sixth assessment report of the intergovernmental panel on climate change [Core Writing Team, H. Lee, & J. Romero (Eds.)]. Link to source: https://doi.org/10.59327/IPCC/AR6-9789291691647 

Jackson, R. B., Saunois, M., Martinez, A., Canadell, J. G., Yu, X., Li, M., Poulter, B., Raymond, P. A., Regnier, P., Ciais, P., Davis, S. J., & Patra, P. K. (2024). Human activities now fuel two-thirds of global methane emissions. Environmental Research Letters, 19(10), Article 101002. Link to source: https://doi.org/10.1088/1748-9326/ad6463

Kaluza, J., Wolk, A., & Larsson, S. C. (2012). Red meat consumption and risk of stroke: A meta-analysis of prospective studies. Stroke, 43(10), 2556–2560. Link to source: https://doi.org/10.1161/STROKEAHA.112.663286

Katare, B., Wang, H. H., Lawing, J., Hao, N., Park, T., & Wetzstein, M. (2020). Toward optimal meat consumption. American Journal of Agricultural Economics, 102(2), 662–680. Link to source: https://doi.org/10.1002/ajae.12016 

Kim, B. F., Santo, R. E., Scatterday, A. P., Fry, J. P., Synk, C. M., Cebron, S. R., Mekonnen, M. M., Hoekstra, A. Y., de Pee, S., Bloem, M. W., Neff, R. A., & Nachman, K. E. (2020). Country-specific dietary shifts to mitigate climate and water crises. Global Environmental Change, 62, Article 101926. Link to source: https://doi.org/10.1016/j.gloenvcha.2019.05.010 

Li, M., Wang, Y., Zhao, S., Chen, W., Liu, Y., Zheng, H., Sun, Z., He, P., Li, R., Zhang, S., Xing, P., & Li., Q. (2024). Improving the affordability and reducing greenhouse gas emissions of the EAT-Lancet diet in China. Sustainable Production and Consumption, 52, 445–457. Link to source: https://doi.org/10.1016/j.spc.2024.11.014

Li, Y., He, P., Shan, Y., Li, Y., Hang, Y., Shao, S., Ruzzenenti, F., & Hubacek, K. (2024). Reducing climate change impacts from the global food system through diet shifts. Nature Climate Change, 14(9), 943–953. Link to source: https://doi.org/10.1038/s41558-024-02084-1

Mariotti, F., & Gardner, C. D. (2019). Dietary protein and amino acids in vegetarian diets—A review. Nutrients, 11(11), Article 2661. Link to source: https://doi.org/10.3390/nu11112661

Mbow, C., Rosenzweig, C., Barioni, L. G., Benton, T. G., Herrero, M., Krishnapillai, M., Liwenga, E., Pradhan, P., Rivera-Ferre, M. G., Sapkota, T., Tubiello, F. N., & Xu, Y. (2019). Food security. In P. R. Shukla, J. Skea, E. Calvo Buendia, V. Masson-Delmotte, H.-O. Pörtner, D. C. Roberts, P. Zhai, R. Slade, S. Connors, R. van Diemen, M. Ferrat, E. Haughey, S. Luz, S. Neogi, M. Pathak, J. Petzold, J. Portugal Pereira, P. Vyas, E. Huntley, K. Kissick, M. Belkacemi, & J. Malley (Eds.), Climate change and land: An IPCC special report on climate change, desertification, land degradation, sustainable land management, food security, and greenhouse gas fluxes in terrestrial ecosystems (pp. 437–550). Cambridge University Press. Link to source: https://doi.org/10.1017/9781009157988.007

Meier, T., & Christen, O. (2013). Environmental impacts of dietary recommendations and dietary styles: Germany as an example. Environmental Science & Technology, 47(2), 877–888. Link to source: https://doi.org/10.1021/es302152v

Nelson, M. E., Hamm, M. W., Hu, F. B., Abrams, S. A., & Griffin, T. S. (2016). Alignment of healthy dietary patterns and environmental sustainability: A systematic review. Advances in Nutrition, 7(6), 1005–1025. Link to source: https://doi.org/10.3945/an.116.012567

Nijdam, D., Rood, T., & Westhoek, H. (2012). The price of protein: Review of land use and carbon footprints from life cycle assessments of animal food products and their substitutes. Food Policy, 37(6), 760–770. Link to source: https://doi.org/10.1016/j.foodpol.2012.08.002

Norwood, F. B., & Lusk, J. L. (2011). Compassion, by the pound: The economics of farm animal welfare. Oxford University Press. Link to source: https://global.oup.com/academic/product/compassion-by-the-pound-9780199551163?cc=ca&lang=en& 

Pan, A., Sun, Q., Bernstein, A. M., Schulze, M. B., Manson, J. E., Willett, W. C., & Hu, F. B. (2011). Red meat consumption and risk of type 2 diabetes: 3 cohorts of US adults and an updated meta-analysis. The American Journal of Clinical Nutrition, 94(4), 1088–1096. Link to source: https://doi.org/10.3945/ajcn.111.018978

Pan, A., Sun, Q., Bernstein, A. M., Schulze, M. B., Manson, J. E., Stampher, M. J., Willett, W. C., & Hu, F. B. (2012). Red meat consumption and mortality: Results from 2 prospective cohort studies. Archives of Internal Medicine, 172(7), 555–563. Link to source: https://doi.org/10.1001/archinternmed.2011.2287

Pimentel, D., & Pimentel, M. (2003). Sustainability of meat-based and plant-based diets and the environment. The American Journal of Clinical Nutrition, 78(3), 660S–663S. Link to source: https://doi.org/10.1093/ajcn/78.3.660S

Poore, J., & Nemecek, T. (2018) Reducing food’s environmental impacts through producers and consumers. Science, 360(6392), 987–992. Link to source: https://doi.org/10.1126/science.aaq0216

Porter, S., & Cox, C. (2020, May 28). Manure overload: Manure plus fertilizer overwhelms Minnesota’s land and water. Environmental Working Group. Link to source: https://www.ewg.org/interactive-maps/2020-manure-overload/

Ripple, W. J., Smith, P., Haberl, H., Montzka, S. A., McAlpine, C., & Boucher, D. H. (2014a). Ruminants, climate change and climate policy. Nature Climate Change, 4(1), 2–5. Link to source: https://doi.org/10.1038/nclimate2081

Ripple, W. J., Estes, J. A., Beschta, R. L., Wilmers, C. C., Ritchie, E. G., Hebblewhite, M., Berger, J., Elmhagen, B., Letnic, M., Nelson, M. P., Schmitz, O. J., Smith, D. W., Wallach, A. D., & Wirsing, A. J. (2014b). Status and ecological effects of the world’s largest carnivores. Science, 343(6167), Article 1241484. Link to source: https://doi.org/10.1126/science.1241484

Ripple, W. J., Newsome, T. M., Wolf, C., Dirzo, R., Everatt, K. T., Galetti, M., Hayward, M. W., Kerley, G. I. H., Levi, T., Lindsey, P. A., Macdonald, D. W., Malhi, Y., Painter, L. E., Sandom, C. J., Terborgh, J., & Van Valkenburgh, B. (2015). Collapse of the world’s largest herbivores. Science Advances, 1(4), Article e1400103. Link to source: https://doi.org/10.1126/sciadv.1400103

Searchinger, T., Waite, R., Hanson, C., Ranganathan, J., Dumas, P., Matthews, E., & Klirs, C. (2019). Creating a sustainable food future: A menu of solutions to feed nearly 10 billion people by 2050 [Report]. World Resources Institute. Link to source: https://research.wri.org/wrr-food

Sinha, R., Cross, A. J., Graubard, B. I., Leitzmann, M. F., & Schatzkin, A. (2009). Meat intake and mortality: A prospective study of over half a million people. Archives of Internal Medicine, 169(6), 562–571. Link to source: https://doi.org/10.1001/archinternmed.2009.6

Springmann, M., Clark, M. A., Rayner, M., Scarborough, P., & Webb, P. (2021). The global and regional costs of healthy and sustainable dietary patterns: A modelling study. The Lancet Planetary Health, 5(11), e797–e807. Link to source: https://doi.org/10.1016/S2542-5196(21)00251-5 

Steinfeld, H., Gerber, P., Wassenaar, T., Castel, V., Rosales, M., & de Haan, C. (2006). Livestock’s long shadow: Environmental issues and options [Report]. Food and Agriculture Organization of the United Nations. Link to source: https://www.fao.org/4/a0701e/a0701e00.htm 

Sun, J., Liao, X.-P., D’Souza, A. W., Boolchandani, M., Li, S.-H., Cheng, K., Luis Martínez, J., Li, L., Feng, Y.-J., Fang, L.-X., Huang, T., Xia, J., Yu, Y., Zhou, Y.-F., Sun, Y.-X., Deng, X.-B., Zeng, Z.-L., Jiang, H.-X., Fang, B.-H., … Liu, Y.-H. (2020). Environmental remodeling of human gut microbiota and antibiotic resistome in livestock farms. Nature Communications, 11(1), Article 1427. Link to source: https://doi.org/10.1038/s41467-020-15222-y

Tang, K. L., Caffrey, N. P., Nóbrega, D. B., Cork, S. C., Ronksley, P. E., Barkema, H. W., Polachek, A. J., Ganshorn, H., Sharma, N., Kellner, J. D., & Ghali, W. A. (2017). Restricting the use of antibiotics in food-producing animals and its associations with antibiotic resistance in food-producing animals and human beings: A systematic review and meta-analysis. The Lancet Planetary Health, 1(8), e316–e327. Link to source: https://doi.org/10.1016/S2542-5196(17)30141-9

Toumpanakis, A., Turnbull, T., & Alba-Barba, I. (2018). Effectiveness of plant-based diets in promoting well-being in the management of type 2 diabetes: A systematic review. BMJ Open Diabetes Research & Care, 6(1), Article e000534. Link to source: https://doi.org/10.1136/bmjdrc-2018-000534

Van Boeckel, T. P., Brower, C., Gilbert, M., Grenfell, B. T., Levin, S. A., Robinson, T. P., Teillant, A., & Laxminarayan, R. (2015). Global trends in antimicrobial use in food animals. Proceedings of the National Academy of Sciences, 112(18), 5649–5654. Link to source: https://doi.org/10.1073/pnas.1503141112 

Vergnaud, A.-C., Norat, T., Romaguera, D., Mouw, T., May, A. M., Travier, N., Luan, J., Wareham, N., Slimani, N., Rinaldi, S., Couto, E., Clavel-Chapelon, F., Boutron-Ruault, M.-C., Cottet, V., Palli, D., Agnoli, C., Panico, S., Tumino, R., Vineis, P., … Peeters, P. H. M. (2010). Meat consumption and prospective weight change in participants of the EPIC-PANACEA study. The American Journal of Clinical Nutrition, 92(2), 398–407. Link to source: https://doi.org/10.3945/ajcn.2009.28713

Westhoek, H., Lesschen, J. P., Rood, T., Wagner, S., De Marco, A., Murphy-Bokern, D., Leip, A., van Grinsven, H., Sutton, M. A., & Oenema, O. (2014). Food choices, health and environment: Effects of cutting Europe’s meat and dairy intake. Global Environmental Change, 26, 196–205. Link to source: https://doi.org/10.1016/j.gloenvcha.2014.02.004

Willett, W., Rockström, J., Loken, B., Springmann, M., Lang, T., Vermeulen, S., Garnett, T., Tilman, D., DeClerck, F., Wood, A., Jonell, M., Clark, M., Gordon, L. J., Fanzo, J., Hawkes, C., Zurayk, R., Rivera, J. A., De Vries, W., Majele Sibanda, L., ... Murray, C. J. L. (2019). Food in the Anthropocene: The EAT–Lancet Commission on healthy diets from sustainable food systems. The Lancet, 393(10170), 447–492. Link to source: https://doi.org/10.1016/s0140-6736(18)31788-4

Willits-Smith, A., Odinga, H., O’Malley, K., & Rose, D. (2023). Demographic and socioeconomic correlates of disproportionate beef consumption among US adults in an age of global warming. Nutrients, 15(17), Article 3795. Link to source: https://doi.org/10.3390/nu15173795 

Credits

Lead Fellows

  • Emily Cassidy

Contributors

  • Ruthie Burrows, Ph.D.
  • James Gerber, Ph.D.
  • Daniel Jasper
  • Alex Sweeney

Internal Reviewers

  • Paul C. West, Ph.D.
  • James Gerber, Ph.D.
  • Megan Matthews, Ph.D
  • Ted Otte
Effectiveness

We estimated that replacing 1 kg of ruminant meat with the same weight of other meat or protein-rich food reduces emissions by about 0.065 t CO₂‑eq (100-yr basis). 

We derived GHG emissions from 1 kg of ruminant meat, 0.075 t CO₂‑eq (100-yr basis), from Poore and Nemecek’s (2018) database and modeling from Kim et al. (2020). Our calculation was based on the GHG footprint of a kg of meat from beef cattle, dairy cattle, and sheep. We weighted the average GHG footprint based on the fact that beef makes up the majority (83%) of ruminant meat consumption, with sheep meat making up a smaller proportion (17%), according to data from the United Nations’ Food and Agriculture Organization (FAO) Food Balances (FAO, 2025).

From Poore and Nemecek’s database, we also derived the average GHG emissions from consuming 1 kg of other protein-rich foods in place of ruminant meat. These foods were: pig meat (pork), poultry meat, eggs, fish (farmed), crustaceans (farmed), peas, other pulses, groundnuts, nuts, and tofu, which are all around 20% protein by weight. Using FAO data on food availability in 2022 as a proxy for consumption, we calculated that the weighted average of these substitutes is 0.01 t CO₂‑eq /kg. 

We subtracted the weighted average emissions of these protein-rich foods (0.01 t CO₂‑eq /kg) from the weighted average emissions from ruminant meat production (0.075 t CO₂‑eq /kg) to calculate the emissions savings (0.065 t CO₂‑eq /kg) (Table 1). Our analysis assumed that substituting a serving of plant- or animal-based protein for ruminant meat reduces the production of that meat (see Caveats). 

Kim et al. (2020) did not provide species-specific emissions, but we assumed that for ruminant meat, the breakdown of CO₂, nitrous oxide, and methane was the same as in Poore and Nemecek (2018) – 43% methane and 57% CO₂ and nitrous oxide. 

Table 1. Effectiveness at reducing emissions.

Unit: t CO₂‑eq /kg avoided ruminant meat

Mean (weighted average) 0.065

Unit: t CO₂‑eq /kg avoided ruminant meat

Mean (weighted average) 0.13
Left Text Column Width
Cost

Based on our analysis, the average cost of 1 kg of ruminant meat was US$21.29 compared with the weighted average US$20.73 for other protein-rich foods. This resulted in a savings of US$0.56/kg of food. This translates to an estimated savings of US$8.54/t CO₂ eq (Table 2).

Since the publication of the EAT-Lancet Commission's dietary benchmarks, several studies have been published on the affordability of shifting to the diet (Gupta et al., 2021; Hirvonen et al., 2020; Li et al., 2024; Springmann et al., 2021). Research findings have been mixed on whether this diet shift reduces costs for consumers. One modeling study found that while the diet may cost less in upper-middle-income to high-income countries, on average, it may be more expensive in lower-middle-income to low-income countries (Springmann et al., 2021). 

As opposed to the EAT-Lancet commission, our analysis focused solely on the shift from ruminant meat toward other protein-rich foods, which doesn’t include other dietary shifts, such as reducing other kinds of meat, reducing dairy, or increasing fruits and vegetables. We found no published evidence on the economic impacts of the shift away from ruminant meat alone. However, we used data from Bai et al. (2020), which used food price data from the World Bank’s International Comparison Program (ICP) (2011), to estimate cost differences between ruminant meat and substitutes.

We converted these prices into 2023 US$ and calculated a weighted average cost of food substitutes, based on food availability from the FAO Food Balances (2025). 

The limited information used for this estimate can create bias, and we hope this work inspires research and data sharing on the economic impact of reduced ruminant consumption.

Table 2. Cost per unit climate impact. Negative values reflect cost savings.

Unit: 2023 US$/t CO₂‑eq , 100-year basis

Mean -8.54
Left Text Column Width

Methods and Supporting Data

Learning Curve

Improve Diets does not have a learning curve associated with falling costs of adoption. This solution does not address synthetically derived animal products, such as lab-grown meat, which could serve as replacements for ruminant meat. See Advance Cultivated Meat for more information

Speed of Action

Speed of action refers to how quickly a climate solution physically affects the atmosphere after it is deployed. This is different from speed of deployment, which is the pace at which solutions are adopted.

At Project Drawdown, we define the speed of action for each climate solution as emergency brake, gradual, or delayed.

Improve Diets is an EMERGENCY BRAKE climate solution. It has the potential to deliver a more rapid impact than nominal and delayed solutions. The impact of this solution is two-fold: first, it reduces methane from enteric fermentation and manure management. Second, the solution reduces pressure on natural ecosystems, reducing deforestation and other land use changes, which create a large, sudden “pulse” of CO₂ emissions.

Because emergency brake solutions can deliver their climate benefits quickly, they can help accelerate our efforts to address dangerous levels of climate change. For this reason, they are a high priority.

Caveats

We did not include Low-Income Food-Deficit countries (FAO, 2023) in this analysis because the solution does not apply to people who do not have access to affordable and healthy alternatives to ruminant meat or those with micronutrient deficiencies. 

Although some amino acids, which are building blocks of protein, are present in lower-than-optimal proportions for human needs in some plant-based foods, mixing plant protein sources, as is typically done in vegetarian diets, can address deficiencies (Mariotti & Gardner, 2019).

Additionality is a concern for this solution. While ruminant meat consumption in middle- to high-income countries remained fairly stable between 2010 and 2022, some high-income countries have recently started reducing their ruminant consumption (see Adoption Trends). However, it’s difficult to determine current adoption and trends from national-level statistics, which average out low and high consumers within a country.

Another consideration is that the decision to eat less ruminant meat will ultimately lead farmers to produce fewer ruminant animals, but the substitution may not be one-to-one. For example, one modeling study found that cutting beef consumption by 1 kg may only reduce beef production by 0.7 kg (Norwood & Lusk, 2011).

Humans use more land for animal agriculture than for any other activity. However, the potential to remove and store carbon from the atmosphere by freeing up the land used in food production, as estimated by Mbow et al. (2019), was not included in this analysis.

Current Adoption

Household-level data on food consumption are limited and not often comparable. In this analysis, we summarized current levels of food consumption on a national level, based on data on food availability from FAO Food Balances (2025). Because the data are averaged at a country level, we couldn’t estimate the current level of adoption for individuals of reduced ruminant meat consumption or the EAT-Lancet diet. 

The EAT-Lancet recommended threshold of 5.1 kg of ruminant meat per person per year is in edible, retail weight. However, available data on per capita food availability from the FAO Food Balances is measured in carcass weight, which, for beef cattle, is about 1.4 times larger than a retail cut of meat. Therefore, in this analysis, we set the threshold of excess consumption in the Food Balances as greater than 7.2 kg carcass weight per person per year, which is 5.1 kg of retail ruminant meat per person per year.

In 110 of the 146 countries tracked by FAO, average annual consumption was more than 5.1 kg of ruminant meat per person per year. Some of the highest consuming nations include Mongolia (70.1 kg/person/yr), Argentina (33.3 kg/person/yr), the United States (27.5 kg/person/yr), Australia (25.3 kg/person/yr), and Brazil (25 kg/person/yr). 

The 36 high- and middle-income countries with low (<5.1 kg/person/year) ruminant meat consumption include India (2 kg/person/yr), Peru (3.6 kg/person/yr), Poland (0.2 kg/person/yr), Vietnam (3.9 kg/person/yr), and Indonesia (2.4 kg/person/yr). 

Adoption Trend

Ruminant meat consumption in high- and middle-income countries remained fairly stable between 2010 and 2022, according to data from FAO’s Food Balances, increasing only 3% overall from 8.2 to 8.5 kg/person/yr.

However, per capita ruminant meat consumption across high-consuming regions (the Americas, Europe, and Oceania) decreased. Consumption in South America and North America declined by 13% and 2%, respectively. Europe and Oceania saw the greatest declines, at 18% and 38%, respectively.

Adoption Ceiling

The adoption ceiling for this solution is the amount of total ruminant meat consumption across all 146 high- and middle-income countries tracked by the FAO. In 2022, the consumption of ruminant meat totaled 81.2 billion kg (Table 3).

Table 3. Adoption ceiling.

Unit: kg avoided ruminant meat/yr

Estimate 81,200,000,000
Left Text Column Width
Achievable Adoption

If all of the 110 countries consuming more than the EAT-Lancet recommendation cut consumption to 5.1 kg/person/yr (which is about an 85 g serving of ruminant meat every six days), that would lower annual global ruminant meat consumption by about half (53%), or 42.9 billion kg/yr. We used this as the estimated high achievable adoption value. The low achievable adoption value we estimated to be half of this reduction (26%), or 21.4 billion kg/yr (Table 4). 

Table 4. Range of achievable adoption levels.

Unit: kg avoided ruminant meat/yr

Current adoption Not Determined
Achievable – low 21,400,000,000
Achievable – high 42,900,000,000
Adoption ceiling 81,200,000,000
Left Text Column Width

Improving diets by reducing ruminant meat consumption globally could mitigate emissions by 1.4–5.3 Gt CO₂‑eq/yr (Table 5). 

Therefore, reducing ruminant meat consumption and replacing it with any other form of plant or animal protein can have a substantial impact on GHG emissions. Such a diet shift can be adopted incrementally with small behavioral changes that together lead to globally significant reductions in GHG emissions.

Table 5. Climate impact at different levels of adoption.

Unit: Gt CO₂‑eq/yr

Current adoption Not Determined
Achievable – low 1.40
Achievable – high 2.80
Adoption ceiling 5.30

Unit: Gt CO₂‑eq/yr

Current adoption Not Determined
Achievable – low 2.88
Achievable – high 5.76
Adoption ceiling 10.90
Left Text Column Width
Additional Benefits

Food Security

Reducing ruminant meat in diets of high-income countries can improve food security (Searchinger et al., 2019). Productive cropland that is used to grow animal feed could instead be used to produce food for human consumption (Ripple et al., 2014a).

Health

Reducing ruminant meat consumption has multiple health benefits. Diets high in red meat have been linked to increased risk of overall mortality and mortality from cancer (Pan et al., 2012; Sinha et al., 2009). Excess red meat consumption is also associated with increased risk of cardiovascular disease, stroke, type 2 diabetes, colorectal cancer, and weight gain (Bouvard et al., 2015; Bradbury et al., 2020; Kaluza et al., 2012; Pan et al., 2011; Vergnaud et al., 2010). Diets that incorporate other sources of protein such as fish, poultry, nuts, legumes, low-fat dairy, and whole grains are associated with a lower risk of mortality and a reduction in dietary saturated fat, and can improve the management of diabetes (Pan et al., 2012; Nelson et al., 2016; Toumpanakis et al., 2018). 

Reducing demand for meat also has implications for health outcomes associated with livestock production. Animal agriculture, especially industrial and confined feeding operations, commonly uses antibiotics to prevent and treat infections in livestock (Casey et al., 2013). Consistent direct contact with livestock exposes people, especially farmworkers, to antibiotic-resistant bacteria, which can lead to antibiotic-resistant health outcomes (Sun et al., 2020; Tang et al., 2017). Moreover, these exposures are not limited to farmworkers. In fact, a study in Pennsylvania found that people living near dairy/veal and swine industrial agriculture had a higher risk of developing methicillin-resistant Staphylococcus aureus (MRSA) infections (Casey et al., 2013).

Equality

A lower demand for ruminant meat could promote environmental justice by reducing the amount of industrial animal agriculture operations. This may benefit communities near these operations by reducing exposure to air and water pollution, pathogens, and odors (Casey et al., 2013; Heederik et al., 2007; Steinfeld et al., 2006).

Nature Protection

Agricultural expansion for livestock production is a major driver of deforestation (Ripple et al., 2014b). Deforestation is associated with biodiversity loss through habitat degradation and destruction, as well as forest fragmentation (Steinfeld et al., 2006). Livestock farming can reduce the diversity of landscapes and can contribute to the loss of large carnivore, herbivore, and bird species (Ripple et al., 2015; Steinfeld et al., 2006). The clearing of forests for animal agriculture is especially prevalent in the tropics, and a lower demand for meat, particularly ruminant meat, could reduce tropical deforestation (Ripple et al., 2014b).

Land Resources

Animal agriculture, especially ruminants such as cattle, requires a lot of land (Nijdam et al., 2012). Life-cycle analyses have found that beef consistently requires the most land use among animal-based proteins (Nijdam et al., 2012; Meier & Christen, 2013; Searchinger et al., 2019). This high land use is mostly due to the amount of land needed to grow crops that eventually feed livestock (Ripple et al., 2014a). In the European Union, Westhoek et al. (2014) estimated that halving consumption of meat, dairy, and eggs would result in a 23% reduction in per capita cropland use.

Water Resources

While livestock is directly responsible for a small proportion of global water usage, a significant amount of water is required to produce forage and grain for animal feed (Steinfeld et al., 2006). In the United States, livestock production is the largest source of freshwater consumption, and producing 1 kg of animal protein uses 100 times more water than 1 kg of grain protein (Pimentel & Pimentel, 2003). Ruminant meats have some of the highest water usage rates of all animal protein sources (Kim et al., 2020; Searchinger et al., 2019; Steinfed et al., 2006).

Water Quality

Livestock production can contribute to water pollution directly and indirectly through feed production and processing (Steinfeld et al., 2006). Manure contains nutrients such as nitrogen and phosphorus, as well as drug residues, heavy metals, and pathogens (Steinfeld et al., 2006). Manure can pollute water directly from feedlots and can also leach into water sources when used as a fertilizer on croplands (Porter & Cox, 2020). For example, animal agriculture is one of the top polluters of water basins in central California (Harter et al., 2012) 

Air Quality

In addition to CO₂, ruminant agriculture is a source of air pollutants such as methane, nitrous oxides, ammonia, and volatile organic compounds (Gerber et al., 2013). Fertilization of feed crops and deposition of manure on crops are the primary sources of nitrogen emissions from ruminant agriculture (Steinfeld et al., 2006). Air pollution in nearby communities can lead to poor odors and respiratory issues, which may affect stress levels and quality of life (Domingo et al., 2021; Heederik et al., 2007).

Risks

A total replacement of ruminant meat with other food may reduce food availability in arid climates, where ruminants graze on land not suitable for crop production. 

While the shift from ruminant meat consumption to chicken and pork would curtail some of the demand for animal feed, it would not be reduced as much as a shift from ruminants to plant-based foods. 

Interactions with Other Solutions

Reinforcing

Pastures for grazing ruminants occupy 3400 million ha of land, more than any other human activity (Foley et al., 2011). Curtailing ruminant consumption can significantly reduce demand for land and facilitate the protection of carbon-rich ecosystems. If the adoption of this solution is aggressive, it could open up opportunities for the restoration of land-based ecosystems and some coastal wetlands.

This solution increases the supply of food. This makes more raw material available to increase the adoption potential of the following solutions:

(mixed) Reducing ruminant consumption could lead to less manure production and, therefore, nutrient pollution in proximal and downstream receiving ecosystems. However, if ruminant meat is replaced with food sources that generate more manure or require more fertilizer/pesticides, pollution could increase in proximal or downgradient receiving ecosystems.

Reducing ruminant meat consumption can reduce the amount of nutrients and manure available to manage, depending on whether it is substituted with plant-based foods or other meat.

Dashboard

Solution Basics

kg avoided ruminant meat

t CO₂-eq (100-yr)/unit
0.065
units/yr
Current Not Determined 02.14×10¹⁰4.29×10¹⁰
Achievable (Low to High)

Climate Impact

Gt CO₂-eq (100-yr)/yr
Current Not Determined 1.42.8
US$ per t CO₂-eq
-9
Emergency Brake

CO₂, CH₄ , N₂O

Trade-offs

There are climate and environmental trade-offs associated with the production of different kinds of protein. Producing ruminant meat is land-intensive and contributes to the conversion of natural ecosystems to pasture and animal feed. However, ruminants can live on land that is too dry for crop production and graze on plants not suitable for human consumption. In some low-income food-insecure countries (not included in this analysis), grazing animals may be an important source of protein. 

Substituting ruminant meat with chicken, fish, or other meat can substantially reduce methane emissions, but comes with some environmental and animal welfare trade-offs. 

kg/person/yr
0-10
10–20
20–30
30–40
> 40

Per capita ruminant meat consumption

Per capita ruminant meat consumption varies greatly around the world. According to the Food and Agriculture Organization of the United Nations (FAO), Mongolia had the highest per-person ruminant meat consumption (99 kg/person/yr) in 2022, followed by Argentina (47 kg/person/yr) and Turkmenistan (46 kg/person/yr).

Food and Agriculture Organization of the United Nations (FAO). (2025). FAO‑FAOSTAT: Food balances (2010–) [Data set, food balances for individual countries for the year 2022]. Retrieved March 25, 2025, from Link to source: https://www.fao.org/faostat/en/#data/FBS

kg/person/yr
0-10
10–20
20–30
30–40
> 40

Per capita ruminant meat consumption

Per capita ruminant meat consumption varies greatly around the world. According to the Food and Agriculture Organization of the United Nations (FAO), Mongolia had the highest per-person ruminant meat consumption (99 kg/person/yr) in 2022, followed by Argentina (47 kg/person/yr) and Turkmenistan (46 kg/person/yr).

Food and Agriculture Organization of the United Nations (FAO). (2025). FAO‑FAOSTAT: Food balances (2010–) [Data set, food balances for individual countries for the year 2022]. Retrieved March 25, 2025, from Link to source: https://www.fao.org/faostat/en/#data/FBS

Maps Introduction

The emissions intensity of beef production varies considerably between countries, due to the contribution of regional deforestation and other land changes (Kim et al. 2020; Poore and Nemecek, 2018) and the intensity of different cattle raising systems, with extensive, pasture-based systems relatively less efficient (in terms of land and CO₂‑eq /kg beef) (Herrero et al. 2016). For example, GHG emissions per kilogram of bovine meat from Brazil and Paraguay were five and 17 times higher, respectively, than those of Danish bovine meat (Kim et al. 2020). These differences were attributable to higher deforestation for grazing lands and methane emissions from enteric fermentation.

Emissions from beef production are skewed by producers with particularly high impacts. About a quarter of beef producers contribute more than 56% (an estimated 1.3 Gt CO₂‑eq ) of all GHGs attributable to beef cattle production.

Beef consumption per person in Mongolia and North and South America is especially high, and reducing it can benefit human health (see Benefits to People & Nature). According to the Food and Agriculture Organization of the United Nations (FAO), Mongolia had the highest per-person ruminant meat consumption (99 kg/person/yr) in 2022, followed by Argentina (47 kg/person/yr) and Turkmenistan (46 kg/person/yr). 

For this analysis, we examined high- and middle-income countries that consume more than 5.1 kg/person/yr of ruminant meat (what we define as “excess consumption”). The United States has more excess ruminant meat consumption than any other country. A 2023 assessment of health survey data found that in the United States, about 12% of the population ate about half of all beef supplies (Willits-Smith et al., 2023).

Maps are based on global average emissions per kg of ruminant meat, which keeps the focus on consumption.

Action Word
Improve
Solution Title
Diets
Classification
Highly Recommended

Lawmakers and Policymakers

  • Use a comprehensive approach to improving diets including both “hard” (e.g., regulations) and “soft” (e.g., educational programs) policies.
  • Ensure public procurement avoids ruminant meat and favors plant-rich diets as the default, especially in schools, hospitals, and cafeterias for public workers.
  • Require companies that sell food to the government to disclose Scope 3 supply-chain emissions and adopt science-based targets, including a no-deforestation commitment.
  • Develop national dietary guidelines based on health and environmental factors; ensure the guidelines are integrated throughout procurement policies, public education programs, and government food aid programs.
  • Establish coordination bodies with stakeholders, such as farmers, distributors, storage facilities, food processors, transportation companies, retail, and waste management services, to design the most optimal policy package.
  • Set ambitious local, national, and international goals and climate plans to improve diets and include the agricultural sector in emissions reduction targets.
  • Establish safety nets for growers, such as access to grants or low-interest capital, reliable access to price information, early warning systems for price fluctuations, and insurance programs.
  • Use financial instruments such as grants, subsidies, or tax exemptions to support farmers, producers, start-ups, infrastructure, and related technology.
  • Reallocate subsidies for ruminant animal agriculture to alternatives; provide extensive support to farmers and ranchers transitioning to more sustainable agriculture systems through financial assistance, buyout programs, and education programs.
  • Remove or reconfigure other subsidies that artificially deflate the price of meat, such as animal feed and manure storage facilities.
  • Require carbon footprint labels on food and produce.
  • Limit or prohibit the expansion of agricultural lands, especially for animal agriculture.
  • Restrict advertising for unhealthy foods and/or require disclosures for health and environmental impacts for adverts.
  • Work with the health-care industry to integrate plant-rich diets into public health programs, and educate the public on the benefits of plant-rich diets.
  • Expand extension services to help food retailers develop plant-based items, design menus, develop marketing materials, and provide other assistance to improve the profitability of plant-rich diets.
  • Implement a carbon tax on livestock or meat products in food-secure areas and ensure there is proper monitoring and enforcement capacity.
  • Use zoning laws to give plant-based and healthy food outlets better visibility or higher traffic locations; designate favorable spaces for plant-based food trucks and street vendors.
  • Create robust educational programs for schools and adults on plant-based and healthy cooking.
  • Create, support, or join education campaigns and/or public-private partnerships that teach the importance of plant-based diets and the environmental impacts of common foods.

Practitioners

  • Scale up production of nutrient-dense plant-based foods.
  • Create peer-to-peer networks to exchange best practices and local or industry troubleshooting tips.
  • Increase the visibility of plant-based diets through repetitive ad campaigns, product placement, and displays.
  • Design menus to avoid ruminant meat and center plant-based products.
  • Invest in R&D to improve plant-based products.
  • Develop culturally relevant plant-based products to support acceptance and uptake.
  • Develop mobile or web apps that help consumers plan and cook plant-based meals, find plant-based retailers, and learn about plant-rich diets.
  • Take advantage of financial incentives such as grants, subsidies, or tax exemptions.
  • Participate or help establish coordination bodies with stakeholders, such as farmers, distributors, storage facilities, food processors, transportation companies, retail, and waste management services, to design the most optimal food systems transformation.
  • Work with the health-care industry to integrate plant-rich diets into public health programs, and educate the public on the benefits of plant-rich diets.
  • Use labels to show the environmental and emissions impact of food and menu items.
  • Hold local plant-based culinary challenges to promote products and services.
  • Create, support, or join education campaigns and/or public-private partnerships that promote plant-rich diets.

Business Leaders

  • Establish company goals for ruminant substitution and incorporate them into corporate net-zero strategies.
  • Ensure company procurement avoids ruminant meat and favors plant-rich diets as the default.
  • Participate in or help establish coordination bodies with stakeholders, such as farmers, distributors, storage facilities, food processors, transportation companies, retail, and waste management services, to design the most optimal food systems transformation.
  • Take advantage of financial incentives such as grants, subsidies, or tax exemptions.
  • Offer financial services, including low-interest loans, micro-financing, and grants, to support initiatives promoting plant-rich diets.
  • Use labels to show the environmental and emissions impact of food and menu items.
  • Increase the visibility of plant-based diets through repetitive ad campaigns, product placement, and displays.
  • Fund start-ups or existing companies that are improving plant-based proteins and alternatives to animal agriculture.
  • Develop mobile or web apps that help consumers plan and cook plant-based meals, find plant-based retailers, and learn about plant-rich diets.
  • Hold local plant-based culinary challenges to promote products and services.
  • Create, support, or join education campaigns and/or public-private partnerships that promote plant-rich diets.
  • Include ruminant-free and plant-rich dietary support in employee wellness and benefits programs.

Nonprofit Leaders

  • Ensure organization procurement avoids ruminant meat and favors plant-rich diets.
  • Help develop and advocate for ambitious local, national, and international goals and climate plans to improve diets.
  • Participate or help establish coordination bodies with stakeholders, such as farmers, distributors, storage facilities, food processors, transportation companies, retail, and waste management services, to design the most optimal food systems transformation.
  • Advocate to reallocate subsidies for ruminant agriculture to plant-based alternatives.
  • Advocate for financial instruments such as taxes, subsidies, or exemptions to support farmers, producers, start-ups, infrastructure, and related technology.
  • Advocate for standardized and mandatory carbon footprint labels on food and produce.
  • Advocate for a carbon tax on livestock or meat products in food-secure areas and ensure there is proper monitoring and enforcement capacity.
  • Offer comprehensive training and technical assistance programs for farmers and producers supporting plant-rich diets.
  • Implement campaigns promoting divestment from major animal agriculture polluters and challenge misleading claims on high-emissions meat products.
  • Work with the health-care industry to integrate plant-rich diets into public health programs, and educate the public on the benefits of plant-rich diets.
  • Create demonstration farms to show local examples, strategies to generate income, and how to use government programs.
  • Create robust educational programs for schools and adults on plant-based and healthy cooking.
  • Hold local plant-based culinary challenges to promote plant-rich diets.
  • Create, support, or join education campaigns and/or public-private partnerships that promote plant-rich diets.

Investors

  • Ensure relevant portfolio companies avoid ruminant meat production and support plant-rich diets; avoid investing in animal agriculture in high-income countries or work with them to transition to plant-rich alternatives.
  • Invest in companies developing plant-based foods or technologies that support processing, such as equipment, transportation, and storage.
  • Fund start-ups or existing companies that are improving plant-based proteins and alternatives to animal agriculture.
  • Offer financial services, including low-interest loans, micro-financing, and grants, for plant-based food initiatives.
  • Participate or help establish coordination bodies with stakeholders, such as farmers, distributors, storage facilities, food processors, transportation companies, retail, and waste management services, to design the most optimal food systems transformation.
  • Create, support, or join education campaigns and/or public-private partnerships that promote plant-rich diets.

Philanthropists and International Aid Agencies

  • Ensure organization procurement avoids ruminant meat and favors plant-rich diets.
  • Help develop and advocate for ambitious local, national, and international goals and climate plans to improve diets.
  • Participate or help establish coordination bodies with stakeholders, such as farmers, distributors, storage facilities, food processors, transportation companies, retail, and waste management services, to design the most optimal food systems transformation.
  • Invest in companies developing plant-based foods or technologies that support processing, such as equipment, transportation, and storage.
  • Fund start-ups or existing companies that are improving plant-based proteins and alternatives to ruminant animal agriculture.
  • Offer financial services, including low-interest loans, micro-financing, and grants, for plant-based food initiatives.
  • Advocate to reallocate subsidies for animal agriculture to plant-based alternatives.
  • Advocate for financial instruments such as taxes, subsidies, or exemptions to support plant-based farmers, producers, start-ups, infrastructure, and related technology.
  • Advocate for standardized and mandatory environmental impact labels on food and produce.
  • Advocate for a carbon tax on livestock or meat products in food-secure areas and ensure there is proper monitoring and enforcement capacity.
  • Offer comprehensive training and technical assistance programs for farmers and producers supporting plant-rich diets.
  • Create demonstration farms to show local examples, strategies to generate income, and how to use government programs.
  • Create robust educational programs for schools and adults on plant-based and healthy cooking.
  • Work with the health-care industry to integrate plant-rich diets into public health programs and educate the public on the benefits of plant-rich diets.
  • Integrate plant-rich diets with ecosystem protection and restoration efforts such as education campaigns, national plans, and international agreements, when relevant.
  • Create, support, or join education campaigns and/or public-private partnerships that promote plant-rich diets.

Thought Leaders

  • Help develop and advocate for ambitious local, national, and international goals and climate plans to improve diets.
  • Participate or help establish coordination bodies with stakeholders, such as farmers, distributors, storage facilities, food processors, transportation companies, retail, and waste management services, to design the most optimal local food systems transformation.
  • Help shift policy and academic goals around agriculture from quantity of outputs to nutritional quality of outputs.
  • Help market and brand plant-based items appealing to average and/or conventional tastes.
  • Find new ways to appeal to high-red-meat consumers and new markets – particularly, men and athletic communities.
  • Highlight the social and environmental impacts of animal-based products in high-income countries.
  • Design and implement robust educational programs for schools and adults on plant-based and healthy cooking.
  • Advocate to reallocate subsidies for animal agriculture to plant-based alternatives.
  • Advocate for financial instruments such as taxes, subsidies, or exemptions to support plant-based farmers, producers, start-ups, infrastructure, and related technology.
  • Advocate for standardized and mandatory carbon footprint labels on food and produce.
  • Create, support, or join education campaigns and/or public-private partnerships that promote plant-rich diets.

Technologists and Researchers

  • Research connections between plant-based agriculture and human well-being indicators such as nutrition, income, and human rights.
  • Develop new or improve existing plant-based or lab-grown alternatives to ruminant meat and other animal-based proteins.
  • Develop plant-based proteins that account for local supply chains and cultural preferences.
  • Analyze the full suite of interventions that encourage plant-based diets and offer recommendations to policy and lawmakers on the most effective options.
  • Use market data on food purchases and preferences to improve marketing and attractiveness of plant-based options.
  • Develop mobile or web apps that help consumers plan and cook plant-based meals, find plant-based retailers, and learn about plant-rich diets.
  • Research connections between plant-rich diets, food security, cultural cuisine preferences, and health indicators.
  • Help develop national dietary guidelines based on health and environmental factors.

Communities, Households, and Individuals

  • Eat plant-rich diets and avoid ruminant meat as much as possible.
  • Offer alternatives to ruminant meat at social gatherings and request plant-based options at public events.
  • Talk to family, friends, and coworkers about avoiding beef; recommend your favorite restaurants, recipes, and cooking tips.
  • Support educational programs for schools and adults on plant-based and healthy cooking.
  • Advocate to reallocate subsidies for animal agriculture to plant-based alternatives.
  • Advocate for financial instruments such as taxes, subsidies, or exemptions to support plant-based farmers, producers, start-ups, infrastructure, and related technology.
  • Create, support, or join education campaigns and/or public-private partnerships that promote plant-rich diets.
Evidence Base

Consensus of effectiveness in reducing ruminant meat: High

There is a high level of consensus in the scientific literature that shifting diets away from ruminant meat mitigates GHG emissions. An IPCC special report on land found “broad agreement” that meat – particularly ruminant meat – was the single food with the greatest impact on the environment on a global basis, especially in terms of GHG emissions and land use (Mbow et al., 2019). The IPCC found that the range of cumulative emissions mitigation from diet shifts by 2050, depending on the type of shift, was as much as 2.7–6.4 Gt CO₂‑eq/yr. This estimate included shifts away from all meat, whereas our analysis focused on shifting away from ruminant meat alone.

The emissions associated with the production of different food products in this solution came from Poore and Nemecek (2018) and Kim et al. (2020). Poore and Nemecek developed a database of emissions footprints for different foods based on a meta-analysis of 570 studies with a median reference year of 2010 (Figure 1). It covers ~38,700 commercially viable farms in 119 countries and 40 products representing ~90% of global protein and calorie consumption. 

According to Poore and Nemecek (2018), producing 1 kg of beef emits 33 times the GHGs emitted by producing protein-rich plant-based foods, such as beans, nuts, and lentils. But beef can also be replaced with any other non-ruminant meat (poultry, pork, or fish) to cut emissions. Substituting ruminant meat with any other kind of meat reduces average emissions by roughly 85%.

A 2024 study on dietary emissions from 140 food products in 139 countries found that shifting consumption toward the EAT-Lancet guidelines could reduce emissions from the food system 17%, or about 1.94 Gt CO₂‑eq/yr (Li, Y. et al., 2024). 

The results presented in this document summarize findings from 42 studies (34 academic reviews and original studies, three reports from NGOs, and five reports from public and multilateral organizations). The results reflect current evidence from 119 countries, but observations are concentrated in Europe, North America, Oceania, Brazil, and China, and limited in Africa and parts of Asia. We recognize this limited geographic scope creates bias, and hope this work inspires research and data sharing on this topic in underrepresented regions.

Updated Date
Coming Soon Label
Coming Soon

Deploy Distributed Solar PV

Sector
Electricity
Image
Image
Solar panels on house roof
Coming Soon
Off
Summary

Distributed solar photovoltaic (PV) systems are small-scale solar PV systems – usually under 1 MW, and installed near the point of use, such as on homes, businesses, or local facilities – that generate electricity for on-site consumption or local grid supply. This solution reduces reliance on centralized fossil-fuel power, cutting GHG emissions and minimizing transmission losses. There are various configurations of distributed solar PV systems; our analysis includes residential systems on homes, commercial and industrial (C&I) systems on businesses or institutions, and mini-grid solar PV systems, which are often coupled with storage.

Description for Social and Search
Deploy Distributed Solar PV is a Highly Recommended climate solution.
Overview

An estimated 23% of GHG emissions on a 100-yr basis comes from electricity generation annually (Clarke et al., 2022). In 2022, more than 60% of global electricity generation came from fossil fuel–based energy sources (International Energy Agency [IEA], 2024a). Since solar is a clean and renewable resource, distributed solar PV does not contribute to GHG emissions or air pollution while generating electricity. Deploy Distributed Solar PV reduces the need for electricity generation from fossil fuels, which reduces emissions of CO₂ as well as smaller amounts of methane and nitrous oxide. 

Distributed solar PV systems are decentralized energy systems that generate electricity from sunlight at or near the point of use. These systems are commonly installed on residential, commercial, and institutional rooftops, converting solar radiation directly into usable electricity through PV cells. These cells are grouped into modules, which in turn form panels and arrays (U.S. Department of Energy [DOE], n.d.) that deliver electricity to consumers (Figure 1). Their modular nature allows flexible system sizing, making distributed solar PV well-suited to varying energy demands, rooftop space, and financial capacity. Distributed solar PV systems are typically installed and operated by homeowners, businesses, municipalities, and third-party service providers. 

Figure 1. Distributed solar PV systems are commonly installed on residential, commercial, and institutional rooftops, converting solar radiation directly into usable electricity. Photovoltaic cells are grouped into modules, which in turn form panels and arrays that deliver electricity to consumers for on-site use. In some cases, excess generation can be exported to the grid. Modified from Engineering Discoveries (n.d.).

Image
Diagram showing solar photovoltaic on a grid system

Source: Engineering Discoveries. (n.d.). Solar power plant main components, working, advantages and disadvantages.

The primary climate benefit of distributed solar PV is the reduction of CO₂ emissions. By generating zero-emissions electricity on-site, these systems displace electricity that would otherwise be supplied by fossil fuel–based grid power and reduce demand on electricity transmission from power plants to consumers. In doing so, distributed solar PV also avoids upstream emissions of methane and nitrous oxide associated with the extraction, transportation, and combustion of fossil fuels.

A significant number of distributed solar PV systems supply electricity directly to the buildings where they are installed, which offsets grid demand and lowers electricity bills for PV owners. In some cases, excess generation can be exported to the grid, contributing to the broader renewable electricity mix and reducing peak loads and system cost (Rahdan et al., 2024). Distributed solar PV systems therefore provide both emissions reductions and grid benefits (Tran et al., 2023; Uzum et al., 2021; Zhang et al., 2025). 

Although distributed solar PV systems typically have lower capacity factors than utility-scale solar systems, they require less land, avoid transmission losses, and enable clean electricity access in urban, peri-urban, and rural areas. Implementation is primarily led by households, small businesses, public entities, and local developers. Governments and utilities often provide incentives such as subsidies, feed-in tariffs, or tax credits to stimulate deployment. Continued cost declines – especially in balance-of-system (BoS) and soft costs like labor and permitting – are expected to increase adoption. Distributed solar PV offers a scalable, low-carbon electricity solution that supports both climate mitigation and energy equity.

References

Abel, D., Holloway, T., Harkey, M., Rrushaj, A., Brinkman, G., Duran, P., Janssen, M., & Denholm, P. (2018). Potential air quality benefits from increased solar photovoltaic electricity generation in the Eastern United States. Atmospheric Environment, 175, 65–74. Link to source: https://doi.org/10.1016/j.atmosenv.2017.11.049

Alboaouh, K. A., & Mohagheghi, S. (2020). Impact of rooftop photovoltaics on the distribution system. Journal of Renewable Energy, 1, Article 4831434. Link to source: https://doi.org/10.1155/2020/4831434

Al-Hanoot, A. K., Mokhlis, H., Mekhilef, S., Alghoul, M., Shareef, H., & Samatar, A. M. (2024). Distributed PV systems in Saudi Arabia: Current status, challenges, and prospects. Energy Strategy Reviews, 55, Article 101535. Link to source: https://doi.org/10.1016/J.ESR.2024.101535

Barbose, G. L., Darghouth, N. R., O’Shaughnessy, E., & Forrester, S. (2023). Tracking the sun: Pricing and design trends for distributed photovoltaic systems in the United States [PowerPoint slides]. Link to source: https://eta-publications.lbl.gov/sites/default/files/5_tracking_the_sun_2023_report.pdf

Bistline, J. E. T., & Watten, A. (2025). Emissions reductions of rooftop solar are overstated by approaches that inadequately capture substitution effects. Nature Climate Change, 15, 1173–1175. Link to source: https://doi.org/10.1038/s41558-025-02459-y

Biswas, A., Qiu, M., Braun, D., Dominici, F., & Mork, D. (2025). Quantifying effects of solar power adoption on CO2 emissions reduction. Science Advances, 11(31), Article eadq5660. Link to source: https://doi.org/10.1126/sciadv.adq5660

Buonocore, J. J., Hughes, E. J., Michanowicz, D. R., Heo, J., Allen J. G., & Williams, A. (2019). Climate and health benefits of increasing renewable energy deployment in the United States. Environmental Research Letters, 14(11), Article 114010. Link to source: https://doi.org/10.1088/1748-9326/ab49bc 

Candelise, C., Saccone, D., & Vallino, E. (2021). An empirical assessment of the effects of electricity access on food security. World Development, 141, Article 105390. Link to source: https://doi.org/10.1016/j.worlddev.2021.105390

Clarke, L., Wei, Y.-M., De La Vega Navarro, A., Garg, A., Hahmann, A. N., Khennas, S., Azevedo, I. M. L., Löschel, A., Singh, A. K., Steg, L., Strbac, G., & Wada, K. (2022). Energy systems. In P. R. Shukla, J. Skea, R. Slade, A. Al Khourdajie, R. van Diemen, D. McCollum, M. Pathak, S. Some, P. Vyas, R. Fradera, M. Belkacemi, A. Hasija, G. Lisboa, S. Luz, & J. Malley (Eds.), Climate change 2022: Mitigation of climate change. Contribution of working group III to the sixth assessment report of the intergovernmental panel on climate change (pp. 613–746). Cambridge University Press. Link to source: https://doi.org/10.1017/9781009157926.008 

Cook, T., Shaver, L., & Arbaje, P. (2018). Modeling constraints to distributed generation solar photovoltaic capacity installation in the US Midwest. Applied Energy, 210, 1037–1050. Link to source: https://doi.org/10.1016/J.APENERGY.2017.08.108

Cubi, E., Zibin, N. F., Thompson, S. J., & Bergerson, J. (2016). Sustainability of rooftop technologies in cold climates: Comparative life cycle assessment of white roofs, green roofs, and photovoltaic panels. Journal of Industrial Ecology, 20(2), 249–262. Link to source: https://doi.org/10.1111/JIEC.12269

de La Beaumelle, N. A., Blok, K., de Chalendar, J. A., Clarke, L., Hahmann, A. N., Huster, J., Nemet, G. F., Suri, D., Wild, T. B., & Azevedo, I. M. L. (2023). The global technical, economic, and feasible potential of renewable electricity. Annual Review of Environment and Resources, 48, 419–449. Link to source: https://doi.org/10.1146/annurev-environ-112321-091140 

Deng, Y. Y., Haigh, M., Pouwels, W., Ramaekers, L., Brandsma, R., Schimschar, S., Grözinger, J., & de Jager, D. (2015). Quantifying a realistic, worldwide wind and solar electricity supply. Global Environmental Change, 31, 239–252. Link to source: https://doi.org/10.1016/j.gloenvcha.2015.01.005 

Dioha, M. O. (2025). How can we finance a fair energy transition in Africa? Project Drawdown. Link to source: https://drawdown.org/insights/how-can-we-finance-a-fair-energy-transition-in-africa 

DNV. (2024). Energy transition outlook 2024 [PowerPoint slides]. Link to source: https://brandcentral.dnv.com/original/gallery/10651/files/original/5c2470ac-597c-43f9-87dd-4e6b238d7845.pdf

Dong, C., Nemet, G., Gao, X., Barbose, G., Sigrin, B., & O’Shaughnessy, E. (2023). Machine learning reduces soft costs for residential solar photovoltaics. Scientific Reports, 13(1), Article 7213. Link to source: https://doi.org/10.1038/s41598-023-33014-4 

Dong, D., Emem, O., Liu, L., Sen, B., Rasmussen, K., Edomah, N., Musango, J. K., Baninla, Y., Sergienko, O., & Liu, G. (2025). Solar photovoltaic development in West Africa will face million-ton waste challenges, and off-grid systems will dominate. Environmental Science & Technology, 59(39), 21102–21116. Link to source: https://doi.org/10.1021/acs.est.5c06339 

Elshurafa, A. M., Albardi, S. R., Bigerna, S., & Bollino, C. A. (2018). Estimating the learning curve of solar PV balance–of–system for over 20 countries: Implications and policy recommendations. Journal of Cleaner Production, 196, 122–134. Link to source: https://doi.org/10.1016/j.jclepro.2018.06.016 

Engineering Discoveries. (n.d.). Solar power plant main components, working, advantages and disadvantages. Retrieved April 23, 2026, from Link to source: https://engineeringdiscoveries.com/solar-power-plant-main-components-working-advantages-and-disadvantages 

ESMAP. (2022). Mini grids for half a billion people: Market outlook and handbook for decision makers. Link to source: https://openknowledge.worldbank.org/server/api/core/bitstreams/32287154-1ccb-46ce-83af-08facf7a3b49/content

Gadzanku, S., Kramer, A., & Smith, B. L. (2023). An updated review of the solar PV installation workforce literature (Report No. NREL/TP-7A40-83652). National Renewable Energy Laboratory. Link to source: https://www.nrel.gov/docs/fy23osti/83652.pdf  

Gagnon, P., & O’Shaughnessy, E. (2024). Consequential analysis of the greenhouse gas emissions impacts of actions that influence the electric grid: The theory and practice of using marginal emissions rates (Report No. NREL/TP-6A40-91580). National Renewable Energy Laboratory. Link to source: https://www.nrel.gov/docs/fy25osti/91580.pdf 

Gallagher, C. L., & Holloway, T. (2020). Integrating air quality and public health benefits in U.S. decarbonization strategies. Frontiers in Public Health, 8, Article 563358. Link to source: https://doi.org/10.3389/fpubh.2020.563358 

Galvan, E., Mandal, P., & Sang, Y. (2020). Networked microgrids with roof-top solar PV and battery energy storage to improve distribution grids resilience to natural disasters. International Journal of Electrical Power & Energy Systems, 123, Article 106239. Link to source: https://doi.org/10.1016/j.ijepes.2020.106239 

Gautier, A., & Jacqmin, J. (2020). PV adoption: The role of distribution tariffs under net metering. Journal of Regulatory Economics, 57(1), 53–73. Link to source: https://doi.org/10.1007/s11149-019-09397-6 

Gan, Y., Elgowainy, A., Lu, Z., Kelly, J. C., Wang, M., Boardman, R. D., & Marcinkoski, J. (2023). Greenhouse gas emissions embodied in the U.S. solar photovoltaic supply chain. Environmental Research Letters, 18(10), Article 104012. Link to source: https://doi.org/10.1088/1748-9326/ACF50D 

Gibon, T., Menacho, A. H., & Guiton, M. (2021). Life cycle assessment of electricity generation options [Report]. United Nations Economic Commission for Europe. Link to source: https://unece.org/sites/default/files/2021-11/LCA_final.pdf

Impram, S., Varbak Nese, S., & Oral, B. (2020). Challenges of renewable energy penetration on power system flexibility: A survey. Energy Strategy Reviews, 31, Article 100539. Link to source: https://doi.org/10.1016/J.ESR.2020.100539

International Energy Agency. (2023). Solar PV power capacity in the net zero scenario, 2015-2030. Link to source: https://www.iea.org/data-and-statistics/charts/solar-pv-power-capacity-in-the-net-zero-scenario-2015-2030 

International Energy Agency. (2024a). World energy balances [Data product]. Link to source: https://www.iea.org/data-and-statistics/data-product/world-energy-balances 

International Energy Agency. (2024b). World energy outlook 2024. Link to source: https://www.iea.org/reports/world-energy-outlook-2024

International Energy Agency, & Nuclear Energy Agency. (2020). Projected costs of generating electricity. Link to source: https://www.oecd-nea.org/upload/docs/application/pdf/2020-12/egc-2020_2020-12-09_18-26-46_781.pdf 

International Energy Agency PVPS. (2022). Environmental life cycle assessment of electricity from PV systems [Fact sheet]. Link to source: https://iea-pvps.org/wp-content/uploads/2022/11/Fact-Sheet-IEA-PVPS-T12-23-LCA-update-2022.pdf

International Renewable Energy Agency. (2019). Future of solar photovoltaic: Deployment, investment, technology, grid integration and socio-economic aspects (A global energy transformation: paper). Link to source: https://www.irena.org/-/media/Files/IRENA/Agency/Publication/2019/Nov/IRENA_Future_of_Solar_PV_2019.pdf

International Renewable Energy Agency. (2019). Future of solar photovoltaic: Deployment, investment, technology, grid integration and socio-economic aspects (A global energy transformation: paper). Link to source: https://www.irena.org/-/media/Files/IRENA/Agency/Publication/2019/Nov/IRENA_Future_of_Solar_PV_2019.pdf 

International Renewable Energy Agency, & International Labour Organization. (2024). Renewable energy and jobs: Annual review 2024 [Report]. Link to source: https://www.irena.org/-/media/Files/IRENA/Agency/Publication/2024/Oct/IRENA_Renewable_energy_and_jobs_2024.pdf

Jacobson, M. Z., Delucchi, M. A., Bauer, Z. A. F., Goodman, S. C., Chapman, W. E., Cameron, M. A., Bozonnat, C., Chobadi, L., Clonts, H. A., Enevoldsen, P., Erwin, J. R., Fobi, S. N., Goldstrom, O. K., Hennessy, E. M., Liu, J., Lo, J., Meyer, C. B., Morris, S. B., Moy, K. R., … Yachanin, A. S. (2017). 100% clean and renewable wind, water, and sunlight all-sector energy roadmaps for 139 countries of the world. Joule, 1(1), 108–121. Link to source: https://doi.org/10.1016/J.JOULE.2017.07.005

Joshi, S., Mittal, S., Holloway, P., Shukla, P. R., Ó Gallachóir, B., & Glynn, J. (2021). High resolution global spatiotemporal assessment of rooftop solar photovoltaics potential for renewable electricity generation. Nature Communications, 12(1), Article 5738. Link to source: https://doi.org/10.1038/s41467-021-25720-2

Jhunjhunwala, A., & Kaur, P. (2018). Solar energy, DC distribution, and microgrids: Ensuring quality power in rural India. IEEE Electrification Magazine, 6(4), 32–39. Link to source: https://doi.org/10.1109/MELE.2018.2871277 

Kannan, N., & Vakeesan, D. (2016). Solar energy for future world: A review. Renewable and Sustainable Energy Reviews, 62, 1092–1105. Link to source: https://doi.org/10.1016/j.rser.2016.05.022 

Kazemian, A., & Xiang, C. (2025). Synergizing photovoltaic-thermal systems with green roofs: A pathway to enhanced urban sustainability and energy efficiency. Renewable and Sustainable Energy Reviews, 222, Article 116002. Link to source: https://doi.org/10.1016/J.RSER.2025.116002

Kumar, A., Ferdous, R., Luque-Ayala, A., McEwan, C., Power, M., Turner, B., & Bulkeley, H. (2019). Solar energy for all? Understanding the successes and shortfalls through a critical comparative assessment of Bangladesh, Brazil, India, Mozambique, Sri Lanka and South Africa. Energy Research & Social Science, 48, 166–176. Link to source: https://doi.org/10.1016/j.erss.2018.10.005 

Lazard. (2024). Levelized cost of energy version 17.0. Link to source: https://www.lazard.com/media/xemfey0k/lazards-lcoeplus-june-2024-_vf.pdf

Leite, N. H., Guzman Lascano, C. P., Valente Morais, H. G., & Pereira da Silva, L. C. (2024). Impact of the net-metering policies on solar photovoltaic investments for residential scale: A case study in Brazil. Renewable Energy, 231, Article 120788. Link to source: https://doi.org/10.1016/J.RENENE.2024.120788

Lukanov, B. R., & Krieger, E. M. (2019). Distributed solar and environmental justice: Exploring the demographic and socio-economic trends of residential PV adoption in California. Energy Policy, 134, Article 110935. Link to source: https://doi.org/10.1016/J.ENPOL.2019.110935

Mahn, D., Best, R., Wang, C., & Abiona, O. (2024). What drives solar energy adoption in developing countries? Evidence from household surveys across countries. Energy Economics, 138, Article 107815. Link to source: https://doi.org/10.1016/J.ENECO.2024.107815

Maka, A. O. M., & Alabid, J. M. (2022). Solar energy technology and its roles in sustainable development. Clean Energy, 6(3), 476–483. Link to source: https://doi.org/10.1093/ce/zkac023 

Masson, G., de l’Epine, M., & Kaizuka, I. (2024). Trends in photovoltaic applications 2024 (Report IEA PVPS T1-43:2024). International Energy Agency PVPS. Link to source: https://iea-pvps.org/wp-content/uploads/2024/10/IEA-PVPS-Task-1-Trends-Report-2024.pdf

Masson, G., Van Rechem, A., de l’Epine, M., & Jäger-Waldau, A. (2025). Snapshot of global PV markets 2025. International Energy Agency PVPS. Link to source: https://iea-pvps.org/wp-content/uploads/2025/04/Snapshot-of-Global-PV-Markets_2025.pdf

Millstein, D., Wiser, R., Bolinger, M., & Barbose, G. (2017). The climate and air-quality benefits of wind and solar power in the United States. Nature Energy, 2(9), Article 17134. Link to source: http://dx.doi.org/10.1038/nenergy.2017.134

Millstein, D., O'Shaughnessy, E., & Wiser, R. (2024). Climate and air quality benefits of wind and solar generation in the United States from 2019 to 2022. Cell Reports Sustainability, 1(6), Article 100105. Link to source: https://doi.org/10.1016/j.crsus.2024.100105 

Mini-Grids Partnership. (2024). State of the global mini-grids market report. Link to source: https://minigrids.org/wp-content/uploads/2024/08/SOTM-Report-2024_EN_vFc.pdf

National Renewable Energy Laboratory. (2014). Distributed solar PV for electricity system resiliency (Report No. NREL/BR-6A20-62631). Link to source: https://docs.nrel.gov/docs/fy15osti/62631.pdf 

National Renewable Energy Laboratory. (2015). Renewable electricity: How do you know you are using it? (Report No. NREL/FS-6A20-64558). Link to source: https://docs.nlr.gov/docs/fy15osti/64558.pdf 

National Renewable Energy Laboratory. (2015). Renewable electricity: How do you know you are using it? (Report No. NREL/FS-6A20-64558). Link to source: https://docs.nlr.gov/docs/fy15osti/64558.pdf

National Renewable Energy Laboratory. (2018). Valuing the resilience provided by solar and battery energy storage systems (Report No. NNREL/BR-6A20-70679). Link to source: https://docs.nrel.gov/docs/fy18osti/70679.pdf 

International Energy Agency, & Nuclear Energy Agency. (2020). Projected costs of generating electricity. Link to source: https://www.oecd-nea.org/upload/docs/application/pdf/2020-12/egc-2020_2020-12-09_18-26-46_781.pdf

Oliva, E. J. D., & Atehortua Santamaria, R. (2025). Decoding solar adoption: A systematic review of theories and factors of photovoltaic technology adoption in households of developing countries. Sustainability, 17(12), Article 5494. Link to source: https://doi.org/10.3390/su17125494 

Ovaere, M., Bolinger, B., & Gillingham, K. (2020). The value of distributed solar: Evidence from a field experiment. Yale School of the Environment. 

Pehl, M., Arvesen, A., Humpenöder, F., Popp, A., Hertwich, E. G., & Luderer, G. (2017). Understanding future emissions from low-carbon power systems by integration of life-cycle assessment and integrated energy modelling. Nature Energy, 2(12), 939–945. Link to source: https://doi.org/10.1038/s41560-017-0032-9

Peters, I. M. (2025). Strategic global deployment of photovoltaic technology: Balancing economic capacity and decarbonization potential. Advances in Atmospheric Sciences, 42, 261–268. Link to source: https://doi.org/10.1007/s00376-024-4176-9

Philipps, S., & Warmuth, W. (2025). Photovoltaics report. Fraunhofer Institute for Solar Energy Systems and PSE Projects GmbH. Link to source: https://www.ise.fraunhofer.de/en/publications/studies/photovoltaics-report.html

Rahdan, P., Zeyen, E., Gallego-Castillo, C., & Victoria, M. (2024). Distributed photovoltaics provides key benefits for a highly renewable European energy system. Applied Energy, 360, Article 122721. Link to source: https://doi.org/10.1016/J.APENERGY.2024.122721

Ramasamy, V., Zuboy, J., Feldman, D., Narayanaswami, M., Woodhouse, M., & Margolis, R. (2025). Documenting 15 years of reductions in U.S. solar photovoltaic system costs (Report No. NREL/TP-7A40-92536). National Renewable Energy Laboratory. Link to source: https://docs.nrel.gov/docs/fy25osti/92536.pdf 

Roux, A., & Shanker, A. (2018). Net metering and PV self-consumption in emerging countries (Report IEA-PVPS T9-18:2018). International Energy Agency PVPS. Link to source: https://iea-pvps.org/wp-content/uploads/2020/01/T9_NetMeteringAndPVDevelopmentInEmergingCountries_EN_Report.pdf

Saha, S. K. (2025). Empowering rural South Asia: Off-grid solar PV, electricity accessibility, and sustainable agriculture. Applied Energy, 377, Article 124639. Link to source: https://doi.org/10.1016/j.apenergy.2024.124639 

Schlömer, S., Bruckner, T., Fulton, L., Hertwich, E., McKinnon, A., Perczyk, D., Roy, J., Schaeffer, R., Sims, R., Smith, P., & Wiser, R. (2014). Annex III: Technology-specific cost and performance parameters. In O. Edenhofer, R. Pichs-Madruga, Y. Sokona, E. Farahani, S. Kadner, K. Seyboth, A. Adler, I. Baum, S. Brunner, P. Eickemeier, B. Kriemann, J. Savolainen, S. Schlömer, C. von Stechow, T. Zwickel, & J. C. Minx (Eds.), Climate change 2014: Mitigation of climate change. Contribution of working group III to the fifth assessment report of the intergovernmental panel on climate change. Cambridge University Press. Link to source: https://www.ipcc.ch/site/assets/uploads/2018/02/ipcc_wg3_ar5_annex-iii.pdf 

Sengupta, M., Habte, A., Wilbert, S., Gueymard, C., Remund, J., Lorenz, E., van Sark, W., & Jensen, A. R. (2024). Best practices handbook for the collection and use of solar resource data for solar energy applications: Fourth edition 2024. International Energy Agency PVPS. Link to source: https://dx.doi.org/10.69766/ENEH5295

Sexton, S. E., Kirkpatrick, A. J., Harris, R., & Muller, N. Z. (2018). Heterogeneous environmental and grid benefits from rooftop solar and the costs of inefficient siting decisions (NBER Working Paper No. 25241). National Bureau of Economic Research. Link to source: https://www.nber.org/papers/w25241 

Shahsavari, A., & Akbari, M. (2018). Potential of solar energy in developing countries for reducing energy-related emissions. Renewable and Sustainable Energy Reviews, 90, 275–291. Link to source: https://doi.org/10.1016/J.RSER.2018.03.065

Shakeel, S. R., Yousaf, H., Irfan, M., & Rajala, A. (2023). Solar PV adoption at household level: Insights based on a systematic literature review. Energy Strategy Reviews, 50, Article 101178. Link to source: https://doi.org/10.1016/J.ESR.2023.101178

Smith, B. L., Sekar, A., Mirletz, H., Heath, G., & Margolis, R. (2024). An updated life cycle assessment of utility-scale solar photovoltaic systems installed in the United States (Report No. NREL/TP-7A40-87372). National Renewable Energy Laboratory. Link to source: https://www.nrel.gov/docs/fy24osti/87372.pdf

Solano, J. C., Brito, M. C., & Caamaño-Martín, E. (2018). Impact of fixed charges on the viability of self-consumption photovoltaics. Energy Policy, 122, 322–331. Link to source: https://doi.org/10.1016/J.ENPOL.2018.07.059

Soto, E. A., Andrea Hernandez-Guzman, A., Vizcarrondo-Ortega, A., McNealey, A., & Bosman, L. B. (2022). Solar energy implementation for health-care facilities in developing and underdeveloped countries: Overview, opportunities, and challenges. Energies, 15(22), Article 8602. Link to source: https://doi.org/10.3390/en15228602 

Sustainable Energy for All. (2024). Beyond gensets: Advancing the energy transition in Lagos State. Global Energy Alliance for People and Planet. Link to source: https://www.seforall.org/publications/beyond-gensets-advancing-the-energy-transition-in-lagos-state 

Tamimi, B., Canizares, C., & Bhattacharya, K. (2013). System stability impact of large-scale and distributed solar photovoltaic generation: The case of Ontario, Canada. IEEE Transactions on Sustainable Energy, 4(3), 680–688. Link to source: https://doi.org/10.1109/TSTE.2012.2235151

Tran, T. S., Vu, M. P., Pham, M.-H., Nguyen, P.-H., Nguyen, D.-T., Nguyen, D.-Q., Tran, A. T., & Dang, H.-A. (2023). Study on the impact of rooftop solar power systems on the low voltage distribution power grid: A case study in Ha Tinh province, Vietnam. Energy Reports, 10, 1151–1160. Link to source: https://doi.org/10.1016/J.EGYR.2023.07.048

Truitt, S., Elsworth, J., Williams, J., Keyser, D., Moe, A., Sullivan, J., & Wu, K. (2022). State-level employment projections for four clean energy technologies in 2025 and 2030 (Report No. NREL/TP-5500-81486). National Renewable Energy Laboratory. Link to source: https://www.nrel.gov/docs/fy22osti/81486.pdf

Ukoba, K., Yoro, K. O., Eterigho-Ikelegbe, O., Ibegbulam, C., & Jen, T. C. (2024). Adaptation of solar energy in the Global South: Prospects, challenges and opportunities. Heliyon, 10(7), Article e28009. Link to source: https://doi.org/10.1016/j.heliyon.2024.e28009 

U.S. Department of Energy. (n.d.). Photovoltaic cell and module design. Retrieved September 23, 2025, from Link to source: https://www.energy.gov/eere/solar/photovoltaic-cell-and-module-design 

Uzum, B., Onen, A., Hasanien, H. M., & Muyeen, S. M. (2021). Rooftop solar PV penetration impacts on distribution network and further growth factors—A comprehensive review. Electronics, 10(1), Article 55. Link to source: https://doi.org/10.3390/ELECTRONICS10010055

Vaishnav, P., Horner, N., & Azevedo, I. L. (2017). Was it worthwhile? Where have the benefits of rooftop solar photovoltaic generation exceeded the cost? Environmental Research Letters, 12(9), Article 094015. Link to source: https://iopscience.iop.org/article/10.1088/1748-9326/aa815e 

Venkatachalam, S. deve, Al Nadabi, A., Al Shukaili, A. A., Hinai, A. S. A., Shuaili, A. S. A., & Shukaili, I. said A. (2025). Performance and suitability analysis of rooftop solar PV in Oman: A case study of university branches. Heliyon, 11(4), Article e42578. Link to source: https://doi.org/10.1016/j.heliyon.2025.e42578

Wiser, R., Millstein, D., Mai, T., Macknick, J., Carpenter, A., Cohen, S., Cole, W., Frew, B., & Heath, G. (2016). The environmental and public health benefits of achieving high penetrations of solar energy in the United States. Energy, 113, 472–486. Link to source: https://doi.org/10.1016/j.energy.2016.07.068 

World Bank Group. (2024). Off-grid solar market trend report 2024. Link to source: https://www.esmap.org/sites/default/files/esmap-files/2024-Off-Grid-Solar-Market-Trends-Report.pdf

Yang, J., Li, X., Peng, W., Wagner, F., & Mauzerall, D. L. (2018). Climate, air quality and human health benefits of various solar photovoltaic deployment scenarios in China in 2030. Environmental Research Letters, 13(6), Article 064002. Link to source: https://doi.org/10.1088/1748-9326/aabe99 

Zhang, A. H., & Sirin, S. M. (2024). Overall review of distributed photovoltaic development in China: Process, dynamic, and theories. Global Sustainability, 7, Article e28. Link to source: https://doi.org/10.1017/SUS.2024.33

Zhang, Z., Chen, M., Zhong, T., Zhu, R., Qian, Z., Zhang, F., Yang, Y., Zhang, K., Santi, P., Wang, K., Pu, Y., Tian, L., Lü, G., & Yan, J. (2023). Carbon mitigation potential afforded by rooftop photovoltaic in China. Nature Communications, 14(1), Article 2347. Link to source: https://doi.org/10.1038/S41467-023-38079-3

Zhang, Z., Qian, Z., Chen, M., Zhu, R., Zhang, F., Zhong, T., Lin, J., Ning, L., Xie, W., Creutzig, F., Tang, W., Liu, L., Yang, J., Pu, Y., Cai, W., Pu, Y., Liu, D., Yang, H., Su, H., … Yan, J. (2025). Worldwide rooftop photovoltaic electricity generation may mitigate global warming. Nature Climate Change, 15(4), 393–402. Link to source: https://doi.org/10.1038/S41558-025-02276-3 

Credits

Lead Fellow

  • Michael Dioha, Ph.D.

Contributors

  • Ruthie Burrows, Ph.D.

  • James Gerber, Ph.D.

  • Daniel Jasper

  • Megan Matthews Ph.D.

  • Alex Sweeney

Internal Reviewers

  • Al-Amin Bugaje, Ph.D.

  • James Gerber, Ph.D.

  • Amanda D. Smith, Ph.D.

Effectiveness

Based on IEA World Energy Balances, global emissions from electricity generation accounted for an estimated 530 kg CO₂‑eq /MWh (540 kg CO₂‑eq /MWh, 20-yr basis; IEA, 2024a; see Methodology: Appendix A for calculation details). To convert from MWh to MW, we used the median global average capacity factor for distributed solar PV of 14% (Jacobson et al., 2017). Distributed solar PV is estimated to reduce emissions by 650 t CO₂‑eq /MW/yr (660 t CO₂‑eq /MW/yr, 20-yr basis; Table 1).

Table 1. Effectiveness at reducing emissions.

Unit: t CO₂‑eq /MW installed capacity/yr, 100-yr basis

Estimate 650
Left Text Column Width

We assumed that newly installed distributed solar PV displaces an equivalent MWh of the global electricity grid mix. We then assumed the reduction in emissions from additional distributed solar PV capacity was equal to emissions (per MWh) from the 2023 global electricity grid mix (IEA, 2024a). Since new distributed solar PV does not displace an equivalent MWh of the global grid mix, actual avoided emissions will depend on conditions of the local grid at a particular time and place, including the level of solar already deployed, regional solar radiation, and grid carbon intensity. As a result, our global effectiveness estimate may differ significantly from regional estimates. Studies in the United States show that for 2007–2015, avoided emissions from solar were approximately 0.5 t CO₂ /MWh (613 t CO₂ /MW/yr; Millstein et al., 2017), and a 15% increase in deployment avoided 8.54 Mt CO₂ /yr (Biswas et al., 2025). For regions that rely heavily on fossil-fuel generators for electricity generation, widespread adoption of distributed solar PV could cut emissions much more than estimated here (Sustainable Energy for All, 2024). 

Distributed solar PV systems have no operational emissions and low life-cycle GHG footprints. We excluded carbon payback time and embodied life-cycle emissions from manufacturing, transport, installation, and end-of-life processing in our estimates of effectiveness and climate impacts. Life-cycle emissions of rooftop solar PV systems were 25.5–42.9 g CO₂‑eq /kWh, depending on the module technology used (IEA-PVPS, 2022). This is significantly lower than fossil fuel–based electricity generation, which can exceed 1,000 g CO₂‑eq /kWh (Gibon et al., 2021).

Cost

We estimated a mean levelized cost of electricity (LCOE) for distributed solar PV of US$145/MWh based on two key industry reports (International Renewable Energy Agency [IRENA], 2020; IEA & NEA, 2020; see Methodology: Appendix A for details). LCOE values represent the average cost of producing one MWh of electricity over the operational lifetime of a power plant, allowing investors to compare their expected revenue to a standard set of costs. International agencies have used this cost metric to estimate total costs of power generation technologies, incorporating installed capital costs, operation and maintenance, project lifespan, and energy output.

While distributed solar PV generally carries a higher cost per MWh than utility-scale solar (IRENA, 2020), rapid declines in cost have been observed across rooftop and mini-grid markets. Residential rooftop PV systems, for instance, saw their average LCOE drop from US$0.301/kWh (US$301/MWh) in 2010 to US$0.063/kWh (US$63/MWh) in 2019 – a 79% reduction driven by falling module prices, better installation methods, and policy support (IRENA, 2020). Similarly, commercial-scale rooftop PV (≤500 kW) achieved its lowest country-level LCOEs – of US$0.062/kWh (US$62/MWh) in India, and US$0.064/kWh (US$64/MWh) in China – during the same period (IRENA, 2020).

Methods and Supporting Data

Learning Curve

Distributed solar PV exhibits a pronounced learning curve, most clearly reflected in the steady decline of solar module prices as global deployment expands. The median learning rate for PV modules is estimated at 34%, meaning module prices fall by roughly one-third with every doubling of installed capacity (Table 2). Significant economies of scale over the past decade have driven an even steeper learning rate of 42% (Masson et al., 2024). Similarly, a historical assessment (Philipps & Warmuth, 2025) found that module prices have decreased by 25.7% per doubling over the past 44 years, reinforcing the scale-driven cost reduction dynamics in the distributed solar market. Our estimated learning rate is based on trends of the past decade, while a longer historical estimate would reveal lower learning rates.

Table 2. Learning rate: drop in cost per doubling of the installed solution base, 2010–2023.

Unit: %

25th percentile 30
Mean 34
Median (50th percentile) 34
75th percentile 38
Left Text Column Width

Looking forward, the pace of module cost decline is expected to slow somewhat. According to the DNV 2024 Energy Transition Outlook (DNV, 2024), the current global learning rate for module costs is about 26%, but projections suggest this rate will slow to around 17% by 2050 as cost components stabilize and the largest gains from scaling are realized. 

In addition to modules, distributed solar PV costs are significantly influenced by BoS components, which include inverters, racking, labor, permitting, and customer acquisition. While these costs are more localized and less exposed to global manufacturing dynamics, they have also followed a learning trajectory. Elshurafa et al. (2018) analyzed BoS costs across more than 20 countries and found a global learning curve of 89%, corresponding to a BoS learning rate of 11%. This is lower than the module rate but nonetheless meaningful – especially in markets where soft costs dominate. 

In the United States, residential distributed solar PV system costs fell 76% between 2010 and 2024, while commercial rooftop PV system costs declined 84% during the same period (Ramasamy et al., 2025). These reductions reflect improvements in module efficiency, digital tools for system design and sales, streamlined installation, and, in some regions, lower permitting and inspection costs.

Still, challenges remain. In mature distributed markets such as the United States, costs other than hardware – such as labor, permitting, interconnection fees, and customer acquisition – continue to account for the majority of overall system prices (Barbose et al., 2023; Dong et al., 2023). 

Speed of Action

The term speed of action refers to how quickly a climate solution physically affects the atmosphere after it is deployed. This is separate from the speed of deployment, which is the pace at which solutions are adopted.

At Project Drawdown, we define the speed of action for each climate solution as emergency brake, gradual, and delayed.

Deploy Distributed Solar PV is a GRADUAL climate solution. It has a steady, linear impact on the atmosphere. As installed capacity of distributed solar PV increases over time, emissions from electricity generation are expected to decrease, assuming solar and other renewables displace fossil fuel sources.

Caveats

One limitation is our assumption that each additional MWh from distributed solar PV displaces an equivalent MWh from the grid. In practice, without net metering or export compensation, generation from distributed systems may not be fully recognized or integrated into the grid – meaning those MWh might not contribute to net electricity flows or emissions displacement. In such cases, any solar output not exported to the grid cannot contribute to grid-level emissions benefits. Owners of distributed solar PV systems are eligible to claim renewable energy certificates (RECs), but if they don’t do so, their utility may instead claim the RECs on their behalf without reducing emissions from their electricity generation. While RECs are used most widely in the United States, this additionality concern could impact any international energy market that also has tradable renewable energy certificates (NREL, 2015). 

Our definition of distributed solar PV includes both rooftop systems and mini-grids, many of which are coupled with battery storage. However, our aggregated analysis does not fully differentiate between these diverse configurations, nor does it account for their varying operational patterns, grid interactions, or backup roles. These differences are important but difficult to capture within the scope of this analysis. Consequently, the results presented should be interpreted as a high-level approximation rather than a detailed assessment of all distributed solar PV system types.

Distributed solar PV implementation comes with several limitations and uncertainties. One concern is whether new installations meaningfully reduce emissions. In regions where the electricity grid is already low-carbon or underused, adding distributed solar may have limited climate impact.

The long-term impact of distributed solar also depends on system reliability, maintenance, and policy stability. Poorly maintained systems may underperform and sudden policy changes – such as the removal of net metering or the elimination of tax credits – can reduce uptake (Gautier & Jacqmin, 2020; Leite et al., 2024; Venkatachalam et al., 2025). In many low-income regions specifically, high up-front costs, limited access to financing, and insufficient technical capacity can hinder large-scale adoption (Ukoba et al., 2024). Even when demand exists in these regions, supply chain limitations, lack of skilled labor, and inconsistent regulatory frameworks may slow progress.

Technical challenges also arise with increasing deployment. Variability in distributed solar PV generation can lead to voltage instability in distribution networks (Cook et al., 2018; Impram et al., 2020; Tamimi et al., 2013), especially when systems are not paired with smart inverters or batteries. Although emissions from manufacturing and disposal of solar PV panels are relatively lower than those from fossil fuel power, they are not zero. Another technical caveat is the growing concern of e-waste, particularly for off-grid and rural PV deployments. A recent prospective material flow analysis across 15 West African countries estimates that cumulative PV waste could reach 2.3 to 7.8 Mt by 2050, with about 70% originating from off-grid systems (Dong et al., 2025).

Current Adoption

We estimated current adoption of distributed solar PV based on IEA reports (IEA, 2023; Masson et al., 2024). As of 2023, the global installed capacity for distributed solar PV reached approximately 708,000 MW (Table 3). Although we used 2023 as our baseline for current adoption, an estimated additional 182,000 MW of distributed solar PV capacity was installed in 2024 – bringing the global total to more than 890,000 MW (IEA, 2023).

Table 3. Current adoption level, 2023.

Unit: MW installed capacity

25th percentile 702,000
Mean 708,000
Median (50th percentile) 708,000
75th percentile 715,000
Left Text Column Width

From 2011–2016, the global distributed solar PV market remained relatively stable, with annual installations ranging between 16 and 19 GW (Masson et al., 2024). This trend shifted significantly when China expanded its domestic distributed solar PV sector, implementing policy and infrastructure measures that nearly doubled market capacity between 2016 and 2018. By 2023, global distributed solar PV installations had reached 189.0 GW annually – up from 177.7 GW of new capacity added in 2022 (Masson et al., 2024). In recent years, many countries, particularly in Europe, have adopted collective and distributed self-consumption models as a new framework for residential and commercial electricity customers. This approach increases access to self-generated renewable electricity, even for consumers unable to install their own PV systems. 

Off-grid solar PV applications are expanding too, primarily driven by rural electrification efforts across Asia, Africa, and parts of South America (World Bank Group, 2024). In many remote areas, especially in Africa and Asia, off-grid and mini-grid systems with storage serve as viable alternatives to grid extension or as interim solutions before future grid connections. For further details, see the Geographic Guidance section.

Adoption Trend

Based on the IEA’s solar PV power capacity in the Net Zero Scenario (IEA, 2023), we calculated the global adoption trend by summing global adoption for each year 2015–2023 and taking the year-to-year difference. Comparing year-to-year global adoption, the median global adoption trend was adding 54,000 MW/yr of installed capacity, but expansion was unevenly distributed geographically (Table 4, Figure 2).

Figure 2. Global adoption of distributed solar PV, 2015–2023.

Source: International Energy Agency. (2023). Solar PV power capacity in the Net Zero Scenario, 2015-2030. License: CC BY 4.0

Enable Download
Off

Table 4. Adoption trend, 2015–2023.

Unit: MW installed capacity/yr

25th percentile 40,300
Mean 72,400
Median (50th percentile) 54,000
75th percentile 80,800
Left Text Column Width

Global distributed solar PV deployment more than sextupled between 2015 and 2023, growing from 116 GW to 695 GW of installed capacity (Figure 2; IEA, 2023). Growth in the mid-2010s was relatively moderate, with yearly additions rising gradually from 19 GW in 2016 to 45 GW by 2019. However, a notable acceleration began after 2020. Annual capacity additions jumped from 63 GW in 2020 to 192 GW in 2023 – more than tripling in just three years (IEA, 2023). This surge reflects growing policy support, cost declines, and higher demand for behind-the-meter solar solutions. The rolling trendline since 2015 now averages 72 GW/yr, nearly double the average before 2020. This trend is likely to continue as distributed solar PV continues to gain ground in both developed and emerging markets.

Adoption Ceiling

For this analysis, we adopt a global median estimate of 17.4 million MW installed capacity as the adoption ceiling for distributed solar PV (Table 5). The adoption ceiling for distributed solar PV is determined by the global technical potential of rooftop surfaces, parking structures, and other built environments suitable for solar PV deployment. Unlike utility-scale systems that require dedicated land, distributed solar PV leverages existing infrastructure – primarily the rooftops of residential, commercial, and government buildings.

Estimates of the technical potential for distributed solar PV vary considerably across the literature, reflecting differences in study period, system types included, and methodological approaches. Despite these variations, recent global assessments converge on the view that rooftop and other distributed solar PV systems offer substantial potential, though they are constrained by surface area availability and system efficiencies. A meta-analysis by de La Beaumelle et al. (2023) reported rooftop solar PV technical potential ranging from 6 PWh/yr to 69 PWh/yr, with a median of 15.8 PWh/yr and an average of 21.1 PWh/yr (de La Beaumelle et al., 2023). Another study estimated the global net energy potential from rooftop PV at 7.81 PWh/yr for residential rooftops and 8.02 PWh/yr for commercial rooftops. Similarly, Deng et al. (2015) estimated the global technical potential of rooftop PV systems at 33.6 PWh/yr, with an additional 25 PWh/yr from building facades (Deng et al., 2015), while Joshi et al. (2021) identified approximately 0.2 million km2 of suitable rooftop area from 130 million km2 of global land surface, corresponding to an estimated electricity generation potential of 27 PWh/yr (Joshi et al., 2021).

Key constraints to distributed solar PV adoption include rooftop suitability (such as shading, tilt, and orientation), grid integration, permitting hurdles, and up-front costs (Sengupta et al., 2024; Masson et al., 2025). While these barriers may limit near-term deployment, innovations like building-integrated photovoltaics, virtual net metering, and smart inverters offer pathways to expand deployment.

Table 5. Adoption ceiling: upper limit for adoption.

Unit: MW installed capacity

25th percentile 12,400,000
Mean 23,400,000
Median (50th percentile) 17,400,000
75th percentile 28,500,000
Left Text Column Width
Achievable Adoption

The IEA’s World Energy Outlook (WEO) 2024 presented several scenarios that explored future energy pathways under different assumptions about policies, technologies, and markets (IEA, 2024b). For this analysis, we defined the adoption achievable range for distributed solar PV based on the Stated Policies Scenario (STEPS) and the Announced Pledges Scenario (APS) (IEA, 2024b). However, the WEO does not explicitly distinguish between distributed and utility-scale solar PV in its projections. To bridge this gap, we conducted a simple linear projection using historical deployment trends to estimate the likely share of distributed solar PV within total solar PV capacity. Our analysis suggests that by 2050, distributed solar PV could represent approximately 26% of all solar PV deployment. This finding is consistent with IRENA’s REmap analysis, which projects that utility-scale systems will account for 60–80% of global solar PV capacity by mid-century (IRENA, 2019). Accordingly, for our study we assume that 26% of the IEA’s projected solar PV deployment in 2050 will come from distributed solar PV systems. This provides a reasonable basis for estimating achievable adoption, while aligning with both historical patterns and complementary international assessments.

Achievable – Low

The low achievable adoption level is based on STEPS, which reflects the current trajectory of distributed solar PV expansion under existing and announced policies. In this scenario, assuming distributed solar PV projects account for 26% of total solar PV capacity, global capacity is projected to grow about sixfold, from 708,000 MW in 2023 to approximately 4.30 million MW by 2050 (Table 6). This corresponds to an average compound annual growth rate (CAGR) of 7.3%.

Table 6. Range of achievable adoption levels.

 Unit: MW installed capacity

Current adoption 708,000
Achievable – low 4,300,000
Achievable – high 5,300,000
Adoption Ceiling 17,400,000
Left Text Column Width

Achievable – High

The high achievable adoption level is based on APS, which assumes the same policy framework as STEPS, plus full realization of announced national energy and climate targets, including net-zero commitments supported by stronger clean energy investments. Under this scenario, distributed solar PV capacity is projected to increase approximately sevenfold from 708,000 MW in 2023 to approximately 5.30 million MW by 2050 (Table 6), requiring a CAGR of 8% over the same period.

Using our adoption ceiling of 17.4 million MW, the current adoption of distributed solar PV constitutes approximately 4.1% of its technical potential. The achievable adoption range, as calculated, is 24.8–30.3% of this potential.

Based on baseline global adoption and effectiveness, we estimated the current total climate impact of distributed solar PV to be approximately 0.46 Gt CO₂‑eq (0.47 Gt CO₂‑eq , 20-yr basis) of reduced emissions per year (Table 7). We estimated future climate impacts using the emissions from the 2023 baseline electricity grid; actual emissions reductions could differ depending on how the emissions intensity of electricity generation changes over time. 

Table 7. Climate impact at different levels of adoption.

Unit: Gt CO₂‑eq/yr, 100-yr basis

Current adoption 0.46
Achievable – low 2.8
Achievable – high 3.5
Adoption Ceiling 11
Left Text Column Width

Climate impacts are highly uncertain. They will vary depending on actual emissions intensity, as well as future development of electricity grids, markets and policies, and enabling technologies, like batteries. As solar and other renewables grow to represent an increasingly high percentage of power generation sources, grid emissions are expected to decrease (DNV, 2024; IEA, 2024b), so the climate impacts presented here are likely overestimates. Additionally, in regions with significant solar radiation where utility-scale solar PV is competitive, increased adoption of distributed solar PV could displace utility-scale PV without reducing emissions (Bistline & Watten, 2025). Assuming the existing and announced policies of countries around the world for distributed solar PV installation are backed with adequate provisions for implementation, global adoption could reach 4 million MW by 2050 – resulting in an increased emissions reduction of approximately 2.8 Gt CO₂‑eq/yr (2.9 Gt CO₂‑eq/yr, 20-yr basis). Assuming full realization of all national energy and climate targets (including net-zero commitments) with the support of stronger clean energy investments, distributed solar PV adoption could reach 5 million MW by 2050, which would lead to an estimated 3.5 Gt CO₂‑eq/yr (3.5 Gt CO₂‑eq/yr, 20-yr basis) of reduced emissions. 

We based the adoption ceiling solely on the technical potential of distributed solar PV, while neglecting social and economic constraints and realistic scenarios of future power demand (Dioha et al., 2025). Distributed solar PV installed capacity is unlikely to reach 17 million MW, but if current grid emissions remained constant while capacity increased, GHG emission reductions would be approximately 11 Gt CO₂‑eq/yr (11 Gt CO₂‑eq/yr, 20-yr basis). This maximum is unrealistic as a forward-looking climate impact because it treats grid carbon intensity as permanently fixed at 2023 levels and ignores future decarbonization and corresponding decreases in marginal avoided emissions.

Additional Benefits

Extreme Weather Events

Rooftop PV systems and mini-grids have the potential to supply electricity when the grid is unstable, improving resilience during or after extreme weather events (Galvan et al., 2020; NREL, 2014).

Income and Work

Solar PV can have a positive effect on the economy because it accounts for 44% of renewable energy jobs globally and is the fastest-growing sector of renewable energy employment (IRENA, 2024). In the United States as of 2021, solar PV employed about 250,000 full-time workers, mainly in the installation, project development, and manufacturing sectors (Gadzanku et al., 2023). The National Renewable Energy Laboratory (NREL) projected that about 509,000–757,000 jobs for both utility- and distributed-scale solar PV will be added by 2030 in the United States (Truitt et al., 2022).

Factors such as local policies that allow for net metering, tax credits, weather, and the price of electricity can determine individual cost benefits and payback periods of distributed solar (Sexton et al., 2018; Vaishnav et al., 2017). After the initial investment, consumers see savings in their monthly electricity bills (NREL, 2018).

Distributed solar PV can provide access to electricity in rural areas of low- and middle-income countries (Kumar et al., 2019). Enhanced access to electricity in these countries can foster economic development of agricultural communities and increase farmer incomes (Candelise et al., 2021; Saha, 2025).

Food Security

Improved electricity access through distributed solar PV can also enhance food production and ensure resilience of agricultural systems in low- and middle-income countries (Ukoba et al., 2024). Improved electricity access strengthens food security by providing refrigeration for perishable food, ensuring higher food quality, and reducing food loss (Candelise et al., 2021; Ukoba et al., 2024).

Energy Availability

Distributed solar PV can provide electricity to households and communities where expanding grid electricity would prove too expensive or physically inaccessible (Kannan & Vakeesan, 2016; Kumar et al., 2019; Maka & Alabid, 2022). Using distributed mini-grids as a source of electricity is especially applicable to low- and middle-income countries with abundant solar resources (Maka & Alabid, 2022). For example, distributed rooftop solar has been an important source of electricity access in Bangladesh, where rooftop PV systems provide electricity to about 12% of the population (Kumar et al., 2019).

Health

Improvements in air quality offer health benefits from reduced air pollution exposure, including reduced premature mortality. The magnitude and distribution of these benefits depend on the local electricity grid mix, the fuels used to generate electricity, and atmospheric conditions that determine how far pollutants travel from emission sources (Buonocore et al., 2019). Regions with a higher proportion of coal-powered electricity generation will often see more health benefits (Buonocore et al., 2019). These health benefits often translate into cost savings associated with reductions in hospital admissions, improved respiratory and cardiovascular conditions, and work and school days that might have otherwise been missed due to illness (Millstein et al., 2017; Wiser et al., 2016). A study of the health benefits of distributed solar PV in eastern China found that reductions in air pollution were linked to a 1.2% decrease in air pollution–related premature mortality (Yang et al., 2018). Distributed solar PV can provide electricity to power electric cookstoves, which can reduce morbidities linked to poor indoor air quality (Jhunjhunwala & Kaur, 2018).

Increasing energy availability through distributed solar PV has important implications for health-care delivery in rural communities in low- and middle-income countries. By providing electricity access to health clinics located in hard-to-reach areas, mini-grid or rooftop PV systems can improve health services (Maka & Alabid, 2022; Soto et al., 2022; Ukoba et al., 2024). Electricity is essential for health-care services such as lighting during procedures, refrigeration of vaccines, sterilization of devices, and medical imaging, which can impact infection rates, neonatal mortality, and surgical outcomes (Soto et al., 2022). PV systems can deliver stable electricity to health clinics in low- and middle-income countries, which often experience power outages due to grid instability or natural disasters (Soto et al., 2022). 

Air Quality

Solar PV reduces air pollutants released from fossil-fuel energy generation, thereby avoiding the emission of pollutants such as nitrogen oxides, sulfur dioxide, and PM2.5 associated with burning coal and natural gas (Abel et al., 2018; Millstein et al., 2024; Millstein et al., 2017; Wiser et al., 2016). The amount and type of air pollutants avoided will vary regionally depending on the fossil fuel type that PV displaces (Gallagher & Holloway, 2020). For example, since coal has different emissions than gas, regions with higher levels of coal-powered electricity will experience different air quality benefits than regions with more gas-powered electricity (Millstein et al., 2017). Pollutants can be transported for long distances depending on meteorological conditions, so air pollution benefits can be widespread (Millstein et al., 2024).

Risks

A significant risk of implementing distributed solar PV involves changes or instability in policy, especially pertaining to compensation schemes such as net metering and feed‑in tariffs. The economic viability of rooftop solar systems often hinges on favorable tariff or compensation rules; when these policies are reduced or withdrawn, investment returns drop markedly. For example, a 2018 report from IEA‑PVPS shows that many emerging economies have laws enabling net metering, but suffer from delays in implementation or weak compensation levels, which limit residential uptake of rooftop PV systems under self‑consumption policies (Roux & Shanker, 2018).

Another risk is the structure of electricity rates and fixed charges. A study of the impact of fixed charges on the viability of self‑consumption found that high fixed or volumetric charges in retail tariffs can dramatically reduce the financial benefit of self‑consumed PV generation, particularly when surplus PV electricity exported to the grid receives little or no compensation (Solano et al., 2018). These risks combine to lower the real output and emissions reduction potential of distributed PV. When policies incentivize self-consumption rather than exporting electricity to the grid, a greater proportion of the PV-generated electricity is used; however, policies that reduce the financial benefit of PV generation can stymie adoption.

Interactions with Other Solutions

Reinforcing

Increased availability of renewable energy from distributed solar PV helps reduce emissions from the electricity grid as a whole. Reduced emissions from the electricity grid leads to lower downstream emissions for solutions that rely on electricity use from the grid. Deploying distributed solar PV also supports increased integration of offshore and onshore wind turbines by diversifying the renewable energy mix, and can alleviate reliability challenges associated with variability in wind alone. Increasing deployment of variable renewable sources like solar PV can also drive procurement of firm baseload power in the form of geothermal and hydropower sources.

Electrification of transportation will be more beneficial in reducing global emissions if the underlying electricity generation mix includes a higher proportion of non-emitting power sources. 

Competing

Distributed solar PV can compete with utility-scale solar PV, agrivoltaics, and wind energy for policy attention, subsidies, and grid access. Additionally, when many distributed solar PV systems are installed, they generate power during the day when the sun is shining. This can lower electricity prices at those times because solar power is cheap to produce. As a result, utility-scale solar PV and agrivoltaic power plants can earn less money from selling electricity.

Dashboard

Solution Basics

MW installed capacity

t CO₂-eq (100-yr)/unit/yr
650
units
Current 708,000 04.3×10⁶5.3×10⁶
Achievable (Low to High)

Climate Impact

Gt CO₂-eq (100-yr)/yr
Current 0.46 2.83.5
Gradual

CO₂ , CH₄, N₂O, BC

Trade-offs

Implementing distributed solar PV involves several trade-offs. Embodied emissions from module manufacturing, transport, installation, and decommissioning are estimated at 10–36 g CO₂‑eq /kWh or approximately 2–8% of typical grid electricity emissions (~530 g CO₂‑eq /kWh), which implies over 90% net savings per kWh generated (Schlömer et al., 2014; Smith et al., 2024). Manufacturing using coal-intensive grids increases embodied emissions, highlighting the necessity of decarbonizing supply chains (Gan et al., 2023; Pehl et al., 2017). These emissions could reduce the net climate benefit, especially when displacing grid electricity from other renewables. 

The temporal variability of solar energy also creates trade-offs. When demand peaks in evening hours, non-solar energy sources ramp up generation, which could lead to increases in marginal emissions (Gagnon & O’Shaughnessy, 2024). In regions with high solar deployment, increased adoption of distributed solar PV could displace utility-scale solar generation, since both operate diurnally, resulting in no net reduction in grid emissions (Bistline & Watten, 2025). However, adoption of distributed solar can be very beneficial in low- and middle-income countries, as well as in places where utility-scale projects face interconnection constraints, permitting issues, or other challenges that limit adoption (Zhang et al., 2025). 

Another trade-off arises when limited rooftop space is used for PV infrastructure instead of alternative uses, such as cool or green roofs, or cooling/HVAC systems, which could offer thermal insulation or carbon sequestration benefits (Cubi et al., 2016; Kazemian & Xiang, 2025). 

kWh/m2/yr
5502400

Annual global horizontal irradiance (GHI)

Global horizontal irradiance (GHI) measures the intensity (energy per area per year) of all solar radiant energy on a horizontal surface. GHI limits the power output of fixed solar PV systems; however, panels can capture additional solar energy if tracking systems are incorporated. Here we show annual GHI averaged over the decade ending in 2025.

Copernicus Climate Change Service. (2022). ERA5-Land monthly averaged data from 1950 to present [Data set]. Copernicus Climate Change Service (C3S) Climate Data Store (CDS). Retrieved May 4, 2026, from Link to source: https://doi.org/10.24381/cds.adbb2d47

kWh/m2/yr
5502400

Annual global horizontal irradiance (GHI)

Global horizontal irradiance (GHI) measures the intensity (energy per area per year) of all solar radiant energy on a horizontal surface. GHI limits the power output of fixed solar PV systems; however, panels can capture additional solar energy if tracking systems are incorporated. Here we show annual GHI averaged over the decade ending in 2025.

Copernicus Climate Change Service. (2022). ERA5-Land monthly averaged data from 1950 to present [Data set]. Copernicus Climate Change Service (C3S) Climate Data Store (CDS). Retrieved May 4, 2026, from Link to source: https://doi.org/10.24381/cds.adbb2d47

Maps Introduction

High-income countries such as China, Germany, and the United States are the global leaders in installed distributed solar PV capacity (Masson et al., 2024). Commercial, residential, and off-grid distributed PV systems accounted for less than half (44%) of the 2023 global PV market, but distributed deployment drove market growth in many countries, including Germany, Brazil, Italy, and Australia (Masson et al., 2024). In urban areas, consumers in multi-family buildings can benefit from increased solar PV adoption through expansion of rooftop PV or other types of  building and infrastructure integration. Mini-grids and other distributed PV systems are used to electrify areas with damaged infrastructure rather than repairing or expanding distribution networks with successful implementation in Australia (Masson et al., 2024). 

In contrast, low-income countries possess significant untapped potential for distributed solar PV, but face considerable barriers related to financing and policy (Mahn et al., 2024; Shahsavari & Akbari, 2018). In emerging markets, developing robust support mechanisms and infrastructure for distributed solar PV can encourage regional grid expansion or bypass the need for grid access altogether (Masson et al., 2024). In many regions with ample solar radiation, deployment of distributed solar PV lags significantly behind its potential. 

Countries in sub-Saharan Africa have the potential to yield substantial carbon reduction impact from solar PV installation. Capital investments in these markets could yield up to nine times the GHG emission reduction than equivalent investments in more mature markets (Peters, 2025). However, solar PV competitiveness is stifled by limited access to capital, lack of technical talent, and persistent fossil-fuel subsidies (Sustainable Energy for All, 2024). Microgrids and off-grid systems are essential for improved electricity access in sub-Saharan Africa, South Asia, and parts of Latin America (World Bank Group, 2024). These systems expand the functional ceiling of distributed solar PV beyond rooftops, contributing to broader electrification and decarbonization goals. Off-grid residential and commercial systems are ideal for low-power electricity needs, such as lighting, water pumping, navigation, telecommunications, and vaccine refrigeration – especially in rural areas, on remote islands, and in other regions that depend on diesel generators or lack electricity grid access (Masson et al., 2024). 

Regional markets show significant cost variation. A 2024 study estimated the LCOE of rooftop solar PV in Saudi Arabia at just US$0.0445/kWh (US$44.5/MWh) under favorable solar and financing conditions (Al-Hanoot et al., 2024). According to Lazard (2024), U.S. residential rooftop PV has an LCOE of US$122–284/MWh, reflecting smaller system sizes, high soft costs, and site-specific variability. Community and Commercial & Industrial (C&I) rooftop solar PV in the United States has a lower LCOE range of US$54–191/MWh owing to economies of scale, streamlined permitting, and more consistent operating conditions. 

Labor costs, permitting complexity, market maturity, and scale of deployment influence the pace and depth of cost reductions globally (Masson et al., 2024; Ukoba et al., 2024). In regions where fossil-fuel subsidies keep retail electricity prices artificially low, cheap electricity from the local grid makes distributed solar PV less attractive to consumers (Masson et al., 2024). While distributed solar PV can lower electricity costs for system owners, the impact of increased distributed solar PV on retail electricity prices for all consumers is highly context-dependent and influenced by multiple factors, including local transmission and distribution network capacities, electrification rates, policy design, and the other energy sources available at a specific time (Borenstein, 2024; Perez-Arriaga et al., 2016). 

Action Word
Deploy
Solution Title
Distributed Solar PV
Classification
Highly Recommended

Lawmakers and Policymakers

  • Set ambitious long-term renewable energy goals and incorporate them into national climate plans and multilateral agreements; design national electrification guidelines for technicians to enable renewable energy goals.
  • Ensure regulatory frameworks around solar are strong and enforced, while also being accessible and timely; coordinate solar power policies horizontally (e.g., across agencies) and vertically (e.g., across subnational, national, and international efforts); seek to align social and environmental safeguards and streamline permitting processes.
  • Streamline regulations such as permitting for renewable energy projects, including both distributed solar and mini-grids; standardize documents for regular engagements, such as templates for power purchase agreements.
  • Provide incentives to consumers, such as subsidies (especially to reduce up-front cost), feed-in tariffs, tax credits, grants, waived grid connection fees, and forgivable or concessional loans; simultaneously allow for grid injections and net-metering schemes; ensure policies and incentives are long term and will remain stable for at least five years; use similar financial incentives for supporting equipment manufacturers, such as those that produce batteries and inverters.
  • Offer incentives such as subsidies and tax credits to manufacturers, operators, developers, and other relevant actors; as the market matures and becomes competitive, gradually reduce these incentives to create long-term market stability.
  • Develop building codes and regulations to incentivize efficiency and self-consumption of PV-generated electricity, especially among new construction; require PV-ready buildings and infrastructure.
  • Implement carbon taxes and remove subsidies from fossil-fuel infrastructure; redirect those funds into renewable energy financing.
  • Implement or strengthen renewable portfolio standards, clean energy standards, or other similar policy mechanisms with carve-outs for distributed solar.
  • Consider using green bonds to finance mini-grids and/or de-risk markets.
  • Invest in and subsidize improvements to grid integration and flexibility, storage, and infrastructure to manage variable generation; deploy smart-grid technologies.
  • Work with industry to diversify supply chains; design incentives and policies to stimulate local or regional production and advance R&D for solar and related equipment such as batteries.
  • Earmark a percentage of financial incentives for low- and middle-income communities and/or countries; if relevant, provide technology transfers and capacity building in low- and middle-income countries.
  • Improve labor- and human-rights laws and standards around solar PV supply chains; enforce standards within industry – particularly for the extraction and use of critical minerals and panel manufacturing.
  • Ensure regulations allow for a variety of development models, such as build-own-operate, public-private partnerships, utility models, energy communities, and cooperatives.
  • Ensure strong quality control requirements for all stages of deployment, including resource extraction, manufacturing, installation, maintenance, and end-of-life service; create certification programs for each stage of the process.
  • Require or encourage manufacturers to provide minimum warranties; establish an independent grievance system to resolve customer disputes and help foster trust in the industry.
  • To the extent possible, regulate and standardize distributed panel components with the aim of facilitating self-installation and ensuring safety. 
  • Work with the private sector to develop workforce training programs; ensure capacity development for all stages of deployment, including end-of-life services; create certifications for the full spectrum of roles.
  • Ensure strong regulations are in place for end-of-life services; enact Extended Producer Responsibility (EPR) for manufacturers; work with industry to foster a market for used, refurbished, and recycled panels.
  • Join, create, or participate in public-private partnerships dedicated to de-risking markets, deployment, technology transfers, education, and other relevant areas.
  • Establish one-stop-shop educational programs that use online and in-person methods to educate industry and the public on regulations, benefits of solar, best practices for development, and other relevant information; ensure the material is both appropriate and sufficient for local contexts, paying particularly close attention to language barriers. 

Further information:

Practitioners

  • Conduct careful planning for installation, ensuring that panel tilt, maintenance, and shading are evaluated based on local climatic conditions and are accounted for properly.
  • Conduct regular maintenance and cleaning to enhance cost efficiency and energy savings, especially in arid climates.
  • Utilize geospatial and satellite data to gather information on landscape, market dynamics, and initial customer base.
  • When cost-effective, employ building-integrated photovoltaics, net metering/billing, batteries, and smart inverters.
  • Utilize pay-as-you-go, energy-as-a-service, and other financial models that offset high up-front costs for residential and off-grid customers.
  • Take advantage of government incentives such as subsidies, feed-in tariffs, auctions, tax credits, and contracts for difference; as the market matures and becomes competitive, seek to gradually reduce reliance on these incentives to create long-term market stability.
  • Offer periodic site visits and maintenance services; facilitate reselling of PV systems on the secondhand market.
  • Design distributed solar PV and mini-grid systems to be compatible with the main grid, even in areas far from the main grid, so as to allow for future connection. 
  • Consider providing feed-in tariffs or other financial incentives if they are not provided by the government; consider lease-to-own models.
  • Investigate using green bonds to finance public projects and mini-grids, or to de-risk markets.
  • Work with regulators and other industry leaders to standardize distributed panel components with the aim of facilitating self-installation and ensuring safety. 
  • Invest in strengthening grid integration and improving flexibility through expanded energy storage, upgraded infrastructure, and deployment of smart grid technologies to effectively manage variable renewable generation.
  • Reduce soft costs of customer acquisition with prediction models that use machine learning classifiers like XGBoost, which are trained on widely available socioeconomic data to identify households likely to adopt PV.
  • When developing mini-grids, work directly with the community as well as nonprofits and relevant businesses (such as appliance retailers) to help educate the community on the mini-grid’s capabilities and how to choose suitable appliances.
  • Work with the public sector to diversify supply chains; take advantage of incentives and policies that stimulate local or regional production and advance R&D.
  • Ensure supply chains comply with international labor and human rights laws and standards, particularly for the extraction of critical minerals, and panel manufacturing.
  • Seek to decarbonize the full life cycle – including supply chains, production, installation, recycling, and disposal – as much as possible.
  • Ensure strong quality control for all stages of deployment, including resource extraction, manufacturing, installation, maintenance, and end-of-life service.
  • Work with the public sector and private organizations to develop workforce training programs; ensure capacity development for all stages of deployment, including end-of-life services.
  • Adhere to regulations regarding end-of-life servicing; adopt extended producer responsibility and high-integrity end-of-life servicing standards if no policy framework exists.
  • Invest directly into, and help develop, recycling infrastructure for solar panels.
  • Participate in voluntary agreements with government bodies to increase policy support for solar capacity and power generation.
  • Stay abreast of, and engage with, changing policies, regulations, zoning laws, tax incentives, and related developments to help remove commercial barriers.
  • Join, create, or participate in public-private partnerships dedicated to deployment, technology transfers, education, de-risking markets, and other relevant areas.

Further information:

Business Leaders

  • Set ambitious long-term renewable energy goals and incorporate them into corporate net-zero strategies.
  • Install distributed solar panels when possible, focusing on available rooftops and parking lots.
  • Support long-term, stable contracts (e.g., Purchase Power Agreements) that de-risk investment in solar technologies and incentivize local supply chain development.
  • Take advantage of government incentives such as tax credits, if possible; seek to gradually reduce reliance on these incentives to create long-term market stability.
  • Invest in companies that produce, deploy, or provide end-of-life servicing for solar panels; seek to diversify and localize supply chains.
  • Invest in R&D and related technology, such as batteries.
  • Support workforce development programs, offer employee scholarships, and/or sponsor training for careers in solar power; ensure capacity development for all stages of deployment, including end-of-life services.
  • Offer pro bono business advice or general support for community solar projects, such as community-shared and cooperative business models.
  • Join, create, or participate in public-private partnerships dedicated to deployment, technology transfers, education, de-risking markets, and other relevant areas.

Further information:

Nonprofit Leaders

  • Install distributed solar panels when possible, focusing on available rooftops and parking lots.
  • Advocate for ambitious long-term national goals on solar and renewable energy; advocate to incorporate them into national climate plans and multilateral agreements; request national electrification guidelines for technicians.
  • Operate or help with equipment testing and certification systems, market information disclosures, and onsite supervision.
  • Conduct open-access research to improve the performance of solar PVs, forecasting, and related technologies.
  • Work with industry and government officials to help develop regulations and standards for distributed panel components, with the aim of facilitating self-installation and ensuring safety. 
  • Advocate for strong regulatory frameworks that are also accessible and timely; recommend coordinated solar power policies, both horizontally (e.g., across agencies) and vertically (e.g., across subnational, national, and international efforts); help align social and environmental safeguards and a streamlined permitting processes.
  • Call for government incentives for consumers such as subsidies (especially to reduce up-front cost), feed-in tariffs, tax credits, grants, waived grid connection fees, and forgivable or concessional loans; help ensure regulations allow for grid injections and net-metering schemes; advocate for long-term policies and incentives that will remain stable for at least five years; call for similar financial incentives for supporting equipment manufacturers, such as those that produce batteries and inverters.
  • Urge governments to provide incentives – such as subsidies, feed-in tariffs, auctions, tax credits, and contracts for difference – to manufacturers, operators, developers, and other relevant actors; recommend gradual reductions of these incentives to create long-term market stability.
  • Campaign for public investments in improvements to grid integration and flexibility, storage, and infrastructure to manage variable generation.
  • Call for a percentage of public financing to be earmarked for low- and middle-income communities and/or countries.
  • Help improve enforcement of labor and human rights laws and standards around solar PV supply chains – particularly for the extraction and use of critical minerals.
  • Help create or support community solar projects using a variety of models, such as build-own-operate, public-private partnerships, utility models, energy communities, and cooperatives.
  • Create resources and/or standards to improve quality control for all stages of deployment, including resource extraction, manufacturing, installation, maintenance, and end-of-life service; create and/or administer certification programs for each stage of the process.
  • Work with the public and private sectors to develop workforce training programs; ensure capacity development for all stages of deployment, including end-of-life services.
  • Urge governments and industry to adopt strong regulations for end-of-life services; call for extended producer responsibility; work with industry to foster a market for used, refurbished, or recycled panels.
  • Advocate for carbon taxes and the removal of subsidies from fossil-fuel infrastructure; recommend those funds be redirected into renewable energy.
  • Join, create, or participate in public-private partnerships dedicated to deployment, technology transfers, education, de-risking markets, and other relevant areas.
  • Establish one-stop-shop educational programs that use online and in-person methods to educate industry and the public on regulations, benefits of solar, best practices for development, and other relevant information; ensure the material is sufficient and appropriate for local contexts, paying particularly close attention to language barriers. 

Further information:

Investors

  • Offer low-interest loans and concessional financing for manufacturers, customers, developers, operators, and recyclers.
  • Invest directly in the development of mini-grid projects.
  • Invest in companies that produce, deploy, or provide end-of-life servicing for solar panels; seek to diversify and localize supply chains.
  • Invest in supporting infrastructures such as utility companies, grid development, and access roads.
  • Invest in green bonds and/or explore blended finance structures to mobilize capital for companies developing solar energy or supporting infrastructure.
  • Invest in the recycling infrastructure for solar panels and circular supply chains.
  • Invest in R&D, component technology, and related equipment, such as batteries.
  • Help de-risk energy transitions in low- and middle-income countries by offering low-interest loans, concessional financing, and/or, favorable terms.
  • Align investments with existing public-private partnerships, voluntary agreements, or voluntary guidance that may apply in the location of the investment.

Further information:

Philanthropists and International Aid Agencies

  • Provide catalytic financing for or help develop, distributed solar PV projects and mini-grids.
  • Award grants to enhance grid integration, flexibility, and reliability by supporting innovations in energy storage systems, advanced grid management, transmission infrastructure, and traditional infrastructure (such as access roads) that enable effective integration of solar PV generation.
  • Work with other philanthropies, investors, and implementers to develop standardized reporting mechanisms and create monitoring and evaluation frameworks.
  • Allow for extended program timelines to allow for mini-grid sector development and cost recovery. 
  • Support the development of component technology and related equipment, such as batteries.
  • Award grants to improve recycling infrastructure for solar panels, and build circular supply chains.
  • Facilitate partnerships to share solar technology and best practices between established and emerging markets, promoting energy equity and access.
  • Foster cooperation and technology transfer between low- and middle-income countries with emerging solar sectors.
  • Advocate for ambitious long-term national goals on solar and renewable energy; advocate to incorporate them into national climate plans and multilateral agreements; request national electrification guidelines for technicians.
  • Operate, fund, or support equipment testing and certification systems, and market information disclosures.
  • Conduct open-access research to improve the performance of solar PVs, forecasting, and related technologies.
  • Work with industry and government officials to help develop regulations and standards for distributed panel components, with the aim of facilitating self-installation and ensuring safety. 
  • Advocate for strong regulatory frameworks that are also accessible and timely; recommend coordinated solar power policies, both horizontally (e.g., across agencies) and vertically (e.g., across subnational, national, and international efforts); help align social and environmental safeguards and a streamlined permitting processes.
  • Advocate for a percentage of public financing to be earmarked for low- and middle-income communities and/or countries.
  • Help improve enforcement of labor and human-rights laws and standards around solar PV supply chains – particularly for the extraction and use of critical minerals.
  • Help create or support community solar projects using a variety of models, such as build-own-operate, public-private partnerships, utility models, energy communities, and cooperatives.
  • Create resources and/or standards to improve quality control for all stages of deployment, including resource extraction, manufacturing, installation, maintenance, and end-of-life service; create and/or administer certification programs for each stage of the process.
  • Work with the public and private sectors to develop workforce training programs; ensure capacity development for all stages of deployment, including end-of-life services.
  • Urge governments and industry to adopt strong regulations for end-of-life services; call for extended producer responsibility; work with industry to foster a market for used, refurbished, or recycled panels.
  • Join, create, or participate in public-private partnerships dedicated to deployment, technology transfers, education, de-risking markets, and other relevant areas.
  • Establish one-stop-shop educational programs that use online and in-person methods to educate industry and the public on regulations, benefits of solar, best practices for development, and other relevant information; ensure the material is sufficient and appropriate for local contexts, paying particularly close attention to language barriers.

Further information:

Thought Leaders

  • Install solar panels at home, at the office, and/or at other properties; share your experience and tips with neighbors and the broader community.
  • Advocate for ambitious long-term national goals on solar and renewable energy; advocate to incorporate them into national climate plans and multilateral agreements; request national electrification guidelines for technicians.
  • Operate or help with equipment testing and certification systems, market information disclosures, and onsite supervision.
  • Conduct open-access research to improve the performance of solar PVs, forecasting, and related technologies.
  • Work with industry and government officials to help develop regulations and standards for distributed panel components, with the aim of facilitating self-installation and ensuring safety. 
  • Advocate for strong regulatory frameworks that are also accessible and timely; recommend coordinated solar power policies, both horizontally (e.g., across agencies) and vertically (e.g., across subnational, national, and international efforts); help align social and environmental safeguards and a streamlined permitting processes.
  • Call for government incentives for consumers such as subsidies (especially to reduce up-front cost), feed-in tariffs, tax credits, grants, waived grid connection fees, and forgivable or concessional loans; help ensure regulations allow for grid injections and net-metering schemes; advocate for long-term policies and incentives that will remain stable for at least five years; call for similar financial incentives for supporting equipment manufacturers, such as those that produce batteries and inverters.
  • Urge governments to provide incentives – such as subsidies, feed-in tariffs, auctions, tax credits, and contracts for difference – to manufacturers, operators, developers, and other relevant actors; recommend gradual reductions of these incentives to create long-term market stability.
  • Campaign for public investments in improvements to grid integration and flexibility, storage, and infrastructure to manage variable generation.
  • Advocate for a percentage of public financing to be earmarked for low- and middle-income communities and/or countries.
  • Help improve enforcement of labor and human-rights laws and standards around solar PV supply chains – particularly for the extraction and use of critical minerals.
  • Help create or support community solar projects using a variety of models, such as build-own-operate, public-private partnerships, utility models, energy communities, and cooperatives.
  • Advocate for strong regulations for end-of-life services; advocate for extended producer responsibility; work with industry to foster a market for used, refurbished, or recycled panels.
  • Advocate for carbon taxes and the removal of subsidies from fossil-fuel infrastructure; recommend those funds be redirected into renewable energy.
  • Join, create, or participate in public-private partnerships dedicated to deployment, technology transfers, education, de-risking markets, and other relevant areas.
  • Establish one-stop-shop educational programs that use online and in-person methods to educate industry and the public on regulations, benefits of solar, best practices for development, and other relevant information; ensure the material is sufficient and appropriate for local contexts, paying particularly close attention to language barriers. 

Further information:

Technologists and Researchers

  • Continue advancing the performance of monocrystalline and polycrystalline silicon cells.
  • Improve cooperation between building automation systems and monitoring and control of PV systems.
  • Investigate the ability of PV to assist in frequency regulation and other ancillary services to maintain grid stability as more renewables displace conventional power plants.
  • Develop a platform that provides up-to-date and publicly available data on mini-grid operations, related policies, technologies, standards, and other relevant information.
  • Advance energy-storage systems technologies, such as battery, hydrogen, and gravity-based.
  • Improve manufacturing efficiencies such as larger wafer formats, enhanced cell architectures, and advanced wafer-processing techniques.
  • Advance the use of AI or other technological means for predictive analytics, forecasting, and power system control.
  • Improve recycling infrastructure and scalable technologies to repair, reuse, or recover materials from solar panels.
  • Create more heat-tolerant PV technologies and systems to reduce heat exposure and/or absorption.
  • Create better protection and cleaning systems for PV to preserve functionality during extreme weather, and in extreme environments – especially deserts. 
  • Improve related mining technologies for critical minerals, making the extraction process safer, less disruptive to local communities and ecosystems, and less energy-intensive.
  • Develop ways of eliminating, reducing, reusing, and/or safely disposing of hazardous by-products of PV manufacturing.
  • Research factors that lead to community acceptance and the role of distributed solar in a fair and just energy transition. 

Further information:

Communities, Households, and Individuals

  • Install solar panels at home, at the office, and/or at other properties; share your experience and tips with neighbors and the broader community.
  • If your community is not connected to the main grid, consider developing a local mini-grid.
  • Conduct careful planning for installation, ensuring panel tilt, maintenance, and shading are evaluated based on local climatic conditions and are accounted for properly.
  • Conduct regular maintenance and cleaning to enhance cost efficiency and energy savings, especially in arid climates.
  • Help create or support community solar projects using a variety of models, such as build-own-operate, public-private partnerships, utility models, energy communities, and cooperatives.
  • If available, take advantage of government incentives such as subsidies, tax breaks, and forgivable or concessional loans for development.
  • Call for government incentives for consumers, if necessary, such as subsidies ( especially to reduce up-front cost), feed-in tariffs, tax credits, grants, waived grid connection fees, and forgivable or concessional loans; help ensure regulations allow for grid injections and net-metering schemes; advocate for long-term policies and incentives that will remain stable for at least five years; call for similar financial incentives for supporting equipment manufacturers, such as those that produce batteries and inverters.
  • Advocate for carbon taxes and the removal of subsidies from fossil-fuel infrastructure; recommend those funds be redirected into renewable energy.
  • Join, create, or participate in public-private partnerships dedicated to deployment, technology transfers, education, de-risking markets, and other relevant areas.
  • Participate in public awareness campaigns focused on solar projects; share information with your community and networks.

Further information:

“Take Action” Sources

Evidence Base

Level of consensus: High

The scientific consensus surrounding distributed solar PV is strong in support of its emissions reduction potential, cost declines, and grid benefits, although nuances and regional gaps persist. Many studies have documented adoption drivers, grid impacts, performance constraints, and social equity issues, together forming a robust evidence base.

Distributed solar PV not only reduces emissions but also enhances local grid resilience, with one study demonstrating reductions in peak load and frequency interruptions (Ovaere et al., 2020). However, careful grid integration planning, smart inverter controls, and grid upgrades are required to avoid adverse effects because rooftop PV affects voltage quality, reverse power flow, frequency stability, and protection systems (Alboaouh & Mohagheghi, 2020). High penetration of rooftop PV can also lead to voltage issues and power disruptions, create protection coordination issues, and strain regional grid elements (Tran et al., 2023; Uzum et al., 2021). 

Broad solar adoption, including household-level PV, depends on many factors, including key determinants such as affordability, policy support, infrastructure, and social norms. This is especially true in rapidly growing countries (Oliva & Atehortua Santamaria, 2025; Shakeel et al., 2023). In China, distributed solar PV development is now shaped by subsidy phase-out and grid parity dynamics after a decade of evolving policy and finance mechanisms (Zhang & Sirin, 2024). However, regardless of the regional policy landscape, distributed rooftop systems face real-world performance losses due to shading, panel tilt, temperature, and maintenance constraints (Venkatachalam et al., 2025).

The literature strongly supports the notion that distributed solar PV is an effective and scalable mitigation option that can reduce emissions, improve grid reliability, and democratize energy access. There is high consensus on its value, especially when deployed with supportive policy, proper engineering, and system integration. However, unresolved issues remain around cost dynamics of non-hardware components, performance in fragile grids, and equity of deployment. For instance, studies on environmental justice point to lower PV uptake in disadvantaged communities despite high solar potential (Lukanov & Krieger, 2019).

The results discussed in our analysis draw on 10 reviews/meta-analyses, 44 research articles, and 31 institutional reports, covering evidence from different parts of the world, primarily from North America, Europe, and Asia. Many low-income and off-grid regions remain underrepresented, limiting generalizability. Further empirical research in sub-Saharan Africa and Latin America is needed to understand distributed PV’s performance, policy interactions, and grid impacts in diverse contexts.

Updated Date
Coming Soon Label
Coming Soon
Subscribe to Food security