

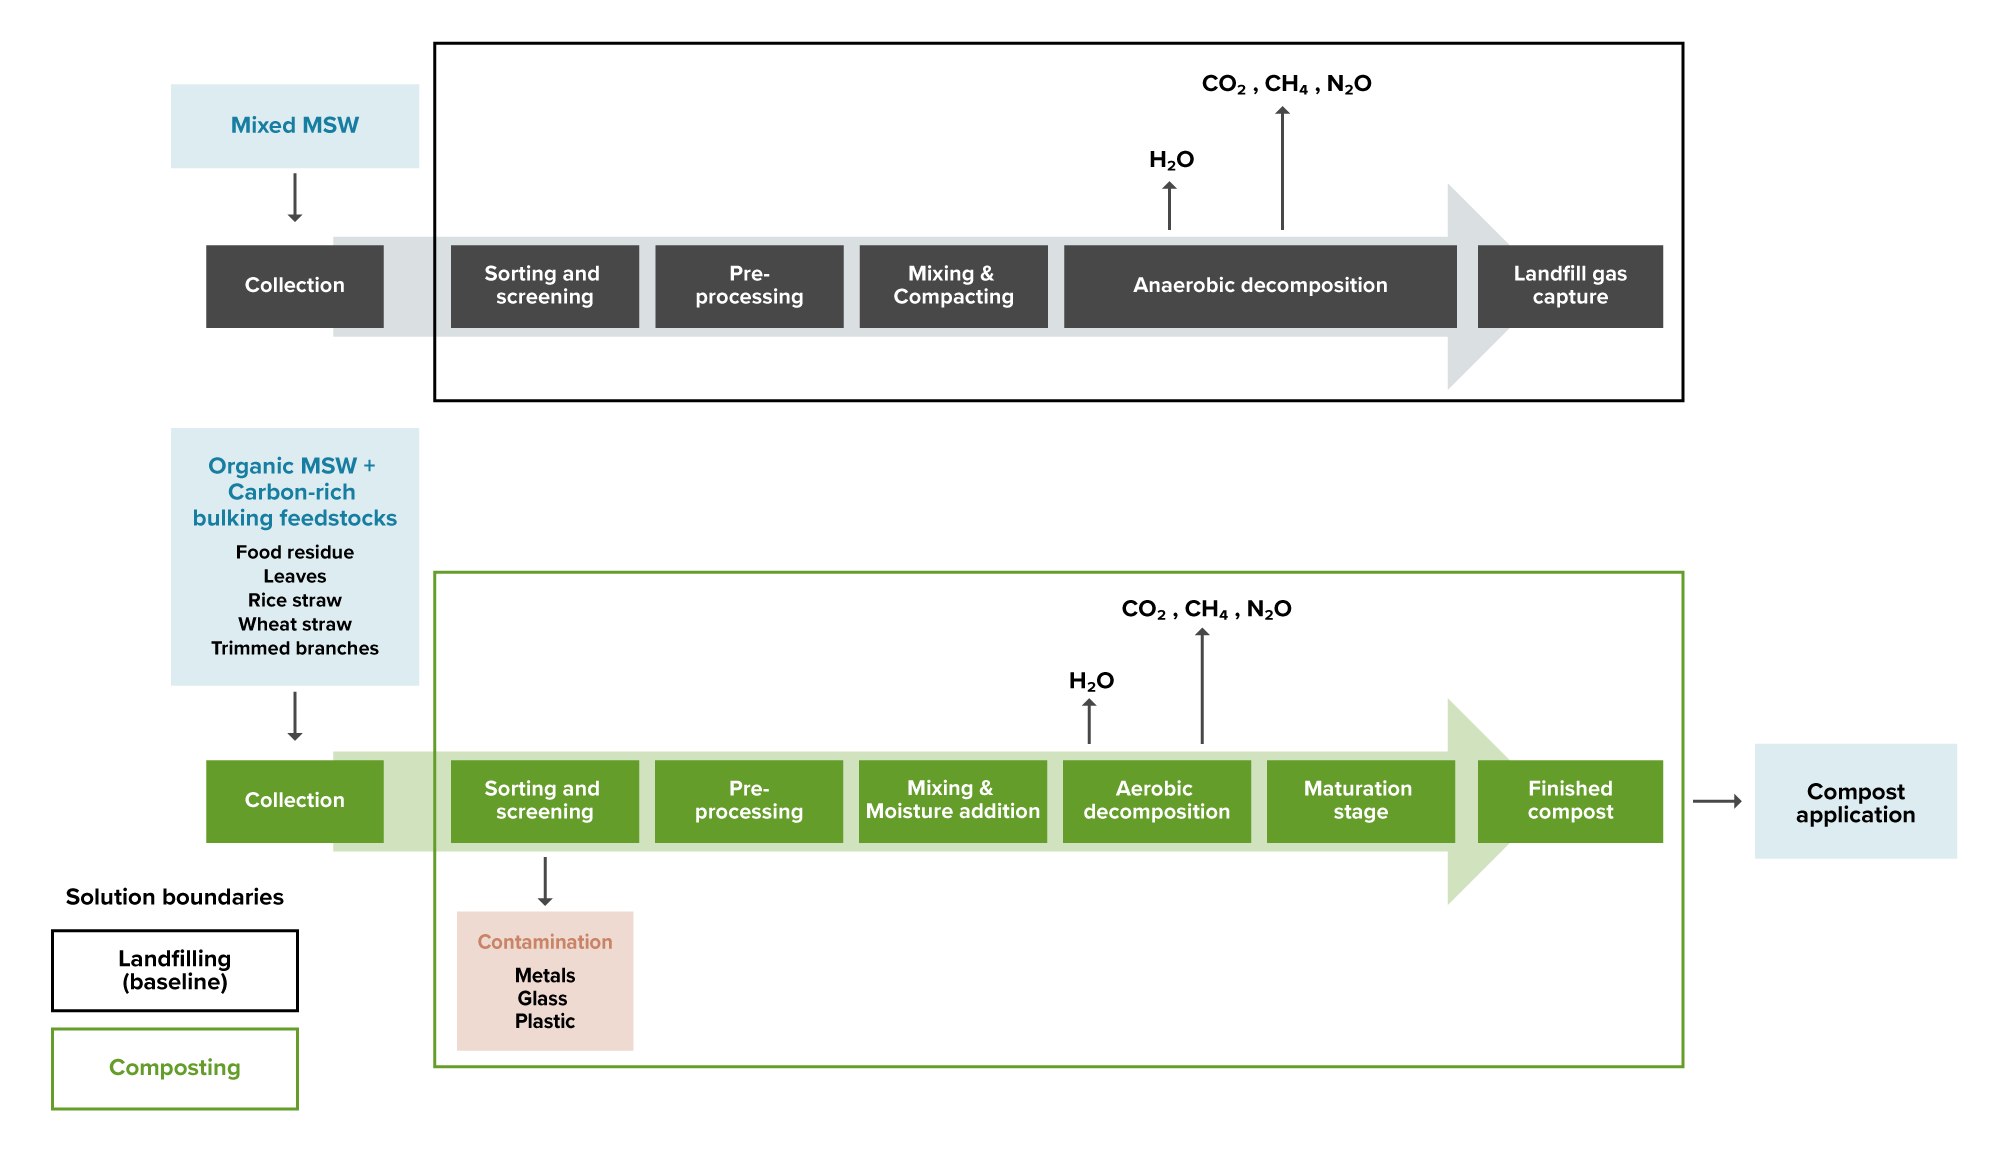
There are many stages involved in a composting system to convert organic MSW into finished compost that can be used to improve soil health (Figure 1). Within this system, composting is the biochemical process that transforms OW into a soil amendment rich in nutrients and organic matter.
Increase Centralized Composting
Sector
Industry, Materials & Waste
Mode
Cut Emissions
Cluster
Use Waste as a Resource
Image
Image
Coming Soon
Off
Summary
A composting system diverts organic waste (OW) from landfills, reducing the production of methane and other GHG emissions. OW is defined as the combination of food waste and green waste, composed of yard and garden trimmings. Composting transforms it into a nutrient-rich soil supplement.
Our focus is on centralized (city- or regional-level) composting systems for the OW components of municipal solid waste (MSW). Decentralized (home- and community-level) and on-farm composting are also valuable climate actions, but are not included here due to limited data availability at the global level (see Increase Decentralized Composting).
Overview
Figure 1. Stages of a composting system. Solution boundaries exclude activities upstream and downstream of centralized MSW composting such as waste collection and compost application. Modified from Kawai et al. (2020) and Manea et al. (2024).
Image
Sources: Kawai, K., Liu, C., & Gamaralalage, P. J. D. (2020). CCET guideline series on intermediate municipal solid waste treatment technologies: Composting. United Nations Environment Programme; Manea, E. E., Bumbac, C., Dinu, L. R., Bumbac, M., & Nicolescu, C. M. (2024). Composting as a sustainable solution for organic solid waste management: Current practices and potential improvements. Sustainability, 16(15), Article 6329.
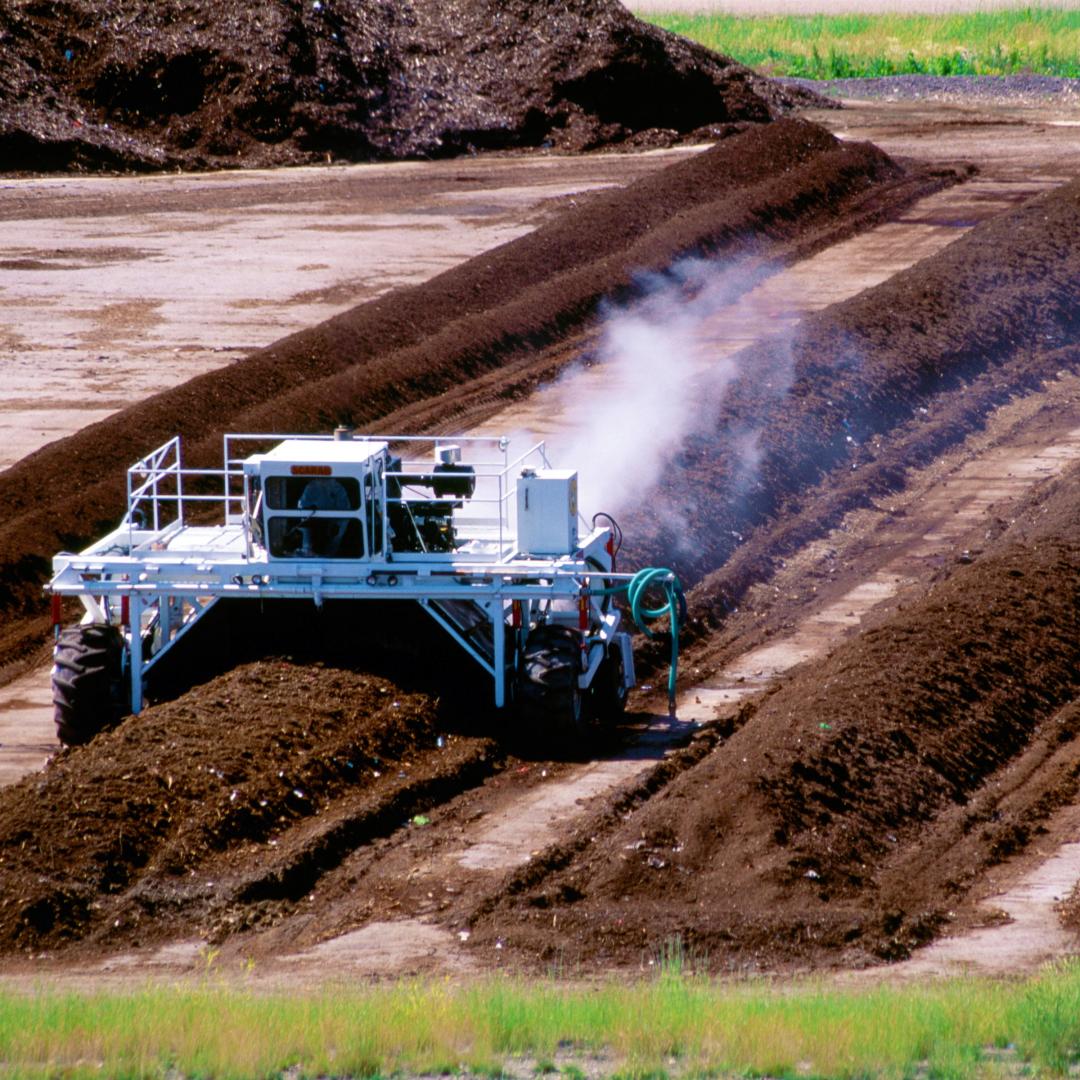
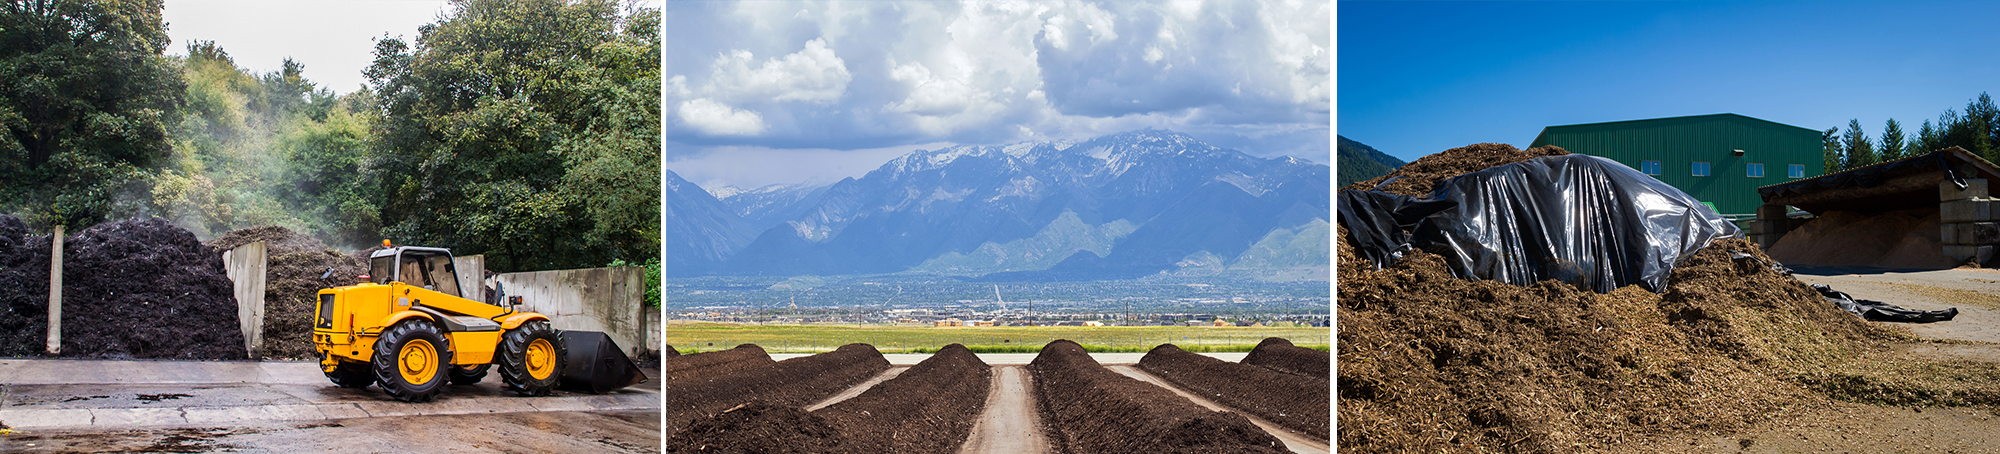
The composting process is based on aerobic decomposition, driven by complex interactions among microorganisms, biodegradable materials, and invertebrates and mediated by water and oxygen (see the Appendix). Without the proper balance of oxygen and water, anaerobic decomposition occurs, leading to higher methane emissions during the composting process (Amuah et al., 2022; Manea et al., 2024). Multiple composting methods can be used depending on the amounts and composition of OW feedstocks, land availability, labor availability, finances, policy landscapes, and geography. Some common methods include windrow composting, bay or bin systems, and aerated static piles (Figure 2; Amuah et al., 2022; Ayilara et al., 2020; Cao et al., 2023).
Figure 2. Examples of commonly used centralized composting methods. Bay systems (left) move organics between different bays at different stages of the composting process. Windrows (center) are long, narrow piles that are often turned using large machinery. Aerated static piles (right) can be passively aerated as shown here or actively aerated with specialized blowing equipment.
Image
Credit: Bays, iStock | nikolay100; Windrows, iStock | Jeremy Christensen; Aerated static pile, iStock | AscentXmedia
Centralized composting generally refers to processing large quantities (>90 t/week) of organic MSW (Platt, 2017). Local governments often manage centralized composting as part of an integrated waste management system that can also include recycling non-OW, processing OW anaerobically in methane digesters, landfilling, and incineration (Kaza et al., 2018).
Organic components of MSW include food waste and garden and yard trimmings (Figure 2). In most countries and territories, these make up 40–70% of MSW, with food waste as the largest contribution (Ayilara et al., 2020; Cao et al., 2023; Food and Agriculture Organization [FAO], 2019; Kaza et al., 2018; Manea et al., 2024; U.S. Environmental Protection Agency [U.S. EPA], 2020; U.S. EPA, 2023).
Diverting OW, particularly food waste, from landfill disposal to composting reduces GHG emissions (Ayilara et al., 2020; Cao et al., 2023; FAO, 2019). Diversion of organics from incineration could also have emissions and pollution reduction benefits, but we did not include incineration as a baseline disposal method for comparison since it is predominantly used in high-capacity and higher resourced countries and contributes less than 1% to annual waste-sector emissions (Intergovernmental Panel On Climate Change [IPCC], 2023; Kaza et al., 2018).
Disposal of waste in landfills leads to methane emissions estimated at nearly 1.9 Gt CO₂‑eq (100-yr basis) annually (International Energy Agency [IEA], 2024). Landfill emissions come from anaerobic decomposition of inorganic waste and OW and are primarily methane with smaller contributions from ammonia, nitrous oxide, and CO₂ (Cao et al., 2023; Kawai et al., 2020; Manea et al., 2024). Although CO₂, methane, and nitrous oxide are released during composting, methane emissions are up to two orders of magnitude lower than emissions from landfilling for each metric ton of waste (Ayilara et al., 2020; Cao et al, 2023; FAO, 2019; IEA, 2024; Nordahl et al., 2023; Perez et al., 2023). GHG emissions can be minimized by fine-tuning the nutrient balance during composting.
Depending on the specifics of the composting method used, the full transformation from initial feedstocks to finished compost can take weeks or months (Amuah et al., 2022; Manea et al., 2024; Perez et al., 2023). Finished compost can be sold and used in a variety of ways, including application to agricultural lands and green spaces as well as for soil remediation (Gilbert et al., 2020; Platt et al., 2022; Ricci-Jürgensen et al., 2020a; Sánchez et al., 2025).
References
Abedin, T., Pasupuleti, J., Paw, J.K.S., Tak, Y. C., Islam, M. R., Basher, M. K., & Nur-E-Alam, M. (2025). From waste to worth: Advances in energy recovery technologies for solid waste management. Clean Technologies and Environmental Policy, 27, 5963–5989. Link to source: https://doi.org/10.1007/s10098-025-03204-x
Alves Comesaña, D., Villar Comesaña, I., & Mato de la Iglesia, S. (2024). Community composting strategies for biowaste treatment: Methodology, bulking agent and compost quality. Environmental Science and Pollution Research, 31(7), 9873–9885. Link to source: https://doi.org/10.1007/s11356-023-25564-x
Amuah, E. E. Y., Fei-Baffoe, B., Sackey, L. N. A., Douti, N. B., & Kazapoe, R. W. (2022). A review of the principles of composting: Understanding the processes, methods, merits, and demerits. Organic Agriculture, 12(4), 547–562. Link to source: https://doi.org/10.1007/s13165-022-00408-z
Ayilara, M., Olanrewaju, O., Babalola, O., & Odeyemi, O. (2020). Waste management through composting: Challenges and potentials. Sustainability, 12(11), Article 4456. Link to source: https://doi.org/10.3390/su12114456
Bekchanov, M., & Mirzabaev, A. (2018). Circular economy of composting in Sri Lanka: Opportunities and challenges for reducing waste related pollution and improving soil health. Journal of Cleaner Production, 202, 1107–1119. Link to source: https://doi.org/10.1016/j.jclepro.2018.08.186
Bell, B., & Platt, B. (2014). Building healthy soils with compost to protect watersheds. Institute for Local Self-Reliance. Link to source: https://ilsr.org/wp-content/uploads/2013/05/Compost-Builds-Healthy-Soils-ILSR-5-08-13-2.pdf
Brown, S. (2015, July 14). Connections: YIMBY. Biocycle. Link to source: https://www.biocycle.net/connections-yimby/
Cai, B., Lou, Z., Wang, J., Geng, Y., Sarkis, J., Liu, J., & Gao, Q. (2018). CH4 mitigation potentials from China landfills and related environmental co-benefits. Science Advances, 4(7), Article eaar8400. Link to source: https://doi.org/10.1126/sciadv.aar8400
Cao, X., Williams, P. N., Zhan, Y., Coughlin, S. A., McGrath, J. W., Chin, J. P., & Xu, Y. (2023). Municipal solid waste compost: Global trends and biogeochemical cycling. Soil & Environmental Health, 1(4), Article 100038. Link to source: https://doi.org/10.1016/j.seh.2023.100038
Casey, J. A., Cushing, L., Depsky, N., & Morello-Frosch, R. (2021). Climate justice and California’s methane superemitters: Environmental equity Assessment of community proximity and exposure intensity. Environmental Science & Technology, 55(21), 14746–14757. Link to source: https://doi.org/10.1021/acs.est.1c04328
Coker, C. (2020, March 3). Composting business management: Revenue forecasts for composters. Biocycle. Link to source: https://www.biocycle.net/composting-business-management-revenue-forecasts-composters/
Coker, C. (2020, March 10). Composting business management: Capital cost of composting facility construction. Biocycle. Link to source: https://www.biocycle.net/composting-business-management-capital-cost-composting-facility-construction/
Coker, C. (2020, March 17). Composting business management: Composting facility operating cost estimates. Biocycle. Link to source: https://www.biocycle.net/composting-business-management-composting-facility-operating-cost-estimates/
Coker, C. (2022, August 23). Compost facility planning: Composting facility approvals and permits. Biocycle. Link to source: https://www.biocycle.net/composting-facility-approval-permits/
Coker, C. (2022, September 27). Compost facility planning: Composting facility cost estimates. Biocycle. Link to source: https://www.biocycle.net/compost-facility-planning-cost/
Coker, C. (2024, August 20). Compost market development. Biocycle. Link to source: https://www.biocycle.net/compost-market-development/
European Energy Agency. (2024). Greenhouse gas emissions by source sector. (Last Updated: April 18, 2024). Eurostat. [Data set and codebook]. Link to source: https://ec.europa.eu/eurostat/databrowser/view/env_air_gge__custom_16006716/default/table
Farhidi, F., Madani, K., & Crichton, R. (2022). How the US economy and environment can both benefit from composting management. Environmental Health Insights, 16. Link to source: https://doi.org/10.1177/11786302221128454
Food and Agriculture Organization of the United Nations. (2024). The state of food and agriculture 2024 – Value-driven transformation of agrifood systems. Link to source: https://doi.org/10.4060/cd2616en
Finlay, K. (2024). Turning down the heat: how the U.S. EPA can fight climate change by cutting landfill emissions. Industrious Labs. Link to source: https://cdn.sanity.io/files/xdjws328/production/657706be7f29a20fe54692a03dbedce8809721e8.pdf
Global Alliance for Incinerator Alternatives. (2019). Pollution and health impacts of waste-to-energy incineration [Fact sheet]. Link to source: https://www.cms.gov/newsroom/fact-sheets/delivering-service-school-based-settings-comprehensive-guide-medicaid-services-and-administrative
González, D., Barrena, R., Moral-Vico, J., Irigoyen, I., & Sánchez, A. (2024). Addressing the gaseous and odour emissions gap in decentralised biowaste community composting. Waste Management, 178, 231–238. Link to source: https://doi.org/10.1016/j.wasman.2024.02.042
International Energy Agency. (2024), Global Methane Tracker 2024. Link to source: https://www.iea.org/reports/global-methane-tracker-2024
Intergovernmental Panel On Climate Change. (2023). Climate change 2022 – Impacts, adaptation and vulnerability: Working Group II contribution to the sixth assessment report of the Intergovernmental Panel on Climate Change (1st ed.). Cambridge University Press. Link to source: https://doi.org/10.1017/9781009325844
Intergovernmental Panel On Climate Change. (2019). 2019 Refinement to the 2006 IPCC Guidelines for National Greenhouse Gas Inventories, Calvo. Buendia, E., Tanabe, K., Kranjc, A., Baasansuren, J., Fukuda, M., Ngarize S., Osako, A., Pyrozhenko, Y., Shermanau, P. and Federici, S. (eds). Link to source: https://www.ipcc-nggip.iges.or.jp/public/2019rf/index.html
Jamroz, E., Bekier, J., Medynska-Juraszek, A., Kaluza-Haladyn, A., Cwielag-Piasecka, I., & Bednik, M. (2020). The contribution of water extractable forms of plant nutrients to evaluate MSW compost maturity: A case study. Scientific Reports, 10(1), Article 12842. Link to source: https://doi.org/10.1038/s41598-020-69860-9
Kawai, K., Liu, C., & Gamaralalage, P. J. D. (2020). CCET guideline series on intermediate municipal solid waste treatment technologies: Composting. United Nations Environment Programme. Link to source: https://www.unep.org/ietc/resources/publication/ccet-guideline-series-intermediate-municipal-solid-waste-treatment
Kaza, S., Yao, L. C., Bhada-Tata, P., Van Woerden, F., (2018). What a waste 2.0: A global snapshot of solid waste management to 2050. Urban Development. World Bank. Link to source: http://hdl.handle.net/10986/30317
Krause, M., Kenny, S., Stephenson, J., & Singleton, A. (2023). Quantifying methane emissions from landfilled food waste (Report No. EPA-600-R-23-064). U.S. Environmental Protection Agency Office of Research and Development. Link to source: https://www.epa.gov/system/files/documents/2023-10/food-waste-landfill-methane-10-8-23-final_508-compliant.pdf
Liu, K-. M., Lin, S-. H., Hsieh, J-., C., Tzeng, G-., H. (2018). Improving the food waste composting facilities site selection for sustainable development using a hybrid modified MADM model. Waste Management, 75, 44–59. Link to source: https://doi.org/10.1016/j.wasman.2018.02.017
Liu, H., Zhang, X., & Hong, Q. (2021). Emission characteristics of pollution gases from the combustion of food waste. Energies, 14(19), Article 6439. Link to source: https://doi.org/10.3390/en14196439
Maalouf, A., & Agamuthu, P. (2023). Waste management evolution in the last five decades in developing countries – A review. Waste Management & Research: The Journal for a Sustainable Circular Economy, 41(9), 1420–1434. Link to source: https://doi.org/10.1177/0734242X231160099
Manea, E. E., Bumbac, C., Dinu, L. R., Bumbac, M., & Nicolescu, C. M. (2024). Composting as a sustainable solution for organic solid waste management: Current practices and potential improvements. Sustainability, 16(15), Article 6329. Link to source: https://doi.org/10.3390/su16156329
Martínez-Blanco, J., Lazcano, C., Christensen, T. H., Muñoz, P., Rieradevall, J., Møller, J., Antón, A., & Boldrin, A. (2013). Compost benefits for agriculture evaluated by life cycle assessment. A review. Agronomy for Sustainable Development, 33(4), 721–732. Link to source: https://doi.org/10.1007/s13593-013-0148-7
Martuzzi, M., Mitis, F., & Forastiere, F. (2010). Inequalities, inequities, environmental justice in waste management and health. The European Journal of Public Health, 20(1), 21–26. Link to source: https://doi.org/10.1093/eurpub/ckp216
Nordahl, S. L., Devkota, J. P., Amirebrahimi, J., Smith, S. J., Breunig, H. M., Preble, C. V., Satchwell, A. J., Jin, L., Brown, N. J., Kirchstetter, T. W., & Scown, C. D. (2020). Life-Cycle greenhouse gas emissions and human health trade-offs of organic waste management strategies. Environmental Science & Technology, 54(15), 9200–9209. Link to source: https://doi.org/10.1021/acs.est.0c00364
Nordahl, S. L., Preble, C. V., Kirchstetter, T. W., & Scown, C. D. (2023). Greenhouse gas and air pollutant emissions from composting. Environmental Science & Technology, 57(6), 2235–2247. Link to source: https://doi.org/10.1021/acs.est.2c05846
Nubi, O., Murphy, R., & Morse, S. (2024). Life cycle sustainability assessment of waste to energy systems in the developing world: A review. Environments, 11(6), 123. Link to source: https://doi.org/10.3390/environments11060123
Organisation for Economic Co-operation and Development. (2021). Waste - Municipal waste: generation and treatment. (Downloaded: March 20, 2025) [Data set]. Link to source: https://data-explorer.oecd.org/vis?lc=en&df[ds]=dsDisseminateFinalDMZ&df[id]=DSD_MUNW%40DF_MUNW&df[ag]=OECD.ENV.EPI&dq=.A.INCINERATION_WITHOUT%2BLANDFILL.T&pd=2014%2C&to[TIME_PERIOD]=false&vw=ov
Pérez, T., Vergara, S. E., & Silver, W. L. (2023). Assessing the climate change mitigation potential from food waste composting. Scientific Reports, 13(1), Article 7608. Link to source: https://doi.org/10.1038/s41598-023-34174-z
Platt, B., Bell, B., & Harsh, C. (2013). Pay dirt: Composting in Maryland to reduce waste, create jobs, & protect the bay. Institute for Local Self-Reliance. Link to source: https://ilsr.org/wp-content/uploads/2013/05/Pay-Dirt-Report.pdf
Platt, B. (2017, April 4). Hierarchy to Reduce Food Waste & Grow Community, Institute for Local Self-Reliance. Link to source: https://ilsr.org/articles/food-waste-hierarchy/
Platt, B., and Fagundes, C. (2018). Yes! In my backyard: A home composting guide for local government. Institute for Local Self-Reliance. Link to source: https://ilsr.org/articles/yimby-compost/
Platt, B., Libertelli, C., & Matthews, M. (2022). A growing movement: 2022 community composter census. Institute for Local Self-Reliance. Link to source: https://ilsr.org/articles/composting-2022-census/
Ricci-Jürgensen, M., Gilbert, J., & Ramola, A.. (2020a). Global assessment of municipal organic waste production and recycling. International Solid Waste Association. Link to source: https://www.altereko.it/wp-content/uploads/2020/03/Report-1-Global-Assessment-of-Municipal-Organic-Waste.pdf
Ricci-Jürgensen, M., Gilbert, J., & Ramola, A.. (2020b). Benefits of compost and anaerobic digestate when applied to soil. International Solid Waste Association. Link to source: https://www.altereko.it/wp-content/uploads/2020/03/Report-2-Benefits-of-Compost-and-Anaerobic-Digestate.pdf
Rynk, R., Black, G., Biala, J., Bonhotal, J., Cooperband, L., Gilbert, J., & Schwarz, M. (Eds.). (2021). The composting handbook. Compost Research & Education Foundation and Elsevier. Link to source: https://www.compostingcouncil.org/store/viewproduct.aspx?id=19341051
Sánchez, A., Gea, T., Font, X., Artola, A., Barrena, R., & Moral-Vico, J. (Eds.). (2025). Composting: Fundamentals and Recent Advances: Chapter 1. Royal Society of Chemistry. Link to source: https://doi.org/10.1039/9781837673650
Searchinger, T., Peng, L., Zionts, J., & Waite, R. (2024). The global land squeeze: Managing the growing competition for land. World Resources Institute. Link to source: https://www.wri.org/research/global-land-squeeze-managing-growing-competition-land
Souza, M. A. d., Gonçalves, J. T., & Valle, W. A. d. (2023). In my backyard? Discussing the NIMBY effect, social acceptability, and residents’ involvement in community-based solid waste management. Sustainability, 15(9), Article 7106. Link to source: https://doi.org/10.3390/su15097106
The Environmental Research & Education Foundation. (2024). Analysis of MSW landfill tipping fees — 2023. Link to source: https://erefdn.org/product/analysis-of-msw-landfill-tipping-fees-2023/
U.S. Composting Council. (2008). Greenhouse gases and the role of composting: A primer for compost producers [Fact sheet]. Link to source: https://cdn.ymaws.com/www.compostingcouncil.org/resource/resmgr/documents/GHG-and-Role-of-Composting-a.pdf
U.S. Environmental Protection Agency. (2020). 2018 wasted food report (EPA Publication No. EPA 530-R-20-004). Office of Resource Conservation and Recovery. Link to source: https://www.epa.gov/system/files/documents/2025-02/2018_wasted_food_report-v2.pdf
U.S. Environmental Protection Agency. (2023). 2019 Wasted food report (EPA Publication No. 530-R-23-005). National Institutes of Health. Link to source: https://www.epa.gov/system/files/documents/2024-04/2019-wasted-food-report_508_opt_ec_4.23correction.pdf
U.S. Environmental Protection Agency. (2023). Documentation for Greenhouse Gas Emission and Energy Factors Used in the Waste Reduction Model (WARM): Organic Materials Chapters (EPA Publication No. EPA-530-R-23-019). Office of Resource Conservation and Recovery. Link to source: https://www.epa.gov/system/files/documents/2023-12/warm_organic_materials_v16_dec.pdf
U.S. Environmental Protection Agency. (2025, January). Approaches to composting. Link to source: https://www.epa.gov/sustainable-management-food/approaches-composting
U.S. Environmental Protection Agency. (2025, April). Benefits of using compost. Link to source: https://www.epa.gov/sustainable-management-food/benefits-using-compost
United Nations Environment Programme. (2023). Towards Zero Waste: A Catalyst for delivering the Sustainable Development Goals. Link to source: https://doi.org/10.59117/20.500.11822/44102
United Nations Environment Programme. (2024). Global Waste Management Outlook 2024 Beyond an age of waste: Turning rubbish into a resource. Link to source: https://www.unep.org/resources/global-waste-management-outlook-2024
Urra, J., Alkorta, I., & Garbisu, C. (2019). Potential benefits and risks for soil health derived from the use of organic amendments in agriculture. Agronomy, 9(9), 542. Link to source: https://doi.org/10.3390/agronomy9090542
Wilson, D. C., Paul, J., Ramola, A., & Filho, C. S. (2024). Unlocking the significant worldwide potential of better waste and resource management for climate mitigation: With particular focus on the Global South. Waste Management & Research: The Journal for a Sustainable Circular Economy, 42(10), 860–872. Link to source: https://doi.org/10.1177/0734242X241262717
World Bank. (2018). What a waste global database: Country-level dataset. (Last Updated: June 4, 2024) [Data set]. World Bank. Link to source: https://datacatalogfiles.worldbank.org/ddh-published/0039597/3/DR0049199/country_level_data.csv
Yasmin, N., Jamuda, M., Panda, A. K., Samal, K., & Nayak, J. K. (2022). Emission of greenhouse gases (GHGs) during composting and vermicomposting: Measurement, mitigation, and perspectives. Energy Nexus, 7, Article 100092. Link to source: https://doi.org/10.1016/j.nexus.2022.100092
Zaman, A. U. (2016). A comprehensive study of the environmental and economic benefits of resource recovery from global waste management systems. Journal of Cleaner Production, 124, 41–50. Link to source: https://doi.org/10.1016/j.jclepro.2016.02.086
Zero Waste Europe & Bio-based Industries Consortium. (2024). Bio-waste generation in the EU: Current capture levels and future potential (Second edition). LIFE Programme of the European Union. Link to source: https://zerowasteeurope.eu/library/bio-waste-generation-in-the-eu-current-capture-levels-and-future-potential-second-edition/
Zhu, J., Luo, Z., Sun, T., Li, W., Zhou, W., Wang, X., Fei, X., Tong, H., & Yin, K. (2023). Cradle-to-grave emissions from food loss and waste represent half of total greenhouse gas emissions from food systems. Nature Food, 4(3), 247–256. Link to source: https://doi.org/10.1038/s43016-023-00710-3
Credits
Lead Fellow
Megan Matthews, Ph. D.
Contributors
Ruthie Burrows, Ph.D.
James Gerber, Ph.D.
Daniel Jasper
Alex Sweeney
Internal Reviewers
Aiyana Bodi
Hannah Henkin
Ted Otte
Sarah Gleeson, Ph. D.
Amanda D. Smith, Ph.D.
Paul C. West, Ph.D.
Effectiveness
We estimated that composting reduces emissions by 3.9 t CO₂‑eq /t OW (9.3 t CO₂‑eq /t OW, 20-yr basis) based on avoided landfill emissions minus the emissions during composting of MSW OW (Table 1). In our analysis, composting emissions were an order of magnitude lower than landfill emissions.
Table 1. Effectiveness at reducing emissions.
Unit: t CO₂‑eq (100-yr basis)/t OW
| 25th percentile | 2.5 |
| Mean | 3.2 |
| Median (50th percentile) | 3.9 |
| 75th percentile | 4.3 |
Left Text Column Width
Emissions data from composting and landfilling OW are geographically limited, but our analysis includes three global reports and studies from the U.S., China, Denmark, and the EU (European Energy Agency [EEA], 2024; Industrious Labs, 2024; Perez et al., 2023; U.S. EPA, 2020; Yang et al., 2017, Yasmin et al., 2022). We assumed OW was 39.6% of MSW in accordance with global averages (Kaza et al., 2018; World Bank, 2018).
We estimated that landfills emit 4.3 t CO₂‑eq /t OW (9.9 t CO₂‑eq /t OW, 20-yr basis). We estimated composting emissions were 10x lower at 0.4 t CO₂‑eq /t OW (0.6 t CO₂‑eq /t OW, 20-yr basis). We quantified emissions from a variety of composting methods and feedstock mixes (Cao et al., 2023; Perez et al., 2023; Yasmin et al., 2022). Consistent with Amuah et al. (2022), we assumed a 60% moisture content by weight to convert reported wet waste quantities to dry waste weights. We based effectiveness estimates only on dry OW weights. For adoption and cost, we did not distinguish between wet and dry OW.
Cost
Financial data were geographically limited. We based cost estimates on global reports with selected studies from the U.K., U.S., India, and Saudi Arabia for landfilling and the U.S. and Sri Lanka for composting. Transportation and collection costs can be significant in waste management, but we did not include them in this analysis. We calculated amortized net cost for landfilling and composting by subtracting revenues from operating costs and amortized initial costs over a 30-yr facility lifetime.
Landfill initial costs are one-time investments, while operating expenses, which include maintenance, wages, and labor, vary annually. Environmental costs, including post-closure operations, are not included in our analysis, but some countries impose taxes on landfilling to incentivize alternative disposal methods and offset remediation costs. Landfills generate revenue through tip fees and sales of landfill gas (Environmental Research & Education Foundation [EREF], 2023; Kaza et al., 2018). We estimated that landfilling is profitable, with a net cost of –US$30/t OW.
Initial and operational costs for centralized composting vary depending on method and scale (IPCC, 2023; Manea et al., 2024), but up-front costs are generally cheaper than landfilling. Since composting is labor-intensive and requires monitoring, operating costs can be higher, particularly in regions that do not impose landfilling fees (Manea et al., 2024).
Composting facilities generate revenue through tip fees and sales of compost products. Compost sales alone may not be sufficient to recoup costs, but medium- to large-scale composting facilities are economically viable options for municipalities (Kawai et al., 2020; Manea et al., 2024). We estimated the net composting cost to be US$20/t OW. The positive value indicates that composting is not globally profitable; however, decentralized systems that locally process smaller waste quantities can be profitable using low-cost but highly efficient equipment and methods (see Increase Decentralized Composting).
We estimated that composting costs US$50/t OW more than landfilling. Although composting systems cost more to implement, the societal and environmental costs are greatly reduced compared to landfilling (Yasmin et al., 2022). The high implementation cost is a barrier to adoption in lower-resourced and developing countries (Wilson et al., 2024).
Combining effectiveness with the net costs presented here, we estimated a cost per unit climate impact of US$10/t CO₂‑eq (US$5/t CO₂‑eq , 20-yr basis) (Table 2).
Table 2. Cost per unit climate impact.
Unit: US$ (2023)/t CO₂‑eq (100-yr basis)
| Median | 10 |
Left Text Column Width
Methods and Supporting Data
Learning Curve
Global cost data on composting are limited, and costs can vary depending on composting methods, so we did not quantify a learning rate for centralized composting.
Speed of Action
Speed of action refers to how quickly a climate solution physically affects the atmosphere after it is deployed. This is different from speed of deployment, which is the pace at which solutions are adopted.
At Project Drawdown, we define the speed of action for each climate solution as emergency brake, gradual, or delayed.
Increase Centralized Composting is an EMERGENCY BRAKE climate solution. It has the potential to deliver a more rapid impact than nominal and delayed solutions. Because emergency brake solutions can deliver their climate benefits quickly, they can help accelerate our efforts to address dangerous levels of climate change. For this reason, they are a high priority.
Caveats
The composting process has a low risk of reversal since carbon is stored stably in finished compost instead of decaying and releasing methane in a landfill (Ayilara et al., 2020; Manea et al., 2024). However, a composting system, from collection to finished product, can be challenging to sustain. Along with nitrogen-rich food and green waste, additional carbon-rich biomass, called bulking material, is critical for maintaining optimal composting conditions that minimize GHG emissions. Guaranteeing the availability of sufficient bulking materials can challenge the success of both centralized and decentralized facilities.
Financially and environmentally sustainable composting depends not only on the quality of incoming OW feedstocks, but also on the quality of the final product. Composting businesses require a market for sales of compost products (in green spaces and/or agriculture), and poor source separation could lead to low-quality compost and reduced demand (Kawai et al., 2020; Wilson et al., 2024). Improvements in data collection and quality through good feedback mechanisms can also act as leverage for expanding compost markets, pilot programs, and growing community support.
If composting facilities close due to financial or other barriers, local governments may revert to disposing of organics in landfills. Zoning restrictions also vary broadly across geographies, affecting how easily composting can be implemented (Cao et al., 2023). In regions where centralized composting is just starting, reversal could be more likely without community engagement and local government support (Kawai et al., 2020; Maalouf & Agamuthu, 2023); however, even if facilities close, the emissions savings from past operation cannot be reversed.
Current Adoption
We estimated global composting adoption at 78 million t OW/yr, as the median between two datasets (Table 3). The most recent global data on composting were compiled in 2018 from an analysis from 174 countries and territories (World Bank, 2018). We also used an Organisation for Economic Co-operation and Development (OECD) analysis from 45 countries (OECD, 2021). However, there were still many countries and territories that did not report composting data in one or both datasets. Although the World Bank dataset is comprehensive, it is based on data collected in 2011–2018, so more recent, high-quality, global data on composting are needed.
Table 3. Current adoption level (2021).
Unit: t OW composted/yr
| 25th percentile | 67,000,000 |
| Mean | 78,000,000 |
| Median (50th percentile) | 78,000,000 |
| 75th percentile | 89,000,000 |
Left Text Column Width
Globally in 2018, nearly 40% of all waste was disposed of in landfills, 19% was recovered through composting and other recovery and recycling methods, and the remaining waste was either unaccounted for or disposed of through open dumping and wastewater (Kaza et al., 2018)
We calculated total tonnage composted using the reported composting percentages and the total MSW tonnage for each country. Composting percentages were consistently lower than the total percentage of OW present in MSW, suggesting there is ample opportunity for increased composting, even in geographies where it is an established disposal method. In 2018, 26 countries/territories had a composting rate above 10% of MSW, and 15 countries/territories had a composting rate above 20% of MSW. Countries with the highest composting rates were Austria (31%), the Netherlands (27%), and Switzerland (21%) (World Bank, 2018).
Adoption Trend
We used OECD data to estimate the composting adoption trend from 2014–2021 (OECD, 2021), which fluctuated significantly from year to year (Table 4). Negative rates indicate less OW was composted globally than in the previous year. Taking the median composting rate across seven years, we estimate the global composting trend as 260,000 t OW/yr/yr. However, the mean composting trend is –1.3 Mt OW/yr/yr, suggesting that on average, composting rates are decreasing globally.
Table 4. Adoption trend (2014–2021).
Unit: t OW composted/yr/yr
| 25th percentile | -1,200,000 |
| Mean | -1,300,000 |
| Median (50th percentile) | 260,000 |
| 75th percentile | 4,300,000 |
Left Text Column Width
Although some regions are increasing their composting capacity, others are either not composting or composting less over time. Germany, Italy, Spain, and the EU overall consistently show increases in composting rates year-to-year, while Greece, Japan, Türkiye, and the U.K. show decreasing composting rates. In Europe, the main drivers for consistent adoption were disposal costs, financial penalties, and the landfill directive (Ayilara et al., 2020).
Lack of reported data could also contribute to a negative global average composting rate over the past seven years. A large decline in composting rates from 2018–2019 was driven by a lack of data in 2019 for the U.S. and Canada. If we assumed that the U.S. composted the same tonnage in 2019 as in 2018, instead of no tonnage as reported in the data, then the annual trend for 2018–2019 is much less negative (–450,000 t OW/yr/yr) and the overall mean trend between 2014–2019 would be positive (1,400,000 t OW/yr/yr).
Adoption Ceiling
We estimate the global adoption ceiling for Increase Centralized Composting to be 1.35 billion t OW/yr (Table 5). In 2016, 2.01 Gt of MSW were generated, and generation is expected to increase to 3.4 Gt by 2050 (Kaza et al., 2018). Due to limited global data availability on composting infrastructure or policies, we estimated the adoption ceiling based on the projected total MSW for 2050 and assumed the OW fraction remains the same over time.
Table 5. Adoption ceiling. upper limit for adoption level.
Unit: t OW composted/yr
| Median (50th percentile) | 1,350,000,000 |
Left Text Column Width
In reality, amounts of food waste within MSW are also increasing, suggesting that there are sufficient global feedstocks to support widespread composting adoption (Zhu et al., 2023).
We assume that all OW could be processed via composting, but this ceiling is unlikely to be reached. In practice, organics could also be processed via methane digesters (see Deploy Methane Digesters), incinerated, or dumped, but these waste management treatments have similar environmental risks to landfilling.
Achievable Adoption
Since the global annual trend fluctuates, we used country-specific composting rates and organic fractions of MSW from 2018 to estimate the achievable range of composting adoption (see Appendix for an example). In our analysis, achievable increases in country-specific composting rates cannot exceed the total organic fraction of 2018 MSW.
For the 106 countries/territories that did not report composting rates, we defined achievable levels of composting relative to the fraction of OW in MSW. When countries also did not report OW percentages, the country-specific composting rate was kept at zero. For the remaining 86 countries/territories, we assumed that 25% of organic MSW could be diverted to composting for low achievable adoption and that 50% could be diverted for high achievable adoption.
For the 68 countries/territories with reported composting rates, we define low and high achievable adoption as a 25% or 50% increase to the country-specific composting rate, respectively. If the increased rate for either low or high adoption exceeded the country-specific OW fraction of MSW, we assumed that all organic MSW could be composted (see Appendix for an example). Our Achievable – Low adoption level is 201 Mt OW/yr, or 15% of our estimated adoption ceiling (Table 6). Our Achievable – High adoption level is 301 Mt OW/yr, or 22% of our estimated adoption ceiling.
Table 6. Range of achievable adoption levels.
Unit: t OW composted/yr
| Current adoption | 78,000,000 |
| Achievable – low | 201,000,000 |
| Achievable – high | 301,000,000 |
| Adoption ceiling | 1,350,000,000 |
Left Text Column Width
Our estimated adoption levels are conservative because some regions without centralized composting of MSW could have subnational decentralized composting programs that aren’t reflected in global data.
Although our achievable range is conservative compared to the estimated adoption ceiling, increased composting has the potential to reduce GHG emissions from landfills (Table 7). We estimated that current adoption reduces annual GHG emissions by 0.3 Gt CO₂‑eq/yr (0.73 Gt CO₂‑eq/yr, 20-yr basis). Our estimated low and high achievable adoption levels reduce 0.78 and 1.2 Gt CO₂‑eq/yr (1.9 and 2.8 Gt CO₂‑eq/yr, 20-yr basis), respectively. Using the adoption ceiling, we estimate that annual GHG reductions increase to 5.2 Gt CO₂‑eq/yr (12.6 Gt CO₂‑eq/yr, 20-yr basis).
Table 7. Climate impact at different levels of adoption.
Unit: Gt CO₂‑eq (100-yr basis)/yr
| Current adoption | 0.30 |
| Achievable – low | 0.78 |
| Achievable – high | 1.2 |
| Adoption ceiling | 5.2 |
Left Text Column Width
The IPCC estimated in 2023 that the entire waste sector accounted for 3.9% of total global GHG emissions, and solid waste management represented 36% of total waste sector emissions (IPCC, 2023). Disposal of waste in landfills leads to methane emissions estimated at nearly 1.9 Gt CO₂‑eq (100-yr basis) annually (IEA, 2024). Based on these estimates, current composting adoption reduces annual methane emissions from landfills more than 16%.
Increasing adoption to low and high achievable levels could reduce the amount of OW going to landfills by up to 40% and avoid 32–50% of landfill emissions. Reaching our estimated adoption ceilings for Increase Centralized Composting and reduction-focused solutions like Reduce Food Loss and Waste could avoid all food-related landfill emissions.
These climate impacts can be considered underestimates of beneficial mitigation from increased composting since we did not quantify the carbon sequestration benefits of compost application and reduced synthetic fertilizer use. Our estimated climate impacts from composting are also an underestimate because we didn’t include decentralized composting.
In addition to OW from MSW, large-scale composting also requires agricultural biomass as a feedstock. Multiple climate solutions, in addition to Increase Centralized Composting, require biomass, and projected demand across solutions greatly exceeds supply. The deforestation that would be required to meet demand would produce emissions far greater than any mitigation gains from full deployment of these solutions (Searchinger, 2024). In addition to deforestation, there would also be costs and emissions incurred to transport biomass from where it is produced to where it can be processed and used. Thus, the estimated climate impacts presented here are only possible if feedstocks are prioritized for this solution. If feedstocks are instead prioritized for other climate solutions (see Interactions for examples), adoption and impact will be lower for this solution. It is not possible to set all biomass-dependent solutions to high adoption levels, add up their impacts, and determine an accurate combined emissions impact.
Additional Benefits
Income and Work
Composting creates more jobs than landfills or incinerators and can save money compared with other waste management options (Bekchanov & Mirzabaev, 2018; Farhidi et al., 2022; Platt et al., 2013; Zaman, 2016). It is less expensive to build and maintain composting plants than incinerators (Kawai et al., 2020). According to a survey of Maryland waste sites, composting creates twice as many jobs as landfills and four times as many jobs as incineration plants (Platt et al., 2013). Composting also indirectly sustains jobs in the distribution and use of compost products (Platt et al., 2013). Compost is rich in nutrients and can also reduce costs associated with synthetic fertilizer use in agriculture (Farhidi et al., 2022).
Health
Odors coming from anaerobic decomposition landfills, such as ammonia and hydrogen sulfide, are another source of pollutants that impact human well-being, which can be reduced by aerobic composting (Cai et al., 2018).
Equality
Reducing community exposure to air pollution from landfills through composting has implications for environmental justice (Casey et al., 2021; Nguyen et al., 2023). A large review of waste sites in the United States and Europe found that landfills are disproportionately located near populations with low socioeconomic status and near racially and ethnically marginalized neighborhoods (Marzutti et al., 2010). Reducing disproportionate exposures to air pollution from landfills may mitigate poor health outcomes in surrounding communities (Brender et al., 2011)
Land Resources
Compost provides an important soil amendment that adds organic matter and nutrients to soil, reducing the need for synthetic fertilizers (Urra et al., 2019; U.S. EPA, 2025). Healthy soils that are rich in organic matter can benefit the surrounding ecosystem and watershed and lead to more plant growth through improved water retention and filtration, improved soil quality and structure, and reduced erosion and nutrient runoff (Bell & Platt, 2014; Martinez-Blanco et al., 2013; U.S. EPA, 2025). By reducing the need for synthetic fertilizers and by improving soils’ ability to filter and conserve water, compost can also reduce eutrophication of water bodies (U.S. EPA, 2025). These soil benefits are partially dependent on how compost is sorted because there may be risks associated with contamination of microplastics and heavy metals (Manea et al., 2024; Urra et al., 2019).
Water Resources
For a description of water resources benefits, please see Land Resources above.
Air Quality
Composting can reduce air pollution such as CO₂, methane, volatile organic compounds, and particulate matter that is commonly released from landfills and waste-to-energy systems (Kawai et al., 2020; Nordahl et al., 2020; Siddiqua et al., 2022). An analysis comparing emissions from MSW systems found composting to have lower emissions than landfilling and other waste-to-energy streams (Nordahl et al., 2020). Composting can also reduce the incidence of landfill fires, which release black carbon and carbon monoxide, posing risks to the health and safety of people in nearby communities (Nguyen et al., 2023).
Risks
Before the composting process can start, feedstocks are sorted to remove potential contaminants, including nonbiodegradable materials such as metal and glass as well as plastics, bioplastics, and paper products (Kawai et al., 2020; Perez et al., 2023; Wilson et al., 2024). While most contaminants can be removed through a variety of manual and mechanical sorting techniques, heavy metals and microplastics can become potential safety hazards or reduce finished compost quality (Manea et al., 2024). Paper and cardboard should be separated from food and green waste streams because they often contain contaminants such as glue or ink, and they degrade more slowly than other OW, leading to longer processing time and lower-quality finished compost (Kawai et al., 2020; Krause et al., 2023).
Successful and safe composting requires careful monitoring of compost piles to avoid anaerobic conditions and ensure sufficient temperatures to kill pathogens and weed seeds (Amuah et al., 2022; Ayilara et al., 2020; Cao et al., 2023; Kawai et al., 2020; Manea et al., 2024). Anaerobic conditions within the compost pile increase GHGs emitted during composting. Poorly managed composting facilities can also pose safety risks for workers and release odors, leading to community backlash (Cao et al., 2023; Manea et al., 2024; UNEP, 2024). Regional standards, certifications, and composter training programs are necessary to protect workers from hazardous conditions and to guarantee a safe and effective compost product (Kawai et al., 2020). Community outreach and education on the benefits of separating waste and composting prevent “not-in-my-backyard” attitudes or “NIMBYism” (Brown, 2015; Platt & Fagundes 2018) that may lead to siting composting facilities further from the communities they serve (Souza, et al., 2023; Liu et al., 2018).
Interactions with Other Solutions
Reinforcing
Increased composting could positively impact annual cropping by providing consistent, high-quality finished compost that can reduce dependence on synthetic fertilizers and improve soil health and crop yields.
High-quality sorting systems also allow for synergies that benefit all waste streams and create flexible, resilient waste management systems. Improving waste separation programs for composting can have spillover effects that also improve other waste streams, such as recyclables, agricultural waste, or e-waste. Access to well-sorted materials can also help with nutrient balance for various waste streams, including agricultural waste.
Composting facilities require a reliable source of carbon-rich bulking material. Agricultural waste can be diverted to composting rather than burning to reduce emissions from crop residue burning.
Competing
Diverting OW from landfills will lead to lower landfill methane emissions and, therefore, less methane available to be captured and resold as revenue.
Composting uses wood, crop residues, and food waste as feedstocks (raw material). Because the total projected demand for biomass feedstocks for climate solutions exceeds the supply, not all solutions will be able to achieve their potential adoption. This solution is in competition with other climate solutions for raw material.
Dashboard
Solution Basics
t organic waste
t CO₂-eq (100-yr)/unit
02.53.9median
units/yr
Current 7.8×10⁷
02.009×10⁸3.01×10⁸
Achievable (Low to High)
Climate Impact
Gt CO₂-eq (100-yr)/yr
Current 0.3
0.781.2
US$ per t CO₂-eq
10
Emergency Brake
CO₂, CH₄
Trade-offs
Robust collection networks and source separation of OW are vital for successful composting, but they also increase investment costs. However, well-sorted OW can reduce the need for separation equipment and allow for simpler facility designs, leading to lower operational costs. The emissions from transporting OW are not included here, but are expected to be significantly less than the avoided landfill emissions. Composting facilities are typically located close to the source of OW (Kawai et al., 2020; U.S. Composting Council [USCC], 2008), but since centralized composting facilities are designed to serve large communities and municipalities, there can be trade-offs between sufficient land availability and distance from waste sources.
We also exclude emissions from onsite vehicles and equipment such as bulldozers and compactors, assuming that those emissions are small compared to the landfill itself.
t/person/yr
≤ 0.17
0.18–0.32
0.33–0.5
> 0.5
No Data
Per capita MSW generation, 2018
Annual generation of MSW per capita. Total global MSW generation exceeded 2 Gt/yr.
World Bank Group (2021). What a waste global database (Version 3) [Data set]. WBG. Retrieved March 6, 2025, from Link to source: https://datacatalog.worldbank.org/search/dataset/0039597
t/person/yr
≤ 0.17
0.18–0.32
0.33–0.5
> 0.5
No Data
Per capita MSW generation, 2018
Annual generation of MSW per capita. Total global MSW generation exceeded 2 Gt/yr.
World Bank Group (2021). What a waste global database (Version 3) [Data set]. WBG. Retrieved March 6, 2025, from Link to source: https://datacatalog.worldbank.org/search/dataset/0039597
Maps Introduction
Globally, 17 countries reported composting more than 1 Mt each of organic waste in 2018, with India, China, Germany, and France reporting more than 5 Mt each (World Bank, 2018). With the exception of Austria, which composted nearly all organic waste generated, even countries with established centralized composting could divert more organic waste to composting.
The fate from which composting diverts organic waste varies from region to region, but globally over 40% of all waste ends up in landfills. Since organic waste makes up the largest percentage of MSW in most regions, excluding North America, parts of East Asia and the Pacific, and parts of Europe and Central Asia, there is ample opportunity to increase composting. In East Asia and the Pacific, South Asia, and sub-Saharan Africa, diverting organics to composting also avoids disposal in waterways and open dumps, which reduces pollution. In North America and Europe and Central Asia, 15–20% of MSW is incinerated (Kaza et al., 2018), so diverting all organic waste to composting would avoid harmful incineration emissions including CO, NOx, and VOCs (Abedin et al., 2025; Global Alliance for Incinerator Alternatives, 2019; Liu et al., 2021; Nubi et al., 2024).
Diversion of organic waste requires separation of waste streams, and cities with better collection and tracking networks often have more robust composting programs. Higher quality and more frequent reporting on waste generation and disposal worldwide could improve source separation and increase composting. Additionally, city-level and decentralized pilot programs allow for better control over feedstock collection and can bolster support for larger scale, centralized operations.
Multiple cities in Latin America and the Caribbean represent a resurgence in composting markets . In the 1960s and 1970s, composting facilities were built in cities across Mexico, El Salvador, Ecuador, Venezuela, and Brazil, but many closed due to high operational costs (Ricci-Jürgensen et al., 2020a). In 2018, 15% of waste was recycled or composted in Montevideo, Uruguay, and Bogotá and Medellín, Colombia, and 10% of waste was composted in Mexico City, Mexico, and Rosario, Argentina (Kaza et al., 2018).
Waste generation is increasing globally, with the largest increases projected to occur in sub-Saharan Africa, South Asia, and the Middle East and North Africa (Kaza et al., 2018). As waste generation doubles or triples in these regions, sustainable disposal methods will become more critical for human health and well-being.
In 2018, Ethiopia reported the highest organic waste percentage in sub-Saharan Africa at 85% of MSW, but no composting (World Bank, 2018). Organic waste percentages are high in other countries in the region, so composting could be a valuable method to handle the growing waste stream. In the Middle East & North Africa, 43% of countries reported composting as of 2018 (Kaza et al., 2018), indicating the presence of infrastructure that could be scaled up to handle increased waste in the future.
Action Word
Increase
Solution Title
Centralized Composting
Classification
Highly Recommended
Lawmakers and Policymakers
- Establish zero waste and OW diversion goals; incorporate them into local or national climate plans and soil health and conservation policies.
- Ensure public procurement uses local compost when possible.
- Participate in consultations with farmers, businesses, and the public to determine where to place plants, how to use compost, pricing, and how to roll out programs.
- Establish or improve existing centralized composting facilities, collection networks, and storage facilities.
- Establish incentives and programs to encourage both centralized and decentralized composting.
- Work with farmers, local gardeners, the private sector, and local park systems to develop markets for compost.
- Invest in source separation education and waste separation technology that enhances the quality of final compost products.
- Regulate the use of waste separation technologies to prioritize source separation of waste and the quality of compost products.
- Ensure low- and middle-income households are served by composting programs with particular attention to underserved communities such as multi-family buildings and rural households.
- Enact extended producer responsibility approaches that hold producers accountable for waste.
- Create demonstration projects to show the effectiveness and safety of finished compost.
- Ensure composting plants are placed as close to farmland as possible and do not adversely affect surrounding communities.
- Streamline permitting processes for centralized compost facilities and infrastructure.
- Establish laws or regulations that require waste separation as close to the source as possible, ensuring the rules are effective and practical.
- Establish zoning policies that support both centralized and decentralized composting efforts, including at the industrial, agricultural, community, and backyard scales.
- Establish fees or fines for OW going to landfills; use funds for composting programs.
- Use financial instruments such as taxes, subsidies, or exemptions to support infrastructure, participation, and waste separation.
- Partner with schools, community gardens, farms, nonprofits, women’s groups, and other community organizations to promote composting and teach the importance of waste separation.
- Establish one-stop-shop educational programs that use online and in-person methods to teach how to separate waste effectively and why it’s important.
- If composting is not possible or additional infrastructure is needed, consider methane digesters as alternatives to composting.
- Create, support, or join certification programs that verify the quality of compost and/or verify food waste suppliers such as hotels, restaurants, and cafes.
Further information:
- Container Based Sanitation Alliance
- Composting and climate action plans: a guide for local solutions. Institute for Local Self-Reliance (2024)
- Government relations and public policy job function action guide. Project Drawdown (2022)
- Legal job function action guide. Project Drawdown (2022)
Practitioners
- Work with policymakers and local communities to establish zero-waste and OW diversion goals for local or national climate plans.
- Participate in consultations with farmers, policymakers, businesses, and the public to determine where to place plants, how to use compost, pricing, and how to roll out programs.
- Work with farmers, local gardeners, the private sector, and local park systems to create quality supply streams and develop markets for compost.
- Invest in source separation education and waste separation technology that enhances the quality of final compost products.
- Establish one-stop-shop educational programs that use online and in-person methods to teach how to separate waste effectively and why that’s important.
- Ensure low- and middle-income households are served by composting programs with particular attention to underserved communities such as multi-family buildings and rural households.
- Create demonstration projects to show the effectiveness and safety of finished compost.
- Ensure composting plants are placed as close to farmland as possible and do not adversely affect surrounding communities.
- Take advantage of financial incentives such as subsidies or exemptions to set up centralized composting infrastructure, increase participation, and improve waste separation.
- Partner with schools, community gardens, farms, nonprofits, women’s groups, and other community organizations to promote composting and teach the importance of waste separation.
- Consider partnerships through initiatives such as sister cities to share innovation and develop capacity.
- If additional infrastructure is needed, consider methane digesters as alternatives to composting.
- Create, support, or join certification programs that verify the quality of compost and/or verify food waste suppliers such as hotels, restaurants, and cafes.
Further information:
- Container Based Sanitation Alliance
- Composting and climate action plans: a guide for local solutions. Institute for Local Self-Reliance (2024)
Business Leaders
- Establish zero-waste and OW diversion goals; incorporate the goals into corporate net-zero strategies.
- Ensure procurement uses strategies to reduce FLW at all stages of the supply chain; consider using the Food Loss and Waste Protocol.
- Ensure corporate procurement and facilities managers use local compost when possible.
- Participate in consultations with farmers, policymakers, and the public to determine where to place plants, how to use compost, pricing, and how to roll out programs.
- Work with farmers, local gardeners, the private sector, and local park systems to develop markets for compost.
- Offer employee pre-tax benefits on materials to compost at home or participate in municipal composting programs.
- Offer financial services, including low-interest loans, microfinancing, and grants, to support composting initiatives.
- Support extended producer responsibility approaches that hold producers accountable for waste.
- Educate employees on the benefits of composting, include them in companywide waste diversion initiatives, and encourage them to use and advocate for municipal composting in their communities. Clearly label containers and signage for composting.
- Partner with schools, community gardens, farms, nonprofits, women’s groups, and other community organizations to promote composting and teach the importance of waste separation.
- Create, support, or join certification programs that verify the quality of compost and/or verify food waste suppliers such as hotels, restaurants, and cafes.
Further information:
- Container Based Sanitation Alliance
- Composting and climate action plans: a guide for local solutions. Institute for Local Self-Reliance (2024)
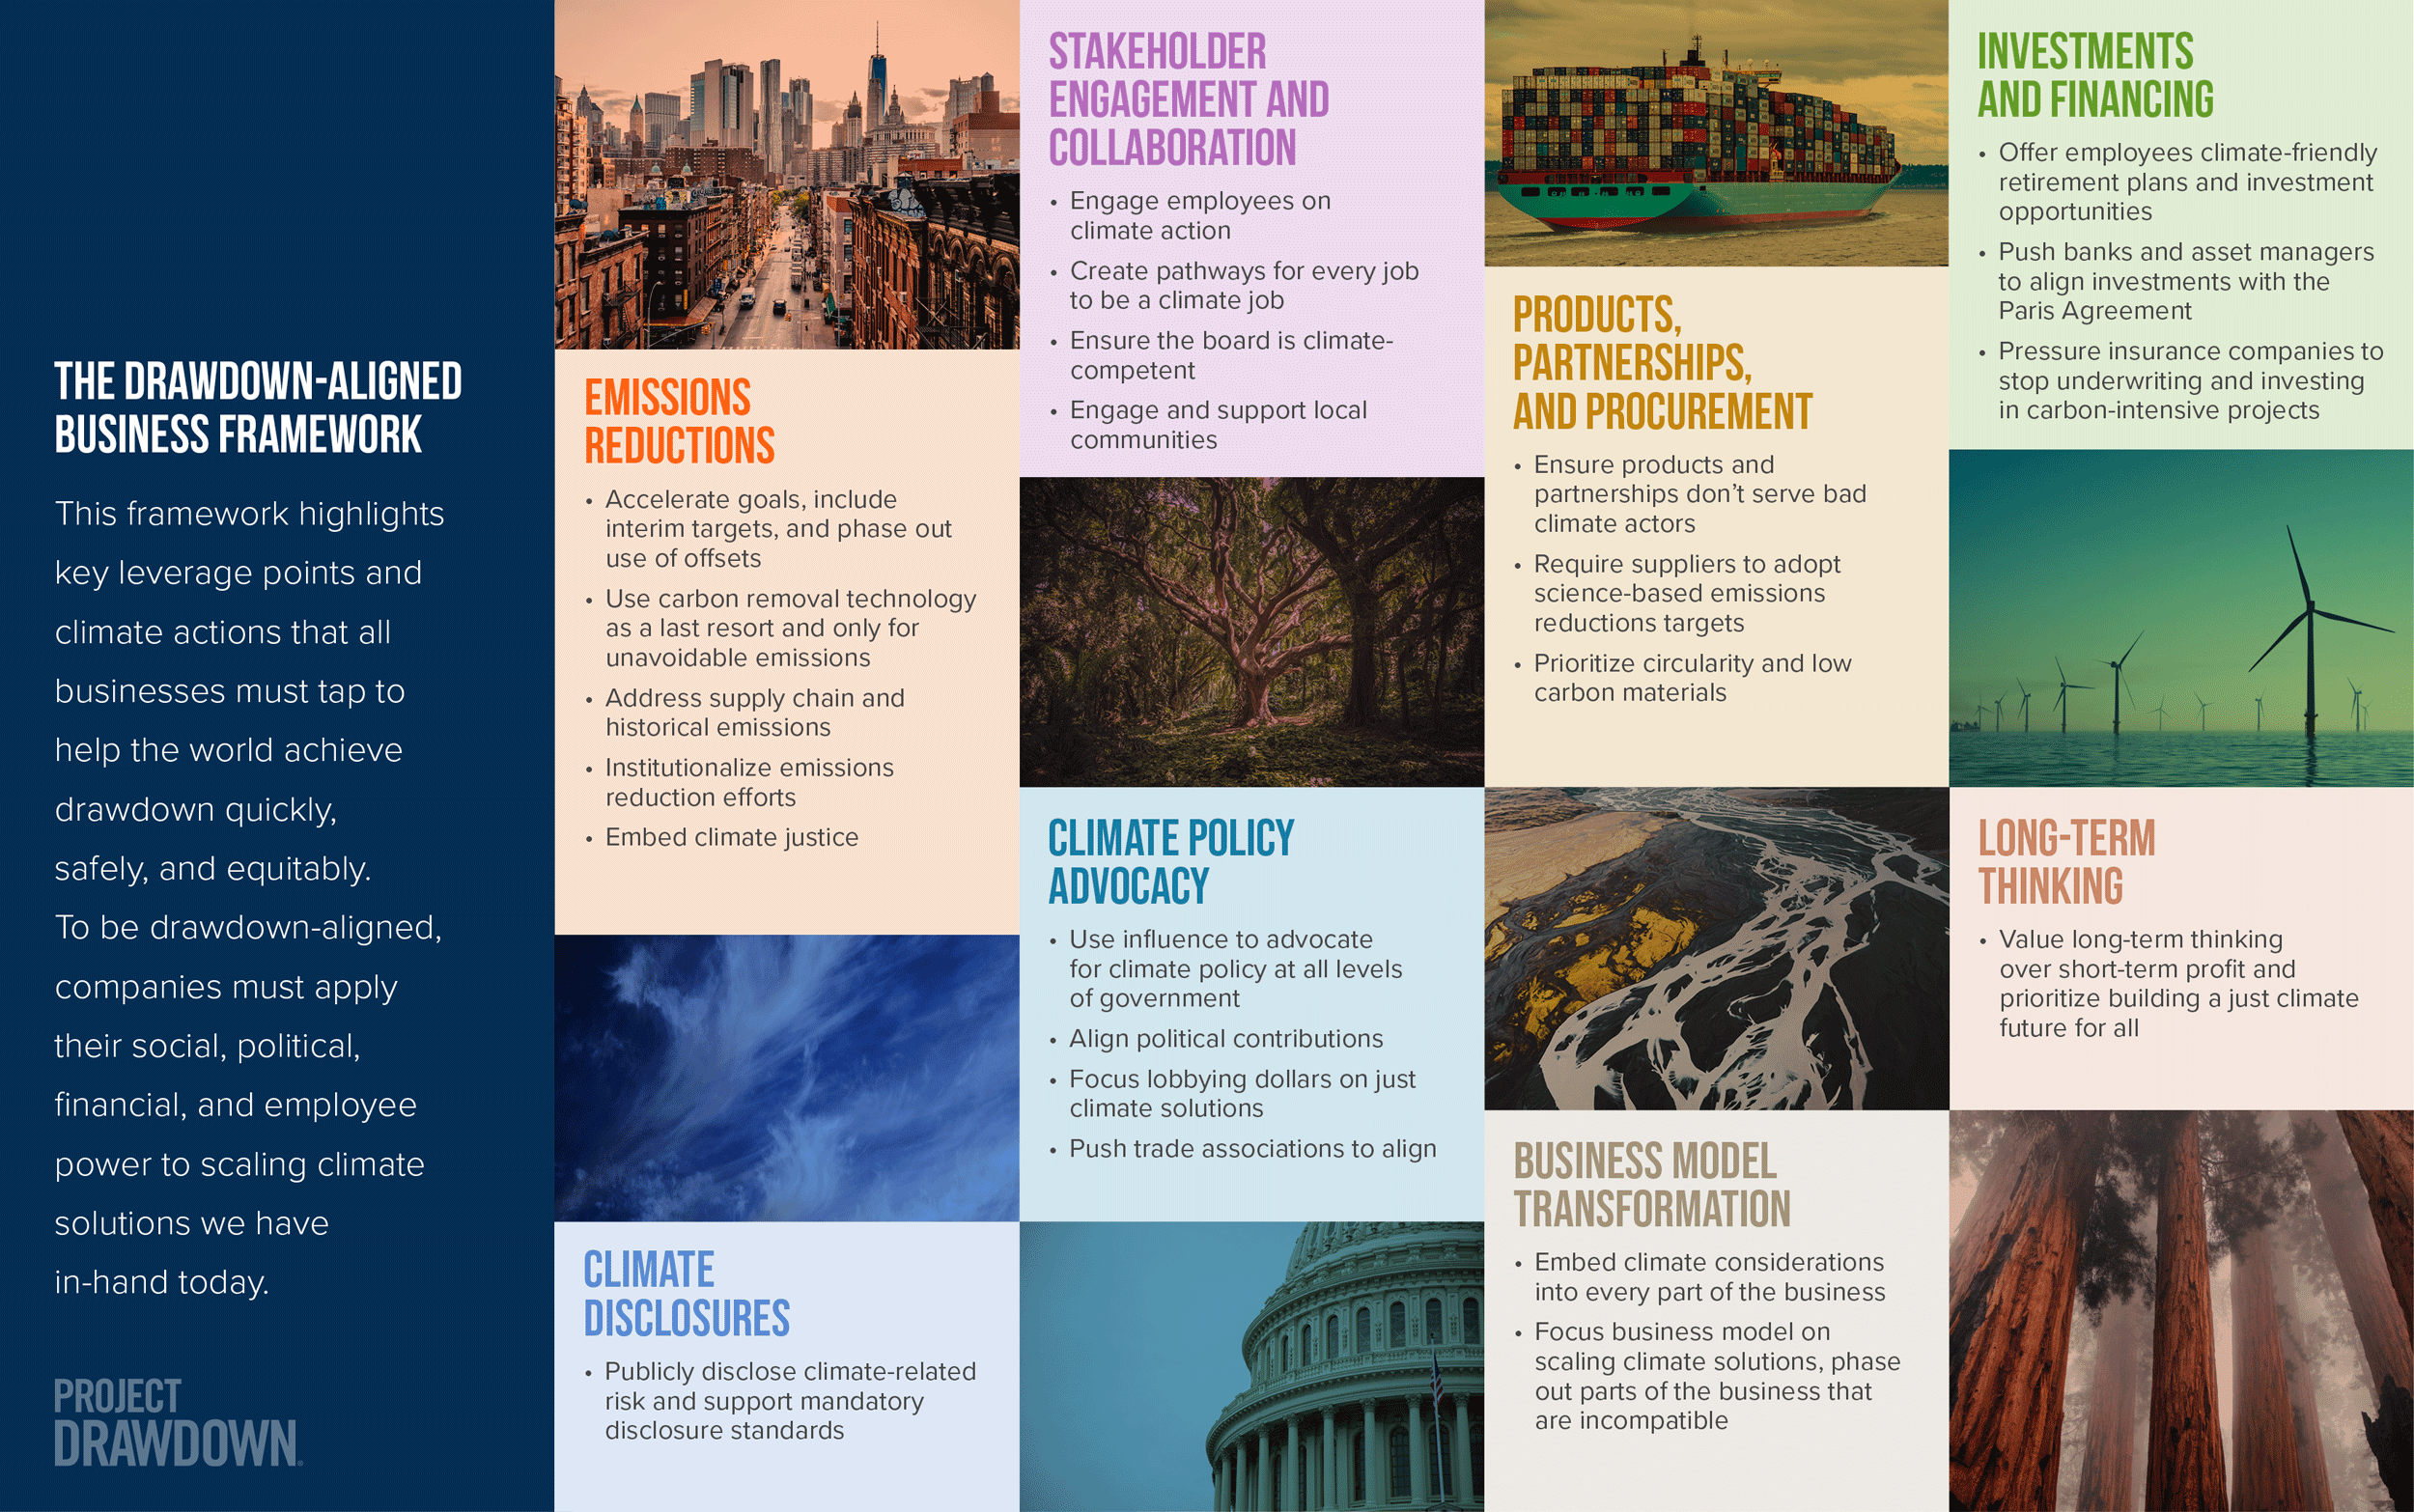
- Climate solutions at work. Project Drawdown (2021)
- Drawdown-aligned business framework. Project Drawdown (2021)
Nonprofit Leaders
- Help policymakers establish zero-waste and OW diversion goals; help incorporate them into local or national climate plans.
- Ensure organizational procurement uses local compost when possible.
- Help administer, fund, or promote local composting programs.
- Help gather data on local OW streams, potential markets, and comparisons of alternative uses such as methane digesters.
- Participate in consultations with farmers, policymakers, businesses, and the public to determine where to place plants, how to use compost, pricing, and how to roll out programs.
- Work with farmers, local gardeners, the private sector, and local park systems to develop markets for compost.
- Help ensure low- and middle-income households are served by composting programs with particular attention to underserved communities such as multi-family buildings and rural households.
- Advocate for extended producer responsibility approaches that hold producers accountable for waste.
- Advocate for laws or regulations that require waste separation as close to the source as possible, ensuring the rules are effective and practical.
- Create demonstration projects to show the effectiveness and safety of finished compost.
- Establish one-stop-shop educational programs that use online and in-person methods to teach how to separate waste effectively and why that’s important.
- Partner with schools, community gardens, farms, nonprofits, women’s groups, and other community organizations to promote composting and teach the importance of waste separation.
- Create, support, or join certification programs that verify the quality of compost and/or verify food waste suppliers such as hotels, restaurants, and cafes.
Further information:
- Container Based Sanitation Alliance
- Composting and climate action plans: a guide for local solutions. Institute for Local Self-Reliance (2024)
Investors
- Ensure relevant portfolio companies separate waste streams, contribute to compost programs, and/or use finished compost.
- Invest in companies developing composting programs or technologies that support the process, such as equipment, circular supply chains, and consumer products.
- Fund start-ups or existing companies that are improving waste separation technology that enhances the quality of final compost products.
- Offer financial services, including low-interest loans, microfinancing, and grants, to support composting initiatives.
- Invest in companies that adhere to extended producer responsibility or encourage portfolio companies to adopt the policies.
Further information:
- Container Based Sanitation Alliance
- Composting and climate action plans: a guide for local solutions. Institute for Local Self-Reliance (2024)
Philanthropists and International Aid Agencies
- Help policymakers establish zero-waste and OW diversion goals; help incorporate them into local or national climate plans.
- Advocate for businesses to establish time-bound and transparent zero-waste and OW diversion goals.
- Advocate for extended producer responsibility approaches that hold producers accountable for waste.
- Provide financing and capacity building for low- and middle-income countries to establish composting infrastructure and programs.
- Help administer, fund, or promote composting programs.
- Invest in companies developing composting programs or technologies that support the process, such as equipment, circular supply chains, and consumer products.
- Fund startups or existing companies that are improving waste separation technology that enhances the quality of final compost products.
- Incubate and fund mission-driven organizations and cooperatives that are advancing OW composting.
- Offer financial services, including low-interest loans, microfinancing, and grants, to support composting initiatives.
- Participate in consultations with farmers, policymakers, businesses, and the public to determine where to place plants, how to use compost, pricing, and how to roll out programs.
- Work with farmers, local gardeners, the private sector, and local park systems to develop markets for compost.
- Help ensure low- and middle-income households are served by composting programs, with particular attention to underserved communities such as multifamily buildings and rural households.
- Advocate for laws or regulations that require waste separation as close to the source as possible, ensuring the rules are effective and practical.
- Create demonstration projects to show the effectiveness and safety of finished compost.
- Research and enact effective composting promotional strategies.
- Establish one-stop-shop educational programs that use online and in-person methods to teach how to separate waste effectively and why that’s important.
- Partner with schools, community gardens, farms, nonprofits, women’s groups, and other community organizations to promote composting and teach the importance of waste separation.
- Create, support, or join certification programs that verify the quality of compost and/or verify food waste suppliers such as hotels, restaurants, and cafes.
Further information:
- Container Based Sanitation Alliance
- Composting and climate action plans: a guide for local solutions. Institute for Local Self-Reliance (2024)
Thought Leaders
- Participate in and promote centralized, community, or household composting programs, if available, and carefully sort OW from other waste streams.
- If no centralized composting system exists, work with local experts to establish household and community composting systems.
- Help policymakers establish zero-waste and OW diversion goals; help incorporate them into local or national climate plans.
- Start cooperatives that provide services and/or equipment for composting.
- Participate in consultations with farmers, policymakers, businesses, and the public to determine where to place plants, how to use compost, pricing, and how to roll out programs.
- Help gather data on local OW streams, potential markets, and comparisons of alternative uses such as methane digesters.
- Help develop waste separation technology that enhances the quality of final compost products and/or improve educational programs on waste separation.
- Develop innovative governance models for local composting programs; publicly document your experiences.
- Work with farmers, local gardeners, the private sector, and local park systems to develop markets for compost.
- Advocate for extended producer responsibility approaches that hold producers accountable for waste.
- Advocate for laws or regulations that require waste separation as close to the source as possible, ensuring the rules are effective and practical.
- Create demonstration projects to show the effectiveness and safety of finished compost.
- Create, support, or join certification programs that verify the quality of compost.
- Research various governance models for local composting programs and outline options for communities to consider.
- Research and enact effective composting campaign strategies.
- Create, support, or join certification programs that verify the quality of compost and/or verify food waste suppliers such as hotels, restaurants, and cafes.
Further information:
- Container Based Sanitation Alliance
- Composting and climate action plans: a guide for local solutions. Institute for Local Self-Reliance (2024)
Technologists and Researchers
- Quantify estimates of OW both locally and globally; estimate the associated potential compost output.
- Improve waste separation technology to improve the quality of finished compost.
- Create tracking and monitoring software for OW streams, possible uses, markets, and pricing.
- Research the application of AI and robotics for optimal uses of OW streams, separation, collection, distribution, and uses.
- Research various governance models for local composting programs and outline options for communities to consider.
- Research effective composting campaign strategies and how to encourage participation from individuals.
Further information:
- Container Based Sanitation Alliance
- Composting and climate action plans: a guide for local solutions. Institute for Local Self-Reliance (2024)
Communities, Households, and Individuals
- Participate in and promote centralized composting programs, if available, and carefully sort OW from other waste.
- If no centralized composting system exists, work with local experts to establish household and community composting systems.
- Participate in consultations with farmers, policymakers, and businesses to determine where to place plants, how to use compost, pricing, and how to roll out programs.
- Take advantage of educational programs, financial incentives, employee benefits, and other programs that facilitate composting.
- Advocate for extended producer responsibility approaches that hold producers accountable for waste.
- Advocate for laws or regulations that require waste separation, ensuring the rules are effective and practical.
- Partner with schools, community gardens, farms, nonprofits, women’s groups, and other community organizations to promote composting and teach the importance of waste separation.
- Create, support, or join certification programs that verify the quality of compost and/or verify food waste suppliers such as hotels, restaurants, and cafes.
Further information:
- Container Based Sanitation Alliance
- Composting and climate action plans: a guide for local solutions. Institute for Local Self-Reliance (2024)
“Take Action” Sources
- Unlocking on-farm composting: key drivers in Mexico City's peri-urban areas. Cotler et al. (2025)
- Composting and climate action plans: a guide for local solutions. Institute for Local Self-Reliance (2024)
- Does exposure enhance interest? An analysis of composting exposure on interest in household waste management. Rahman et al. (2025)
- How can public policy advance the composting industry? Truelove (2023)
- CCET guideline series on intermediate municipal solid waste treatment technologies: composting. UNEP (2020)
- Growing community-based composting programs in China. Xue et al. (2025)
Evidence Base
Consensus of effectiveness as a climate solution: High
Composting reduces OW, prevents pollution and GHG emissions from landfilled OW, and creates soil amendments that can reduce the use of synthetic fertilizers (Kaza et al., 2018; Manea et al., 2024). Although we do not quantify carbon sequestration from compost use in this analysis, a full life-cycle analysis that includes application could result in net negative emissions for composting (Morris et al., 2013).
Globally, the waste sector was responsible for an estimated 3.9% of total global GHG emissions in 2023, and solid waste management represented 36% of those emissions (IPCC, 2023; UNEP, 2024). Emissions estimates based on satellite and field measurements from landfills or direct measurements of carbon content in food waste can be significantly higher than IPCC Tier 1-based estimates. Reviews of global waste management estimated that food loss and food waste account for around 6% of global emissions or approximately 2.8 Gt CO₂‑eq/yr (Wilson et al., 2024; Zhu et al., 2023). Facility-scale composting reduces emissions 38–84% relative to landfilling (Perez et al., 2023), and monitoring and managing the moisture content, aeration, and carbon to nitrogen ratios can further reduce emissions (Ayilara et al., 2020).
Unclear legislation and regulation for MSW composting can prevent adoption, and there is not a one-size-fits-all approach to composting (Cao et al., 2023). Regardless of the method used, composting converts OW into a nutrient-rich resource and typically reduces incoming waste volumes 40–60% in the process (Cao et al., 2023; Kaza et al., 2018). A comparative cost and energy analysis of MSW components highlighted that while composting adoption varies geographically and economically, environmental benefits also depend on geography and income (Zaman, 2016). Food and green waste percentages of MSW are higher in lower-resourced countries than in high-income countries due to less packaging, and more than one-third of waste in high-income countries is recovered through recycling and composting (Kaza et al., 2018).
The results presented in this document summarize findings from 22 reports, 31 reviews, 12 original studies, two books, nine web articles, one fact sheet, and three data sets reflecting the most recent evidence for more than 200 countries and territories.
Appendix
Global MSW Generation and Disposal
Analysis of MSW in this section is based on the 2018 What a Waste 2.0 global dataset and report as well as the references cited in the report (Kaza et al., 2018; World Bank 2018). In 2018, approximately 2 Gt of waste was generated globally. Most of that went to landfills (41%) and open dumps (22%). Out of 217 countries and territories, 24 sent more than 80% of all MSW to landfills and 3 countries reported landfilling 100% of MSW. The average across all countries/territories was 28% of MSW disposed of in landfills. Both controlled and sanitary landfills with gas capture systems are included in the total landfilled percentage.
Approximately 13% of MSW was treated through recycling and 13% through incineration, but slightly more waste was incinerated than recycled per year. Incineration was predominately used in upper-middle and high-income countries with negligible amounts of waste incinerated in low- and lower-middle income countries.
Globally, only about 5% of MSW was composted and nearly no MSW was processed via methane digestion. However, OW made up nearly 40% of global MSW, so most OW was processed through landfilling, open dumping, and incineration all of which result in significant GHG emissions and pollution. There is ample opportunity to divert more OW from polluting disposal methods toward composting. Due to lack of data on open dumping, and since incineration only accounts for 1% of global GHG emissions, we chose landfilling as our baseline disposal method for comparison.
In addition to MSW, other waste streams include medical waste, e-waste, hazardous waste, and agricultural waste. Global agricultural waste generation in 2018 was more than double total MSW (Kaza et al., 2018). Although these specialized waste streams are treated separately from MSW, integrated waste management systems with high-quality source separation programs could supplement organic MSW with agricultural waste. Rather than being burned or composted on-farm, agricultural waste can provide bulking materials that are critical for maintaining moisture levels and nutrient balance in the compost pile, as well as scaling up composting operations.
Details of a Composting System and Process
Successful centralized composting starts with collection and separation of OW from other waste streams, ideally at the source of waste generation. Financial and regulatory barriers can hinder creation or expansion of composting infrastructure. Composting systems require both facilities and robust collection networks to properly separate OW from nonbiodegradable MSW and transport OW to facilities. Mixed waste streams increase contamination risks with incoming feedstocks, so separation of waste materials at the source of generation is ideal.
Establishing OW collection presents a financial and logistical barrier to increased composting adoption (Kawai et al., 2020; Kaza et al., 2018). However, when considering a full cost-chain analysis that includes collection, transportation, and treatment, systems that rely on source-separated OW can be more cost-effective than facilities that process mixed organics.
OW and inorganic waste can also be sorted at facilities manually or mechanically with automated techniques including electromagnetic separation, ferrous metal separation, and sieving or screening (Kawai et al., 2020). Although separation can be highly labor-intensive, it’s necessary to remove potential contaminants, such as plastics, heavy metals, glass, and other nonbiodegradable or hazardous waste components (Kawai et al., 2020; Manea et al., 2024). After removing contaminants, organic materials are pre-processed and mixed to achieve the appropriate combination of water, oxygen, and solids for optimal aerobic conditions during the composting process.
Regardless of the specific composting method used, aerobic decomposition is achieved by monitoring and balancing key parameters within the compost pile. Key parameters are moisture content, temperature, carbon-to-nitrogen ratio, aeration, pH, and porosity (Cao et al., 2023; Kawai et al., 2020; Manea et al., 2024). The aerobic decomposition process can be split into distinct stages based on whether mesophilic (active at 20–40 oC) or thermophilic (active at 40–70 oC) bacteria and fungi dominate. Compost piles are constructed to allow for sufficient aeration while optimizing moisture content (50–60%) and the initial carbon-to-nitrogen ratio (25:1–40:1), depending on composting method and feedstocks (Amuah et al., 2022; Manea et al, 2024). Optimal carbon-to-nitrogen ratios are achieved through appropriate mixing of carbon-rich “brown” materials, such as sawdust or dry leaves, with nitrogen-rich “green” materials, such as food waste or manure (Manea et al., 2024). During the thermophilic stage, temperatures exceeding 62 oC are necessary to kill most pathogens and weed seeds (Amuah et al., 2022; Ayilara et al., 2020).
Throughout the composting process key nutrients (nitrogen, phosphorus, potassium, calcium, magnesium, and sodium), are mineralized and mobilized and microorganisms release GHGs and heat as by-products of their activity (Manea et al., 2024; Nordahl et al., 2023). Water is added iteratively to maintain moisture content and temperature in the optimal ranges, and frequent turning and aeration are necessary to ensure microorganisms have enough oxygen. Without the proper balance of oxygen and water, anaerobic conditions can lead to higher methane emissions (Amuah et al., 2022; Manea et al., 2024). Although CO₂, methane, and nitrous oxide are released during the process, these emissions are significantly lower than associated emissions from landfilling (Ayilara et al., 2020; Cao et al., 2023; FAO, 2019; Perez et al., 2023).
Once aerobic decomposition is completed, compost goes through a maturation stage where nutrients are stabilized before finished compost can be sold or used as a soil amendment. In stable compost, microbial decomposition slows until nutrients no longer break down, but can be absorbed by plants. Longer maturation phases reduce the proportion of soluble nutrients that could potentially leach into soils.
The baseline waste management method of landfilling OW is cheaper than composting; however it also leads to significant annual GHG emissions. Composting, although more expensive due to higher labor and operating costs, reduces emissions and produces a valuable soil amendment. Establishing a composting program can have significant financial risks without an existing market for finished compost products (Bogner et al., 2007; Kawai et al., 2020; UNEP, 2024).
Example Calculation of Achievable Adoption
In 2018, Austria had the highest composting rate of 31.2%, and Vietnam composted 15% of MSW (World Bank, 2018).
For low adoption, we assumed composting increases by 25% of the existing rate or until all OW in MSW is composted. In Austria, OW made up 31.4% of MSW in 2018, so the Adoption – Low composting rate was 31.4%. In Vietnam, the Adoption – Low composting rate came out to 18.75%, which is still less than the total OW percentage of MSW (61.9%).
For high adoption, we assumed that composting rates increase by 50% of the existing rate or until all OW in MSW is composted. So high adoption in Austria remains 31.4% (i.e., all OW generated in Austria is composted). In Vietnam, the high adoption composting rate increases to 22.5% but still doesn’t capture all OW generated (61.9% of MSW).
Updated Date
Coming Soon Label
Coming Soon
Improve Refrigerant Management
Sector
Buildings & Industry
Mode
Cut Emissions
Cluster
Cut Fugitive Emissions
Image
Image
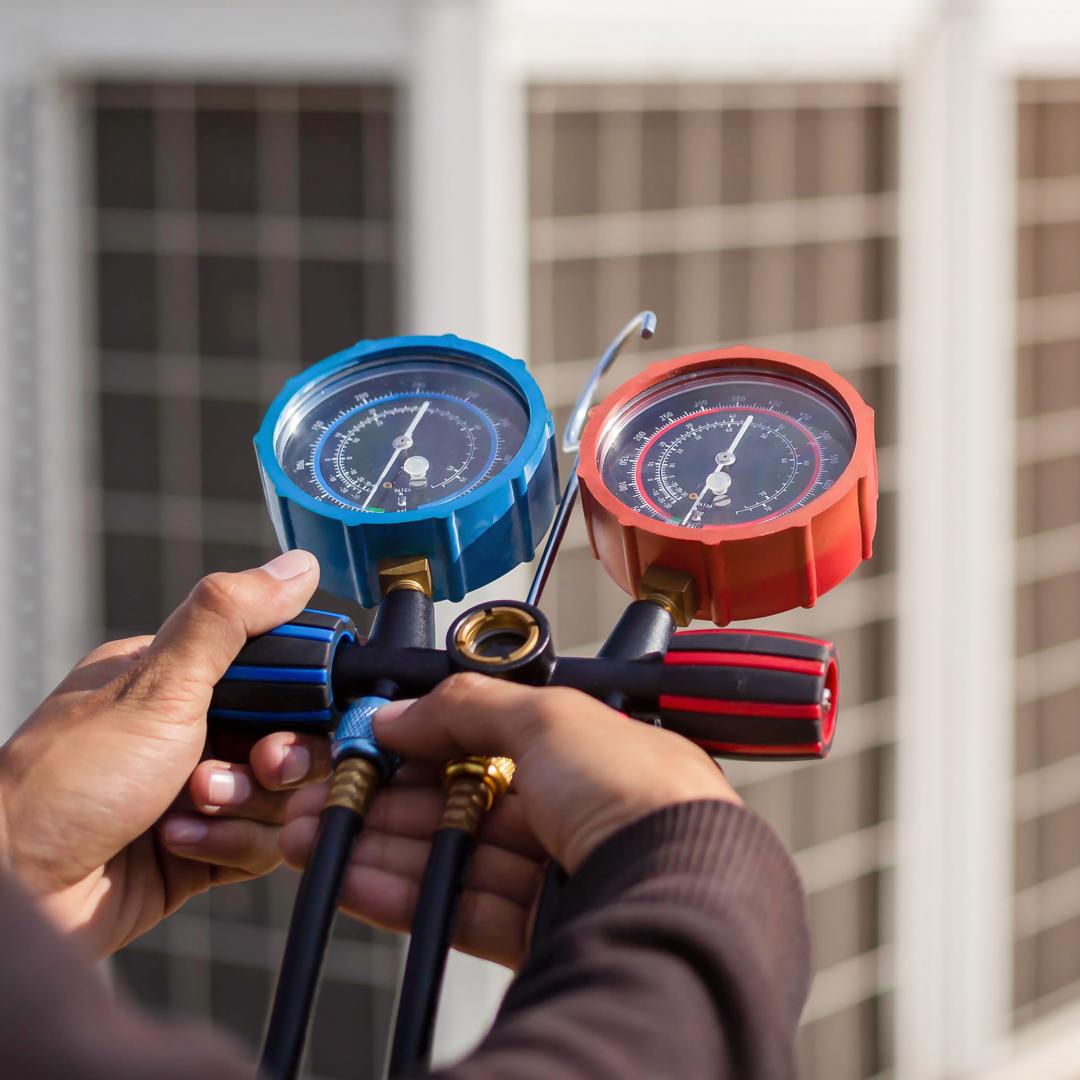
Coming Soon
On
Key Takeaways
- Refrigerant chemicals with high global warming potential (GWP) can escape to the atmosphere when equipment leaks or is disposed of improperly.
- Preventing refrigerant leaks during installation, use, and maintenance can avoid 0.3–0.5 Gt CO₂‑eq of emissions annually. Reusing or destroying refrigerant can prevent 0.34–0.52 Gt CO₂‑eq of emissions annually.
- Improve Refrigerant Management is an emergency brake climate solution, meaning it has a high near-term climate impact.
- Preventing refrigerant emissions reduces air pollution, PFAS accumulation, and release of ozone-harming chemicals.
- Few countries require or enforce refrigerant management; stronger policy action could advance this solution.
Summary
Improving refrigerant management involves deploying practices and technologies that reduce the amount of climate-warming refrigerant chemicals escaping into the atmosphere from air conditioning, refrigeration, and heat pump equipment. This solution has two components: reducing refrigerant leaks during refrigerant charging and use, and recovering refrigerant to prevent its release from end-of-life equipment. These activities reduce direct emissions of fluorinated gas (F-gas) refrigerants, many of which have high global warming potentials (GWPs) and contribute strongly to near-term climate warming.
Overview
Refrigerants are chemicals that can absorb and release heat as they move between gaseous and liquid states under changing pressure. They are used in equipment such as refrigerators, air conditioners, and heat pumps. Most refrigerants in modern equipment are F-gases with high GWPs, meaning that they trap hundreds to thousands times more heat in the atmosphere than CO₂. Since many refrigerants are short-lived climate pollutants, any potent warming impacts are concentrated in the near term; therefore, preventing refrigerant release is an “emergency brake” climate solution.
The Montreal Protocol has mostly phased out production and consumption of high-GWP F-gas refrigerants that harm the ozone layer, including chlorofluorocarbons (CFCs) and hydrochlorofluorocarbons (HCFCs) (Montreal Protocol on Substances That Deplete the Ozone Layer, 1987). However, large quantities remain stored in existing equipment (Lickley et al., 2022).
The subsequent generation of refrigerants, hydrofluorocarbons (HFCs), do not harm the ozone layer but are powerful GHGs. The Kigali Amendment to the Montreal Protocol is beginning to phase these out as well (Amendment to the Montreal Protocol on Substances That Deplete the Ozone Layer, 2016).
Global warming from refrigerant use can be reduced by:
- using refrigerants with lower GWPs
- reducing leaks during equipment manufacturing, transport, installation, use, and maintenance
- preventing release at equipment end-of-life by recovering refrigerant and destroying or reusing it
- using less refrigerant through efficiency improvements, smaller refrigerant charge sizes, or reduction in demand.
The use of lower-GWP refrigerant chemicals, including both medium- and ultra-low-GWP replacements, is covered in Deploy Alternative Refrigerants. Improve Refrigerant Management includes leak reduction and responsible end-of-life management of CFC, HCFC, and HFC refrigerants (Figure 1):
- leak reduction during equipment use and refrigerant charging, including equipment design improvements, leak testing, leak detection, and installation and maintenance improvements
- end-of-life management of used refrigerant, including training on proper recovery, improved access to specialized recovery and destruction equipment, reverse supply chain infrastructure, and testing to identify refrigerant composition.
Figure 1. Life-cycle pathways that refrigerant can take when used in refrigeration, air conditioning, and heat pump equipment. Effective management helps keep refrigerant from entering the atmosphere during install and use-and-maintenance (leak reduction) and end-of-life stages. Modified from Benedetti, 2023.
Image
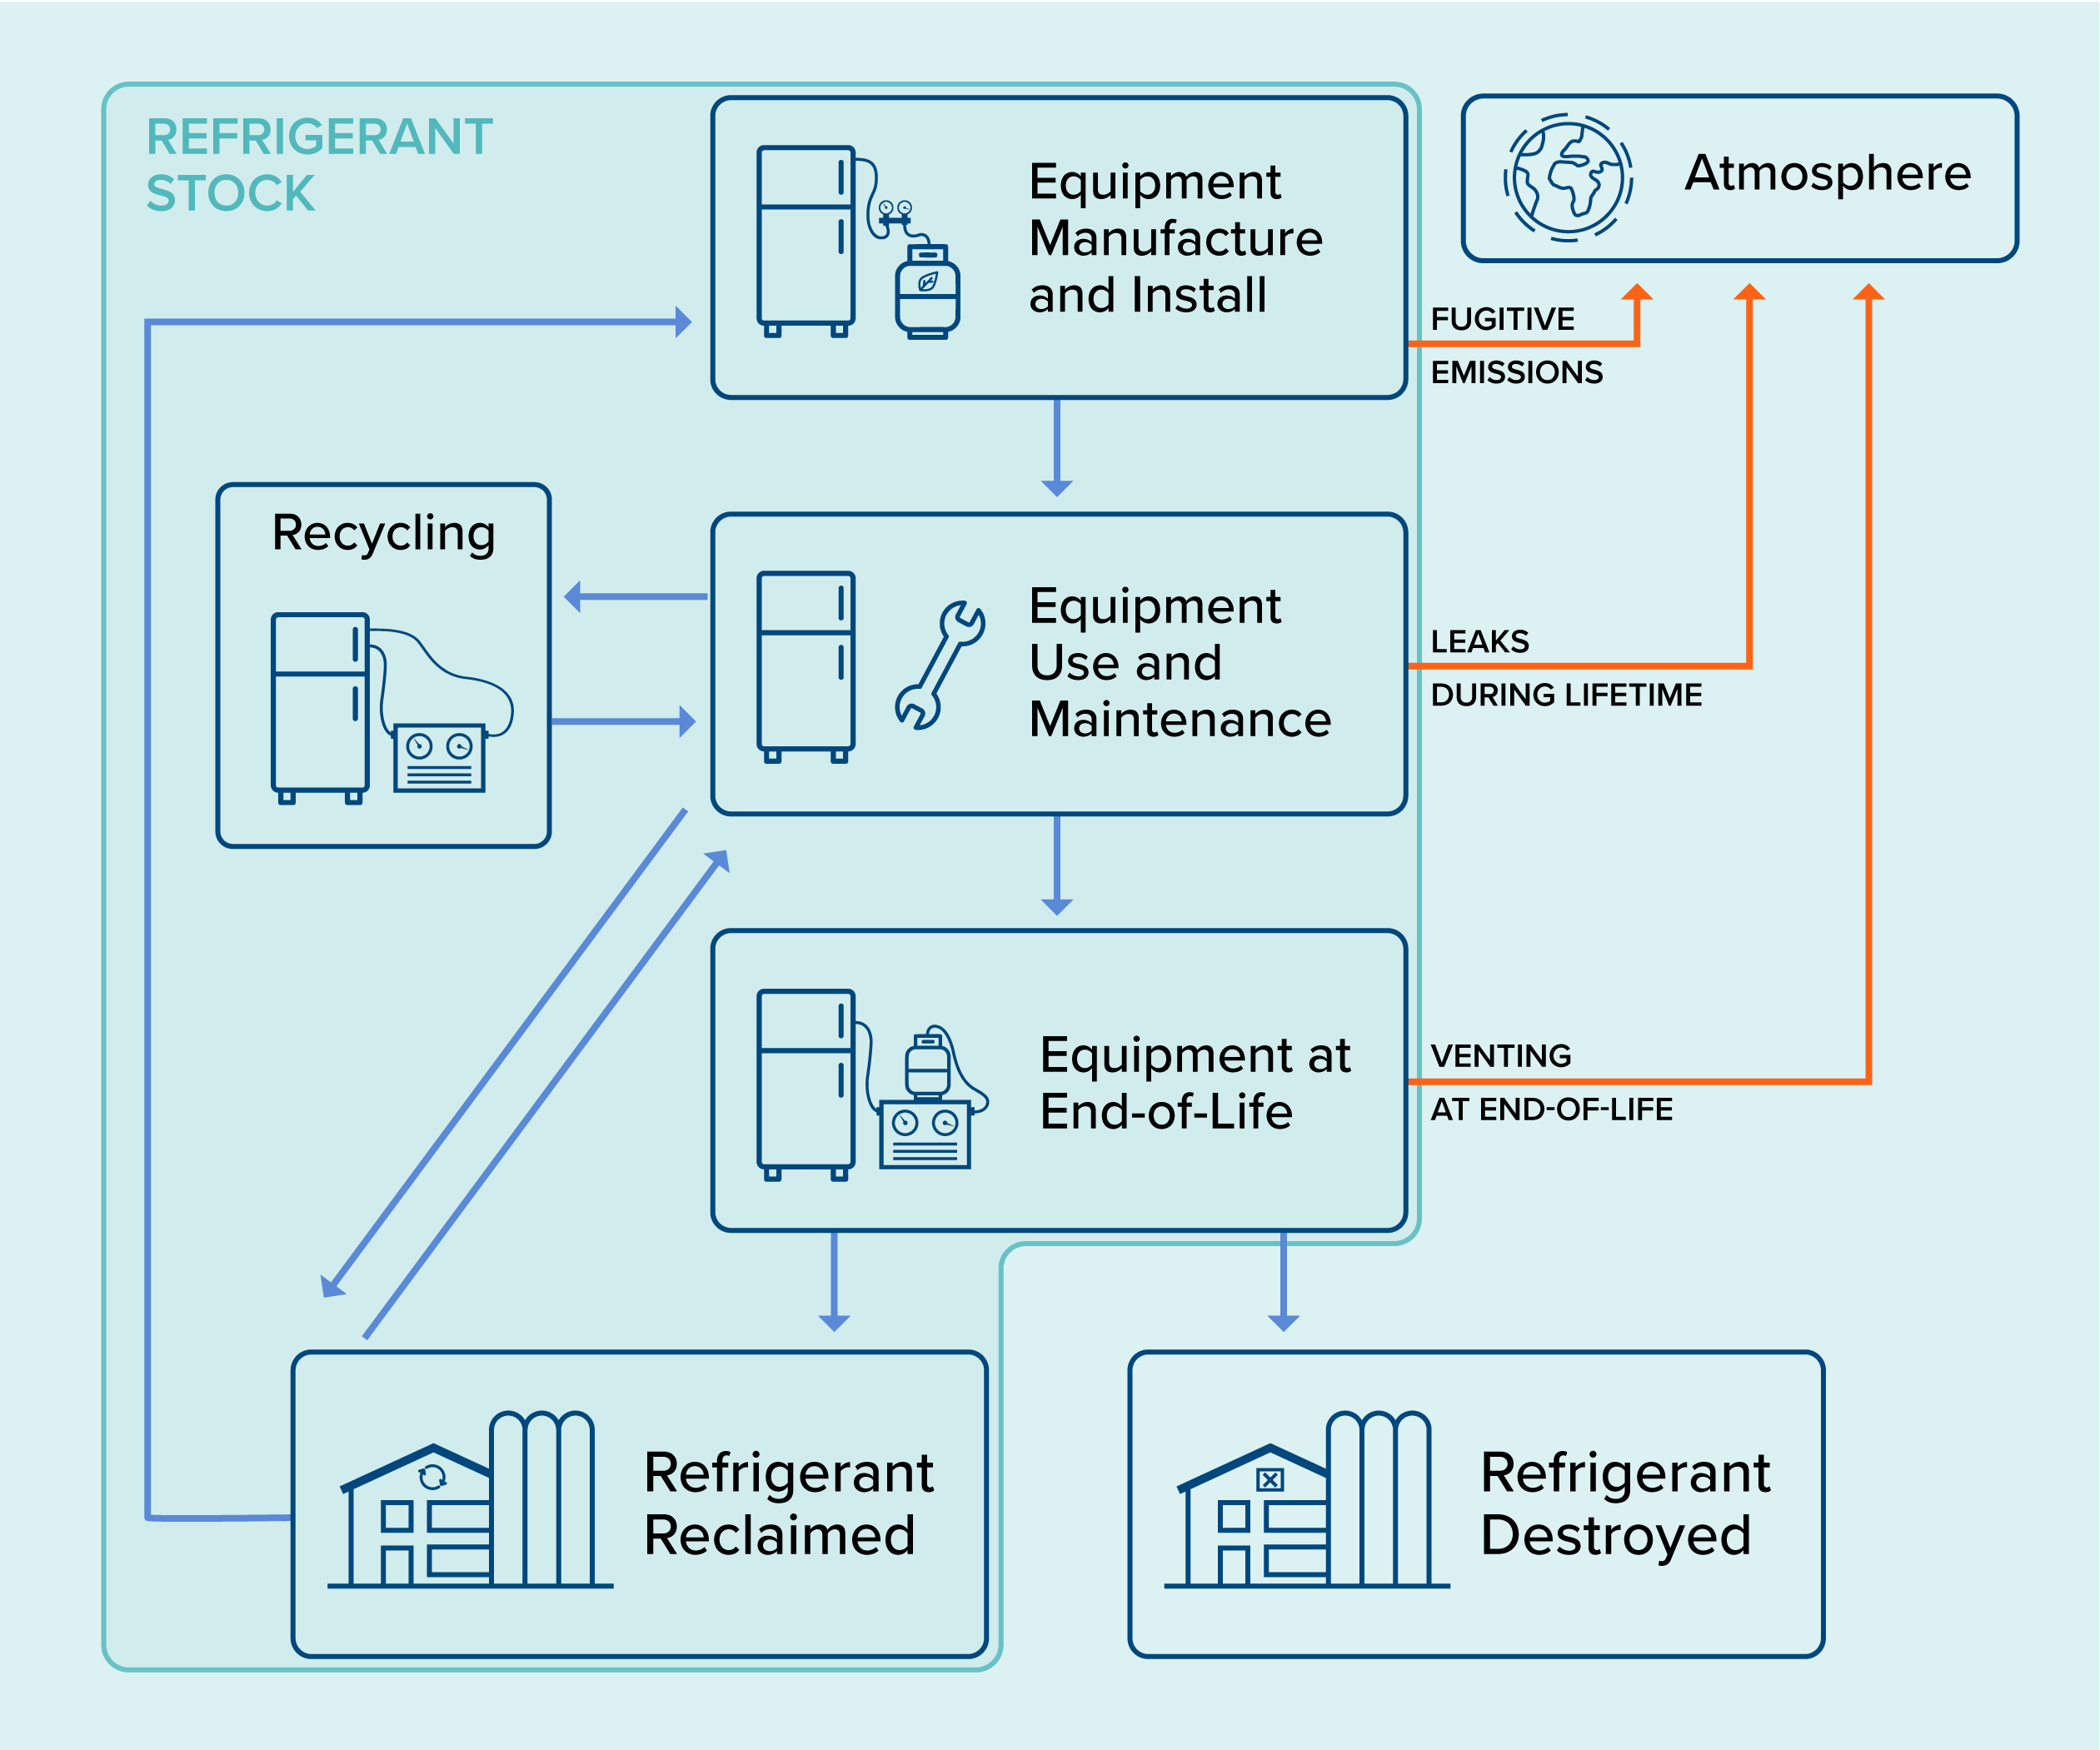
Source: Benedetti, C. (2023, November). Lifecycle refrigerant management actions. Yale Carbon Containment Lab.
Responsible end-of-life management includes two practices (Peixoto & Dhont, 2024):
- Recovery and reuse: collection and storage of refrigerants (recovery) followed by either recycling or reclaiming refrigerant for reuse in equipment. Recycling usually involves immediate reuse after filtering and drying and can also be done during equipment servicing. If the refrigerant is treated, purified, and filtered more extensively, this is called reclamation.
- Recovery and destruction: collection and storage of refrigerants followed by permanently chemically transforming or decomposing them (Vehlow & Gloël, 2020).
The preferred end-of-life pathway will depend on the type of refrigerant and equipment, as well as the regional market and policy conditions. For example, if a country is still producing HFCs, recovery and reuse may be prioritized to reduce virgin HFC production.
Since high-GWP refrigerant chemicals exist in large quantities today and phase-out will take decades, reducing GHG emissions from stockpiles now through refrigerant management will have an immediate and large benefit to the climate. The role of refrigerant management in reducing these emissions will decrease as lower-GWP alternative refrigerants become more prevalent in active and disposed equipment, but the near-term climate benefits make refrigerant management a critical action.
References
Abdelaziz, O., Polonara, F., Peixoto, R., & Kuijpers, L. (2023). Refrigeration, Air Conditioning and Heat Pumps Technical Options Committee: 2022 assessment report. United Nations Environment Programme. Link to source: https://iifiir.org/en/fridoc/montreal-protocol-on-substances-that-deplete-the-ozone-layer-2022-146932
ACR. (2022). Methodology for the quantification, monitoring, reporting and verification of greenhouse gas emission reductions and removals from certified reclaimed HFC refrigerants, propellants, and fire suppressants (Version 2.0). Link to source: https://acrcarbon.org/methodology/certified-reclaimed-hfc-refrigerants-propellants-and-fire-suppressants/
Amendment to the Montreal Protocol on substances that deplete the ozone layer. (2016, October 15). Link to source: https://treaties.un.org/doc/Treaties/2016/10/20161015%2003-23%20PM/Ch_XXVII-2.f-English%20and%20French.pdf
Ashford, P., & Kuijpers, L. (2009). Report of the Technology and Economic Assessment Panel: Task Force decision XX/7 report on environmentally sound management of banks of ozone-depleting substances. United Nations Environment Programme. Link to source: https://ozone.unep.org/sites/default/files/2019-05/teap-june-2009-decisionXX-7-task-force-report.pdf
Babiker, M., Berndes, G., Blok, K., Cohen, B., Cowie, A., Geden, O., Ginzburg, V., Leip, A., Smith, P., Sugiyama, M., & Yamba, F. (2023). Cross-sectoral perspectives. In P. R. Shukla, J. Skea, R. Slade, A. Al Khourdajie, R. van Diemen, D. McCollum, M. Pathak, S. Some, P. Vyas, R. Fradera, M. Belkacemi, A. Hasija, G. Lisboa, S. Luz, & J. Malley (Eds.), Climate change 2022: Mitigation of climate change. Contribution of working group III to the sixth assessment report of the Intergovernmental Panel on Climate Change (pp. 1245–1354). Cambridge University Press; Cambridge Core. Link to source: https://doi.org/10.1017/9781009157926.014
Benedetti, C. (2023). Lifecycle refrigerant management actions. Yale Carbon Containment Lab. Link to source: https://carboncontainmentlab.org/publications/lrm-mop-35
Bolaji, B. O., & Huan, Z. (2013). Ozone depletion and global warming: Case for the use of natural refrigerant – a review. Renewable and Sustainable Energy Reviews, 18, 49–54. Link to source: https://doi.org/10.1016/j.rser.2012.10.008
Chao, T., Crotty, S., Mayhew, C., Phillips, E., O’Rourke, A., & Takahashi, D. (2024). Recovery and destruction of hydrofluorocarbon refrigerant gases in Article 5 countries. Carbon Containment Lab. Link to source: https://carboncontainmentlab.org/documents/draft-methodology-for-recovery-and-destruction-of-hydrofluorocarbons-in-article-5-countries_v2.1.pdf
Chele, F. S., Salvador, C., Stevenson, L., Dolislager, F., Armstrong, A., Power, S., Mathews, T., & Yana Motta, S. F. (2024). Critical literature review of low global warming potential (GWP) refrigerants and their environmental impact. Oak Ridge National Laboratory. Link to source: https://www.osti.gov/servlets/purl/2528023
Dimitrakopoulou, M.-E., Karvounis, M., Marinos, G., Theodorakopoulou, Z., Aloizou, E., Petsangourakis, G., Papakonstantinou, M., & Stoitsis, G. (2024). Comprehensive analysis of PFAS presence from environment to plate. Npj Science of Food, 8(1), 80. Link to source: https://doi.org/10.1038/s41538-024-00319-1
Dong, Y., Coleman, M., & Miller, S. A. (2021). Greenhouse gas emissions from air conditioning and refrigeration service expansion in developing countries. Annual Review of Environment and Resources, 46, 59–83. Link to source: https://doi.org/10.1146/annurev-environ-012220-034103
Dreyfus, G., Wei, M., Shah, N., & Taddonio, K. (2023). Ambitious replenishment of the Multilateral Fund for Implementation of the Montreal Protocol delivers high impact climate benefits at low cost. Institute For Governance & Sustainable Development & Lawrence Berkeley National Laboratory. Link to source: https://www.igsd.org/publications/ambitious-replenishment-of-the-multilateral-fund-for-implementation-of-the-montreal-protocol-delivers-high-impact-climate-benefits-at-low-cost/
Environmental Investigation Agency (2024). Polluting the Protocol: How carbon trading undermines the Montreal Protocol on Substances that Deplete the Ozone Layer. Link to source: https://eia.org/wp-content/uploads/2024/10/2024-EIA-MOP36-Polluting-the-Protocol-2.pdf
Environmental Investigation Agency. (2025). Persistent problems: The hidden impacts of hydrofluoroolefins, the latest generation of fluorinated gases. Link to source: https://eia.org/report/persistent-problems/
Eunomia Research & Consulting Ltd & Centre for Air Conditioning and Refrigeration Research. (2014). Impacts of leakage from refrigerants in heat pumps. U.K. Department of Energy and Climate Change. Link to source: https://eunomia.eco/reports/impacts-of-leakage-from-refrigerants-in-heat-pumps/
Fenton, S. E., Ducatman, A., Boobis, A., DeWitt, J. C., Lau, C., Ng, C., Smith, J. S., & Roberts, S. M. (2021). Per- and polyfluoroalkyl substance toxicity and human health review: Current state of knowledge and strategies for informing future research. Environmental Toxicology and Chemistry, 40(3), 606–630. Link to source: https://doi.org/10.1002/etc.4890
Food and Agriculture Organization of the United Nations. (2019). The state of food and agriculture 2019: Moving forward on food loss and waste reduction. Link to source: https://openknowledge.fao.org/server/api/core/bitstreams/11f9288f-dc78-4171-8d02-92235b8d7dc7/content
Goetzler, W., Guernsey, M., Young, J., Fuhrman, J., & Abdelaziz, O. (2016). The future of air conditioning for buildings. U.S. Department of Energy, Office of Energy Efficiency and Renewable Energy, Building Technologies Office. Link to source: https://www.osti.gov/biblio/1420235
Government of Japan (2025). Sharing information on activities related to life-cycle refrigerant management, pursuant to para 3 of Decision XXXVI/2. Link to source: https://ozone.unep.org/sites/default/files/additional-reported-information/decisionXXXVI2/Japan.pdf
Hanson, M. L., Madronich, S., Solomon, K., Sulbaek Andersen, M. P., & Wallington, T. J. (2024). Trifluoroacetic acid in the environment: Consensus, gaps, and next steps. Environmental Toxicology and Chemistry, 43(10), 2091–2093. Link to source: https://doi.org/10.1002/etc.5963
Heubes, J., Gloël, J., & Papst, I. (2017). Global roadmap on ODS bank management: Management and destruction of existing ozone depleting substances banks. Deutsche Gesellschaft für Internationale Zusammenarbeit (GIZ) GmbH. Link to source: https://www.international-climate-initiative.com/en/iki-media/publication/global_roadmap_on_ods_bank_management/
Japan Ministry of the Environment. (2025). Report on measureable outcomes of fluorocarbons in Japan in FY2023. Link to source: https://drive.google.com/file/d/19XaFRdoJqw6Jn8vI9rM4e3GjE_8JUHHN/view
Lickley, M. J., Daniel, J. S., Fleming, E. L., Reimann, S., & Solomon, S. (2022). Bayesian assessment of chlorofluorocarbon (CFC), hydrochlorofluorocarbon (HCFC) and halon banks suggest large reservoirs still present in old equipment. Atmospheric Chemistry and Physics, 22(17), 11125–11136. Link to source: https://doi.org/10.5194/acp-22-11125-2022
Liu, H., Duan, H., Zhang, N., Ma, Y., Liu, G., Miller, T. R., Mao, R., Xu, M., Li, J., & Yang, J. (2024). Rethinking time-lagged emissions and abatement potential of fluorocarbons in the post-Kigali Amendment era. Nature Communications, 15(1), 6687. Link to source: https://doi.org/10.1038/s41467-024-51113-2
Maranion, B., Pizano, M., & Woodcock, A. (2025). Report of the Technology and Economic Assessment Panel: Volume 1: Progress report. United Nations Environment Programme. Link to source: https://ozone.unep.org/system/files/documents/TEAP-May2025-Progress-Report-vol1.pdf
Maranion, B., Pizano, M., & Woodcock, A. (2026). Report of the Technology and Economic Assessment Panel: Volume 1: Progress report. United Nations Environment Programme. Link to source: https://ozone.unep.org/system/files/documents/TEAP-May2026-Progress-Report-vol1.pdf
Mayhew, C., Chao, T., & O’Rourke, A. (2023). Lifecycle refrigerant management: Maximizing the atmospheric and economic benefits of the Montreal Protocol. Yale Carbon Containment Lab. Link to source: https://carboncontainmentlab.org/publications/lrm-mop-35
Montreal protocol on substances that deplete the ozone layer. (1987, September 16). Link to source: https://treaties.un.org/doc/publication/unts/volume%201522/volume-1522-i-26369-english.pdf
Ohnishi, K., Tope, H., & Zhang, J. (2022). Report of the Medical and Chemical Technical Options Committee: 2022 assessment report. United Nations Environment Programme. Link to source: https://ozone.unep.org/node/13470
Öko-Recherche. (2025). Monitoring of refrigerant prices on the EU market: Results of quarterly survey: Quarter 4/2025. Link to source: https://climate.ec.europa.eu/document/download/bed3e33e-3c12-4f6d-99c3-b1694418c4de_en?filename=Price%20monitoring%20Q4_2025.pdf
Ozone Secretariat. (2015). Fact sheet 2: Overview of HFC market sectors. United Nations Environment Programme. Link to source: https://ozone.unep.org/sites/ozone/files/Meeting_Documents/HFCs/FS_2_Overview_of_HFC_Markets_Oct_2015.pdf
Ozone Secretariat. (2026). Country data: Destruction of controlled substances [Dataset]. United Nations Environment Programme. Link to source: https://ozone.unep.org/countries/data
Peixoto, R., & Dhont, H. (2024). Report of the Technology and Economic Assessment Panel: Decision XXXV/11 Task Force report on life cycle refrigerant management. United Nations Environment Programme. Link to source: https://ozone.unep.org/system/files/documents/TEAP-May2024-DecXXXV-11-TF-Report.pdf
Purohit, P., Chao, T., Cooke, R., Dhont, H., Kaur, R., Peixoto, R., Walter-Terrinoni, H., & Woodcock, A. (2025). The importance of lifecycle refrigerant management in climate and ozone protection. Sustainability, 17(1), 53. Link to source: https://doi.org/10.3390/su17010053
Sachar, S., Campbell, I., & Kalanki, A. (2018). Solving the global cooling challenge: How to counter the climate threat from room air conditioners. Rocky Mountain Institute. Link to source: https://rmi.org/wp-content/uploads/2018/11/Global_Cooling_Challenge_Report_2018.pdf
Salawitch, R. J., Fahey, D. W., Hegglin, M. I., McBride, L. A., Tribett, W. R., & Doherty, S. J. (2019). Twenty questions and answers about the ozone layer: 2018 update, scientific assessment of ozone depletion: 2018. World Meteorological Organization. Link to source: https://csl.noaa.gov/assessments/ozone/2018/twentyquestions/
SuperCool Asia Pacific. (2022). Refrigerated display cabinet report UTR-165 (No. 200012551). Link to source: https://www.dcceew.gov.au/environment/protection/ozone/publications/bench-testing-results-refrigeration-air-conditioning-equipment
Theodoridi, C., Hillbrand, A., Starr, C., Mahapatra, A., & Taddonio, K. (2022). The 90 billion ton opportunity: Lifecycle refrigerant management. Environmental Investigation Agency, Institute for Governance & Sustainable Development, & Natural Resources Defense Council. Link to source: https://eia.org/report/20221020-the-90-billion-ton-opportunity/
Tope, H., & Walter-Terrinoni, H. (2018). Report of the Technology and Economic Assessment Panel: Volume 1: Decision XXIX/4 TEAP Task Force report on destruction technologies for controlled substances (addendum to the May 2018 supplemental report – revision). United Nations Environment Programme. Link to source: https://ozone.unep.org/sites/default/files/2019-04/TEAP-DecXXIX4-TF-Addendum-to-May2018-Report_September2018.pdf
United Nations Environment Programme. (2011). 2010 assessment report of the Technology and Economic Assessment Panel. Link to source: https://ozone.unep.org/node/3701
U.S. Environmental Protection Agency. (2019). Global non-CO2 greenhouse gas emission projections & marginal abatement cost analysis: Methodology documentation. Link to source: https://www.epa.gov/sites/default/files/2019-09/documents/nonco2_methodology_report.pdf
U.S. Environmental Protection Agency. (2021). ODS destruction in the United States and abroad. Link to source: https://www.epa.gov/system/files/documents/2022-08/April%202021%20ODS%20Destruction%20in%20the%20United%20States%20and%20Abroad%20Report.pdf
U.S. Environmental Protection Agency. (2024). Analysis of the U.S. hydrofluorocarbon reclamation market: Stakeholders, drivers, and practices. Link to source: https://www.regulations.gov/document/EPA-HQ-OAR-2022-0606-0169
U.S. Environmental Protection Agency. (2025a). Expanded HFC data. Link to source: https://www.epa.gov/hfcs/hfc-data-hub/expanded-hfc-data#hfc-Production
U.S. Environmental Protection Agency. (2025b). Section 608 total material reclaimed 2017–2024 [Data set]. Link to source: https://www.epa.gov/section608/summary-refrigerant-reclamation-trends
U.S. Green Building Council. (2021). Environmentally responsible refrigerant selection. Link to source: https://www.usgbc.org/sites/default/files/2021-02/Refrigerant%20Management%200211.pdf
Vehlow, J., & Gloël, J. (2020). Thermal destruction of (hydro)chlorofluorocarbons and hydrofluorocarbons. Deutsche Gesellschaft für Internationale Zusammenarbeit (GIZ) GmbH. Link to source: https://www.green-cooling-initiative.org/news-media/publications/publication-detail/2020/06/30/thermal-destruction-of-hydrochlorofluorocarbons-and-hydrofluorocarbons
Credits
Lead Fellow
Sarah Gleeson, Ph.D.
Contributors
Ruthie Burrows, Ph.D.
James Gerber, Ph.D.
Daniel Jasper
Heather McDiarmid, Ph.D.
Alex Sweeney
Internal Reviewers
James Gerber, Ph.D.
Heather McDiarmid, Ph.D.
Amanda D. Smith, Ph.D.
Effectiveness
Both leak reduction and end-of-life management could reduce emissions by 2.6 Mt CO₂‑eq (100-yr) for each kt refrigerant release avoided (Table 1a,b). Since many HFC and HCFC refrigerants have short lifetimes in the atmosphere, the 20-year effectiveness of these solutions is higher: Both prevent 5.9 Mt CO₂‑eq (20-yr)/kt refrigerant release avoided.
Table 1. Effectiveness at reducing emissions.
Unit: t CO₂‑eq /kt refrigerant release avoided, 100-yr basis
| Leak reduction | 2,600,000 |
Unit: t CO₂‑eq /kt refrigerant release avoided, 100-yr basis
| End-of-life management | 2,600,000 |
Left Text Column Width
Leak reduction mitigates direct F-gas leaks as well as CO₂ and F-gas manufacturing emissions due to reduced demand for virgin refrigerant (see Appendix A). Running equipment at a closer-to-full refrigerant charge saves energy, but we did not include reduced energy-related emissions in this assessment.
End-of-life management prevents refrigerant emissions, but its effectiveness is slightly reduced by emitted GHGs from processing, including emissions from recovering and destroying or recovering and reclaiming used refrigerant. These processing emissions are mostly CO₂. We calculated overall end-of-life effectiveness as an average of these two practices, assuming that equal amounts of recovery and destruction and recovery and reclamation occur (Appendix A).
The refrigerants considered in these calculations are common CFCs, HCFCs, and HFCs as reported by the United Nations Environment Programme (UNEP) Medical and Chemical Technical Options Committee (Ohnishi et al., 2022). Effectiveness values across all practices are similar because GHG emissions saved from preventing 1 kt direct F-gas refrigerant release are much higher than any process emissions generated from manufacturing, recovering, destroying, or reclaiming 1 kt refrigerant.
Cost
We estimated that leak reduction can cost US$20/t CO₂‑eq emissions avoided (100-yr basis) (Table 2a) or US$8/t CO₂‑eq (20-year basis).
Table 2. Cost per unit climate impact.
Unit: 2023 US$/t CO₂‑eq , 100-yr basis
| Leak reduction | 20 |
Unit: 2023 US$/t CO₂‑eq , 100-yr basis
| End-of-life management | Not determined |
Left Text Column Width
The Intergovernmental Panel on Climate Change (IPCC) Sixth Assessment Report found that most emissions of F-gases can be reduced for under US$20/t CO₂‑eq (Babiker et al., 2023). Other experts have predicted significant possible emissions reductions if Montreal Protocol parties allocate an additional US$0.10/t CO₂‑eq for refrigerant management (Dreyfus et al., 2023). For larger equipment with high leak rates, such as retail food refrigeration, leak reduction could even have net cost savings (U.S. Environmental Protection Agency [U.S. EPA], 2019).
Costs of leak reduction, refrigerant reclamation, and refrigerant recycling are greatly influenced by the price of virgin refrigerant, with higher prices increasing the financial benefit of these practices. Although we estimated a refrigerant price of ~US$30/kg, Öko-Recherche (2025) reported that in 2025, EU prices of select refrigerants could range from ~€5–55/kg (~US$6–65/kg). If refrigerant costs are high (US$65/kg), this would lower our estimated cost of leak reduction practices from US$20/t CO₂‑eq to US$10/t CO₂‑eq (100-yr basis). Low refrigerant costs (US$6/kg) would have the opposite impact, increasing leak reduction costs to US$30/t CO₂‑eq. Since refrigerant prices can vary over time, this unpredictability is a barrier to deploying capital investments (Peixoto & Dhont, 2024).
Another factor we did not evaluate is that running equipment at a closer-to-full refrigerant charge leads to a longer lifetime and more efficient operation (Eunomia Research & Consulting Ltd & Centre for Air Conditioning and Refrigeration Research, 2014; Peixoto & Dhont, 2024). This would reduce both initial and electricity costs. Electricity costs are a large part of the life-cycle costs for refrigerators, air conditioners, and heat pumps, so these savings can be significant (Goetzler et al., 2016).
End-of-life management costs are challenging to quantify, so we do not report a cost per climate impact (Table 2b). For destruction, since facilities can operate for many years and process high volumes of refrigerant, operating costs are the main expenses once initial costs are amortized. For regions without local destruction infrastructure and low quantities of material to dispose of, exporting waste refrigerant may be less expensive than local destruction (Heubes et al., 2017). Recycling or reclamation has the financial benefit over destruction of having revenue from the sale (or savings from the reuse) of used refrigerant.
The values we discuss here for all types of refrigerant management are estimates based on limited available data, primarily from developed countries. More comprehensive global information is needed for a clear understanding of the costs of these practices.
Methods and Supporting Data
Learning Curve
We did not quantify a learning curve for Improve Refrigerant Management due to the wide range of equipment and practices covered by this solution and lack of global data. We would not expect a significant learning rate due to high technology readiness for both leak reduction and end-of-life management equipment.
Costs of refrigerant management vary based on refrigerant prices, technology availability, regulations, and carbon markets. Refrigerant destruction, in particular, has few financial incentives and is likely to be driven by carbon financing or policy (U.S.EPA, 2021). The refrigerant transition and HFC phasedown could lead to cost incentives for reclaiming or recycling short-supply HFCs, but costs could increase for alternative blended refrigerants with new required recovery or processing technologies (Peixoto & Dhont, 2024; U.S. EPA, 2024). Training for installation, maintenance, and recovery professionals might reduce the time and cost of labor.
Speed of Action
Speed of action refers to how quickly a climate solution physically affects the atmosphere after it is deployed. This is different from speed of deployment, which is the pace at which solutions are adopted.
At Project Drawdown, we define the speed of action for each climate solution as emergency brake, gradual, or delayed.
Improve Refrigerant Management is an EMERGENCY BRAKE climate solution. It has the potential to deliver a more rapid impact than gradual and delayed solutions. Because emergency brake solutions can deliver their climate benefits quickly, they can help accelerate our efforts to address dangerous levels of climate change. For this reason, they are a high priority.
Caveats
To achieve its climate goals, it is critical to implement refrigerant management responsibly and sustain it over time. Destruction can be considered a permanent emissions reduction, but other types of management could allow refrigerants to leak or be released in the future. That said, reuse and leak management both reduce the manufacture of new refrigerants (ACR, 2022), which is both an additional and permanent emission reduction.
Since much current refrigeration, air conditioning, and heat pump equipment can only be used with high-GWP refrigerants like HFCs, it is beneficial to recharge these appliances with reclaimed or recycled refrigerant instead of manufacturing new HFCs. Responsible management of any reused HFC refrigerant will prevent future emissions.
In some countries, certain end-of-life refrigerants are classified as hazardous wastes. The Basel Convention regulates the transfer of these materials between countries, creating refrigerant exporting challenges for nations without domestic refrigerant management infrastructure (Peixoto & Dhont, 2024). This can limit global adoption.
If refrigerant management is mandated by policy or regulations, we consider these emissions reductions to be additional over baseline emissions. However, some GHG accounting or crediting organizations would only count emissions not mandated by international, regional, or application-specific policy limits as additional.
Current Adoption
We don’t report a current value for leak reduction adoption, since leak rate data reflect the current state of emissions and not reductions in leaked quantities (Table 3a).
Estimating leak rates across countries, equipment types, charge sizes, and refrigerant types is challenging. We aggregated expert estimates of leak rates for different refrigerant applications; our findings ranged from <1% annually from residential refrigeration to 20% annually leaking from transport refrigeration systems. We estimated the average annual leak rate of all in-use refrigerants to be 9%. See Appendix B for sources and details of this calculation. This is likely an underestimate, especially for leakier commercial and industrial refrigeration systems.
We estimated that end-of-life management avoids the release of 29 kt/yr of CFCs, HCFCs, and HFCs (Table 3b). We identified 15 kt/yr of refrigerants that are destroyed, 12 kt/yr recycled or reclaimed, and 2.4 kt/yr recovered with unspecified management. These estimates include data from Australia, Japan, the United States, China, Canada, and the European Union. Although this is not comprehensive, these countries are responsible for at least 65% of recent destruction of controlled substances, and in some years greater than 90% (Ozone Secretariat, 2026; Ohnishi et al., 2022). However, some non-refrigerant chemicals are included in the data. Data gaps make this estimate challenging; we expect it to be an underestimate of end-of-life management globally.
Table 3. Current adoption.
Unit: kt refrigerant release avoided/yr
| Leak reduction | Not determined |
Unit: kt refrigerant release avoided/yr
| Recovery | 2.4 |
| Recycling or reclamation | 12 |
| Destruction | 15 |
| All end-of-life management | 29 |
Left Text Column Width
Sources agreed that current adoption of end-of-life management is poor. UNEP estimated that even countries with robust and long-standing refrigerant recovery programs – such as Japan and Australia – recover only ~40% of refrigerant in end-of-life equipment (Peixoto & Dhont, 2024). Although we estimated that globally 29 kt/yr are managed at end-of-life, gross production of HFCs in 2024 in the United States alone was more than 120 kt (U.S. EPA, 2025a).
Adoption Trend
Comprehensive global data on trends in leak reduction or end-of-life management are lacking. However, some countries with relatively high levels of management and reporting have country-specific information on end-of-life management.
In Japan, the amount of CFCs, HCFCs, and HFCs managed from 2015–2023 increased by approximately 10%, mostly driven by an increase in refrigerant recycling and HFC management (Japan Ministry of the Environment, 2025). Destruction in Japan has decreased from 2015 levels. Japan’s progress can be connected to several refrigerant management laws and efforts to enforce them, including increasing on-site checks since 2015 (Government of Japan, 2025).
The U.S. EPA (2025b) reported that, in 2024, reclamation of ozone-depleting substances – including CFCs and HCFCs – had dropped to less than 60% of 2015 levels. However, U.S. HFC reclamation more than doubled over the same time period, with significant year-over-year increases from 2021–2023 (Maranion et al., 2025). There are fewer destruction data, although a small drop in HFC quantity destroyed from 2023–2024 was reported (U.S. EPA, 2025b).
Other countries reporting positive recent trends in refrigerant management include Canada (positive recent year-over-year trends in recovery and destruction of both HFCs and ozone-depleting substances) and China (annual growth rate of refrigerant recovery of 36%) (Maranion et al., 2025).
Adoption Ceiling
For leak reduction, we estimated the adoption ceiling to be 500 kt/yr of refrigerant release avoided (Table 4a). This represents what would be possible if no refrigerants leaked during use, which is not a realistic expectation. We calculated this by first estimating the quantity of global refrigerant contained in new or operational refrigeration, air conditioning, and heat pump equipment. We then applied a global average leak rate of 9% annually (see Appendix B) to the amount of refrigerant in operational equipment.
End-of-life management has a lower ceiling, which we estimated to be 270 kt refrigerant release avoided/yr (Table 4b). This value reflects recovering and responsibly managing all refrigerants in decommissioned equipment each year. The U.S. EPA (2021) reported quantities of refrigerants potentially available from retired equipment for several countries or groups of countries, primarily the United States and the European Union. Using these data, we estimated that 3.9% of the U.S. refrigerant stock is available to recover each year, and extrapolated a global recovery quantity to be 3.9% of the global refrigerant stock.
Table 4. Adoption ceiling.
Unit: kt refrigerant release avoided/yr
| Leak reduction | 500 |
Unit: kt refrigerant release avoided/yr
| End-of-life management | 270 |
Left Text Column Width
Achievable Adoption
We anticipate that leak reduction could avoid 100–200 kt refrigerant release/yr (Table 5a). The high end of this range is the amount of in-use refrigerant release prevented by reducing the annual global leak average from 9% to 5%, which is a target set by multiple organizations that promote better monitoring and performance of refrigeration systems (Theodoridi et al., 2022; U.S. Green Building Council, 2021). The low end of the range represents getting halfway to this target globally (reaching a 7% average annual leak rate). Achieving 5–7% leak rates means reducing global refrigerant leaks by ~20–45% from current levels. This is consistent with recent literature that claims that robust leak prevention can prevent 20–50% of refrigerant leaks during use (Purohit et al., 2025). If actual leak rates are higher than the 9% estimate, more leak reduction may be possible.
End-of-life management of refrigerant could reasonably avoid 130–200 kt refrigerant release/yr (Table 5b). In a 2011 report, UNEP estimated that 47.5% of the ozone-depleting refrigerant stock is reachable with low to medium effort (UNEP, 2011). This stock includes refrigerant chemicals used in applications such as foams. Assuming that this estimate is accurate today and applies to HFC refrigerants as well, we set the low achievable adoption as 47.5% of the adoption ceiling. This assumes all low- or medium-effort recovery happens followed by responsible destruction or reuse. For high achievable adoption, we assumed that more effort is expended to recover and manage waste refrigerant, with half of the refrigerant above the low- and medium-effort recovery level also being managed.
Table 5. Range of achievable adoption levels.
Unit: kt refrigerant release avoided/yr
| Current adoption | Not determined |
| Achievable – low | 100 |
| Achievable – high | 200 |
| Adoption ceiling | 500 |
Unit: kt refrigerant release avoided/yr
| Current adoption | 29 |
| Achievable – low | 130 |
| Achievable – high | 200 |
| Adoption ceiling | 270 |
Left Text Column Width
These are ambitious targets; countries with world-leading refrigerant recovery programs – such as Japan and Australia – recover only ~40% of refrigerant in end-of-life equipment today (Peixoto & Dhont, 2024). However, since refrigerants used in refrigeration, air conditioning, and heat pumps are easier to recover than other refrigerants considered in the reachable stock (Ashford & Kuijpers, 2009; U.S. EPA 2021), exceeding 47.5% recovery is feasible with strong policy and enforcement measures.
For all types of refrigerant management, factors such as policies, enforcement mechanisms, refrigerant tracking, and refrigerant prices will impact future adoption. Barriers to adoption include high up-front costs and lack of infrastructure or reverse supply chains, particularly in low- and middle-income countries and less-populated areas (Maranion et al., 2026; Peixoto & Dhont, 2024).
Leak reduction practices can reduce emissions 0.3–0.5 Gt CO₂‑eq/yr (100-yr basis, Table 6a), or 0.6–1.2 Gt CO₂‑eq/yr over a 20-yr time horizon. Preventing all leaks would reach an impact ceiling of 1 Gt CO₂‑eq/yr (100-yr, Table 6a) or 3 Gt CO₂‑eq/yr (20-yr), although stopping all leaks is unrealistic. If current leak rates are higher than our estimate, the impact potential of this solution is even greater than what we report here. Equipment with the highest charge sizes and leak rates (such as commercial or industrial refrigeration) have the greatest opportunity for a positive climate impact by reducing leaks (see Appendix B).
End-of-life management can reduce emissions 0.34–0.52 Gt CO₂‑eq/yr (100-yr basis, Table 6b). On a 20-year basis, the impact is 0.77–1.2 Gt CO₂‑eq/yr. We estimate the current impact from reusing or destroying refrigerant to be 0.08 Gt CO₂‑eq/yr (100-yr basis, Table 6b) or 0.17 Gt CO₂‑eq/yr (20-yr basis). If all refrigerants available for recovery are managed each year, this could reach an impact ceiling of 0.70 Gt CO₂‑eq/yr (100-yr basis, Table 6b) or 1.6 Gt CO₂‑eq/yr (20-yr basis).
Table 6. Climate impact at different levels of adoption.
Unit: Gt CO₂‑eq/yr, 100-year basis
| Current adoption | Not determined |
| Achievable – low | 0.3 |
| Achievable – high | 0.5 |
| Adoption ceiling | 1 |
Unit: Gt CO₂‑eq/yr, 100-year basis
| Current adoption | 0.1 |
| Achievable – low | 0.34 |
| Achievable – high | 0.52 |
| Adoption ceiling | 0.7 |
Left Text Column Width
UNEP’s Technology and Economic Assessment Panel (TEAP) estimates that leak prevention could mitigate 15.6 Gt CO₂‑eq and end-of-life management could mitigate 23.4 Gt CO₂‑eq cumulatively from 2025–2050 (Peixoto & Dhont, 2024). This estimate employs models of future HFC emission increases, while our climate impact estimate is based only on the current state of the sector and is not cumulative. We expect that managing refrigerant emissions will become more important over time due to population growth, rising standards of living, and a warming climate (Sachar et al., 2018).
As refrigerants transition to lower-GWP alternatives, managing release is still important but impact will decrease (see Deploy Alternative Refrigerants). However, particularly in the coming decades, taking action on leak reduction and end-of-life management together will ensure maximal climate benefits. Policies to mandate and incentivize these practices for end users, technicians, and businesses will be critical in scaling up refrigerant management and preventing warming.
Additional Benefits
Income and Work
Improving refrigerant management will require workforce training and can create more job opportunities (Mayhew et al., 2023; Peixoto & Dhont, 2024). Although research on the number of jobs created is limited, according to one UNEP TEAP report, investing in life-cycle refrigerant management could create 500,000 jobs in the United States alone (Peixoto & Dhont, 2024).
Refrigerant management, in particular leak reduction, can also save consumers money. Preventing leaks prevents emissions, conserves refrigerant and improves appliance efficiency (Mayhew et al., 2023; Peixoto & Dhont, 2024). When refrigerants are below optimal charge levels efficiency decreases, leading to higher energy expenditures. Refrigerant management practices reduce the need to purchase virgin HFC refrigerants, which are becoming more expensive as production phases down.
Health
For a description of the benefits to health, please refer to Air Quality below.
Land Resources
For a description of the benefits to land resources, please refer to Air Quality below.
Air Quality
Cooling appliances lose efficiency as refrigerant leaks from them. This results in higher energy use, which can increase emissions of air pollutants such as sulfur dioxide, nitrogen oxides and particulate matter from power plants (Purohit et al., 2025). Air quality can be improved by refrigerant leak prevention.
Certain refrigerants in the global stock, particularly CFCs and HCFCs, can damage the ozone layer (Bolaji & Huan, 2013; Purohit et al., 2025). Refrigerant management reduces emissions of these ozone-depleting substances and is projected to prevent future ozone-depleting emissions (Purohit et al., 2025). Protecting the ozone layer ensures it can absorb harmful ultraviolet radiation, which can benefit human health, crop health, and food chains (Salawitch et al., 2019).
Non-fluorinated refrigerants can react with nitrogen oxides to form ground-level ozone, a major air pollutant that contributes to smog and harms human health (Peixoto & Dhont, 2024). Preventing refrigerant emissions can mitigate ground-level ozone formation.
F-gases used as refrigerants, such as HFCs, are considered per- and polyfluoroalkyl substances (PFAS) and can persist in the environment for centuries, posing serious human and ecosystem health risks (Dimitrakopoulou et al., 2024; Fenton et al., 2021). PFAS can decompose in the atmosphere to produce trifluoroacetic acid (TFA), which is not well-studied but may harm the environment and human health (Abdelaziz et al., 2023). Possible impacts of high atmospheric TFA concentrations include acid rain, accumulation in terrestrial ecosystems in water and plant matter, and harmful effects on the environment and organisms (Chele et al., 2024; Hanson et al., 2024). Fluorinated refrigerants can also indirectly harm the ozone layer and human health through their production and degradation products (Environmental Investigation Agency, 2025). Reducing the emissions of refrigerants could reduce atmospheric loading of PFAS and subsequent TFA deposition. This could improve air quality and mitigate risks to ecosystems and water resources.
Risks
Refrigerant destruction risks the potential formation of by-products such as dioxins, furans, acid gases, particulate matter, and carbon monoxide (Chao et al., 2024). These compounds can have adverse environmental or health effects if not responsibly managed. This risk can be mitigated by using conversion instead of incineration technologies and removing oil contaminants (Tope & Walter-Terrinoni, 2018).
More frequent refrigerant maintenance and recovery amplifies the risks that come with insufficient technician training in certain regions, including safety, accidental emissions, and refrigerant contamination.
Refrigerant management runs the risk of slowing the transition to alternative refrigerants, especially since reclaimed refrigerant does not count toward HFC consumption caps under the Kigali Amendment. Instead of purchasing new equipment designed for alternative refrigerants, reclaimed refrigerant can perpetuate the use of high-GWP refrigerants in older, leaky, and less efficient appliances (Peixoto & Dhont, 2024).
Refrigerant management, in particular destruction, can require financial measures such as carbon credits to implement. However, creating new markets for refrigerant reuse or destruction risks financially incentivizing the perpetuated production of high-GWP refrigerants. The Environmental Investigation Agency (2024) recommends that destruction be required by policy rather than allowing carbon offsets to be sold. This prevents additional profits earned on polluting chemicals and mandates F-gas mitigation, an emergency brake action.
Interactions with Other Solutions
Reinforcing
Improved refrigerant management will lead to reduced GHG emissions from new food refrigeration equipment. Since decreasing food loss and waste might require increases in commercial, residential, and transport refrigeration (Babiker et al., 2023; Food and Agriculture Organization of the United Nations, 2019), it will be more effective with fewer fugitive refrigerant leaks. This impact will be strongest for large and currently leaky equipment such as supermarket refrigeration. However, if less food is produced to better manage food loss, this could instead lead to a decreased demand for cold storage and less reinforcing interaction between these solutions (Dong et al., 2021).
Heat pumps use refrigerants to absorb and release heat. Decreasing leaks of refrigerants in heat pumps will reduce emissions associated with heat pump use and increase the energy efficiency of heat pump systems. Therefore, heat pumps will provide even greater climate benefits.
Competing
Improving refrigerant management decreases the quantity of refrigerants emitted to the atmosphere. This means that the effectiveness and climate impact of using lower-GWP refrigerants will decrease. These solutions are complementary: although they reduce the impact of each other, implementing them together is overall beneficial to mitigation of refrigerant emissions.
Dashboard
Solution Basics
kt refrigerant release avoided
t CO₂-eq (100-yr)/unit
2.6×10⁶
units/yr
Current Not Determined
0100200
Achievable (Low to High)
Climate Impact
Gt CO₂-eq (100-yr)/yr
Current Not Determined
0.30.5
US$ per t CO₂-eq
20
Emergency Brake
F-gases
Solution Basics
kt refrigerant release avoided
t CO₂-eq (100-yr)/unit
2.6×10⁶
units/yr
Current 29
0130200
Achievable (Low to High)
Climate Impact
Gt CO₂-eq (100-yr)/yr
Current 0.1
0.340.52
Emergency Brake
F-gases
Trade-offs
Recovering and processing end-of-life refrigerants will generate emissions from transporting material that were not included in the calculations for this solution.
Recovered refrigerant can become contaminated if it is not properly managed. This can be due to insufficient compositional analysis or separation of refrigerant blends, impurities such as oil introduced from recovery equipment, or contaminated recovery cylinders (Peixoto & Dhont, 2024). Using contaminated refrigerant in equipment can reduce cooling performance and increase energy use, leading to increased energy generation GHG emissions (SuperCool Asia Pacific, 2022). Contaminated refrigerant also can damage equipment, increasing refrigerant leaks. This trade-off can be mitigated with high-quality compositional analysis of refrigerants and training for recovery practitioners.
Destruction technologies such as plasma arcs can require large amounts of energy, resulting in small indirect emission trade-offs from energy production. However, UNEP’s TEAP Task Force reports that these indirect emissions are negligible compared with the direct emissions prevented by refrigerant destruction (Tope & Walter-Terrinoni, 2018).
Maps Introduction
Improved refrigerant management is most impactful in areas where refrigerant emissions are highest, such as countries with high refrigerant use and low current adoption. Regions with the highest-GWP refrigerant stocks will prevent more warming per kiloton of refrigerant release avoided, and stocks with ozone-depleting CFCs or HCFCs should be prioritized to avoid damage to the ozone layer. Warmer regions with greater cooling demand are likely to require more refrigerant use, and therefore have greater emissions if not managed. Regional patterns of where this solution is most important may evolve as refrigeration, air conditioning, and heat pump appliances become more widespread and the climate warms.
Country-level emissions data are limited. The Ozone Secretariat (n.d.) tracks CFC, HCFC, and HFC production and consumption, but current emissions are hard to estimate because these data do not include breakdowns by chemical or existing stock quantities. The Environmental Investigation Agency (2025a) points out that the lack of transparency in Ozone Secretariat data impedes understanding of how these chemicals are being produced and used.
Areas with higher leak rates from equipment would benefit most from leak reduction practices. However, leak rate data are limited and typically only for select countries or equipment, making it challenging to create a map of fugitive refrigerant emissions.
CLASP (2026) reports that in 2025, China had the greatest number of residential air conditioner and refrigerator-freezer units. Others with high numbers of in-use appliances are the United States, India, and the European Union. This suggests that residential refrigerant use and emissions are likely to be high in these countries, with high potential to adopt refrigerant management.
Developing economies and small island states have infrastructural challenges to adoption, including lack of reclamation and destruction facilities and lack of reverse supply chains (Maranion et al., 2026). Funding has been deployed to support equipment and training in these countries and could narrow the adoption gap (Environmental Investigation Agency, 2025b).
Note: Detailed global maps for this solution are currently under development.
Action Word
Improve
Solution Title
Refrigerant Management
Classification
Highly Recommended
Lawmakers and Policymakers
- Develop national cooling plans and integrate them into national climate plans.
- Ensure existing public refrigeration systems have robust monitoring, maintenance, and end-of-life servicing to eliminate leaks and recover refrigerants; ensure procurement uses as much reclaimed refrigerant as possible; use public procurement for demonstration projects and to increase industry awareness.
- Ban venting or intentional releases of HFCs, CFCs, and HCFCs, require regular equipment maintenance, and track equipment to help enforcement; ban the practice of filling leaking equipment without fixing the leak first.
- Create infrastructure and regulatory frameworks requiring and/or strongly incentivizing leak prevention and the recovery, reclamation, recycling, and destruction of refrigerants; impose legal responsibilities for operators to ensure proper end-of-life servicing for equipment; create strong and effective enforcement mechanisms, including through improved reporting requirements, protected whistleblower complaint channels, and refrigerant audit programs similar to energy audit programs.
- Offer financial incentives such as tax breaks, subsidies, grants, loan guarantees, and concessional financing for reclamation, distillation, recycling, and destruction of refrigerants; ensure financial incentives sufficiently reward technicians to incentivize best practices and participation; create targeted incentive programs for small and independent retailers; invest in or incentivize the creation of circular supply chains; offer similar incentives for simple, cost-effective retrofits such as changing fittings on refrigerant piping.
- Coordinate refrigerant management policies horizontally (e.g., across agencies) and vertically (e.g., across subnational, national, and international efforts).
- Ban or seek to deter the practice of offloading outdated cooling equipment to low- and middle-income countries.
- Set minimum standards for installation practices and detection and repair of leaks; require automatic leak detection systems; offer financial incentives for products that decrease or eliminate leaks.
- If not currently in place, set certification requirements to purchase and handle refrigerants.
- Work with industry to develop workforce training programs; update certification requirements when necessary; require certification renewal for technicians trained with prior programs.
- Require detailed recordkeeping for vendors, contractors, and technicians to track and report on refrigerant types and amounts in use and at disposal; consider requirements for electronic tracking systems on refrigerants.
- Create and maintain databases on refrigerant use, recovery, recycling, and destruction rates to identify highest priority areas and/or industries for improving refrigerant management.
- Ensure producers bear the cost of recovery, reclamation, and destruction; enact Extended Consumer Responsibility requirements; require up-front deposits for refrigerants or create a pool fund by taxing producers, then use the pool to pay technicians to carry out recovery, reclamation, and destruction.
- Enact requirements for retailers and installers to inform customers that only qualified professionals are legally allowed to handle refrigerant equipment.
- Invest in R&D to improve reclamation, recycling, and distillation technologies; destruction methods; and leak detection and repair.
- Offer educational resources, creating one-stop shops for information on improved refrigerant management and energy efficiency; offer demonstrations, highlighting their cost savings and climate benefits.
- Create, support, or join networks and partnerships dedicated to improving refrigerant management.
- Combat illegal trade of refrigerants through measures such as import and export quotas, robust permitting and customs inspections, banning disposable cylinders, and enhancing refrigerant supply chain traceability.
Further information:
- Government relations and public policy job function action guide. Project Drawdown (2022)
- Legal job function action guide. Project Drawdown (2022)
- Country data: Life-cycle refrigerant management. UNEP (n.d.)
- Reducing hydrofluorocarbon (HFC) use and emissions in the federal sector through SNAP. U.S. EPA (2026)
- Tip of the iceberg: Implications of illegal CFC production and use. Environmental Investigation Agency (2018)
Practitioners
- Avoid venting or intentionally releasing refrigerants and conduct regular maintenance on equipment.
- Improve refrigeration systems to include robust monitoring, maintenance, and end-of-life servicing to eliminate leaks and recover refrigerants
- Ensure procurement uses as much reclaimed refrigerant as possible instead of new.
- Take advantage of financial incentives such as subsidies, tax credits, and grants to improve refrigerant management practices.
- Set voluntary targets for leak repair and management; deploy automatic leak detection systems; invest in low-cost and effective retrofitting options such as changing fittings on refrigerant piping.
- Improve building, operations, and cooling designs to reduce demand for refrigerants.
- Create industry-led voluntary agreements that help achieve and/or exceed regulatory requirements for refrigerant management; prepare the industry for phaseouts of high-GWP refrigerants.
- Help create the infrastructure for end-of-life recovery, reclamation, and destruction of refrigerants; help develop guidelines for technicians in refrigeration management.
- Maintain detailed records to track and report on refrigerant types and amounts in use.
- Invest in R&D to improve reclamation, recycling, and distillation technologies; destruction methods; and leak repair.
- Do not fill leaking equipment without repairing the leaks first.
- Collaborate with other industry stakeholders to produce a publicly available database on best practices for installation, retrofitting, reclamation, and end-of-life servicing.
- When possible, use recycled refrigerants immediately at the point of recovery or reclaimed refrigerants to reduce demand for virgin high-GWP refrigerants.
- Require refrigerant reclamation and the use of reclaimed refrigerants for appropriate equipment.
- Implement an array of safety protocols to reduce the risk of leaks and exposure, such as restricting refrigerant charge sizes and improving ventilation and leak sensors.
- Help create high-integrity carbon markets for reclaimed refrigerants, ensuring markets do not inadvertently increase waste gas generation.
- Ensure relevant staff and technicians are properly certified for their roles; renew certification credentials when new regulations are created.
- Clearly warn customers that only qualified technicians should handle the equipment and refrigerants; inform them of servicing requirements and warranty terms and conditions.
- Participate in certification schemes that identify which businesses use improved refrigerant management.
- Create, support, or join networks or partnerships dedicated to advancing improved refrigerant management.
Further information:
Business Leaders
- Establish time-bound, transparent targets for improving refrigerant management.
- Improve refrigeration systems to include robust monitoring, maintenance, and end-of-life servicing; ensure procurement uses as much reclaimed refrigerant as possible.
- Improve building, operations, and cooling designs to reduce demand for refrigerants.
- Commit to exceeding regulatory requirements for refrigerants and energy efficiency in operations.
- Take advantage of financial incentives such as subsidies, tax credits, and grants for improved refrigerant management.
- Help create high-integrity carbon markets for reclaimed refrigerants, ensuring markets do not inadvertently increase waste gas generation.
- Help create reverse supply chains and build a circular economy for refrigerants.
- Support workforce development programs, offer employee scholarships, and/or sponsor training for careers in refrigerant management, including end-of-life services.
- Adopt extended producer responsibility and hold suppliers accountable to the same standards when possible.
- Maintain detailed records to track and report on refrigerant types and amounts in use; request and maintain records from suppliers.
- Participate in certification schemes that identify businesses that use improved refrigerant management.
- Advocate for bans on venting or intentional release of refrigerants, requirements for regular maintenance, and refrigerant or equipment tracking programs to help enforcement.
- Create, support, or join networks or partnerships dedicated to advancing improved refrigerant management.
Further information:
- Climate solutions at work. Project Drawdown (2021)
- Drawdown-aligned business framework. Project Drawdown (2021)
- Country data: Life-cycle refrigerant management. UNEP (n.d.)
- Reducing hydrofluorocarbon (HFC) use and emissions in the federal sector through SNAP. U.S. EPA (2026)
Nonprofit Leaders
- Improve refrigeration systems to include robust monitoring, maintenance, and end-of-life servicing to eliminate leaks and reclaim refrigerants; ensure procurement uses as much reclaimed refrigerant as possible.
- Improve building, operations, and cooling designs to reduce demand for refrigerants.
- Help develop guidelines and infrastructure for end-of-life reclamation, recycling, and/or destruction of refrigerants.
- Help create reverse supply chains and build a circular economy for refrigerants.
- Help translate and improve technical manuals for related equipment; work with manufacturers to improve communications and translations.
- Advocate for bans on venting or intentional releases of refrigerants, requirements for regular maintenance, and refrigerant or equipment tracking programs to help enforcement.
- Help develop national cooling plans and integrate them into national climate plans.
- Work with industry to develop workforce training programs; help update certification requirements when necessary and assist with certification renewal for technicians trained under prior programs.
- Advocate for extended producer responsibility to hold producers accountable for refrigerant product safety and recovery.
- Help with technology transfer to low- and middle-income countries to improve low-cost adoption.
- Advocate for bans or deterrents to the practice of offloading inefficient cooling equipment in low- and middle-income countries.
- Help develop refrigerant audit programs similar to energy audit programs.
- Offer educational resources, creating one-stop shops for information on improved refrigerant management and energy efficiency; offer demonstrations, highlighting cost savings and climate benefits.
- Administer or participate in certification schemes that identify which businesses use improved refrigerant management.
- Create, support, or join networks or partnerships dedicated to advancing improved refrigerant management.
Further information:
Investors
- Ensure portfolio companies use or have a credible plan to improve refrigerant management in their operations and throughout the rest of their supply chains.
- Invest in start-ups working to improve all aspects of refrigerant management and circular economies.
- Ensure infrastructure investment projects leverage building, operations, and cooling designs that reduce demand for refrigerants.
- Invest in companies that adopt extended consumer responsibility and/or have a proven track record of reclamation, recycling, and responsible destruction of refrigerants.
- Offer preferential loan agreements for companies improving their refrigerant management.
- Offer innovative financing methods such as microloans, or invest in green bonds supporting projects that improve refrigerant management.
- Invest in R&D to improve refrigerant reclamation, recycling, and distillation technologies, destruction methods, and leak repair.
- Create, support, or join networks or partnerships dedicated to advancing improved refrigerant management.
Further information:
Philanthropists and International Aid Agencies
- If applicable, improve refrigeration systems to include robust monitoring, maintenance, and end-of-life servicing to eliminate leaks and recover refrigerants; ensure procurement uses as much reclaimed refrigerant as possible.
- If applicable, improve building, operations, and cooling designs to reduce demand for refrigerants.
- Offer grants for start-ups working to improve all aspects of refrigerant management and circular economies.
- Offer innovative financing methods such as microloans and green bonds to invest in projects that are improving refrigerant management.
- Invest in R&D to improve reclamation, recycling, and distillation technologies; destruction methods; and leak repair.
- Help develop guidelines and infrastructure for reclamation and destruction of refrigerants.
- Help create reverse supply chains and build a circular economy for refrigerants.
- Help translate and improve technical manuals for related equipment; work with manufacturers to improve communications and translations.
- Advocate for bans on venting or intentional releases of refrigerants, requirements for regular maintenance, and refrigerant or equipment tracking programs to help enforcement.
- Help develop national cooling plans and integrate them into national climate plans.
- Work with industry to develop workforce training programs; help update certification requirements when necessary and assist with certification renewal for technicians trained with prior programs.
- Advocate for extended producer responsibility approaches that hold producers accountable for refrigerant product safety and recovery.
- Assist with technology transfer to low- and middle-income countries to help improve low-cost adoption.
- Advocate for bans or deterrents to the practice of offloading inefficient cooling equipment to low- and middle-income countries.
- Help develop refrigerant audit programs similar to energy audit programs.
- Offer educational resources, creating one-stop shops for information on improved refrigerant management and energy efficiency; offer demonstrations, highlighting their cost savings and climate benefits.
- Administer or participate in certification schemes that identify which businesses use improved refrigerant management.
- Create, support, or join networks or partnerships dedicated to advancing improved refrigerant management.
Further information:
Thought Leaders
- Help develop guidelines and infrastructure for reclamation, recycling, and destruction of refrigerants.
- Help create reverse supply chains and build a circular economy for refrigerants.
- Help translate and improve technical manuals for related equipment; work with manufacturers to improve communications and translations.
- Advocate for bans on venting or intentional releases of refrigerants, requirements for regular maintenance, and refrigerant or equipment tracking programs to help enforcement.
- Help develop national cooling plans and integrate them into national climate plans.
- Work with industry to develop workforce training programs; help update certification requirements when necessary, and assist with certification renewal for technicians trained with prior programs.
- Advocate for extended producer responsibility approaches that hold producers accountable for refrigerant product safety and recovery.
- Assist with technology transfer to low- and middle-income countries to help improve low-cost adoption.
- Advocate for bans or deterrents to the practice of offloading inefficient cooling equipment in low- and middle-income countries.
- Help develop refrigerant audit programs similar to energy audit programs.
- Offer educational resources, creating one-stop shops for information on improved refrigerant management and energy efficiency; offer demonstrations, highlighting cost savings and climate benefits.
- Administer or participate in certification schemes that identify businesses that use improved refrigerant management.
- Create, support, or join networks or partnerships dedicated to advancing improved refrigerant management.
Further information:
Technologists and Researchers
- Improve refrigerant reclamation, recycling, and distillation technologies, destruction methods, and leak detection and repair.
- Design equipment for detecting refrigerant leaks or recovering and processing refrigerants of all chemistries, including low-GWP alternative refrigerants and blends.
- Design new refrigeration systems that reduce or eliminate leaks during operation; improve energy efficiency of existing or new systems; innovate equipment designs that facilitate installation, maintenance, and end-of-life servicing.
- Develop software to track types and quantities of refrigerants in use; explore the use of the Internet of Things to track refrigerants through valve and gauge connections.
- Develop more robust tracking and data around end-of-life refrigerants.
- Research other traditional methods of cooling and food storage; develop means of scaling relevant methods; find practical means of integrating traditional methods with modern lifestyles.
Further information:
Communities, Households, and Individuals
- Buy efficient appliances with the lowest amount of refrigerant needed for their function.
- Have refrigeration, heat pump, and air-conditioning appliances maintained and checked for leaks regularly by a trained professional.
- Research options for responsible disposal of refrigerant-containing appliances in your area.
- Consult a professional about reducing leaks or improving refrigerant management at home; never tamper with or attempt to handle refrigerants without proper certification.
- Advocate for extended producer responsibility approaches that hold producers accountable for refrigerant product safety and recovery.
- Advocate for bans on venting or intentional releases of refrigerants, requirements for regular maintenance, and refrigerant or equipment tracking programs to help enforcement.
- Explore and integrate other traditional methods of cooling and food storage, if relevant.
Further information:
“Take Action” Sources
- Fact sheet on existing fluorocarbon credit methodologies. Carbon Containment Lab (2023)
- Guidance on sustainable cooling approaches for enhanced NDCs. Climate and Clean Air Coalition (2024)
- Lifecycle refrigerant management (LRM). Climate and Clean Air Coalition (n.d.)
- Global best practices on lifecycle refrigerant management. Garg et al. (2023)
- The life cycle of fluorocarbons: Case studies. International Institute of Refrigeration (2022)
- Lifecycle refrigerant management: Maximizing the atmospheric and economic benefits of the Montreal Protocol. Mayhew et al. (2023)
- Systematic assessment of the achieved emission reductions of carbon crediting projects. Probst et al. (2024)
- Analysis of the U.S. hydrofluorocarbon reclamation market: Stakeholders, drivers, and practices. U.S. EPA (2024)
- ODS destruction in the United States and abroad. U.S. EPA (2021)
- Refrigerant transition management and planning for the future. U.S. EPA (2023)
- Embodied carbon pathways for Canadian residential equipment. Racusin & Belitski (2025)
- Recommendations for climate friendly refrigerant management and procurement. Sustainable Purchasing Leadership Council & Institute for Governance & Sustainable Development (2021)
- Report of the TEAP: Decision XXXV/11 Task Force report on life cycle refrigerant management. Peixoto & Dhont (2024)
- The 90 billion ton opportunity. Theodoridi et al. (2022)
Evidence Base
Consensus of effectiveness in reducing emissions: High
Preventing release and fugitive emissions of refrigerant chemicals is highly effective at reducing global GHG emissions. Refrigerant management is considered one of the primary means for minimizing refrigeration, air conditioning, and heat pump emissions, in addition to switching to low-GWP refrigerants and increasing the energy efficiency of appliances.
UNEP’s Ozone Secretariat (2015) estimated that 60% of HFC refrigerant use was for replacing leaked refrigerant from refrigerators, air conditioners, and heat pumps. Purohit et al. (2025) claimed that implementing life-cycle refrigerant management during the use and end of life of refrigerators, air conditioners, and heat pumps could reduce HFC and HCFC GHG emissions about 39 Gt CO₂‑eq between 2025 and 2050. A report by the Environmental Investigation Agency, Institute for Governance & Sustainable Development, and Natural Resources Defense Council estimated that leak reduction and end-of-life management could reduce emissions by 91 Gt CO₂‑eq by 2100 (Theodoridi et al., 2022).
It is likely that the impact of this solution will decrease in future decades as high-GWP refrigerants are phased out. However, Liu et al. (2024) emphasized that emissions of current high-GWP refrigerants are time-lagged due to long equipment lifetimes. UNEP’s TEAP asserted that over short- and medium-term time frames, refrigerant management is critical to preventing emissions as cooling demands increase globally and the alternative refrigerant transition proceeds slowly (Peixoto & Dhont, 2024). Importantly, this solution mitigates emissions of ozone-depleting substances that both warm the climate and harm the ozone layer.
The results presented in this document summarize findings from seven peer-reviewed articles, 16 reports from nongovernmental organization and public sector authors, three news articles or websites, four datasets, one IPCC chapter, and eight national GHG inventory submissions to the United Nations. This reflects current evidence from 26 countries, primarily the European Union, United States, Australia, and Japan. Data from groups of countries are also factored in, including Annex 1 countries as identified by the United Nations, A5 and non-A5 parties, global averages, and Organisation for Economic Co-operation and Development (OECD) nations. We recognize this limited geographic scope creates bias, and hope this work inspires research and data sharing on this topic in underrepresented regions.
Appendix
Appendix A: Calculation of Emissions Reductions
We calculated the reduction in GHG emissions for improved refrigerant management as follows:
Leak Reduction
Emissions from leaked refrigerant are due to:
- direct F-gas emissions from leaked refrigerant entering the atmosphere
- manufacturing emissions from producing virgin refrigerant to replace leaked refrigerant.
Equation A1.
\[ Avoided\ emissions\ per\ kt\ of\ leaked\ refrigerant\ prevented\\ =\ [1\ kt\ leaked\ refrigerant\ direct\ emissions]\ +\ [production\ emissions\ for\ 1\ kt\ virgin\ refrigerant]\]
End-of-Life Management
Emissions from end-of-life refrigerant are due to:
- direct F-gas emissions from refrigerant release to the atmosphere as a result of improper disposal during maintenance or end-of-life
- manufacturing emissions from producing virgin refrigerant to fill replacement or serviced equipment.
Emissions from reuse or destruction practices include:
- process emissions from recovery and reclamation or recycling
- process emissions from recovery and destruction.
Equation A2.
\[ Avoided\ emissions\ per\ kt\ of\ recovered\ and\ reused\ refrigerant\\=[1\ kt\ released\ refrigerant\ direct\ emissions]- [process\ emissions\ for\ 1\ kt\ recovered\ and\ reclaimed\ or\ recycled\ refrigerant]\]
Equation A3.
\[ Avoided\ emissions\ per\ kt\ of\ recovered\ and\ destroyed\ refrigerant\
= [1\ kt\ released\ refrigerant\ direct\ emissions]\\
- [process\ emissions\ for\ 1\ kt\ recovered\ and\ destroyed\ refrigerant]
+ [production\ emissions\ for\ 1\ kt\ virgin\ refrigerant]\]
Overall avoided emissions per kt of refrigerant managed at end-of-life:
Equation A4.
\[ Average\ avoided\ emissions\ per\ kt\ of\ refrigerant\ managed\ at\ end\text{-}of\text{-}life\\ =\ \frac{1}{2}\ ([avoided\ emissions\ from\ 1\ kt\ recovery\ and\ reuse] +\ [avoided\ emissions\ from\ 1\ kt\ recovery\ and\ destruction])\]
Because survey data indicating the quantity of refrigerants reclaimed and destroyed are not available, we assumed that equal amounts of reclamation and destruction are performed for each kt of refrigerant managed and took the average of the values for these two practices. Our current adoption results suggest that this assumption is reasonable.
In some cases, we could not calculate 20-year values for these process emissions and assumed that they were equivalent to the 100-year values; while the 20-year values are likely to be higher, this had little impact on the overall effectiveness result.
For more details and sources, see Supporting Data.
Appendix B: Calculation of Global Leak Rate
The rate of refrigerant leaked from equipment during use can vary greatly depending on the type and size of the equipment as well as other factors, such as location. Table A1 shows the breakdown by application that we used to estimate a single representative global leak rate. This is a broad estimate and not intended to represent specific applications.
Table A1. Estimated leak rates for various refrigerant applications.
| Application | 2015 Refrigerant consumption (kt) |
Weight factor (% consumption) |
Leak rate (annual %) |
|---|---|---|---|
| Residential refrigeration | 65 | 7.13 | 0.7 |
| Commercial refrigeration | 149 | 16.34 | 15 |
| Industrial refrigeration | 105 | 11.51 | 8.0 |
| Transport refrigeration | 65 | 7.13 | 20 |
| Stationary air conditioning | 396 | 43.42 | 6 |
| Mobile air conditioning | 132 | 14.47 | 12 |
Weighted average leak rate = 9%
Left Text Column Width
Leak rates for each application are a median from several sources. Certain applications were particularly challenging to assign a single representative leak rate. For example, commercial refrigeration comprises many types of equipment, each with a different leak rate. Although we found many unit-specific estimates for leak rates, we do not have data on the prevalence of each equipment type. Therefore, we could not estimate a weighted average from these data and instead only used sources estimating leak rates across commercial refrigeration as a whole. We also excluded large quantities of data on stationary and mobile air conditioning from our analysis for this reason. Our overall leak rate estimate would be much more accurate with more data around the prevalence, charge sizes, and leak rates for specific equipment globally; this would allow us to understand the quantity of refrigerant stock to which to apply each annual leak rate into a better weighted average.
The U.S. EPA considers 20%, 30%, and 10% leak rates from commercial refrigeration, industrial refrigeration, and domestic appliances, respectively, to warrant leak repair (Phasedown of Hydrofluorocarbons, 2021). Our application-specific leak rates were well below these thresholds, suggesting that our estimate of released refrigerant may be lower than real-world leak rates.
For more details, see Supporting Data. Data sources for determining leak rates and consumption percentages are listed here (not every source was used for every application):
Ashford, P., Baker, J. A., Clodic, D., Devotta, S., Godwin, D., Harnisch, J., Irving, W., Jeffs, M., Kuijpers, L., McCulloch, A., Peixoto, R., Uemura, S., & Verdonik, D. P. (2006). Emissions of fluorinated substitutes for ozone depleting substances. In S. Eggleston, L. Buendia, K. Miwa, T. Ngara, & K. Tanabe (Eds.), 2006 IPCC guidelines for national greenhouse gas inventories: Industrial processes and product use. Institute for Global Environmental Strategies, Japan. https://www.ipcc-nggip.iges.or.jp/public/2006gl/pdf/3_Volume3/V3_7_Ch7_ODS_Substitutes.pdf
Booten, C., Nicholson, S., Mann, M., & Abdelaziz, O. (2020). Refrigerants: Market trends and supply chain assessment. https://www.osti.gov/biblio/1599577
California Public Utilities Commission. (2022). Refrigerant avoided cost calculator [Data set]. https://www.cpuc.ca.gov/dercosteffectiveness
CLASP & Institute for Governance & Sustainable Development. (2020). Environmentally harmful dumping of inefficient and obsolete air conditioners in Africa. https://www.clasp.ngo/research/all/environmentally-harmful-dumping-of-inefficient-and-obsolete-air-conditioners-in-africa/?success=1
Department of Climate Change, Energy, the Environment and Water. (2025). National greenhouse accounts factors. Australian Government. http://www.dcceew.gov.au/climate-change/publications/national-greenhouse-accounts-factors
ICF. (2016). Accounting tool to support federal reporting of hydrofluorocarbon emissions: Supporting documentation. https://www.epa.gov/snap/accounting-tool-support-federal-reporting-hydrofluorocarbon-emissions
Koronaki, I. P., Cowan, D., Maidment, G., Beerman, K., Schreurs, M., Kaar, K., Chaer, I., Gontarz, G., Christodoulaki, R. I., & Cazauran, X. (2012). Refrigerant emissions and leakage prevention across Europe – Results from the RealSkillsEurope project. Energy, 45(1), 71–80. https://doi.org/10.1016/j.energy.2012.05.040
United Nations Framework Convention on Climate Change. (2023). National inventory submissions, Annex 1 parties [Data set]. https://unfccc.int/ghg-inventories-annex-i-parties/2023
U.S. Environmental Protection Agency. (2024). Annexes to the inventory of U.S. greenhouse gas emissions and sinks. https://www.epa.gov/ghgemissions/inventory-us-greenhouse-gas-emissions-and-sinks-1990-2022
U.S. Environmental Protection Agency. (n.d.). GreenChill: Partnership accomplishments. https://www.epa.gov/greenchill/partnership-accomplishments
Velders, G. J. M., Daniel, J. S., Montzka, S. A., Vimont, I., Rigby, M., Krummel, P. B., Muhle, J., O’Doherty, S., Prinn, R. G., Weiss, R. F., & Young, D. (2022). Projections of hydrofluorocarbon (HFC) emissions and the resulting global warming based on recent trends in observed abundances and current policies. Atmospheric Chemistry and Physics, 22(9), 6087–6101. https://doi.org/10.5194/acp-22-6087-2022
Velders, G. J. M., Fahey, D. W., Daniel, J. S., Andersen, S. O., & McFarland, M. (2015). Future atmospheric abundances and climate forcings from scenarios of global and regional hydrofluorocarbon (HFC) emissions. Atmospheric Environment, 123, 200–209. https://doi.org/10.1016/j.atmosenv.2015.10.071
Appendix B References
Phasedown of Hydrofluorocarbons, 40 C.F.R. pt. 84 (2021). https://www.ecfr.gov/current/title-40/part-84
Updated Date
Coming Soon Label
Coming Soon
Deploy Alternative Refrigerants
Sector
Buildings & Industry
Mode
Cut Emissions
Cluster
Improve Materials
Image
Image
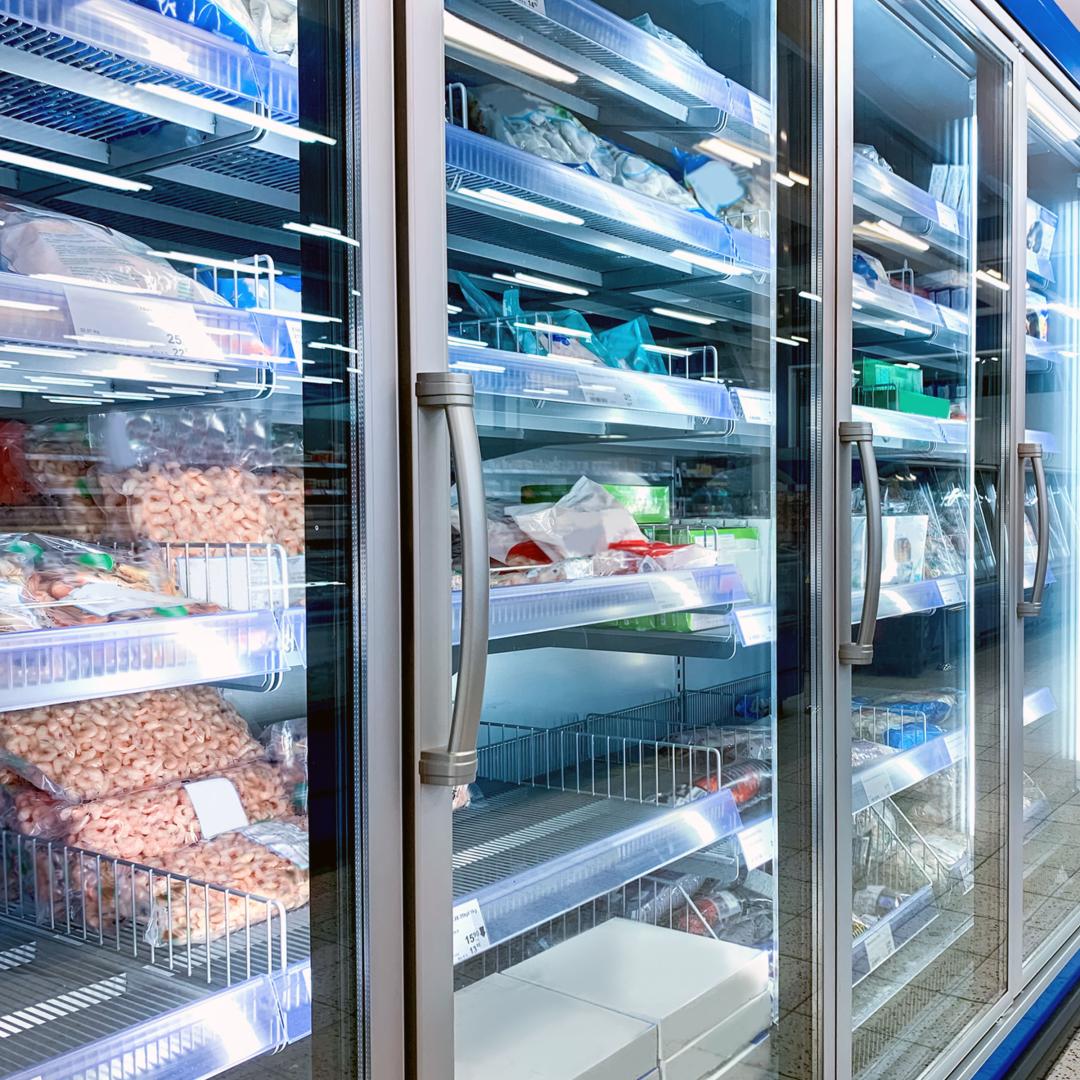
Coming Soon
Off
Key Takeaways
- Many refrigerants – chemicals used to provide heat transfer in air conditioners, refrigerators, and heat pumps – are potent greenhouse gases.
- We can reduce the climate impact of refrigerant chemicals intentionally or accidentally released into the atmosphere by switching to refrigerants that cause less warming.
- Each ton of refrigerant replaced with an alternative prevents around 460 t CO₂‑eq emissions, with a potential impact of 2.7 Gt CO₂‑eq/yr when scaled globally.
- Since many refrigerants are potent short-lived greenhouse gases, this is an emergency brake solution with a large climate benefit in the near term.
Summary
This solution involves reducing the use of high-global warming potential (GWP) refrigerants, instead deploying lower-GWP refrigerants. High-GWP (>800 on a 100-yr basis) fluorinated gases (F-gases) are currently used as refrigerants in refrigeration, air conditioning, and heat pump systems. Over the lifetime of this equipment, refrigerants escape into the atmosphere where they contribute to climate change.
Leaked lower-GWP refrigerant gases trap less heat in the atmosphere than do higher-GWP gases, so using lower-GWP gases reduces the climate impact of refrigerant use. In our analysis, this solution is only deployed as new equipment replaces decommissioned equipment because alternative refrigerants cannot typically be retrofitted into existing systems.
Overview
Refrigerants are chemicals that can absorb and release heat as they move between gaseous and liquid states under changing pressure. In this solution, we considered their use in six applications: residential, commercial, industrial, and transport refrigeration as well as stationary and mobile air conditioning. Heat pumps double as heating sources, though they are included here with air conditioning appliances. Refrigerants are released to the atmosphere during manufacturing, transport, installation, operation, repair, and disposal of refrigerants and equipment. Deploy Alternative Insulation Materials covers the use of refrigerant chemicals to produce foams.
Climate impacts of emissions of refrigerants can be reduced by:
- using lower-GWP refrigerants
- reducing leaks during equipment manufacturing, transport, installation, use, and maintenance
- reclaiming refrigerant at end-of-life and destroying or recycling it
- using less refrigerant through efficiency improvements or reduction in demand.
This solution evaluated the use of lower-GWP refrigerants alone. Leak reduction and responsible disposal are covered in Improve Refrigerant Management. Lowering use of and demand for refrigerants – while outside the scope of these assessments – is the most effective way to reduce emissions.
Most refrigerants used in new equipment today are a group of F-gases called hydrofluorocarbons (HFCs) (Figure 1). HFCs are GHGs and are typically hundreds to thousands of times more potent than CO₂ (Smith et al., 2021). Since high-GWP refrigerants are usually short-lived climate pollutants, their negative climate impacts tend to be concentrated in the near term (Shah et al., 2015). High-GWP HFC production and consumption are being phased down under the Kigali Amendment to the Montreal Protocol, but existing stock and production remains high worldwide (Amendment to the Montreal Protocol on Substances That Deplete the Ozone Layer, 2016; United Nations Framework Convention on Climate Change [UNFCCC], 2023). Other types of refrigerants that deplete the ozone layer – including chlorofluorocarbons (CFCs) and hydrochlorofluorocarbons (HCFCs) — are also being phased out of new production and use globally (Montreal Protocol on Substances That Deplete the Ozone Layer, 1987; Figure 1).
Figure 1. Examples of common refrigerants and their climate and environmental impacts
High-GWP: red; Medium-GWP: yellow; Low-GWP: green
| Type | GWP (20-yr) |
GWP (100-yr) |
Lifetime (yr) |
Ozone Depleting? |
PFAS? | Safety Class* |
|
|---|---|---|---|---|---|---|---|
| R11 | CFC | 8,320 | 6,230 | 52 | Yes | A1 | |
| R12 | CFC | 12,700 | 12,500 | 102 | Yes | A1 | |
| R22 | HCFC | 5,690 | 1,960 | 11.9 | Yes | A1 | |
| R141b | HCFC | 2,710 | 860 | 9.4 | Yes | ||
| R125 | HFC | 6,740 | 3,740 | 30 | No | Yes | A1 |
| R134a | HFC | 4,140 | 1,530 | 14 | No | Yes | A1 |
| R143a | HFC | 7,840 | 5,810 | 51 | No | Yes | A2L |
| R404A | HFC blend | 7,208 | 4,728 | No | Yes | A1 | |
| R407C | HFC blend | 4,457 | 1,908 | No | Yes | A1 | |
| R410A | HFC blend | 4,715 | 2,256 | No | Yes | A1 | |
| R452A | HFC/HFO blend | 4,273 | 2,292 | No | Yes | A1 | |
| R32 | HFC | 2,690 | 771 | 5.4 | No | No | A2L |
| R452B | HFC/HFO blend | 2,275 | 779 | No | Yes | A2L | |
| R454A | HFC/HFO blend | 943 | 270 | No | Yes | A2L | |
| R513A | HFC/HFO blend | 1,823 | 673 | No | Yes | A1 | |
| R290 (Propane) | Natural | 0.072 | 0.02 | 0.036 | No | No | A3 |
| R600a (Isobutane) | Natural | < 1 | < 1 | 0.019 | No | No | A3 |
| R717 (Ammonia) | Natural | < 1 | < 1 | < 1 | No | No | B2L |
| R744 (CO₂) | Natural | 1 | 1 | No | No | A1 | |
| R1234yf | HFO | 1.81 | 0.501 | 0.033 | No | Yes | A2L |
| R1234ze(E) | HFO | 4.94 | 1.37 | 0.052 | No | Yes | A2L |
*Safety classes based on ASHRAE Standard 34:
A1: non-flammable, lower toxicity
A2L: lower flammability, lower toxicity
A3: higher flammability, lower toxicity
B2L: lower flammability, higher toxicity
Sources:
Baha, M., & Dupont, J.-L. (2023, September 15). Global warming potential (GWP) of HFC refrigerants. International Institute of Refrigeration.
Behringer, D., Heydel, F., Gschrey, B., Osterheld, S., Schwarz, W., Warncke, K., Freeling, F., Nödler, K., Henne, S., Reimann, S., Blepp, M., Jörß, W., Liu, R., Ludig, S., Rüdenauer, I., & Gartiser, S. (2021). Persistent degradation products of halogenated refrigerants and blowing agents in the environment: Type, environmental concentrations, and fate with particular regard to new halogenated substitutes with low global warming potential. Final report. Umweltbundesamt [German Environment Agency].
Burkholder, J. B., Hodnebrog, Ø., McDonald, B. C., Orkin, V., Papadimitriou, V. C., & Van Hoomissen, D. (2023). Annex: Summary of abundances, lifetimes, ODPs, REs, GWPs, and GTPs. Scientific Assessment of Ozone Depletion 2022.
Garry, M. (2021, June 23). Certain HFCs and HFOs are in PFAS group that five EU countries intend to restrict.
Smith, C., Nicholls, Z. R. J., Armour, K., Collins, W., Forster, P., Meinshausen, M., Palmer, M. D., & Watanabe, M. (2021). The Earth’s energy budget, climate feedbacks, and climate sensitivity supplementary material. In Climate Change 2021: The Physical Science Basis. Contribution of Working Group I to the Sixth Assessment Report of the Intergovernmental Panel on Climate Change.
Trevisan, T. (2023, July 3). Overview of PFAS refrigerants used in HVAC&R and relevance of refrigerants in the PFAS Restriction Intention. UN Montreal Protocol 45th OEWG, Bangkok.
United Nations Environment Programme. (2023). Refrigeration, Air Conditioning and Heat Pumps Technical Options Committee: 2022 assessment report.
United Nations Environment Programme & ASHRAE. (2025). Update on new refrigerants designations and safety classifications June 2025.
In this solution, production and consumption of high-GWP refrigerants (which we defined as GWP>800, 100-yr basis) are avoided by the use of lower-GWP refrigerants in new equipment. These alternative refrigerants can still leak to the atmosphere, but their heat-trapping effect is much lower. Some promising alternatives have low GWPs (<5, 100-yr basis), including some hydrofluoroolefins (HFOs) as well as natural refrigerants, which include CO₂, ammonia, propane, and isobutane (Figure 1). However, the adoption of these low-GWP refrigerants comes with challenges, including flammability, cost, building codes, breakdown products, and technical limitations (see Risks and Take Action sections below).
Refrigerants with medium GWPs (<800, 100-yr basis; <2,700, 20-yr basis (Smith et al., 2021)) can also be near-term alternatives that increase adoption while providing a climate benefit. In our analysis, we separately considered medium-GWP alternatives in applications where low-GWP alternatives are less common (Figure 2).
Figure 2. Alternative refrigerants used to calculate the low-GWP and medium-GWP scenarios. The low-GWP scenario assumed equipment using high-GWP refrigerants is replaced at end-of-life with equipment using alternative refrigerants with GWP<5. The medium-GWP calculations assumed GWP<800 (100-yr basis) and GWP<2,700 (20-yr basis) alternatives in applications where low-GWP replacements are currently less common (commercial refrigeration, transport refrigeration, stationary air conditioning) and assumed low-GWP replacements for the remaining applications where they are more developed technologies (residential refrigeration, industrial refrigeration, mobile air conditioning). The alternative refrigerants in the table are used for effectiveness and/or cost calculations.
| Application |
Scenario 1: Low-GWP only (low GWP: < 5, 100-year basis) |
Scenario 2: Medium-GWP when low-GWP alternatives are less common, otherwise low-GWP (medium GWP: < 800, 100-year basis) |
|---|---|---|
| Residential refrigeration | Isobutane | |
| Commercial refrigeration | Propane, CO₂ | Medium-GWP HFC and HFO blends |
| Industrial refrigeration | Ammonia, CO₂, propane | |
| Transport refrigeration | Propane, propene, ammonia, CO₂, low-GWP HFOs |
Medium-GWP HFC and HFO blends |
| Mobile air conditioning | CO₂, low-GWP HFOs | |
| Stationary air conditioning | Propane, CO₂, ammonia, low-GWP HFOs |
Medium-GWP HFC and HFO blends |
Sources:
Purohit, P., & Höglund-Isaksson, L. (2017). Global emissions of fluorinated greenhouse gases 2005–2050 with abatement potentials and costs. Atmospheric Chemistry and Physics, 17(4), 2795–2816.
Sustainable Purchasing Leadership Council Climate Friendly Refrigerant Action Team. (2021). Recommendations for climate friendly refrigerant management and procurement.
United Nations Environment Programme. (2023). Refrigeration, Air Conditioning and Heat Pumps Technical Options Committee: 2022 assessment report.
United Nations Framework Convention on Climate Change. (2023). National inventory submissions, Annex 1 parties [Data set].
U.S. Environmental Protection Agency. (2011). Transitioning to low-GWP alternatives in transport refrigeration.
There is currently no single refrigerant that perfectly fits the climate, safety, and performance requirements for all applications. Instead, the optimal alternative refrigerant will vary depending on equipment type and location (United Nations Environment Programme [UNEP], 2023).
Generating electricity to run heating, ventilation, air conditioning, and refrigeration (HVAC&R) equipment also produces high levels of emissions (mostly CO₂ ) at power plants – more than twice the emissions from direct release of refrigerants (United Nations Development Programme [UNDP], 2022). Using alternative refrigerants can impact efficiency, changing these electricity-related emissions. However, indirect emissions are not quantified in this solution.
References
Air-Conditioning, Heating, and Refrigeration Institute. (n.d.-a). A2L refrigerant building code map - Canada. Link to source: https://www.ahrinet.org/a2l-refrigerant-building-code-map-canada
Air-Conditioning, Heating, and Refrigeration Institute. (n.d.-b). A2L refrigerant building code map - US. Link to source: https://www.ahrinet.org/a2l-refrigerant-building-code-map-us
Amendment to the Montreal Protocol on substances that deplete the ozone layer. (2016, October 15). Link to source: https://treaties.un.org/doc/Treaties/2016/10/20161015%2003-23%20PM/Ch_XXVII-2.f-English%20and%20French.pdf
Arp, H. P. H., Gredelj, A., Glüge, J., Scheringer, M., & Cousins, I. T. (2024). The global threat from the irreversible accumulation of trifluoroacetic acid (TFA). Environmental Science & Technology, 58(45), 19925–19935. Link to source: https://doi.org/10.1021/acs.est.4c06189
ASHRAE. (2009). ASHRAE position document on natural refrigerants. Link to source: https://www.epa.gov/sites/default/files/documents/ASHRAE_PD_Natural_Refrigerants_2011.pdf
Babiker, M., Berndes, G., Blok, K., Cohen, B., Cowie, A., Geden, O., Ginzburg, V., Leip, A., Smith, P., Sugiyama, M., & Yamba, F. (2022). Cross-sectoral perspectives. In P. R. Shukla, J. Skea, R. Slade, A. Al Khourdajie, R. van Diemen, D. McCollum, M. Pathak, S. Some, P. Vyas, R. Fradera, M. Belkacemi, A. Hasija, G. Lisboa, S. Luz, & J. Malley (Eds.), Climate change 2022: Mitigation of climate change. Contribution of working group III to the sixth assessment report of the intergovernmental panel on climate change (pp. 1245–1354). Cambridge University Press. Link to source: https://doi.org/10.1017/9781009157926.014
Baha, M., & Dupont, J.-L. (2023, September 15). Global warming potential (GWP) of HFC refrigerants. International Institute of Refrigeration. Link to source: https://iifiir.org/en/encyclopedia-of-refrigeration/global-warming-potential-gwp-of-hfc-refrigerants
Behringer, D., Heydel, F., Gschrey, B., Osterheld, S., Schwarz, W., Warncke, K., Freeling, F., Nödler, K., Henne, S., Reimann, S., Blepp, M., Jörß, W., Liu, R., Ludig, S., Rüdenauer, I., & Gartiser, S. (2021). Persistent degradation products of halogenated refrigerants and blowing agents in the environment: Type, environmental concentrations, and fate with particular regard to new halogenated substitutes with low global warming potential. Final report. Umweltbundesamt [German Environment Agency]. Link to source: https://www.umweltbundesamt.de/sites/default/files/medien/5750/publikationen/2021-05-06_texte_73-2021_persistent_degradation_products.pdf
Blumberg, K., Isenstadt, Taddonio, K. N., Andersen, S. O., & Sherman, N. J. (2019). Mobile air conditioning: The life-cycle costs and greenhouse-gas benefits of switching to alternative refrigerants and improving system efficiencies. Link to source: https://theicct.org/wp-content/uploads/2021/06/ICCT_mobile-air-cond_CBE_201903.pdf
Bolaji, B. O., & Huan, Z. (2013). Ozone depletion and global warming: Case for the use of natural refrigerant – a review. Renewable and Sustainable Energy Reviews, 18, 49–54. Link to source: https://doi.org/10.1016/j.rser.2012.10.008
Booten, C., Nicholson, S., Mann, M., & Abdelaziz, O. (2020). Refrigerants: Market trends and supply chain assessment. Link to source: https://www.osti.gov/biblio/1599577
Burkholder, J. B., Hodnebrog, Ø., McDonald, B. C., Orkin, V., Papadimitriou, V. C., & Van Hoomissen, D. (2023). Annex: Summary of abundances, lifetimes, ODPs, REs, GWPs, and GTPs. Scientific Assessment of Ozone Depletion 2022. Link to source: https://csl.noaa.gov/assessments/ozone/2022/downloads/Annex_2022OzoneAssessment.pdf
California Public Utilities Commission. (2022). Refrigerant avoided cost calculator [Data set]. Link to source: https://www.cpuc.ca.gov/dercosteffectiveness
Campbell, I., Kalanki, A., & Sachar, S. (2018). Solving the global cooling challenge: How to counter the climate threat from room air conditioners. Rocky Mountain Institute. Link to source: https://rmi.org/wp-content/uploads/2018/11/Global_Cooling_Challenge_Report_2018.pdf
Chele, F. S., Salvador, C., Stevenson, L., Dolislager, F., Armstrong, A., Power, S., Mathews, T., & Yana Motta, S. F. (2024). Critical literature review of low global warming potential (GWP) refrigerants and their environmental impact. Oak Ridge National Laboratory. Link to source: https://www.osti.gov/servlets/purl/2528023
CLASP. (2025, December). Mepsy: The appliance & equipment climate impact calculator (Version 1.15.0). Link to source: https://clasp.shinyapps.io/mepsy
CLASP & ATMOsphere. (2022). Global refrigerant impact from 6 appliances in 22 countries. Link to source: https://www.clasp.ngo/wp-content/uploads/2022/05/Refrigerant-Modeling-Interim-Report-APR142022.pdf
Climate and Ozone Protection Alliance. (2025). Global banks of ozone depleting substances (ODS) and hydrofluorocarbons (HFCs). Link to source: https://www.copalliance.org/imglib/publications/2025-04_COPA_Global%20Banks%20ODS%20HFC_update.pdf
Colbourne, D., Croiset, I., Ederberg, L., Heubes, J., Martin, M., Narayan, C., Oppelt, D., Papst, I., Usinger, J., & Gschrey, B. (2013). NAMAs in the refrigeration, air conditioning and foam sectors: A technical handbook. Deutsche Gesellschaft für Internationale Zusammenarbeit (GIZ) GmbH [German Agency for International Cooperation] . Link to source: https://transparency-partnership.net/sites/default/files/e-bruochure-20131015-neu.pdf
Copernicus Climate Change Service. (2023). ERA5 hourly data on single levels from 1940 to present [Data set]. Copernicus Climate Change Service (C3S) Climate Data Store (CDS). Retrieved January 13, 2026 from Link to source: https://doi.org/10.24381/cds.adbb2d47
Crippa, M., Guizzardi, D., Pagani, F., Banja, M., Muntean, M., Schaaf, E., Quadrelli, R., Risquez Martin, A., Taghavi-Moharamli, P., Köykkä, J., Grassi, G., Rossi, S., Melo, J., Oom, D., Branco, A., Suárez-Moreno, M., Sedano, F., San-Miguel, J., Manca, G., … Pekar, F. (2025). GHG emissions of all world countries - 2025 Report (JRC143227). Publications Office of the European Union. Link to source: https://data.europa.eu/doi/10.2760/9816914
Denzinger, P. (2023, December 9). Context and global mitigation potential of “green” ACs. COP28 UAE. Link to source: https://www.green-cooling-initiative.org/fileadmin/user_upload/Final_02_COP28_Side_Event_Green_ACs_Final_Final.pdf
Dimitrakopoulou, M.-E., Karvounis, M., Marinos, G., Theodorakopoulou, Z., Aloizou, E., Petsangourakis, G., Papakonstantinou, M., & Stoitsis, G. (2024). Comprehensive analysis of PFAS presence from environment to plate. npj Science of Food, 8, 80. Link to source: https://doi.org/10.1038/s41538-024-00319-1
Dong, Y., Coleman, M., & Miller, S. A. (2021). Greenhouse gas emissions from air conditioning and refrigeration service expansion in developing countries. Annual Review of Environment and Resources, 46, 59–83. Link to source: https://doi.org/10.1146/annurev-environ-012220-034103
Dräger. (n.d.). Cooling with ammonia: What you should keep in mind. Link to source: https://www.draeger.com/Content/Documents/Content/ammoniak-fa-pdf-8110-en.pdf
Dreyfus, G., Borgford-Parnell, N., Christensen, J., Fahey, D. W., Motherway, B., Peters, T., Picolotti, R., Shah, N., & Xu, Y. (2020). Assessment of climate and development benefits of efficient and climate-friendly cooling. Link to source: https://www.ccacoalition.org/resources/assessment-climate-and-development-benefits-efficient-and-climate-friendly-cooling
Environmental Investigation Agency. (2025). Persistent problems: The hidden impacts of hydrofluoroolefins, the latest generation of fluorinated gases. Link to source: https://eia.org/report/persistent-problems/
European Chemicals Agency. (2023). Annex XV restriction report: Per- and polyfluoroalkyl substances (PFASs). Link to source: https://echa.europa.eu/documents/10162/f605d4b5-7c17-7414-8823-b49b9fd43aea
European Environmental Bureau. (2025). Universal PFAS restriction under REACH: Briefing on fluorinated gases in the universal PFAS restriction—The F-lephant in the room. Link to source: https://eeb.org/wp-content/uploads/2025/02/EEB_EURENI_F-gas_Policy-Brief.pdf
Fabris, F., Fabrizio, M., Marinetti, S., Rossetti, A., & Minetto, S. (2024). Evaluation of the carbon footprint of HFC and natural refrigerant transport refrigeration units from a life-cycle perspective. International Journal of Refrigeration, 159, 17–27. Link to source: https://doi.org/10.1016/j.ijrefrig.2023.12.018
Fenton, S. E., Ducatman, A., Boobis, A., DeWitt, J. C., Lau, C., Ng, C., Smith, J. S., & Roberts, S. M. (2021). Per- and polyfluoroalkyl substance toxicity and human health review: Current state of knowledge and strategies for informing future research. Environmental Toxicology and Chemistry, 40(3), 606–630. Link to source: https://doi.org/10.1002/etc.4890
Food and Agriculture Organization of the United Nations. (2019). The state of food and agriculture 2019: Moving forward on food loss and waste reduction. Link to source: https://openknowledge.fao.org/server/api/core/bitstreams/11f9288f-dc78-4171-8d02-92235b8d7dc7/content
Garavagno, M. d. l. A., Holland, R., Khan, M. A. H., Orr-Ewing, A. J., & Shallcross, D. E. (2024). Trifluoroacetic acid: Toxicity, sources, sinks and future prospects. Sustainability, 16(6), Article 2382. Link to source: https://doi.org/10.3390/su16062382
Garry, M. (2021, June 23). Certain HFCs and HFOs are in PFAS group that five EU countries intend to restrict. Link to source: https://naturalrefrigerants.com/certain-hfcs-and-hfos-are-in-pfas-group-that-five-eu-countries-intend-to-restrict/
Goetzler, W., Guernsey, M., Young, J., Fuhrman, J., & Abdelaziz, O. (2016). The future of air conditioning for buildings. U.S. Department of Energy. Office of Energy Efficiency and Renewable Energy. Building Technologies Office. Link to source: https://www.energy.gov/sites/prod/files/2016/07/f33/The%20Future%20of%20AC%20Report%20-%20Full%20Report_0.pdf
Gradient. (2015). Risk assessment of refrigeration systems using A2L flammable refrigerants. Link to source: https://www.ahrinet.org/system/files/2023-08/AHRI-8009_Final_Report.pdf
Green Cooling Initiative. (n.d.). Global greenhouse gas emissions from the RAC sector. Retrieved April 15, 2025, from Link to source: https://www.green-cooling-initiative.org/country-data
Hanson, M. L., Madronich, S., Solomon, K., Sulbaek Andersen, M. P., & Wallington, T. J. (2024). Trifluoroacetic acid in the environment: Consensus, gaps, and next steps. Environmental Toxicology and Chemistry, 43, 2091–2093. Link to source: https://doi.org/10.1002/etc.5963
Hayes, C., Stausholm, T., Ilana, K., & Devin, Y. (2023). Natural refrigerants: State of the industry. ATMOsphere. Link to source: https://atmosphere.cool/marketreport-2022/
Hersbach, H., Bell, B., Berrisford, P., Hirahara, S., Horányi, A., Muñoz‐Sabater, J., Nicolas, J., Peubey, C., Radu, R., Schepers, D., Simmins, A., Soci, C., Abdalla, S., Abellan, X., Balsamo, G., Bechtold, P., Biavati, G., Bidlot, J., Bonavita, M., … Thépaut, J. N. (2020). The ERA5 global reanalysis. Quarterly Journal of the Royal Meteorological Society, 146(730), 1999–2049. Link to source: https://doi.org/10.1002/qj.3803
Heubes, J., Martin, M., & Oppelt, D. (2012). Refrigeration, air conditioning and foam blowing sectors technology roadmap. GIZ Proklima. Link to source: https://unfccc.int/ttclear/misc_/StaticFiles/gnwoerk_static/TEM_tec_cfi_rm/993ecdfa67144e68b88b4735ea50fcf0/647faaa714484a2983fe6851111ab9aa.pdf
Höglund-Isaksson, L., Purohit, P., Amann, M., Bertok, I., Rafaj, P., Schöpp, W., & Borken-Kleefeld, J. (2017). Cost estimates of the Kigali Amendment to phase-down hydrofluorocarbons. Environmental Science & Policy, 75, 138–147. Link to source: https://doi.org/10.1016/j.envsci.2017.05.006
Holland, R., Khan, M. A. H., Driscoll, I., Chhantyal-Pun, R., Derwent, R. G., Taatjes, C. A., Orr-Ewing, A. J., Percival, C. J., & Shallcross, D. E. (2021). Investigation of the production of trifluoroacetic acid from two halocarbons, HFC-134a and HFO-1234yf and its fates using a global three-dimensional chemical transport model. ACS Earth and Space Chemistry, 5(4), 849–857. Link to source: https://doi.org/10.1021/acsearthspacechem.0c00355
Imamura, T., Kamiya, K., & Sugawa, O. (2015). Ignition hazard evaluation on A2L refrigerants in situations of service and maintenance. Journal of Loss Prevention in the Process Industries, 36, 553–561. Link to source: https://doi.org/10.1016/j.jlp.2014.12.018
Inforum, JMS Consulting, The Alliance for Responsible Atmospheric Policy, & Air-Conditioning, Heating, and Refrigeration Institute. (2019, December 12). Economic & consumer impacts of HFC phasedown. Link to source: https://www.congress.gov/116/meeting/house/110388/documents/HHRG-116-IF18-20200114-SD003.pdf
International Energy Agency. (2023, July 12). Space cooling. Link to source: https://www.iea.org/energy-system/buildings/space-cooling
Intergovernmental Panel on Climate Change. (2023). Climate change 2022: Mitigation of climate change. Working Group III Contribution to the Sixth Assessment Report of the Intergovernmental Panel on Climate Change. Cambridge University Press. Link to source: https://doi.org/10.1017/9781009157926
JMS Consulting & Inforum. (2018). Consumer cost impacts of U.S. ratification of the Kigali Amendment. Link to source: https://www.alliancepolicy.org/site/usermedia/application/10/Consumer_Costs_Final_InforumJMS_20181109.pdf
Kim, B., Lee, S. H., Lee, D., & Kim, Y. (2020). Performance comparison of heat pumps using low global warming potential refrigerants with optimized heat exchanger designs. Applied Thermal Engineering, 171, Article 114990. Link to source: https://doi.org/10.1016/j.applthermaleng.2020.114990
Montreal protocol on substances that deplete the ozone layer. (1987, September 16). Link to source: https://treaties.un.org/doc/publication/unts/volume%201522/volume-1522-i-26369-english.pdf
The North American Sustainable Refrigeration Council. (n.d.). HFC policies & refrigerant regulations by state. Link to source: https://nasrc.org/hfc-policy-tracker/
Ozone Secretariat. (2017, February 17). Frequently asked questions relating to the Kigali Amendment to the Montreal Protocol. United Nations, United Nations Environment Programme. Link to source: https://ozone.unep.org/sites/default/files/FAQs_Kigali_Amendment.pdf
Ozone Secretariat. (2020). Treaties. United Nations, United Nations Environment Programme. Link to source: https://ozone.unep.org/classification-parties
Ozone Secretariat. (n.d.). Country data. United Nations, United Nations Environment Programme. Link to source: https://ozone.unep.org/countries/data
Petri, Y., & Caldeira, K. (2015). Impacts of global warming on residential heating and cooling degree-days in the United States. Scientific Reports, 5(1), Article 12427. Link to source: https://doi.org/10.1038/srep12427
Purohit, P., & Höglund-Isaksson, L. (2017). Global emissions of fluorinated greenhouse gases 2005–2050 with abatement potentials and costs. Atmospheric Chemistry and Physics, 17(4), 2795–2816. Link to source: https://doi.org/10.5194/acp-17-2795-2017
Salvador, C. M., Chele, F. S., Stevenson, L., Dolislager, F., Armstrong, A., Mathews, T., & Yana Motta, S. (2024). Atmospheric transformation of refrigerants: Current research developments and knowledge gaps. International Refrigeration and Air Conditioning Conference, USA, Paper 2671. Link to source: https://docs.lib.purdue.edu/iracc/2671
Secop. (2018). Practical application of refrigerants R600a and R290 in small hermetic systems. Link to source: https://www.secop.com/fileadmin/user_upload/technical-literature/guidelines/application_guideline_r600a_r290_02-2018_desa610a202.pdf
Shah, N., Khanna, N., Karali, N., Park, W. Y., Qu, Y., & Zhou, N. (2017). Opportunities for simultaneous efficiency improvement and refrigerant transition in air conditioning. Lawrence Berkeley National Laboratory. Link to source: https://cooling.lbl.gov/publications/opportunities-simultaneous-efficiency
Shah, N., Wei, M., Letschert, V., & Phadke, A. (2015). Benefits of leapfrogging to superefficiency and low global warming potential refrigerants in room air conditioning. Lawrence Berkeley National Laboratory. Link to source: https://www.osti.gov/servlets/purl/1235571
Shah, N., Wei, M., Letschert, V., & Phadke, A. (2019). Benefits of energy efficient and low-global warming potential refrigerant cooling equipment. Lawrence Berkeley National Laboratory. Link to source: https://cooling.lbl.gov/publications/benefits-energy-efficient-and-low
Sherry, D., Nolan, M., Seidel, S., & Andersen, S. O. (2017). HFO-1234yf: An examination of projected long-term costs of production. Nolan Sherry & Associates, Center for Climate and Energy Solutions, Institute for Governance and Sustainable Development. Link to source: https://www.c2es.org/wp-content/uploads/2017/04/hfo-1234yf-examination-projected-long-term-costs-production.pdf
Smith, C., Nicholls, Z. R. J., Armour, K., Collins, W., Forster, P., Meinshausen, M., Palmer, M. D., & Watanabe, M. (2021). The Earth’s energy budget, climate feedbacks, and climate sensitivity supplementary material. In Climate Change 2021: The Physical Science Basis. Contribution of Working Group I to the Sixth Assessment Report of the Intergovernmental Panel on Climate Change. Link to source: https://www.ipcc.ch/report/ar6/wg1/downloads/report/IPCC_AR6_WGI_Chapter07_SM.pdf
Sustainable Purchasing Leadership Council Climate Friendly Refrigerant Action Team. (2021). Recommendations for climate friendly refrigerant management and procurement. Link to source: https://www.igsd.org/publications/recommendations-for-climate-friendly-refrigerant-management-and-procurement/
Trevisan, T. (2023, July 3). Overview of PFAS refrigerants used in HVAC&R and relevance of refrigerants in the PFAS Restriction Intention. UN Montreal Protocol 45th OEWG, Bangkok. Link to source: https://ozone.unep.org/system/files/documents/OEWG45_ATMO_sidevent.pdf
United Nations Development Programme. (2022). Guidance note: Assessing greenhouse gas emissions from refrigerants use in UNDP operations. Link to source: https://www.undp.org/sites/g/files/zskgke326/files/2022-07/Refrigerants%20methodology%20version%20July%202022.pdf
United Nations Environment Programme. (2022). Medical and Chemical Technical Options Committee: 2022 assessment report. Link to source: https://ozone.unep.org/system/files/documents/MCTOC-Assessment-Report-2022.pdf
United Nations Environment Programme. (2023). Refrigeration, Air Conditioning and Heat Pumps Technical Options Committee: 2022 assessment report. Link to source: https://ozone.unep.org/system/files/documents/RTOC-assessment%20-report-2022.pdf
United Nations Environment Programme & ASHRAE. (2025). Update on new refrigerants designations and safety classifications June 2025. Link to source: https://www.ashrae.org/file%20library/professional%20development/ashrae-unep/unep---ashrae-factsheet--english.pdf
United Nations Framework Convention on Climate Change. (2023). National inventory submissions, Annex 1 parties [Data set]. Link to source: https://unfccc.int/ghg-inventories-annex-i-parties/2023
U.S. Environmental Protection Agency. (2011). Transitioning to low-GWP alternatives in transport refrigeration. Link to source: https://www.epa.gov/sites/default/files/2015-07/documents/transitioning_to_low-gwp_alternatives_in_transport_refrigeration.pdf
U.S. Environmental Protection Agency. (2025). Frequent questions on the phasedown of hydrofluorocarbons. Link to source: https://www.epa.gov/climate-hfcs-reduction/frequent-questions-phasedown-hydrofluorocarbons
Velders, G. J. M., Daniel, J. S., Montzka, S. A., Vimont, I., Rigby, M., Krummel, P. B., Muhle, J., O’Doherty, S., Prinn, R. G., Weiss, R. F., & Young, D. (2022). Projections of hydrofluorocarbon (HFC) emissions and the resulting global warming based on recent trends in observed abundances and current policies. Atmospheric Chemistry and Physics, 22(9), 6087–6101. Link to source: https://doi.org/10.5194/acp-22-6087-2022
Velders, G. J. M., Fahey, D. W., Daniel, J. S., Andersen, S. O., & McFarland, M. (2015). Future atmospheric abundances and climate forcings from scenarios of global and regional hydrofluorocarbon (HFC) emissions. Atmospheric Environment, 123, 200–209. Link to source: https://doi.org/10.1016/j.atmosenv.2015.10.071
World Meteorological Organization. (2018). Executive summary: Scientific assessment of ozone depletion: 2018 (Report No. 58). Link to source: https://ozone.unep.org/sites/default/files/2019-04/SAP-2018-Assessment-report-ES-rev%20%281%29.pdf
Zaelke, D., & Borgford-Parnell, N. (2015). The importance of phasing down hydrofluorocarbons and other short-lived climate pollutants. Journal of Environmental Studies and Sciences, 5(2), 169–175. Link to source: https://doi.org/10.1007/s13412-014-0215-7
Zanchi, V., Boban, L., & Soldo, V. (2019). Refrigerant options in the near future. Journal of Sustainable Development of Energy, Water and Environment Systems, 7(2), 293–304. Link to source: https://doi.org/10.13044/j.sdewes.d6.0250
Credits
Lead Fellow
Sarah Gleeson, Ph.D.
Contributors
Ruthie Burrows, Ph.D.
James Gerber, Ph.D.
Daniel Jasper
Alex Sweeney
Internal Reviewers
Aiyana Bodi
James Gerber, Ph.D.
Hannah Henkin
Heather McDiarmid, Ph.D.
Ted Otte
Amanda D. Smith, Ph.D.
Effectiveness
For every kt high-GWP refrigerant phased out in favor of low-GWP refrigerant, approximately 460,000 t CO₂‑eq/yr of F-gas emissions will be mitigated on a 100-yr basis (Table 1). If medium-GWP refrigerants are instead adopted in certain applications (Figure 2), the effectiveness decreases to 400,000 t CO₂‑eq (100-yr)/kt high-GWP refrigerant phased out/yr (Table 1). Effectiveness is based on average GWP of the high-, low-, and medium-GWP refrigerants; the difference in refrigerant charge; and the expected percent released to the atmosphere.
Since F-gases are short-lived climate pollutants, the effectiveness of this solution on a 20-yr basis is higher than on a 100-yr basis. Switching to low-GWP refrigerants saves 860,000 t CO₂‑eq /kt high-GWP refrigerant phased out/yr on a 20-yr basis. Medium-GWP refrigerants in certain applications reduces the effectiveness to 700,000 t CO₂‑eq (20-yr)/kt high-GWP refrigerant phased out/yr.
Using low-GWP refrigerants mitigates almost all CO₂‑eq emissions from direct release of high-GWP refrigerants. Medium-GWP refrigerants potentially offer a faster path to adoption in certain applications, but yield a smaller reduction in CO₂‑eq emissions. Switching to the lowest possible GWP refrigerant appropriate for a given application will have the highest effectiveness at cutting emissions.
Table 1. Effectiveness at reducing emissions using low-GWP refrigerants only or medium-GWP refrigerants in some applications and low-GWP alternatives otherwise
Unit: t CO₂‑eq /kt high-GWP refrigerant phased out/yr, 100-yr basis
| Average – low GWP only | 460000 |
| Average – medium & low GWP | 400000 |
Left Text Column Width
Cost
We estimated the cost of purchasing and using low-GWP alternative refrigerants and equipment by taking a weighted average across all application types, averaging to US$23 million/kt high-GWP refrigerant phased out/yr. A kt of refrigerant goes a long way; a typical residential air conditioner requires only 0.6–3 kg refrigerant, depending on the country and refrigerant type (CLASP & ATMOsphere, 2022). On average across all applications, the emissions abatement cost for this solution is only US$50/t CO₂‑eq on a 100-yr basis (Table 2), or US$27/t CO₂‑eq on a 20-yr basis.
We separately evaluated the net costs of using medium-GWP refrigerants in some applications (Figure 2). Using medium-GWP refrigerants brought average costs down to US$9.4 million/kt high-GWP refrigerant phased out/yr. The emissions abatement cost is US$24/t CO₂‑eq (100-yr basis) or US$13/t CO₂‑eq (20-yr basis).
We calculated cost using values of initial cost and annual operation and maintenance costs from Purohit and Höglund-Isaksson (2017). The overall net cost is a weighted average of the average net costs of switching to alternative refrigerants for each of the six refrigerant applications (Figure 2). Costs are likely to change as the HFC phase-down continues under the Kigali Amendment. We did not evaluate external costs such as those to manufacturers.
Although our calculated costs are averages, costs varied widely depending on the specific equipment, refrigerant type, and geographic location. Using ammonia in industrial refrigeration yields net savings of US$24 million/kt high-GWP refrigerant/yr. Low-GWP alternative refrigerants for transport refrigeration lead to cost savings over high- or medium-GWP refrigerants, as do hydrocarbons in residential and commercial air conditioning.
We did not consider energy cost differences due to changes in efficiency. Since electricity costs are the majority of the life-cycle costs for certain equipment, these changes in energy costs may be significant (Goetzler et al., 2016).
Table 2. Cost per unit of climate impact for low-GWP refrigerants.
Unit: 2023 US$/t CO₂‑eq , 100-yr basis
| Average | 50.00 |
Left Text Column Width
Methods and Supporting Data
Learning Curve
We did not find a learning rate for this solution, although there is evidence that costs of equipment and refrigerant decrease as more alternative refrigerants are deployed. Zanchi et al. (2019) claim that after regulations limiting emissions from F-gases and capping allowable refrigerant GWP were enacted in Europe, component prices for natural refrigerant equipment – particularly in commercial refrigeration – became comparable with lower HFC unit prices. Equipment prices have trended downwards through other similar technological transitions in the past (JMS Consulting & Inforum, 2018).
The cost of refrigerants can change with adoption as well as the cost of equipment. Natural refrigerants tend to be inexpensive, but cost premiums for expensive HFO refrigerants could drop by more than 75% as production volumes increase (Booten et al., 2020). Certain expensive-to-produce alternative refrigerants like HFO-1234yf have limited information about possible future price reductions, but other refrigerant transitions have indicated that prices should decrease due to increased production experience, capacity, and number of producers – especially as patents expire (Sherry et al., 2017).
Speed of Action
Speed of action refers to how quickly a climate solution physically affects the atmosphere after it is deployed. This is different from speed of deployment, which is the pace at which solutions are adopted.
At Project Drawdown, we define the speed of action for each climate solution as emergency brake, gradual, or delayed.
Deploy Alternative Refrigerants is an EMERGENCY BRAKE climate solution. It has the potential to deliver a more rapid impact than gradual and delayed solutions. Because emergency brake solutions can deliver their climate benefits quickly, they can help accelerate our efforts to address dangerous levels of climate change. For this reason, they are a high priority.
Caveats
Permanence
There is a low risk of the emissions reductions for this solution being reversed. Each kt high-GWP refrigerant phased out for a lower-GWP alternative reduces the emissions from refrigerant release during manufacturing, transport, installation, operation, repair, and disposal of equipment.
Additionality
This solution is additional when alternative refrigerant is used in applications that would have used HFCs or other high-GWP refrigerants in recent history. HFCs are not the baseline refrigerant in every scenario: hydrocarbons, for example, have been widely used in residential refrigeration and ammonia in industrial refrigeration for many years.
In our analysis, we considered any path to adoption of alternative refrigerants to be part of its effectiveness at reducing GHG emissions. For example, we considered all HFC reductions mandated by policy to be considered additional over baseline HFC usage. However, some GHG accounting or crediting organizations would consider this regulatory additionality; the only emissions reductions that count as additional would be those not mandated by international, regional, and application-specific policy limits.
Current Adoption
We estimated that 440 kt high-GWP refrigerants already have been phased out in favor of low-GWP alternative refrigerants worldwide (Table 3). For adoption, we did not differentiate between low- and medium-GWP alternative refrigerants due to insufficient data.
There are limited recent and global data available to quantify the adoption of alternative refrigerants. For this reason, our approach to quantifying adoption is a simplified approximation. We used projected 2022 HFC emissions from Velders et al. (2015) as our baseline. These projections were made before any Kigali Amendment phase-down began, and we assumed they represent a reasonable 2022 emissions picture in the absence of policy-regulated HFC reductions.
To calculate current adoption, we analyzed a Velders et al. (2022) model of 2022 HFC emissions accounting for current policies. Projected 2022 emissions in the current model were 6.4% lower than the 2015-projected baseline, which we assumed to be proportional to the amount of high-GWP HFC phased out and replaced with low-GWP alternatives. We estimated current adoption by applying this assumption to an estimated 6,480 kt bank of existing refrigerants (Climate and Ozone Protection Alliance, 2025). That bank includes all HFC and ozone-depleting refrigerants in new, in-use, and end-of-life equipment, and represents the potential refrigerant that could be replaced by alternative refrigerants. Since some alternative refrigerants were adopted before our 2015 baseline, the current adoption value is likely an underestimate.
Some applications are known to have higher levels of current adoption than others. For example, 800 million domestic refrigerators are estimated to use isobutane refrigerant globally, and most of the market for commercial supermarket plug-in cases in Europe, the United States, and Japan use hydrocarbons such as propane (Hayes et al., 2023; UNEP, 2023).
Table 3. Current (2022 modeled) adoption level of low-GWP alternative refrigerants relative to 2015 baseline levels.
Unit: kt high-GWP refrigerant phased out
| Estimate | 440 |
Left Text Column Width
Adoption Trend
We estimated that 77 kt high-GWP refrigerants are phased out for alternative low-GWP refrigerants each year (Table 4). Using the same method as current adoption, we compared baseline and policy-adjusted projections of HFC emissions from Velders et al. (2015, 2022) for 2019–2022. The difference between the projections increased by a median 1.2% year-over-year.
We applied this percent change directly to the 2022 HFC refrigerant bank estimate to determine the tonnage of high-GWP refrigerant that will be phased out as new equipment replaces decommissioned stock. We assumed the replacements all use low-GWP refrigerants.
Although more HFC is being phased out each year, the bank and associated emissions of HFCs are also growing as refrigeration and cooling equipment are more heavily used globally. Alternative refrigerant adoption will need to outpace market growth before net emissions reductions occur. The adoption trend is likely higher today than what is reflected by the data used in our calculations (prior to 2023), since 2024 was a Kigali-mandated increase in HFC phase-down for certain countries. We expect adoption trend to continue to increase as HFC restrictions tighten further in the future.
Table 4. 2019–2022 adoption trend of low-GWP alternative refrigerants.
Unit: kt high-GWP refrigerant phased out/yr
| Estimate | 77 |
Left Text Column Width
Adoption Ceiling
The adoption ceiling for this solution is phasing out all high-GWP refrigerants, or 6,900 kt globally (Table 5). This value represents the entire current bank of HFCs and ozone-depleting refrigerants added to the current adoption of low-GWP refrigerants (Climate and Ozone Protection Alliance, 2025).
This quantity assumes no increase in the total refrigerant bank above 2022 levels, while in reality the bank is projected to increase substantially as demand for cooling and refrigeration grows worldwide (International Energy Agency [IEA], 2023). Consumption of refrigerants in stationary air conditioning applications alone is projected to increase 3.5-fold between 2020–2050 (Denzinger, 2023). Additionally, new equipment that uses refrigerants (such as heat pump water heaters) is expected to replace non-refrigerant equipment, adding to future refrigerant demand. However, projecting future refrigerant demand was not part of this assessment.
We assumed that in all future cases, high-GWP refrigerants can be phased out for low-GWP alternatives. While ambitious, this ceiling is possible across all applications as new refrigerants, blends, and equipment are developed and commercialized. Since we considered implementation in new equipment, it comes with an adoption delay as existing equipment with high-GWP refrigerants finish their lifespans, which can last 10–20 years (California Public Utilities Commission, 2022; CLASP & ATMOsphere, 2022).
Table 5. Adoption ceiling for low-GWP refrigerants.
Unit: kt high-GWP refrigerant phased out
| Estimate | 6,900 |
Left Text Column Width
Achievable Adoption
The achievable adoption range is clearly laid out by the Kigali Amendment schedule for reduction in HFC consumption and production. The Achievable – Low adoption assumes that worldwide, all countries meet the Kigali phase-down schedule and collectively reach 80% reduction from baseline emissions by 2045. Under the Kigali Amendment, all participating countries are expected to meet at least this standard by this date. It is achievable that this adoption level could be reached collectively across all nations (including higher-adopting countries and non-Kigali signatories). This comes to 5,500 kt reduction in high-GWP refrigerants, calculated as 80% of the sum of net bank and current adoption (Table 6).
Achievable – High assumes that all countries average the highest Kigali-mandated HFC reduction levels for any country (85% reduction from baseline), which comes to 5,900 kt high-GWP refrigerant phased out when applied to our adoption ceiling. If countries continue to follow the Kigali Amendment phase-down schedule, most production and use of HFCs will be eliminated over the coming decades. Other high-GWP ozone-depleting refrigerants are mostly phased out of new production under the Montreal Protocol, although large quantities still exist in refrigerant banks (Montreal Protocol on Substances That Deplete the Ozone Layer, 1987).
Our achievable adoption values do not account for growth in the refrigerant bank over 2022 levels. Although refrigerant use is expected to grow substantially in the coming decades (IEA, 2023), we did not project future demand as part of our assessment. If HFC phaseout does not outpace refrigerant demand growth, emissions can increase despite more widespread adoption of this solution. Lowering the demand for refrigerant while ensuring that all people have access to refrigeration, heating, and cooling will be challenging.
Table 6. Range of achievable adoption levels for low-GWP refrigerants.
Unit: kt high-GWP refrigerant phased out
| Current adoption | 440 |
| Achievable – low | 5500 |
| Achievable – high | 5900 |
| Adoption ceiling | 6900 |
Left Text Column Width
This solution has high potential climate impact due to both the quantity and high GWP of many current refrigerants. High-GWP refrigerant already phased out for low-GWP alternatives has an estimated current climate impact of 0.20 Gt CO₂‑eq/yr on a 100-yr basis (Table 7). If the Kigali Amendment HFC phasedown schedule is followed globally, we expect the achievable-adoption climate impact to be 2.5–2.7 Gt CO₂‑eq (100-yr)/yr. Reaching the adoption ceiling could potentially mitigate 3.2 Gt CO₂‑eq (100-yr)/yr.
Due to the short lifetime of most high-GWP refrigerants, the climate benefit of phasing them out for alternatives is higher on a 20-year time horizon, making this solution highly impactful in the short-term. The use of low-GWP refrigerants currently saves an estimated 0.38 Gt CO₂‑eq (20-yr)/yr. The achievable 20-year impact is 4.7–5.0 Gt CO₂‑eq/yr, with a ceiling of 5.9 Gt CO₂‑eq/yr.
Since medium-GWP refrigerants are less effective at reducing emissions, the climate impacts are lower. If the same achievable adoption scenarios are reached but the effectiveness is calculated for medium-GWP refrigerants in commercial refrigeration, transport refrigeration, and stationary air conditioning applications, the climate impact reduces to 2.2–2.4 Gt CO₂‑eq (100-yr)/yr or 3.9–4.1 Gt CO₂‑eq (20-yr)/yr.
Our findings for impact are higher than many estimates of the scale of current refrigerant emissions. This is because other reports of F-gas emissions typically do not include high-GWP ozone-depleting refrigerants such as CFCs and HCFCs. The IPCC Sixth Assessment (2023) estimates 1.4 ± 0.41 GtCO₂‑eq/yr of 2019 emissions were F-gases from all sources, but this value does not include CFCs or HCFCs. The UNEP (2022) estimates that CFCs and HCFCs stored in equipment produce almost twice as many CO₂‑eq emissions as HFCs do. Our calculated achievable climate impact accounts for all major high-GWP refrigerant chemicals (CFCs, HCFCs, and HFCs), and therefore an achievable climate impact much higher than 1.4 GtCO₂‑eq/yr is reasonable.
Table 7. Climate impact at different levels of adoption of low-GWP alternative refrigerants.
Unit: Gt CO₂‑eq/yr, 100-yr basis
| Current adoption | 0.20 |
| Achievable – low | 2.50 |
| Achievable – high | 2.70 |
| Adoption ceiling | 3.20 |
Left Text Column Width
Additional Benefits
Income and Work
Transitioning from HFCs to refrigerants with lower GWP can increase jobs (Colbourne et al., 2013; U.S. EPA, 2025). Reports from the Alliance for Responsible Atmospheric Policy and collaborators found that moving toward lower GWP refrigerants in the United States would increase jobs, increase manufacturing outputs of alternative refrigerants, and create more exports, strengthening the United States’ trade position (Inforum et al., 2019; JMS Consulting & Inforum, 2018). It is possible that using alternative refrigerants could lead to consumer savings on energy bills, depending on the alternative refrigerant, application, and equipment design (Colbourne et al., 2013; Purohit & Höglund-Isaksson, 2017; Shah et al., 2019; Zaelke & Borgford-Parnell, 2015). For example, an analysis of mobile air conditioning found that switching to an alternative refrigerant, such as R152a, can lead to high cost savings over its lifetime, and consumers in hotter climates would see the savings benefits (Blumberg et al., 2019). Since efficiency improvements are possible but not guaranteed in all cases, we do not consider this a guaranteed additional benefit.
Land Resources
For a description of the benefits to land resources, please refer to Air Quality below.
Air Quality
Some F-gases such as HFCs are considered per- and polyfluoroalkyl substances (PFAS) and can persist in the environment for centuries, posing serious human and ecosystem health risks (Figure 1) (Dimitrakopoulou et al., 2024; Fenton et al., 2021). PFAS can decompose in the atmosphere to produce trifluoroacetic acid (TFA), which can harm the environment and human health (UNEP, 2023). Possible impacts of high atmospheric TFA concentrations include acid rain, accumulation in terrestrial ecosystems in water and plant matter, and harmful effects on the environment and organisms (Chele et al., 2024; Hanson et al., 2024). Non-fluorinated alternative refrigerants would reduce the amount of PFAS pollution and reduce atmospheric TFA formation, lessening these harmful impacts. Some of these air quality benefits would also benefit indoor air quality because most refrigerants are used in buildings. Using alternative refrigerants avoids release of ozone-depleting substances such as HCFCs that can harm the ozone layer (Bolaji & Huan, 2013).
These benefits depend on the alternative refrigerant used – some low-GWP F-gas refrigerants such as HFOs are highly reactive, can be classified as PFAS, and can form TFA and other degradation products (Salvador et al., 2024). Therefore, the type of alternative refrigerant affects whether this is a benefit or a risk (see Risks below for more information). The thresholds at which these impacts occur are not well understood, and more research is needed to understand the potential harmful effects of TFA (Arp et al., 2024).
Risks
There are risks associated with fluorinated alternative refrigerants (HFOs or HFCs), which have uncertain environmental and health impacts and indirectly contribute to climate change. HFOs and HFCs degrade in the atmosphere into TFA, which is considered by some regulating bodies to be a PFAS, a class of chemicals with a proposed ban in Europe (European Chemicals Agency, 2023; European Environmental Bureau, 2025; Garavagno et al., 2024). Although TFA concentrations are currently low and impacts are minimal, PFAS remain in the environment for long periods. Increased HFO use could lead to greater TFA accumulation, and the impacts of higher concentrations on health and the environment are not well known (Environmental Investigation Agency, 2025). Therefore, it is important to study the potential risks of TFA pollution further and be cautious with using fluorinated alternative refrigerants (Chele et al., 2024; Environmental Investigation Agency, 2025; European Environmental Bureau, 2025; Hanson et al., 2024; Holland et al., 2021). Moreover, producing HFOs can have high-GWP or ozone-depleting feedstocks, intermediates, or by-products. This leads to the perpetuated use and emission of climate-warming and ozone-damaging chemicals (Booten et al., 2020; Chele et al., 2024; Environmental Investigation Agency, 2025). The use of other alternative refrigerant chemistries will reduce the risks of fluorinated refrigerants (see Figure 1 and Additional Benefits).
Some alternative refrigerants can be flammable (e.g., propane, ammonia), be toxic (e.g., ammonia), or react in the atmosphere to form polluting or toxic compounds (e.g. propane, ammonia) (Chele et al., 2024). This potentially risks the well-being of people or property due to ignition, explosion, or refrigerant leaks (Shah et al., 2017). Minimizing leaks, reducing proximity to ignition sources, enhancing leak sensing, regulating safe charge sizes, and training installation and maintenance professionals are ways to lower this risk (Secop, 2018). Many alternative refrigerants are classified in ASHRAE safety group A2L, and these refrigerants have a low risk of ignition (Gradient, 2015; Imamura et al., 2015). Many countries have updated their standards in recent years to ensure safe use of low-GWP refrigerants, but adoption can be slowed if building codes do not allow for adoption (Heubes et al., 2012; UNEP, 2023).
Some specific technological solutions are required to avoid risks – for example, ammonia corrodes copper (Dräger, n.d.), and CO₂ refrigerant requires equipment and safety mechanisms that can handle its high operating pressure (Zanchi et al., 2019).
Interactions with Other Solutions
Reinforcing
Deploying alternative refrigerants will reduce the negative climate impact of new food refrigeration equipment. Since decreasing food loss and waste might require increases in commercial, residential, and transport refrigeration (Babiker et al., 2023; Food and Agriculture Organization of the United Nations, 2019), it will be more effective if the refrigerants used have lower GWPs. This impact will be strongest for large and currently leaky equipment such as supermarket refrigeration. However, if less food is produced to better manage food loss, this could instead lead to a decreased demand for cold storage and less reinforcing interaction between these solutions (Dong et al., 2021).
Competing
Alternative refrigerants require design changes (Kim et al., 2020) that could increase the up-front cost of heat pumps.
Using alternative refrigerants will decrease the CO₂‑eq emissions from released refrigerants. This means that management practices to reduce refrigerant release will save fewer CO₂‑eq emissions.
Dashboard
Solution Basics
kt high-GWP refrigerant phased out
t CO₂-eq (100-yr)/unit/yr
460,000
units
Current 440
05,5005,900
Achievable (Low to High)
Climate Impact
Gt CO₂-eq (100-yr)/yr
Current 0.2
2.52.7
US$ per t CO₂-eq
50
Emergency Brake
F-gases
Trade-offs
For particular alternative refrigerants and applications, switching to a lower-GWP refrigerant can reduce equipment efficiency (ASHRAE, 2009). Such a switch would decrease direct emissions due to reduction in refrigerant GWP, but would increase emissions associated with electricity generation.
Less efficient refrigerants may also require larger equipment and heavier masses of refrigerants, increasing the emissions for producing and transporting appliances. Fabris et al. (2024) reported that transport refrigeration systems using CO₂ refrigerant are heavier, leading to a 9.3% increase in emissions from fuel consumption during transport.
°C days
Space cooling demand (21 °C basis)
This map shows the annual average cooling degree days (CDD) for the decade ending in 2025. CDD are a measure of how much the temperature in a location exceeds 21 °C each day, summed cumulatively over a year. Regions with greater cooling degree days will likely have higher demand for space cooling equipment to maintain a comfortable indoor air temperature in buildings and vehicles.
Copernicus Climate Change Service. (2023). ERA5 hourly data on single levels from 1940 to present [Data set]. Copernicus Climate Change Service (C3S) Climate Data Store (CDS). Retrieved January 13, 2026 from Link to source: https://doi.org/10.24381/cds.adbb2d47
Hersbach, H., Bell, B., Berrisford, P., Hirahara, S., Horányi, A., Muñoz‐Sabater, J., Nicolas, J., Peubey, C., Radu, R., Schepers, D., Simmins, A., Soci, C., Abdalla, S., Abellan, X., Balsamo, G., Bechtold, P., Biavati, G., Bidlot, J., Bonavita, M., … Thépaut, J. N. (2020). The ERA5 global reanalysis. Quarterly Journal of the Royal Meteorological Society, 146(730), 1999–2049. Link to source: https://doi.org/10.1002/qj.3803
°C days
Space cooling demand (21 °C basis)
This map shows the annual average cooling degree days (CDD) for the decade ending in 2025. CDD are a measure of how much the temperature in a location exceeds 21 °C each day, summed cumulatively over a year. Regions with greater cooling degree days will likely have higher demand for space cooling equipment to maintain a comfortable indoor air temperature in buildings and vehicles.
Copernicus Climate Change Service. (2023). ERA5 hourly data on single levels from 1940 to present [Data set]. Copernicus Climate Change Service (C3S) Climate Data Store (CDS). Retrieved January 13, 2026 from Link to source: https://doi.org/10.24381/cds.adbb2d47
Hersbach, H., Bell, B., Berrisford, P., Hirahara, S., Horányi, A., Muñoz‐Sabater, J., Nicolas, J., Peubey, C., Radu, R., Schepers, D., Simmins, A., Soci, C., Abdalla, S., Abellan, X., Balsamo, G., Bechtold, P., Biavati, G., Bidlot, J., Bonavita, M., … Thépaut, J. N. (2020). The ERA5 global reanalysis. Quarterly Journal of the Royal Meteorological Society, 146(730), 1999–2049. Link to source: https://doi.org/10.1002/qj.3803
Maps Introduction
Deploy Alternative Refrigerants is most effective at mitigating climate change in regions with high levels of current refrigerant use. Unfortunately, there are no comprehensive data available at the country level to estimate the quantity of high-GWP or alternative refrigerants stored in equipment. Countries report HFC stocks and emissions for refrigeration and air conditioning to the UNFCCC, but these do not include high-GWP ozone-depleting substances such as CFCs and HCFCs (UNFCCC, 2023). Since national emissions estimates such as the Emissions Database for Global Atmospheric Research (EDGAR) do not report high-GWP ozone-depleting F-gases, we do not include these data in this analysis (Crippa et al., 2025). The UNEP does track CFC, HCFC, and HFC production and consumption, but this does not provide a comprehensive use or emissions picture since many current emissions are from stock already contained in existing equipment (Ozone Secretariat, n.d.).
Regions with greater cooling demand are likely to require more refrigerant use for refrigeration and air conditioning. Regional patterns of where this solution is most important may evolve in the future as cooling appliances become more widespread and the climate warms.
International, national, and local policies have a large impact on the adoption of alternative refrigerants. The Kigali Amendment to the Montreal Protocol mandates HFC phasedown schedules for participating countries through 2047. Additionally, local building codes and policies influence the use of alternative refrigerants. The Air-Conditioning, Heating, and Refrigeration Institute (AHRI) and The North American Sustainable Refrigeration Council (NASRC) give region-specific information in North America about such policies (AHRI, n.d.-a, n.d.-b; NASRC, n.d.).
CLASP found that in 2025, China and the United States had the highest numbers of both residential air conditioners and refrigerator-freezers (CLASP, 2025). This suggests that residential refrigerant use and emissions are likely to be highest in these countries.
Emissions from producing refrigerants will be higher in locations with more refrigerant manufacturing. Refrigerant manufacturing is more common in locations that are close to chemical feedstocks, have financial incentives, and have experienced and cheap labor (Booten et al., 2020).
Action Word
Deploy
Solution Title
Alternative Refrigerants
Classification
Highly Recommended
Lawmakers and Policymakers
- Develop national cooling plans and integrate them into national climate plans.
- Enact comprehensive policies that incentivize the lowest possible GWP refrigerants, penalize high-GWP refrigerants, and provide updated building code requirements.
- Create government procurement policies that become stricter over time to mandate the use of alternative refrigerants or implement refrigerant GWP limits in government buildings and cooling systems.
- Offer financial incentives such as subsidies, tax credits, and grants for using alternative refrigerants.
- Implement the transition to alternative refrigerants while simultaneously working to improve equipment energy efficiency.
- Implement an array of safety regulations that reduce the risk of leaks and exposure, such as restricting charge sizes, improving ventilation and leak sensors, and requiring certification for professionals.
- Create free workforce training programs to improve safety around installation and maintenance.
- Invest in R&D to improve availability, compatibility with existing equipment, and safety of alternative refrigerants.
- Require detailed recordkeeping for vendors, contractors, and technicians to track and report on refrigerant types and amounts in use.
- Develop refrigerant audit programs similar to energy audit programs.
- Conduct consultations with national and local government agencies, businesses, schools, universities, farmers, healthcare professionals, research institutions, nonprofits, and the public to determine how best to transition local supply chains to alternative refrigerants.
- Create certification schemes to identify which businesses utilize alternative refrigerants.
- Offer educational resources, creating one-stop shops for information on alternative refrigerants and energy efficiency; offer demonstrations, highlighting their cost savings and climate benefits.
- Create, support, or join networks or partnerships dedicated to advancing and deploying alternative refrigerants.
Further information:
- Refrigeration, air conditioning and foam blowing sectors technology roadmap. Heubes et al. (2012)
- Space cooling. IEA (2023)
- Government relations and public policy job function action guide. Project Drawdown (2022)
- Legal job function action guide. Project Drawdown (2022)
- Cooling emissions and policy synthesis report: Benefits of cooling efficiency and the Kigali Amendment. UNEP & IEA (2020)
Practitioners
- Use alternative refrigerants and equipment that uses the lowest possible GWP refrigerant, and phase in alternative refrigerants throughout the rest of your supply chain.
- Advocate for comprehensive policy plans that incentivize the lowest possible GWP refrigerants, penalize high-GWP refrigerants, and provide updated building code requirements.
- Avoid venting or intentional releases of high-GWP refrigerants and conduct regular maintenance on equipment.
- Maintain detailed records to track and report on refrigerant types and amounts in use.
- Improve building, operations, and cooling designs to reduce demand for refrigerants.
- Implement an array of safety protocols to reduce the risk of leaks and exposure, such as restricting charge sizes, improving ventilation and leak sensors, and ensuring only trained professionals service the equipment.
- Take advantage of financial incentives such as subsidies, tax credits, and grants for using alternative refrigerants.
- Participate in consultations with national and local government agencies, businesses, universities, farmers, healthcare professionals, research institutions, nonprofits, and the public to determine how best to transition local supply chains to alternative refrigerants.
- Stay abreast of changing regulations, identify authoritative and trustworthy sources of legal and policy information, and invest in technology that stays ahead of the refrigerant transition curve.
- Participate in certification schemes that identify which businesses utilize alternative refrigerants.
- Create, support, or join networks or partnerships dedicated to advancing and deploying alternative refrigerants.
Further information:
- Refrigeration, air conditioning and foam blowing sectors technology roadmap. Heubes et al. (2012)
- Space cooling. IEA (2023)
- Cooling emissions and policy synthesis report: Benefits of cooling efficiency and the Kigali Amendment. UNEP & IEA (2020)
Business Leaders
- Establish time-bound, transparent targets for transitioning to alternative refrigerants.
- Use alternative refrigerants and equipment that uses the lowest possible GWP refrigerant; pressure or incentivize suppliers to phase in and report on alternative refrigerants throughout your supply chain.
- Take advantage of financial incentives such as subsidies, tax credits, and grants for using alternative refrigerants.
- Maintain detailed records to track and report on refrigerant types and amounts in use within operations; request and maintain records from suppliers.
- Improve building, operations, and cooling designs to reduce demand for refrigerants.
- Participate in consultations with national and local government agencies, businesses, universities, farmers, healthcare professionals, research institutions, nonprofits, and the public to determine how best to transition local supply chains to alternative refrigerants.
- Participate in certification schemes that identify which businesses utilize alternative refrigerants.
- Advocate for comprehensive policy plans that incentivize the lowest possible GWP refrigerants, penalize high-GWP refrigerants, and provide updated building code requirements.
- Advocate for bans on venting or intentional releases of high-GWP refrigerants, requirements for regular maintenance, and refrigerant or equipment tracking programs to help enforcement.
- Create, support, or join networks or partnerships dedicated to advancing and deploying alternative refrigerants.
Further information:
- Refrigeration, air conditioning and foam blowing sectors technology roadmap. Heubes et al. (2012)
- Space cooling. IEA (2023)
- Climate solutions at work. Project Drawdown (2021)
- Drawdown-aligned business framework. Project Drawdown (2021)
- Cooling emissions and policy synthesis report: Benefits of cooling efficiency and the Kigali Amendment. UNEP & IEA (2020)
Nonprofit Leaders
- Ensure operations use alternative refrigerants and equipment that uses the lowest possible GWP refrigerant, if relevant.
- Advocate for comprehensive policy plans that incentivize the lowest possible GWP refrigerants, penalize high-GWP refrigerants, and provide updated building code requirements.
- Advocate for bans on venting or intentional releases of high-GWP refrigerants, requirements for regular maintenance, and refrigerant or equipment tracking programs to help enforcement.
- Help develop national cooling plans and integrate them into national climate plans.
- Work with public schools, health facilities, and other public venues to deploy alternative refrigerants.
- Create free workforce training programs to improve safety around installation and maintenance.
- Assist with technology transfer to low- and middle-income countries to help improve low-cost adoption.
- Create public campaigns to advocate against dumping inefficient equipment in local markets – especially in low- and middle-income countries.
- Help develop refrigerant audit programs similar to energy audit programs.
- Participate in consultations with national and local government agencies, businesses, universities, farmers, healthcare professionals, research institutions, nonprofits, and the public to determine how best to transition local supply chains to alternative refrigerants.
- Offer educational resources, creating one-stop shops for information on alternative refrigerants and energy efficiency; offer demonstrations, highlighting their cost savings and climate benefits.
- Administer or participate in certification schemes that identify which businesses utilize alternative refrigerants.
- Create, support, or join networks or partnerships dedicated to advancing and deploying alternative refrigerants.
Further information:
- Refrigeration, air conditioning and foam blowing sectors technology roadmap. Heubes et al. (2012)
- Space cooling. IEA (2023)
- Cooling emissions and policy synthesis report: Benefits of cooling efficiency and the Kigali Amendment. UNEP & IEA (2020)
Investors
- Ensure portfolio companies use or have a credible plan to use alternative refrigerants and phase in alternative refrigerants throughout the rest of their supply chain.
- Ensure infrastructure investment projects leverage building, operations, and cooling designs that reduce demand for refrigerants.
- Invest in start-ups working to improve and deploy alternative refrigeration technologies and refrigerant recycling.
- Offer preferential loan agreements for developers utilizing alternative refrigerants and other climate-friendly practices.
- Offer innovative financing methods such as microloans and green bonds to invest in projects that use alternative refrigerants.
- Invest in R&D to improve availability, cost, compatibility with existing equipment, and safety of alternative refrigerants.
- Create, support, or join networks or partnerships dedicated to advancing and deploying alternative refrigerants.
Further information:
- Refrigeration, air conditioning and foam blowing sectors technology roadmap. Heubes et al. (2012)
- Space cooling. IEA (2023)
- Cooling emissions and policy synthesis report: Benefits of cooling efficiency and the Kigali Amendment. UNEP & IEA (2020)
Philanthropists and International Aid Agencies
- Ensure operations use alternative refrigerants and equipment that uses the lowest possible GWP refrigerant, if relevant.
- Advocate for comprehensive policy plans that incentivize the lowest possible GWP refrigerants, penalize high-GWP refrigerants, and provide updated building code requirements.
- Advocate for bans on venting or intentional releases of high-GWP refrigerants, requirements for regular maintenance, and refrigerant or equipment tracking to help enforcement.
- Invest in start-ups working to improve and deploy alternative refrigeration technologies.
- Set requirements for alternative refrigerants when funding new construction.
- Offer financing options such as grants, microloans, and green bonds to invest in projects that use alternative refrigerants.
- Invest in R&D to improve availability, cost, compatibility with existing equipment, and safety of alternative refrigerants.
- Help develop national cooling plans and integrate them into national climate plans.
- Work with public schools, health facilities, and other public venues to deploy alternative refrigerants.
- Create free workforce training programs to improve safety around installation and maintenance.
- Assist with technology transfer to low- and middle-income countries to help improve adoption.
- Create public campaigns to advocate against dumping inefficient equipment in local markets – especially in low- and middle-income countries.
- Help develop refrigerant audit programs similar to energy audit programs.
- Research other traditional methods of cooling and food storage, develop means of scaling relevant methods, and find practical means of integrating traditional methods with modern lifestyles.
- Participate in consultations with national and local government agencies, businesses, universities, farmers, healthcare professionals, research institutions, nonprofits, and the public to determine how best to transition local supply chains to alternative refrigerants.
- Offer educational resources, creating one-stop shops for information on alternative refrigerants and energy efficiency; offer demonstrations, highlighting their cost savings and climate benefits.
- Participate in certification schemes that identify which businesses utilize alternative refrigerants.
- Create, support, or join networks or partnerships dedicated to advancing and deploying alternative refrigerants.
Further information:
- Refrigeration, air conditioning and foam blowing sectors technology roadmap. Heubes et al. (2012)
- Space cooling. IEA (2023)
- Cooling emissions and policy synthesis report: Benefits of cooling efficiency and the Kigali Amendment. UNEP & IEA (2020)
Thought Leaders
- Advocate for comprehensive policy plans that incentivize the lowest possible GWP refrigerants, penalize high-GWP refrigerants, and provide updated building code requirements.
- Advocate for bans on venting or intentional releases of high-GWP refrigerants, requirements for regular maintenance, and refrigerant or equipment tracking to help enforcement.
- Help develop national cooling plans and integrate them into national climate plans.
- Work with public schools, health facilities, and other public venues to deploy alternative refrigerants.
- Assist with technology transfer to low- and middle-income countries to help improve adoption.
- Create public campaigns to advocate against dumping inefficient equipment in local markets – especially in low- and middle-income countries.
- Help develop refrigerant audit programs similar to energy audit programs.
- Research other traditional methods of cooling and food storage, develop means of scaling relevant methods, and find practical means of integrating traditional methods with modern lifestyles.
- Participate in consultations with national and local government agencies, businesses, universities, farmers, healthcare professionals, research institutions, nonprofits, and the public to determine how best to transition local supply chains to alternative refrigerants.
- Create, support, or join networks or partnerships dedicated to advancing and deploying alternative refrigerants.
Further information:
- Refrigeration, air conditioning and foam blowing sectors technology roadmap. Heubes et al. (2012)
- Space cooling. IEA (2023)
- Cooling emissions and policy synthesis report: Benefits of cooling efficiency and the Kigali Amendment. UNEP & IEA (2020)
Technologists and Researchers
- Research and develop new low- and medium-GWP alternative refrigerants.
- Find ways to optimize the charge size, cooling performance, and end-of-life management of alternative refrigerants.
- Design better cooling and heat pump systems to reduce cost of installation and maintenance.
- Develop software to track types and quantities of refrigerants in use.
- Conduct R&D on improving cost-effectiveness, safety, and compatibility with existing equipment of alternative refrigerants.
- Develop software for companies to model and simulate alternative refrigerants within various system configurations.
- Find opportunities to achieve higher equipment efficiencies or other energy-saving designs, such as recovering and utilizing waste heat from CO₂ refrigerant systems.
- Improve gas detection systems to improve safety protocols around alternative refrigerants.
- Research other traditional methods of cooling and food storage; develop means of scaling relevant methods; find practical means of integrating traditional methods with modern lifestyles.
Further information:
- Refrigeration, air conditioning and foam blowing sectors technology roadmap. Heubes et al. (2012)
- Space cooling. IEA (2023)
- Cooling emissions and policy synthesis report: Benefits of cooling efficiency and the Kigali Amendment. UNEP & IEA (2020)
Communities, Households, and Individuals
- Use alternative refrigerants and equipment that uses the lowest possible GWP.
- Explore and integrate other traditional methods of cooling and food storage, if relevant.
- Advocate for comprehensive policy plans that incentivize the lowest possible GWP refrigerants, penalize high-GWP refrigerants, and provide updated building code requirements.
- Advocate for bans on venting or intentional releases of high-GWP refrigerants, requirements for regular maintenance, and refrigerant or equipment tracking to help enforcement.
- Work with public schools, health facilities, and other public venues to deploy alternative refrigerants.
- Take advantage of financial incentives such as subsidies, tax credits, and grants for using alternative refrigerants.
- Participate in consultations with national and local government agencies, businesses, universities, farmers, healthcare professionals, research institutions, nonprofits, and the public to determine how best to transition local supply chains to alternative refrigerants.
- Create, support, or join networks or partnerships dedicated to advancing and deploying alternative refrigerants.
Further information:
- Refrigeration, air conditioning and foam blowing sectors technology roadmap. Heubes et al. (2012)
- Space cooling. IEA (2023)
- Cooling emissions and policy synthesis report: Benefits of cooling efficiency and the Kigali Amendment. UNEP & IEA (2020)
“Take Action” Sources
- ASHRAE position document on natural refrigerants. ASHRAE (2009)
- Phasing down the use of hydrofluorocarbons (HFCs). Borgford-Parnell et al. (2015)
- Forward-looking low-global warming potential refrigerant transition study – draft report. California Public Utilities Commission (2024)
- Solving the global cooling challenge: how to counter the climate threat from room air conditioners. Campbell et al. (2018)
- 2023 MEP 2040 6th forum — refrigerants. Carbon Leadership Forum (2023)
- Industrial refrigeration: best practices guide. Cascade Energy (n.d.)
- Potential policy framework for the promotion of sustainable ODS/HFC banks management. Climate and Ozone Protection Alliance (2023)
- Cooling with ammonia: What you should keep in mind. Dräger (n.d.)
- Assessment of climate and development benefits of efficient and climate-friendly cooling. Dreyfus et al. (2020)
- Refrigeration, air conditioning and foam blowing sectors technology roadmap. Heubes et al. (2012)
- Space cooling. IEA (2023)
- Module 6: Technology roadmap for the RAC&F sectors. Oppelt (2013)
- Benefits of leapfrogging to superefficiency and low global warming potential refrigerants in room air conditioning. Shah et al. (2015)
- Opportunities for simultaneous efficiency improvement and refrigerant transition in air conditioning. Shah et al. (2017)
- Sustainable cooling for all in Ghana: Meeting cooling needs while accelerating a just and equitable transition. Sustainable Energy for All (2024)
- Recommendations for climate friendly refrigerant management and procurement. Sustainable Purchasing Leadership Council Climate Friendly Refrigerant Action Team (2021)
- Market impacts of low-gwp refrigerants for refrigeration equipment. TRC (2021)
- Cooling emissions and policy synthesis report: Benefits of cooling efficiency and the Kigali Amendment. UNEP & IEA (2020)
- Refrigeration, air conditioning and heat pumps technical options committee: 2022 assessment report. UNEP (2023)
- Doing cold smarter. Birmingham Energy Institute (2015)
- Transitioning to low-GWP alternatives in transport refrigeration. U.S. EPA (2011)
- Refrigerant transition management and planning for the future. U.S. EPA (2023)
- Low global warming potential refrigerants for direct HVAC applications. Walter-Terrinoni & DeBullet (2019)
Evidence Base
Consensus of effectiveness in reducing emissions: High
Phasing out high-GWP refrigerants for low or medium-GWP refrigerants is unquestionably effective at reducing emissions from refrigerant use.
In a report from two U.S. national laboratories, Booten et al. (2020) claim that systems using F-gas refrigerants for refrigeration and air conditioning are “the most difficult and impactful” innovation spaces for refrigerants. Zaelke and Borgford-Parnell (2015) asserted that reducing short-lived climate pollutants including HFCs “is the most effective strategy for constraining warming and associated impacts in the near term.” Utilizing low-GWP alternative refrigerants is a proven means to achieve this.
The IPCC Sixth Assessment (2023) cites the World Meteorological Organization (2018) and Höglund-Isaksson et al. (2017) in claiming that worldwide compliance with the Kigali Amendment schedule would reduce HFC emissions by 61% over baseline emissions by 2050. Velders et al. (2022) modeled future HFC emissions under the Kigali Amendment and found that these HFC reductions could save 3.1–4.4 Gt CO₂‑eq , 100-yr basis/yr by 2050. Dreyfus et al. (2020) estimate possible cumulative savings of 33–47 Gt CO₂‑eq (100-yr) through 2050, with an additional 53 Gt CO₂‑eq (100-yr) through 2060 if HFC phase-down is immediate.
Expert consensus is that the potential impact of alternative refrigerants will increase as a warming climate and increased population and development drive demand for higher use of cooling equipment (Campbell et al., 2018; Dreyfus et al., 2020; Petri & Caldeira, 2015). This will particularly be true for developing countries in already warm climates (Dong et al., 2021).
The results presented in this document summarize findings from one review article, six original studies, two reports, one international treaty, two industry guidelines, one conference proceeding, and eight national GHG inventory submissions to the United Nations. This reflects current evidence from 34 countries, primarily Annex 1 countries as identified by the United Nations as well as China. We recognize this limited geographic scope creates bias, and hope this work inspires research and data sharing on this topic in underrepresented regions.
Updated Date
Coming Soon Label
Coming Soon
Deploy Utility-Scale Solar PV
Sector
Electricity
Mode
Cut Emissions
Cluster
Shift Production
Image
Image
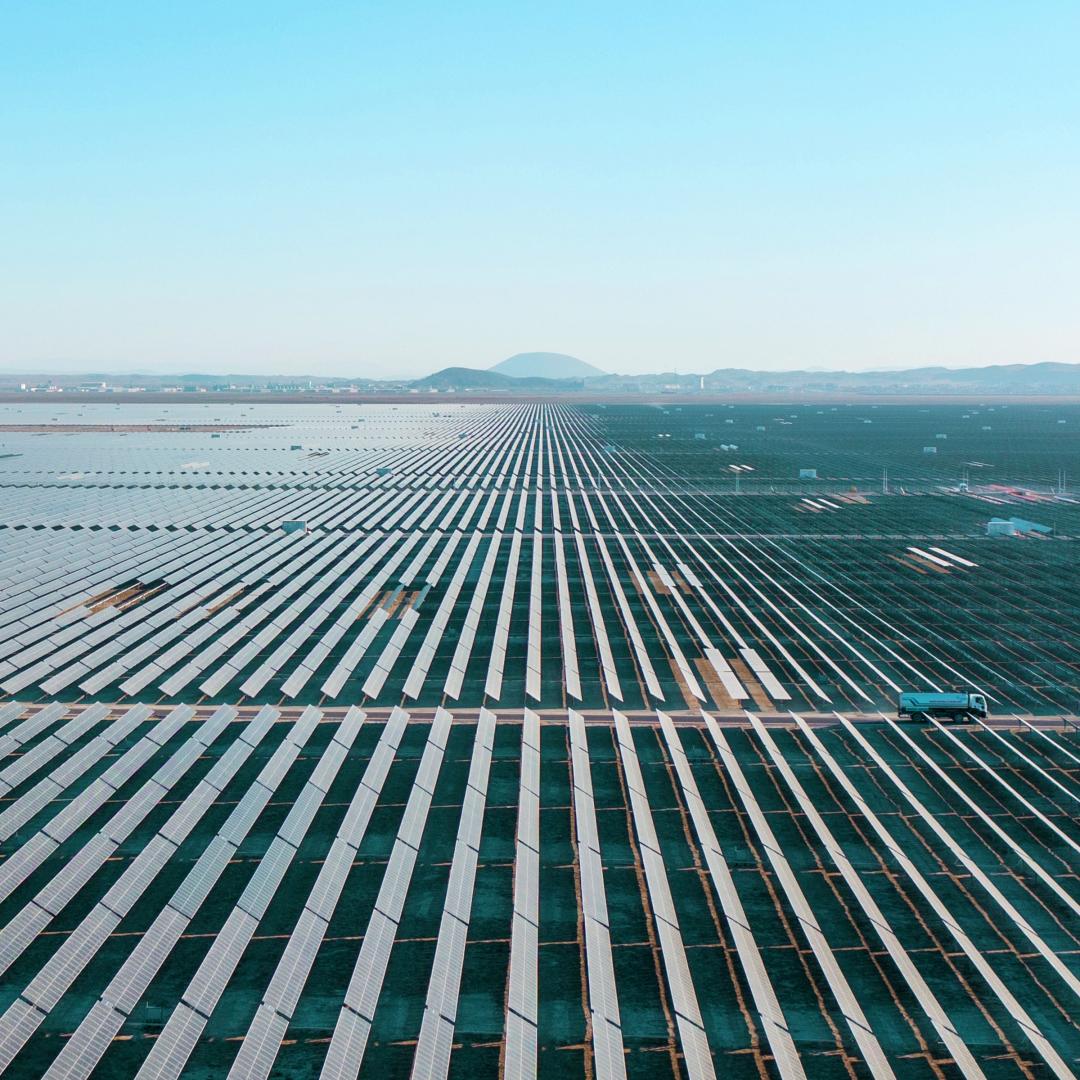
Coming Soon
Off
Summary
Utility-scale solar PV refers to large solar power systems, typically installed on open land and connected directly to a central electric grid, that generate electricity for widespread distribution. These systems generally have an installed capacity above 1 MW. There are various configurations of utility-scale solar PV systems and we include fixed-tilt and tracking systems in this solution. Systems on cropland are also considered in this solution, but dual production of crops and solar energy on the same land area is analyzed as a separate agrivoltaics solution.
Overview
An estimated 23% of GHG emissions on a 100-year basis comes from electricity generation annually (Clarke et al., 2022), and in 2022, more than 60% of global electricity generation came from fossil fuel–based energy sources (International Energy Agency [IEA], 2024b). Since solar is a clean, renewable resource, utility-scale solar PV does not contribute to GHG emissions or air pollution while generating energy. Deploying utility-scale solar PV reduces the need for electricity generation from fossil fuels, which reduces CO₂ emissions, as well as smaller amounts of methane and nitrous oxide.
Utility-scale solar PV systems generate electricity by converting sunlight directly into electrical energy through the photovoltaic effect. These systems typically consist of large arrays of solar panels made from semiconductor materials (most commonly crystalline silicon), inverters that convert direct current (DC) electricity to alternating current (AC), structural mounting systems, and transformers. When sunlight strikes the surface of a solar panel, light energy is absorbed and transferred to electrons in the semiconductor material. If the energy is high enough, electrons then move between semiconductor layers producing a flow of electric current (US EIA, 2024). This electricity is routed through inverters, converted into grid-compatible AC power, and delivered to substations and transmission lines (Figure 1). The amount of electricity generated depends on the system size, the intensity of sunlight at the location (solar irradiance), panel efficiency, and the system’s capacity factor. Utility-scale solar PV achieves capacity factors of 9–35%, depending on geography, seasonal variation, and system design (Bolinger et al., 2023).
There are two main categories of utility-scale systems – fixed-tilt installations, where solar panels are mounted in a static position, and tracking systems, which rotate to follow the sun’s path across the sky, improving energy yield. Newer advances in module design, including bifacial modules and cell technologies such as perovskite-silicon tandem cells, continue to improve system efficiency and lower overall costs of utility-scale solar PV (Gu et al., 2020; Mdallal et al., 2025).
Utility-scale solar PV generates additional benefits, such as reduced air pollution, lower water use compared to thermal power plants, and relatively fewer public health impacts from energy production. While there are emissions associated with the manufacturing, transportation, and installation of utility-scale solar PV panels, these life-cycle emissions are more than 10 times lower than emissions from fossil fuel–based electricity generation (National Renewable Energy Laboratory [NREL], 2021). These life-cycle emissions are not quantified in this assessment but are typically addressed under industry- or supply chain-focused solutions. Because utility-scale solar PV produces no emissions during operation, the technology contributes significantly to clean energy transitions.
Figure 1. (a) Anatomy of a solar cell. Two layers of semiconductor material – most commonly crystalline silicone – are sandwiched between electrodes. Both layers together create a silicon wafer. The layers of this silicon wafer are oppositely charged, which creates an electric field at the material interface. When energy from the sun is absorbed, electrons with sufficient energy cross the electric field and flow towards the electrodes, creating an electric current. (b) Solar panels are built by combining multiple solar cells into modules; multiple panels are used in a solar array. After electricity generation, inverters and transmission systems deliver power to consumers. Modified from (a) Husain et al. and (b) Renew Wisconsin.
Image
Sources: Husain, A.A., Hasan, W.Z.W., Shafie, S., Hamidon, M.N., & Pandey, S.S. (2018). Renewable and Sustainable Energy Reviews, 94, 779–791; (b) Renew Wisconsin. (2018). Utility-scale solar in Wisconsin.
References
Abel, D., Holloway, T., Harkey, M., Rrushaj, A., Brinkman, G., Duran, P., Janssen, M., Denholm, P. (2018). Potential air quality benefits from increased solar photovoltaic electricity generation in the Eastern United States. Atmospheric Environment, 175, 65–74. Link to source: https://doi.org/10.1016/j.atmosenv.2017.11.049
Adeh, E. H., Good, S. P., Calaf, M., & Higgins, C. W. (2019). Solar PV power potential is greatest over croplands. 9(1), Article 11442. Link to source: https://doi.org/10.1038/s41598-019-47803-3
Ahmad, A., Power, N., & Finegan, E. (2025). Maximising solar PV potential: A comprehensive review of factors affecting photovoltaic installation and generation in a mild temperate oceanic climate. Solar Energy Advances, 5, Article 100111. Link to source: https://doi.org/10.1016/J.SEJA.2025.100111
Ahmad, M., Zeeshan, M., & Khan, J. A. (2023). Life cycle multi-objective (geospatial, techno-economic, and environmental) feasibility and potential assessment of utility scale photovoltaic power plants. Energy Conversion and Management, 291. Article 117260. Link to source: https://doi.org/10.1016/j.enconman.2023.117260
Badza, K., Soro, Y. M., & Sawadogo, M. (2023). Life cycle assessment of a 33.7 MW solar photovoltaic power plant in the context of a developing country. Sustainable Environment Research, 33(1), Article 38. Link to source: https://doi.org/10.1186/S42834-023-00201-X
Baik, E., Chawla, K. P., Jenkins, J. D., Kolster, C., Patankar, N. S., Olson, A., Benson, S. M., Long, J. C. S. (2021). What is different about different net-zero carbon electricity systems? Energy and Climate Change, 2, Article 100046. Link to source: https://doi.org/10.1016/j.egycc.2021.100046
Bajagain, R., Panthi, G., An, Y.-J., & Jeong, S.-W. (2020). Current practices on solar photovoltaic waste management: An overview of the potential risk and regulatory approaches of the photovoltaic waste. Journal of Korean Society of Environmental Engineers, 42(12) 690-708. Link to source: https://doi.org/https://doi.org/10.4491/KSEE.2020.42.12.690
Bamisile, O., Acen, C., Cai, D., Huang, Q., & Staffell, I. (2025). The environmental factors affecting solar photovoltaic output. Renewable and Sustainable Energy Reviews, 208, Article 115073. Link to source: https://doi.org/10.1016/J.RSER.2024.115073
Beiter, P., Guillet, J., Jansen, M., Wilson, E., & Kitzing, L. (2024). The enduring role of contracts for difference in risk management and market creation for renewables. Nature Energy, 9, 20–26. Link to source: https://doi.org/10.1038/s41560-023-01401-w
Bistline, J.E.T., Watten, A. (2025). Emissions reductions of rooftop solar are overstated by approaches that inadequately capture substitution effects. Nature Climate Change, 15, 1173–1175. Link to source: https://doi.org/10.1038/s41558-025-02459-y
Bolinger, M., Seel, J., Kemp, J. M., Warner, C., Katta, A., & Robson, D. (2023). Utility-scale solar, 2023 edition: Empirical trends in deployment, technology, cost, performance, PPA pricing, and value in the United States. Link to source: https://emp.lbl.gov/publications/utility-scale-solar-2023-edition
Bolinger, M., Wiser, R., & O’Shaughnessy, E. (2022). Levelized cost-based learning analysis of utility-scale wind and solar in the United States. iScience, 25(6). Link to source: https://doi.org/10.1016/J.ISCI.2022.104378
Brown, T. & Reichenberg, L. (2021). Decreasing market value of variable renewables can be avoided by policy action. Energy Economics, 100, Article 105354. Link to source: https://doi.org/10.1016/j.eneco.2021.105354
Buonocore, J. J., Hughes, E. J., Michanowicz, D. R., Heo, J., Allen, J. G., and Williams, A. (2019). Climate and health benefits of increasing renewable energy deployment in the United States. Environmental Research Letters, 14, Article 114010. Link to source: https://doi.org/10.1088/1748-9326/ab49bc
Chopdar, R. K., Sengar, N., Giri, N. C., & Halliday, D. (2024). Comprehensive review on agrivoltaics with technical, environmental and societal insights. Renewable and Sustainable Energy Reviews, 197. Article 114416. Link to source: https://doi.org/10.1016/j.rser.2024.114416
Chowdhury, M. S., Rahman, K. S., Chowdhury, T., Nuthammachot, N., Techato, K., Akhtaruzzaman, M., Tiong, S. K., Sopian, K., & Amin, N. (2020). An overview of solar photovoltaic panels’ end-of-life material recycling. Energy Strategy Reviews, 27, Article 100431. Link to source: https://doi.org/10.1016/J.ESR.2019.100431
Clarke, L., Wei, Y.-M., De La Vega Navarro, A., Garg, A., Hahmann, A. N., Khennas, S., Azevedo, I. M. L., Löschel, A., Singh, A. K., Steg, L., Strbac, G., & Wada, K. (2022). Energy Systems. In P. R. Shukla, J. Skea, R. Slade, A. Al Khourdajie, R. van Diemen, D. McCollum, M. Pathak, S. Some, P. Vyas, R. Fradera, M. Belkacemi, A. Hasija, G. Lisboa, S. Luz, & J. Malley (Eds.), Climate change 2022: Mitigation of climate change. Contribution of working group III to the sixth assessment report of the intergovernmental panel on climate change (pp. 613–746). Cambridge University Press. Link to source: https://doi.org/10.1017/9781009157926.008
Dato, P., Dioha, M., Hessou, H., Houenou, B., Mukhaya, B., Okyere, M. A., & Odarno, L. (2025). Computation of weighted average cost of capital (WACC) in the power sector for African countries and the implications for country-specific electricity technology cost. Applied Energy, 397, Article 126333. Link to source: https://doi.org/10.1016/J.APENERGY.2025.126333
de La Beaumelle, N. A., Blok, K., de Chalendar, J. A., Clarke, L., Hahmann, A. N., Huster, J., Nemet, G. F., Suri, D., Wild, T. B., & Azevedo, I. M. L. (2023). The global technical, economic, and feasible potential of renewable electricity. Annual Review of Environment and Resources, 48, 419–449. Link to source: https://www.annualreviews.org/content/journals/10.1146/annurev-environ-112321-091140
Deng, Y. Y., Haigh, M., Pouwels, W., Ramaekers, L., Brandsma, R., Schimschar, S., Grözinger, J., & de Jager, D. (2015). Quantifying a realistic, worldwide wind and solar electricity supply. Global Environmental Change, 31, 239–252. Link to source: https://doi.org/10.1016/J.GLOENVCHA.2015.01.005
Diffendorfer, J. E., Sergi, B., Lopez, A., Williams, T., Gleason, M., Ancona, Z., & Cole, W. (2024). The interplay of future solar energy, land cover change, and their projected impacts on natural lands and croplands in the US. Science of The Total Environment, 947, Article 173872. Link to source: https://doi.org/10.1016/J.SCITOTENV.2024.173872
Dimanchev, E., Gabriel, S. A., Reichenberg, L., & Korpås, M. (2024). Consequences of the missing risk market problem for power system emissions. Energy Economics, 136, Article 107639. Link to source: https://doi.org/10.1016/j.eneco.2024.107639
Dioha, M. O. (2025). How can we finance a fair energy transition in Africa?Link to source: https://drawdown.org/insights/how-can-we-finance-a-fair-energy-transition-in-africa
DNV. (2024). Energy transition outlook 2024. Link to source: https://brandcentral.dnv.com/original/gallery/10651/files/original/5c2470ac-597c-43f9-87dd-4e6b238d7845.pdf
Dupont, E., Koppelaar, R., & Jeanmart, H. (2020). Global available solar energy under physical and energy return on investment constraints. Applied Energy, 257, Article 113968. Link to source: https://doi.org/10.1016/J.APENERGY.2019.113968
Firoozi, A. A., Firoozi, A. A., & Maghami, M. R. (2025). Harnessing photovoltaic innovation: Advancements, challenges, and strategic pathways for sustainable global development. Energy Conversion and Management: X, 27, Article 101058. Link to source: https://doi.org/10.1016/J.ECMX.2025.101058
Frew, B., Sergi, B., Denholm, P., Cole, W., Gates, N., Levie, D., & Margolis, R. (2021). The curtailment paradox in the transition to high solar power systems. Joule, 5(5), 1143–1167. Link to source: https://doi.org/10.1016/J.JOULE.2021.03.021
Gadzanku, S., Kramer, A., and Smith, B., L. (2023). An updated review of the solar PV installation workforce literature. National Renewable Energy Laboratory. NREL/TP-7A40-83652. Link to source: https://www.nrel.gov/docs/fy23osti/83652.pdf
Gagnon, P. & O’Shaughnessy, E. (2024). Consequential analysis of the greenhouse gas emissions impacts of actions that influence the electric grid: The theory and practice of using marginal emissions rates. NREL/TP-6A40-91580. National Renewable Energy Laboratory. Link to source: https://www.nrel.gov/docs/fy25osti/91580.pdf
Gallagher, C. L. and Tracey, H. (2020). Integrating air quality and public health benefits in U.S. decarbonization strategies. Frontiers in Public Health, 8. Link to source: https://www.frontiersin.org/journals/public-health/articles/10.3389/fpubh.2020.563358
Giri, N. C., & Mohanty, R. C. (2022). Agrivoltaic system: Experimental analysis for enhancing land productivity and revenue of farmers. Energy for Sustainable Development, 70, 54–61. Link to source: https://doi.org/10.1016/J.ESD.2022.07.003
Gan, Y., Elgowainy, A., Lu, Z., Kelly, J. C., Wang, M., Boardman, R. D., & Marcinkoski, J. (2023). Greenhouse gas emissions embodied in the U.S. solar photovoltaic supply chain. Environmental Research Letters, 18(10), Article 104012. Link to source: https://doi.org/10.1088/1748-9326/ACF50D
Gorman, W., Kemp, J. M., Rand, J., Seel, J., Wiser, R., Manderlink, N., Kahrl, F., Porter, K., & Cotton, W. (2025). Grid connection barriers to renewable energy deployment in the United States. Joule, 9(2), Article 101791. Link to source: https://doi.org/10.1016/j.joule.2024.11.008
Gu, W., Ma, T., Ahmed, S., Zhang, Y., & Peng, J. (2020). A comprehensive review and outlook of bifacial photovoltaic (bPV) technology. Energy Conversion and Management, 223. Article 113283. Link to source: https://doi.org/10.1016/J.ENCONMAN.2020.113283
Haas, R., Sayer, M., Ajanovic, A., & Auer, H. (2023). Technological learning: Lessons learned on energy technologies. Wiley Interdisciplinary Reviews: Energy and Environment, 12(2), Article e463. Link to source: https://doi.org/10.1002/WENE.463
Hernandez, R. R., Easter, S. B., Murphy-Mariscal, M. L., Maestre, F. T., Tavassoli, M., Allen, E. B., Barrows, C. W., Belnap, J., Ochoa-Hueso, R., Ravi, S., & Allen, M. F. (2014). Environmental impacts of utility-scale solar energy. Renewable and Sustainable Energy Reviews, 29, 766–779. Link to source: https://doi.org/10.1016/J.RSER.2013.08.041
Hoogwijk, M. M. (2004). On the global and regional potential of renewable energy sources. Utrecht University. Link to source: https://research-portal.uu.nl/en/publications/on-the-global-and-regional-potential-of-renewable-energy-sources/
International Energy Agency. (2022). Solar PV global supply chains. Link to source: https://www.iea.org/reports/solar-pv-global-supply-chains
International Energy Agency. (2023a). Solar PV power capacity in the net zero scenario, 2015-2030. Link to source: https://www.iea.org/data-and-statistics/charts/solar-pv-power-capacity-in-the-net-zero-scenario-2015-2030
International Energy Agency. (2024a). World energy outlook 2024. Link to source: https://www.iea.org/reports/world-energy-outlook-2024
International Energy Agency. (2024b). World energy balances—Data product. Link to source: https://www.iea.org/data-and-statistics/data-product/world-energy-balances
International Energy Agency PVPS. (2023). Trends in photovoltaic applications 2023. Link to source: https://iea-pvps.org/wp-content/uploads/2023/10/PVPS_Trends_Report_2023_WEB.pdf
International Energy Agency PVPS. (2024a). Best practices handbook for the collection and use of solar resource data for solar energy applications: Fourth edition 2024. Link to source: https://iea-pvps.org/wp-content/uploads/2024/09/Best-Practices-Handbook-for-the-Collection-and-Use-of-Solar-Resource-Data-for-Solar-Energy-Applications-Fourth-Edition-.pdf
International Energy Agency PVPS. (2024b). Trends in photovoltaic applications 2024. Link to source: https://iea-pvps.org/wp-content/uploads/2024/10/IEA-PVPS-Task-1-Trends-Report-2024.pdf
International Energy Agency-ETSAP and IRENA. (2015). Renewable energy integration in power grids: Technology brief. Link to source: https://www.irena.org/-/media/Files/IRENA/Agency/Publication/2015/IRENA-ETSAP_Tech_Brief_Power_Grid_Integration_2015.pdf
IPCC. (2023). Climate change 2023: Synthesis report. Contribution of working groups I, II and III to the Sixth Assessment Report of the Intergovernmental Panel on Climate Change. Link to source: https://www.ipcc.ch/report/ar6/syr/downloads/report/IPCC_AR6_SYR_SPM.pdf
International Renewable Energy Agency. (2019). Future of solar photovoltaic: Deployment, investment, technology, grid integration and socio-economic aspects (A global energy transformation: paper). Link to source: https://www.irena.org/-/media/Files/IRENA/Agency/Publication/2019/Nov/IRENA_Future_of_Solar_PV_2019.pdf
International Renewable Energy Agency. (2024a). Renewable power generation costs in 2023. Link to source: https://www.irena.org/Publications/2024/Sep/Renewable-Power-Generation-Costs-in-2023
International Renewable Energy Agency. (2024b). Renewable energy capacity statistics 2024—Data product. Link to source: https://www.irena.org/Publications/2024/Mar/Renewable-capacity-statistics-2024
International Renewable Energy Agency. (2025). Renewable power generation costs in 2024. Link to source: https://www.irena.org/Publications/2025/Jun/Renewable-Power-Generation-Costs-in-2024
International Renewable Energy Agency and International Labour Organization. (2024). Renewable energy and jobs: Annual review 2024. Link to source: https://www.irena.org/-/media/Files/IRENA/Agency/Publication/2024/Oct/IRENA_Renewable_energy_and_jobs_2024.pdf
International Renewable Energy Agency & International Energy Agency-PVPS. (2016). End-of-life management: Solar photovoltaic panels. Link to source: https://www.irena.org/-/media/Files/IRENA/Agency/Publication/2016/IRENA_IEAPVPS_End-of-Life_Solar_PV_Panels_2016.pdf
Lafitte, A., Sordello, R., Ouédraogo, D. Y., Thierry, C., Marx, G., Froidevaux, J., Schatz, B., Kerbiriou, C., Gourdain, P., & Reyjol, Y. (2023). Existing evidence on the effects of photovoltaic panels on biodiversity: a systematic map with critical appraisal of study validity. Environmental Evidence, 12(1), Article 25. Link to source: https://pubmed.ncbi.nlm.nih.gov/39294828/
Mdallal, A., Yasin, A., Mahmoud, M., Abdelkareem, M. A., Alami, A. H., & Olabi, A. G. (2025). A comprehensive review on solar photovoltaics: Navigating generational shifts, innovations, and sustainability. Sustainable Horizons, 13, Article 100137. Link to source: https://doi.org/10.1016/J.HORIZ.2025.100137
Mehedi, T. H., Gemechu, E., & Kumar, A. (2022). Life cycle greenhouse gas emissions and energy footprints of utility-scale solar energy systems. Applied Energy, 314, Article 118918. Link to source: https://doi.org/10.1016/J.APENERGY.2022.118918
Millstein, D., Wiser, R., Bolinger, M., & Barbose, G. (2017). The climate and air-quality benefits of wind and solar power in the United States. Nature Energy, 2(9), Article 17134. Link to source: http://dx.doi.org/10.1038/nenergy.2017.134
Millstein, D., O'Shaughnessy, E., & Wiser, R. (2024). Climate and air quality benefits of wind and solar generation in the United States from 2019 to 2022. Cell Reports Sustainability, 1(6), Article 100105. Link to source: https://doi.org/10.1016/j.crsus.2024.100105
NEA & IEA. (2020). Projected costs of generating electricity. Link to source: https://www.oecd-nea.org/upload/docs/application/pdf/2020-12/egc-2020_2020-12-09_18-26-46_781.pdf
NREL. (2021). Life cycle greenhouse gas emissions from electricity generation: Update. Link to source: https://docs.nrel.gov/docs/fy21osti/80580.pdf
Ovaitt, S., Mirletz, H., Seetharaman, S., & Barnes, T. (2022). PV in the circular economy, a dynamic framework analyzing technology evolution and reliability impacts. iScience, 25(1). Link to source: https://doi.org/10.1016/J.ISCI.2021.103488
Pehl, M., Arvesen, A., Humpenöder, F., Popp, A., Hertwich, E. G., & Luderer, G. (2017). Understanding future emissions from low-carbon power systems by integration of life-cycle assessment and integrated energy modelling. Nature Energy 2017, 2(12), 939–945. Link to source: https://doi.org/10.1038/s41560-017-0032-9
Peters, I. M. (2025). Strategic global deployment of photovoltaic technology: Balancing economic capacity and decarbonization potential. Advances in Atmospheric Sciences, 42, 261–268. Link to source: https://doi.org/10.1007/s00376-024-4176-9
Pincelli, I. P., Hinkley, J., & Brent, A. (2024). Carbon, materials and energy footprint of a utility-scale solar plant in Aotearoa New Zealand. Solar Energy, 273, Article 112535. Link to source: https://doi.org/10.1016/J.SOLENER.2024.112535
Reinsch, W. A., & Arrieta-Kenna, S. (2021). A dark spot for the solar energy industry: Forced labor in Xinjiang. Link to source: https://www.csis.org/analysis/dark-spot-solar-energy-industry-forced-labor-xinjiang
Rivera, N. M., Ruiz-Tagle, J. C., and Spiller, E. (2024). The health benefits of solar power generation: Evidence from Chile. Journal of Environmental Economics and Management, 126, Article 102999. Link to source: https://doi.org/10.1016/j.jeem.2024.102999
Shyu, C. W., & Yang, T. I. (2025). Socio-technical tensions from community acceptance, energy transition, and energy justice: Lessons from solar photovoltaic projects in Taiwan. Applied Energy, 384, Article 125415. Link to source: https://doi.org/10.1016/J.APENERGY.2025.125415
Smith, B. L., Sekar, A., Mirletz, H., Heath, G., & Margolis, R. (2024). An updated life cycle assessment of utility-scale solar photovoltaic systems installed in the United States. Link to source: https://www.nrel.gov/docs/fy24osti/87372.pdf
SolarPower Europe. (2025). Global market outlook for solar power 2025-2029. Link to source: https://api.solarpowereurope.org/uploads/Global_Market_Outlook_2025_v1_aaebd9698b.pdf
Suri, D., de Chalendar, J. & Azevedo, I.M.L. (2025). Assessing the real implications for CO2 as generation from renewables increases. Nature Communications, 16, Article 7124. Link to source: https://doi.org/10.1038/s41467-025-59800-4
Susskind, L., Chun, J., Gant, A., Hodgkins, C., Cohen, J., & Lohmar, S. (2022). Sources of opposition to renewable energy projects in the United States. Energy Policy, 165, Article 112922. Link to source: https://doi.org/10.1016/J.ENPOL.2022.112922
Tambari, I. T., Dioha, M. O., & Failler, P. (2020). Renewable energy scenarios for sustainable electricity supply in Nigeria. Energy and Climate Change, 1, Article 100017. Link to source: https://doi.org/10.1016/J.EGYCC.2020.100017
Tawalbeh, M., Al-Othman, A., Kafiah, F., Abdelsalam, E., Almomani, F., & Alkasrawi, M. (2021). Environmental impacts of solar photovoltaic systems: A critical review of recent progress and future outlook. Science of The Total Environment, 759, Article 143528. Link to source: https://doi.org/10.1016/J.SCITOTENV.2020.143528
Truitt, S., Elsworth, J., Williams, J., Keyser, D., Moe, A., Sullivan, J., and Wu, K. (2022). State-level employment projections for four clean energy technologies in 2025 and 2030. National Renewable Energy Laboratory. NREL/TP-5500-81486. Link to source: https://www.nrel.gov/docs/fy22osti/81486.pdf
US EIA. (2024). Photovoltaics and electricity - U.S. Energy Information Administration (EIA). Link to source: https://www.eia.gov/energyexplained/solar/photovoltaics-and-electricity.php
van de Ven, D. J., Capellan-Peréz, I., Arto, I., Cazcarro, I., de Castro, C., Patel, P., & Gonzalez-Eguino, M. (2021). The potential land requirements and related land use change emissions of solar energy. Scientific Reports, 11(1), Article 2907. Link to source: https://doi.org/10.1038/S41598-021-82042-5
Wiser, R., Millstein, D., Mai, T., Macknick, J., Carpenter, A., Cohen, S., Cole, W., Frew, B., and Heath, G. (2016). The environmental and public health benefits of achieving high penetrations of solar energy in the United States. Energy, 113, 472–486. Link to source: https://doi.org/10.1016/j.energy.2016.07.068
Wolak, F. A. (2022). Long-term resource adequacy in wholesale electricity markets with significant intermittent renewables. Environmental and Energy Policy and the Economy, 3, 155–220. Link to source: https://doi.org/10.1086/717221
Xu, Z., Li, Y., Qin, Y., & Bach, E. (2024). A global assessment of the effects of solar farms on albedo, vegetation, and land surface temperature using remote sensing. Solar Energy, 268, Article 112198. Link to source: https://doi.org/10.1016/J.SOLENER.2023.112198
Yavari, R., Zaliwciw, D., Cibin, R., & McPhillips, L. (2022). Minimizing environmental impacts of solar farms: a review of current science on landscape hydrology and guidance on stormwater management. Environmental Research: Infrastructure and Sustainability, 2(3), Article 032002. Link to source: https://doi.org/10.1088/2634-4505/AC76DD
Zubi, G., Parag, Y., & Wald, S. (2024). Implications of large-scale PV integration on grid operation, costs, and emissions: Challenges and proposed solutions. Energies, 18(1), Article 130. Link to source: https://doi.org/10.3390/EN18010130
Credits
Lead Fellow
Michael Dioha, Ph.D.
Contributors
Al-Amin Bugaje, Ph.D.
Ruthie Burrows, Ph.D.
James Gerber, Ph.D.
Daniel Jasper
Megan Matthews, Ph.D.
Alex Sweeney
Internal Reviewers
James Gerber, Ph.D.
Amanda D. Smith, Ph.D.
Effectiveness
Table 1. Effectiveness at reducing emissions.
Unit: t CO₂‑eq/MW installed capacity/yr, 100-yr basis
| Estimate | 760 |
Left Text Column Width
Based on data provided by the IEA, global emissions from electricity generation accounted for an estimated 530 kg CO₂‑eq /MWh (540 kg CO₂‑eq /MWh, 20-yr basis) (IEA, 2024b; see Methodology: Appendix A for calculation details). To convert from MWh to MW, we used the global weighted average capacity factor for utility-scale solar PV of 16.2% (International Renewable Energy Agency [IRENA], 2024a). Utility-scale solar PV is estimated to reduce 760 t CO₂‑eq /MW (760 t CO₂‑eq /MW, 20-yr basis) of installed capacity annually (Table 1).
To estimate the effectiveness of utility-scale solar PV, we assumed that newly installed utility-scale solar PV displaces an equivalent MWh of the global electricity grid mix. We then assumed the reduction in emissions from additional utility-scale solar PV capacity was equal to emissions (per MWh) from the 2023 global electricity grid mix (IEA, 2024b). Finally, we used the utility-scale solar PV capacity factor to convert to annual emissions per MW of installed capacity.
Actual avoided emissions will depend on the condition of the local grid at a particular time and place, including the level of solar already deployed (see Methodology, Appendix A). However, the relative emissions benefit from increased solar deployment depends on the energy sources it potentially displaces. Because solar energy output varies diurnally, demand peaks in the evenings need to be met by stored energy or other energy sources that can provide power as demand increases. In coal-dominated markets, increasing utility-scale solar PV generation could lead to overall increased emissions per MWh, even if coal plants operate less often because coal plants emit more during suboptimal operation and ramp-up/ramp-down phases (Suri et al., 2025).
During operation, utility-scale solar PV emits negligible GHGs, so we assumed zero emissions per MW of installed capacity. However, emissions arise during manufacturing of components, transportation, installation, maintenance, and decommissioning, and are paid back within approximately 1–2 years (Ahmad et al., 2023; Badza et al., 2023; Mehedi et al., 2022; Pincelli et al., 2024; Smith et al., 2024). Studies from many different countries show that total emissions remain far below those of fossil fuel generation (Badza et al., 2023; Pincelli et al., 2024; NREL, 2021; Smith et al., 2024). Manufacturing using coal-intensive grids increases embodied emissions, highlighting the necessity of decarbonizing supply chains (Gan et al., 2023; Pehl et al., 2017).
In our analysis, we focused solely on emissions produced during electricity generation, so carbon payback time and embodied life-cycle emissions were not included in our estimates of effectiveness or climate impacts.
Cost
We estimated a mean levelized cost of electricity (LCOE) for utility-scale solar PV of US$53/MWh based on three industry reports (IEA, 2024a; IRENA, 2025; NEA & IEA, 2020; see Methodology: Appendix A for details). LCOE values represent the average cost of producing one MWh of electricity over the operational lifetime of a power plant, allowing investors to compare their expected revenue to a standard set of costs. This cost metric has been used by international agencies for cost comparison across generation technologies, incorporating installed capital costs, operation and maintenance (O&M), project lifespan, and energy output. According to IRENA, between 2010 and 2024 the global weighted average LCOE for utility-scale solar PV fell by 90%, from US$417/MWh to US$43/MWh. This decline was driven by cost reductions across the PV value chain, with module and inverter price declines accounting for 55% of the LCOE drop (IRENA, 2025). Technological advances such as larger wafer sizes, improved ingot growth methods, diamond wire wafering, and new cell architectures supported these changes. Balance-of-system (BoS) hardware contributed another 8%, while engineering, procurement, construction, installation, development, and other soft costs accounted for 28% of the reduction in LCOE (IRENA, 2025). Better financing conditions, improved capacity factors, and lower O&M costs also played a role.
Recent macroeconomic conditions have slightly reversed the downward trend. Between 2023 and 2024, the global weighted average LCOE for utility-scale solar PV increased by 0.6%, with 13 of the 15 largest markets experiencing cost increases ranging from 7% in Poland to 36% in Australia. Higher financing costs from inflation and elevated interest rates helped drive these shifts. Despite these headwinds, utility-scale solar PV remains one of the cheapest options worldwide for generating electricity. Our estimated global mean LCOE (US$53/MWh) is lower than the 2023 weighted average LCOE for fossil fuels, which was US$70–176/MWh (IRENA, 2024a). However, since LCOE excludes revenue, real-world costs of utility-scale solar generation could be higher than estimated here.
Methods and Supporting Data
Learning Curve
Table 2. Learning rate: drop in cost per doubling of the installed utility-scale solar PV production capacity.
Unit: %
| 25th percentile | 30 |
| Mean | 34 |
| Median (50th percentile) | 34 |
| 75th percentile | 38 |
Left Text Column Width
Utility-scale solar PV exhibits a pronounced learning curve, most clearly reflected in the steady decline of solar module prices as global deployment expands. The median learning rate for PV modules is estimated at 34%, meaning module prices fall by roughly one-third with every doubling of installed capacity (Table 2). Our estimated learning rate is based on trends in the past decade, while a longer historical estimate would be lower. According to a single source, significant economies of scale over the last decade have driven an even steeper learning rate of 42% (Masson et al., 2023). According to DNV’s Energy Transition Outlook 2024, the current global learning rate for module costs is about 26%, but projections suggest this will slow to around 17% by 2050 as cost components stabilize and the largest gains from scaling are realized (DNV, 2024).
While module prices have seen the most dramatic reductions, similar trends are evident in total system costs. Studies tracking installed costs and LCOE for PV in the United States since 2007 report a 24% learning rate based on normalized LCOE for utility-scale PV, with an accelerated 45% between 2014 and 2020 (Bolinger et al., 2022). Between 2010 and 2023, IRENA (2024a) found that utility-scale solar PV achieved the highest global weighted-average learning rate for total installed costs among major renewables at 33.4%. Haas et al. (2023) similarly estimated a 33% learning rate for installed costs between 2010 and 2019. Meanwhile, operational expenditure (OPEX) is also expected to benefit from incremental learning, with DNV (2024) projecting a 9% OPEX-based learning rate through 2050, supported by advances in digital monitoring and maintenance practices.
The drivers of these declines include economies of scale, technology improvements, and manufacturing efficiencies such as larger wafer formats, improved cell architectures, and advanced wafer processing techniques. Given this strong and sustained learning dynamic, continued global deployment is likely to further reduce costs. However, the pace of cost decline will vary depending on the time period, geographic market conditions, and whether costs are measured at the module level or across the full system.
Speed of Action
Speed of action refers to how quickly a climate solution physically affects the atmosphere after it is deployed. This is different from speed of deployment, which is the pace at which solutions are adopted.
At Project Drawdown, we define the speed of action for each climate solution as emergency brake, gradual, or delayed.
Deploy Utility-Scale Solar PV is a GRADUAL climate solution. It has a steady, linear impact on the atmosphere. As installed capacity of utility-scale PV increases over time, emissions from electricity generation are expected to decrease, assuming solar and other renewables displace fossil-fuel sources.
Caveats
One limitation of our approach is the assumption that each additional MWh generated by utility-scale solar PV displaces an equivalent MWh of the existing grid mix. This simplification implies that new utility-scale solar PV may at times displace other renewables such as onshore wind, rather than fossil fuel–based sources. In reality, the extent of avoided emissions varies based on regional grid dynamics, marginal generation sources, and the timing and location of electricity production. Utility-scale solar PV displaces a relatively high share of fossil fuel generation in grids where renewables are supported by flexible energy sources, such as natural gas (Suri et al., 2025). However, fossil fuel displacement is lower in coal-dominated grids, grids with significant nuclear or geothermal capacity, or regions where existing renewable capacity is already high (Baik et al., 2021; Bistline & Watten, 2025).
Implementing utility-scale solar PV involves several caveats. Technically, projects require large areas of suitable land and strong grid connections. Poor siting can reduce output due to shading, dust, or suboptimal solar resource (Bamisile et al., 2025; Sengupta et al., 2024). These challenges can be reduced through careful site selection, use of bifacial modules, use of tracking systems, and improved maintenance practices such as dry-cleaning technologies in arid regions. Another technical caveat is end-of-life management. Cumulative global PV waste is expected to reach 60–78 million metric tons by 2050 (IRENA & IEA-PVPS, 2016), so scaling up recycling infrastructure and circular design is essential (Ovaitt et al., 2022).
High capital intensity and financing constraints remain important barriers, particularly in emerging markets where high interest rates, policy uncertainty, and limited investor confidence increase project risk. Addressing these challenges often requires stable regulatory frameworks, concessional finance, and public–private partnerships to de-risk investments (Dioha, 2025). Supply-chain concentration also presents a caveat, as China dominates polysilicon and module production (IEA, 2022).
There are also ecological and social caveats. Large solar farms may compete with agriculture or alter local ecosystems, particularly in sensitive desert or grassland habitats (Hernandez et al., 2014; Lafitte et al., 2023; Xu et al., 2024). Mitigation strategies such as agrivoltaics and siting on degraded land are increasingly used to minimize conflicts and deliver additional benefits (Adeh et al., 2019; Giri & Mohanty, 2022; Tawalbeh et al., 2021; Yavari et al., 2022). Social resistance can also emerge around land rights, visual impacts, or perceived inequitable distribution of project benefits, highlighting the importance of community engagement and benefit-sharing (Shyu & Yang, 2025; Susskind et al., 2022).
Current Adoption
Table 3. Current adoption level, 2023.
Unit: MW installed capacity
| 25th percentile | 917,000 |
| Mean | 918,000 |
| Median (50th percentile) | 918,000 |
| 75th percentile | 918,000 |
Left Text Column Width
As of 2023, the global installed capacity for utility-scale solar PV reached approximately 918,000 MW (Table 3). We estimated current adoption of utility-scale solar PV based on IEA reports (IEA, 2023a; Masson et al., 2024). Although we use 2023 as our baseline for current adoption, in 2024 an estimated additional 308,300 MW of utility-scale solar PV capacity was installed, bringing the global total to 1,226,000 MW or more than 1 TW (IEA, 2023a).
In 2023, utility-scale solar PV accounted for 269.9 GW of new capacity additions, representing 59% of total global solar PV installed capacity that year (Masson et al., 2024). China continues to lead by a wide margin, with more than 435 GW of installed capacity, more than half the global total (Masson et al., 2024). Utility-scale solar PV systems are driving the majority of new additions in several key markets where large projects dominate deployment, including the U.S., India, Spain, and South Korea. By contrast, other regions such as the Middle East and Africa are progressing more slowly, with relatively limited large-scale deployments despite vast solar energy potential (SolarPower Europe, 2025). These disparities highlight the uneven pace of adoption across markets. For further details, see the Geographic Guidance section.
Adoption Trend
Figure 2. Global adoption of utility-scale solar PV, 2015–2023
Source: International Energy Agency. (2023). Solar PV power capacity in the Net Zero Scenario, 2015-2030. https://www.iea.org/data-and-statistics/charts/solar-pv-power-capacity-in-the-net-zero-scenario-2015-2030 Licence: CC BY 4.0
Enable Download
On
Table 4. Adoption trend, 2015–2023.
Unit: MW installed capacity/yr
| 25th percentile | 65,000 |
| Mean | 101,000 |
| Median (50th percentile) | 82,000 |
| 75th percentile | 99,000 |
Left Text Column Width
Global utility-scale solar PV capacity has grown rapidly, expanding from 113 GW in 2015 to about 918 GW by 2023 (Figure 2), reflecting technological progress, supportive policies, and accelerating investment.
We calculated the global adoption trend by summing global adoption for each year between 2015 and 2023 and taking the year-to-year difference. Comparing year-to-year global adoption, the median global adoption trend was adding 82,000 MW of installed capacity per year, but expansion was unevenly distributed geographically (Table 4, Figure 2).
Global utility-scale solar PV capacity expanded more than eightfold between 2015 and 2023 (IEA, 2023a). Growth was steady during the mid-2010s, averaging about 60–70 GW added per year, but adoption accelerated sharply in 2020, with annual additions climbing from 90 GW to 243 GW in 2023 (IEA, 2023a). This means that in 2023 alone, installations were more than double the yearly average of the previous five years, pushing the mean trendline to ~100 GW of annual growth since 2015. The data show a clear shift from incremental to exponential deployment, with utility-scale solar PV now accounting for the majority of global new renewable capacity (IRENA, 2024b).
Adoption Ceiling
Table 5. Adoption ceiling: upper limit for adoption level.
Unit: MW installed capacity
| 25th percentile | 224,000,000 |
| Mean | 252,000,000 |
| Median (50th percentile) | 252,000,000 |
| 75th percentile | 279,000,000 |
Left Text Column Width
The adoption ceiling for utility-scale solar PV is determined by the technology’s global technical potential, based primarily on solar resource availability. Since sunlight is geographically widespread and virtually inexhaustible, solar PV has one of the highest technical potentials of all renewable energy technologies. However, realistic deployment could vary across regions depending on land use, transmission access, and electricity demand.
Estimates of utility-scale solar PV potential vary widely across the literature. A meta-analysis found global technical potential ranging from 1.01 × 10² PWh/yr to 1.36 × 10⁴ PWh/yr, spanning two orders of magnitude; the median value was 4.65 × 10² PWh/yr while the average was 2.20 × 10³ PWh/yr (de La Beaumelle et al., 2023). Dupont et al. (2020) estimated the global net potential at 225 PWh/yr for poly-Si PV and 332 PWh/yr for mono-Si PV, while Deng et al. (2015), using a 1 km² global grid analysis, estimated realistic long-term potentials of 88–782 PWh/yr.
Despite the abundant solar resource, the adoption ceiling is unlikely to be reached due to other constraints. Land availability as well as competition with agriculture, urbanization, and protected ecosystems can restrict deployment (Diffendorfer et al., 2024; van de Ven et al., 2021). Grid integration poses another challenge, as high penetration of variable solar requires substantial investment in storage, flexible generation, and transmission to ensure system reliability. Regional solar resource quality, siting regulations, and access to capital further influence adoption (Ahmad et al., 2025; Bamisile et al., 2025). Emerging technologies such as agrivoltaics and floating PV can help overcome some of these barriers, bringing practical adoption levels closer to the ceiling (Adeh et al., 2019).
For our analysis, we estimated the median technical potential, which corresponds to an adoption ceiling of 252 million MW of installed capacity for utility-scale solar PV (Table 5).
Achievable Adoption
Table 6. Range of achievable adoption levels.
Unit: MW installed capacity
| Current adoption | 918,000 |
| Achievable – low | 12,000,000 |
| Achievable – high | 15,000,000 |
| Adoption ceiling | 252,000,000 |
Left Text Column Width
The IEA’s World Energy Outlook (WEO) 2024 presents several scenarios that explore future energy pathways under different assumptions about policies, technologies, and markets. For this analysis, we define the adoption achievable range for utility-scale solar PV based on the Stated Policies Scenario (STEPS) and the Announced Pledges Scenario (APS) (IEA, 2024a). However, the WEO does not explicitly distinguish between utility-scale and distributed solar PV in its projections. To bridge this gap, we conducted a simple linear projection using historical deployment trends to estimate the likely share of utility-scale PV within total solar PV capacity. Our analysis suggests that by 2050, utility-scale solar PV could represent approximately 74% of all solar PV deployment. This finding is consistent with IRENA’s REmap analysis, which projects that utility-scale systems will account for 60–80% of global solar PV capacity by mid-century (IRENA, 2019). Accordingly, for our study we assume that 74% of the IEA’s projected solar PV deployment in 2050 will come from utility-scale systems. This provides a reasonable basis for estimating adoption levels, while aligning with both historical patterns and complementary international assessments.
Achievable – Low
The low achievable adoption level is based on the Stated Policies Scenario (STEPS), which reflects the current trajectory of utility-scale solar PV expansion under existing and announced policies. In this scenario, assuming utility-scale projects account for 74% of total solar PV capacity, global capacity is projected to grow more than 13-fold; from 918,000 MW in 2023 to approximately 12 million MW by 2050 (Table 6). This corresponds to an average compound annual growth rate (CAGR) of 10%.
Achievable – High
The high achievable adoption level is based on APS, which assumes the same policy framework as STEPS, plus full realization of announced national energy and climate targets, including net-zero commitments supported by stronger clean energy investments. Under this scenario, utility-scale solar PV capacity is projected to increase approximately 16-fold from 918,000 MW in 2023 to approximately 15 million MW by 2050 (Table 6), requiring a CAGR of 10.8% over the same period.
Using our adoption ceiling of 252 million MW, the current adoption of utility-scale solar PV constitutes approximately 0.4% of its technical potential. The achievable adoption range, as calculated, lies between 4.8% and 5.9% of this potential.
Table 7. Climate impact at different levels of adoption.
Unit: Gt CO₂‑eq/yr, 100-yr basis
| Current adoption | 0.69 |
| Achievable – low | 9.2 |
| Achievable – high | 11.2 |
| Adoption ceiling | 190 |
Left Text Column Width
Using baseline global adoption and effectiveness, we estimated the current total climate impact of utility-scale solar PV to be approximately 0.70 Gt CO₂‑eq of reduced emissions per year (Table 7).
We estimated climate impacts using the emissions from the 2023 baseline electricity grid. Actual emissions reductions could differ depending on how the emissions intensity of electricity generation changes over time. As solar and other renewables grow to represent an increasingly high percentage of power generation sources, grid emissions are expected to decrease over time (DNV, 2024; IEA, 2024a). As a result, the climate impacts presented here are likely overestimates. Assuming global policies on utility-scale solar PV – both existing and announced – are backed with adequate implementation provisions, global adoption could reach 12 million MW by 2050. This would result in an increased emissions reduction of approximately 9.2 Gt CO₂ ‑eq per year. If every nation’s energy and climate targets (including net-zero commitments backed by stronger clean energy investments) are realized, utility-scale solar PV adoption could reach 15 million MW by 2050, leading to an estimated 11 Gt CO₂ ‑eq of reduced emissions per year.
We based the adoption ceiling solely on the technical potential of utility-scale solar PV, while neglecting social and economic constraints and realistic scenarios of future power demand (Dioha et al, 2025). The electricity sector in 2023 emitted 15.6 Gt CO₂ ‑eq (International Energy Agency [IEA], 2024b); emissions reductions cannot surpass this value without increased demand. Utility-scale solar PV installed capacity is unlikely to reach 252 million MW, but if current grid emissions remained constant while capacity increased, GHG emission reductions would be approximately 190 Gt CO₂‑eq/yr. This maximum is unrealistic as a forward-looking climate impact because it treats grid carbon intensity as permanently fixed at 2023 levels and ignores future decarbonization and corresponding decreases in marginal avoided emissions.
Additional Benefits
Income and Work
Solar PV can have a strong positive effect on the economy, as it accounts for 44% of renewable energy jobs globally and is the fastest-growing sector of renewable energy employment (IRENA & ILO, 2024). The majority of direct and indirect jobs in solar PV are found in China, followed by the European Union (IRENA & ILO, 2024). In the United States as of 2021, it was estimated that solar PV accounted for about 250,000 full-time jobs, with the majority of these jobs in the installation, project development, and manufacturing sectors (Gadzanku et al., 2023). While about half of solar PV jobs are in the distributed PV sector, utility-scale PV accounts for about 20% of these jobs and is expected to grow as installed capacities grow (Gadzanku et al., 2023). According to a report from NREL, about 509,000–757,000 jobs for both utility- and distributed-scale solar PV are projected to be added in the U.S. by 2030 (Truitt et al., 2022).
Health
Improvements in air quality offer health benefits from reduced air pollution exposure, including reduced premature mortality. The magnitude and distribution of these benefits depend on the local electricity grid mix, the fuels used to generate electricity, and atmospheric conditions that affect how far pollutants travel from emission sources (Buonocore et al., 2019). Regions with a higher proportion of coal-powered electricity generation will see more health benefits when utility-scale PV is deployed (Buonocore et al., 2019). These health benefits often translate into cost savings associated with reductions in hospital admissions, improved respiratory and cardiovascular conditions, and avoidance of lost work and school days (Millstein et al., 2017; Wiser et al., 2016). For example, a study from Chile found that when utility-scale solar PV projects were deployed, there was a reduction in hospital admissions for cardiovascular and respiratory conditions in cities downwind of fossil fuel–powered electricity plants (Rivera et al., 2024).
Water Resources
Utility-scale solar PV systems have lower rates of water withdrawals and consumption than other fossil fuel–based electricity generation (Wiser et al., 2016). The majority of water use for PV electricity is for washing and dust suppression on the panels (Hernandez et al., 2014).
Land Resources
Although utility-scale PV projects require large areas of suitable land (see Caveats and Interactions), these projects can utilize degraded lands that may not be suitable for other uses (Diffendorfer et al., 2024; Hernandez et al., 2014).
Air Quality
Solar PV reduces air pollutants released from fossil fuel energy generation, thereby avoiding the emission of pollutants such as nitrogen oxides, sulfur dioxide, and PM2.5 associated with burning coal and natural gas (Abel et al., 2018; Millstein et al., 2024; Millstein et al., 2017; Wiser et al., 2016). Regional differences in the amount and type of air pollutants avoided will vary depending on the fossil fuel type that PV displaces (Gallagher & Holloway, 2020). For example, since coal has different emissions than gas, regions with higher levels of coal-powered electricity will experience different air quality benefits than regions with more gas-powered electricity (Millstein et al., 2017). Depending on meteorological conditions, pollutants can be transported for long distances after they are emitted, so air pollution benefits can be widespread (Millstein et al., 2024).
Risks
Several risks accompany the large-scale rollout of utility-scale solar PV. Rapid deployment without adequate storage, grid flexibility, or transmission can elevate curtailment rates, undermining both financial returns and emissions reductions (Firoozi et al., 2025; Zubi et al., 2024). However, financial risk from high solar deployment and integration can be avoided with various policy levers, such as carbon taxes (Brown & Reichenberg, 2021). Different policy levers are necessary at different levels of adoption. The combined impact of higher shares of renewables generating electricity and increased electrification of consumer services can lead to greater risk of the intermittent supply from renewables being unable to meet electricity demand at all hours of the year (Wolak, 2022). Since long-term forecasting of supply is more challenging for technologies like wind and solar, stable electricity prices are not always guaranteed. This higher investment risk can discourage generators from investing in clean energy deployment (Dimanchev et al., 2024) in the absence of policy mechanisms such as contracts for difference that can manage investment risks by supporting creation of electricity markets with stable long-term prices (Beiter et al., 2024).
Concentrated supply chains also create vulnerabilities to trade disruptions, geopolitical tensions, and ethical risks, including documented concerns concerning forced labor in parts of the supply chain (IEA, 2022; Reinsch & Arrieta-Kenna, 2021). Environmental and health risks arise if end-of-life infrastructure and policies are inadequate; billions of metric tons of PV waste could otherwise end up in landfills, with additional concerns in some areas over water usage for panel cleaning or habitat disruption due to poorly sited installations (Bajagain et al., 2020; Chowdhury et al., 2020; IRENA & IEA-PVPS, 2016).
Interactions with Other Solutions
Reinforcing
Increased availability of renewable energy from utility-scale solar PV helps reduce emissions from the electricity grid as a whole. Reduced emissions from the electricity grid lead to lower downstream emissions for solutions that rely on electricity use. Deploying utility-scale solar PV also supports increased integration of wind power technologies by diversifying the renewable energy mix and reducing exposure to wind variability.
High penetration of utility-scale PV could incentivize increased adoption of automation systems that take advantage of times of high solar generation and lower electricity prices.
Electrification of transportation systems will be more beneficial in reducing global emissions if the underlying grid includes a higher proportion of non-emitting power sources. Electric transportation systems can also reduce curtailment of solar energy through controlled-time charging and other load-shifting technologies.
Competing
In regions where grid expansion is slow, prioritizing large-scale solar PV plants may delay distributed PV systems that are essential for rural or last-mile electrification.
Since wind and solar can generate electricity at the same times of day, deploying utility-scale solar PV could create competition for grid connections, reduce daytime electricity revenues, and suppress adoption of additional wind power.
Increased development and installation of utility-scale solar PV requires dedicated land use which limits land availability for other renewable energy technologies, raw material and food production, and conservation programs. For example, utility-scale solar PV competes with the following solutions for land:
- Protect Forests
- Improve Forest Management
- Protect Grasslands & Savannas
- Protect Peatlands
- Restore Peatlands
- Restore Forests
- Deploy Biomass Crops on Degraded Land
- Deploy Agroforestry
- Deploy Perennial Crops
- Restore Abandoned Farmland
- Improve Annual Cropping
- Deploy Silvopasture
- Deploy Alternative Grazing
- Deploy Onshore Wind Turbines
- Deploy Concentrated Solar
Dashboard
Solution Basics
MW installed capacity
t CO₂-eq (100-yr)/unit/yr
760
units
Current 918,000
01.2×10⁷1.5×10⁷
Achievable (Low to High)
Climate Impact
Gt CO₂-eq (100-yr)/yr
Current 0.69
9.211
Gradual
CO₂ , CH₄, N₂O
Trade-offs
Utility-scale solar PV delivers substantial net emissions savings, but significant trade-offs persist. Curtailment often reflects economic policy outcomes and grid integration constraints rather than a technical necessity. Limited integration infrastructure may also necessitate reliance on backup fossil-powered plants, thereby shifting emissions elsewhere in the energy system (Frew et al., 2021). Land use also involves trade-offs, as large projects can disrupt ecosystems or agricultural land, though co-location strategies such as agrivoltaics and usage of degraded lands can help offset these impacts (Chopdar et al., 2024; Giri & Mohanty, 2022).
The temporal variability of solar energy also creates trade-offs. When demand peaks in evening hours, non-solar energy sources ramp up generation, which could lead to increases in marginal emissions (Gagnon & O’Shaughnessy, 2024). In regions with high solar deployment, increased adoption of distributed PV could displace utility-scale solar generation, since both operate diurnally, resulting in no net reduction in grid emissions (Bistline & Watten, 2025).
kWh/m2/yr
Annual global horizontal irradiance (GHI)
Global horizontal irradiance (GHI) measures the intensity (energy per area per year) of all solar radiant energy on a horizontal surface. GHI limits the power output of fixed solar PV systems; however, panels can capture additional solar energy if tracking systems are incorporated. Here we show annual GHI averaged over the decade ending in 2025.
Copernicus Climate Change Service. (2022). ERA5-Land monthly averaged data from 1950 to present [Data set]. Copernicus Climate Change Service (C3S) Climate Data Store (CDS). Retrieved May 4, 2026, from Link to source: https://doi.org/10.24381/cds.adbb2d47
kWh/m2/yr
Annual global horizontal irradiance (GHI)
Global horizontal irradiance (GHI) measures the intensity (energy per area per year) of all solar radiant energy on a horizontal surface. GHI limits the power output of fixed solar PV systems; however, panels can capture additional solar energy if tracking systems are incorporated. Here we show annual GHI averaged over the decade ending in 2025.
Copernicus Climate Change Service. (2022). ERA5-Land monthly averaged data from 1950 to present [Data set]. Copernicus Climate Change Service (C3S) Climate Data Store (CDS). Retrieved May 4, 2026, from Link to source: https://doi.org/10.24381/cds.adbb2d47
Maps Introduction
Utility-scale solar PV deployment is driven by a variety of factors, some of which are spatial (such as total incident solar radiation) and some which may indirectly depend on geography, such as socioeconomic and market conditions.
More than 30 countries had more than 1 GW installed by the end of 2023 including new markets in the Middle East and Africa. Ten countries represented 84% of total solar markets in 2023, including distributed solar PV, with China, the United States, and India at the top of the list (IEA PVPS, 2023). Utility-scale solar PV dominated 2023 solar PV installations in both China and the United States, accounting for 65% and 70% of the Chinese and U.S. solar markets respectively (IEA PVPS, 2023).
In many regions, deployment of utility-scale solar PV lags significantly behind the economic and decarbonization potential, and large-scale deployment does not typically align with regions of maximal potential, as can be seen by comparing maps of installed capacity and irradiance. Brazil and Australia are notable exceptions, having significant deployment and high levels of GHI (Bamisile et al., 2025). However, utility-scale solar PV markets in Brazil and Australia are much smaller than in China and the United States. In emerging markets, solar PV competitiveness is stifled by limited access to capital, lack of technical talent, and persistent fossil-fuel subsidies. Targeted capital investments in sub-Saharan Africa can yield up to nine times the GHG emissions reduction of equivalent investments in more mature markets (Peters, 2025). In more mature markets like the U.S., barriers are primarily structural, including long grid interconnection timelines and high costs (Gorman et al., 2025).
The emissions benefit from increased solar PV deployment depends on the energy sources it displaces. Displacing sources of electricity that emit more GHGs leads to greater emissions reductions. However, real-world emissions reductions also depend on which sources are able to provide power when solar PV is unable to meet peaks in demand. In addition to targeting regions with dirtier grids, increasing utility-scale solar PV in regions with more dispatchable power sources and robust storage infrastructure could increase emissions reductions (Bistline & Watten, 2025). Here we show a map of avoided emissions with each incremental addition of solar PV, calculated by WattTime (watttime.org).
Action Word
Deploy
Solution Title
Utility-Scale Solar PV
Classification
Highly Recommended
Lawmakers and Policymakers
- Set ambitious long-term renewable energy goals, and incorporate them into national climate plans and multilateral agreements.
- Ensure regulatory frameworks around solar are strong and enforced, while also being accessible and timely; coordinate solar power policies horizontally (e.g., across agencies) and vertically (e.g., across subnational, national, and international efforts); seek to align social and environmental safeguards and streamline permitting processes.
- Adopt and progressively raise renewable energy procurement standards for the public sector to expand demand and investment in utility-scale solar PV.
- Set renewable energy quotas for power companies; offer expedited permitting processes for renewable energy production, including solar where competitive, while maintaining social and environmental safeguards.
- Develop long-term, flexible partnership frameworks with industry to align power supply contracts (such as adaptable or aggregated Purchase Power Agreements (PPAs) with national decarbonization targets and timelines.
- Set adjustments for solar power on-grid pricing through schemes such as feed-in tariffs, renewable energy auctions, or other guaranteed pricing methods for solar energy.
- Offer incentives to manufacturers, operators, developers, and other relevant actors, such as subsidies, feed-in tariffs, auctions, tax credits, and contracts-for-difference; as the market matures and becomes competitive, gradually reduce these incentives to create long-term market stability.
- Implement carbon taxes and remove subsidies from fossil fuel infrastructure; redirect those funds into renewable energy.
- Consider using green bonds to finance public projects and/or de-risk markets.
- Invest in and subsidize improvements to grid integration and flexibility, storage, and transmission infrastructure to manage variable generation; deploy smart grid technologies.
- Work with industry to diversify supply chains; design incentives and policies to stimulate local or regional production and advance R&D.
- Provide incentives for consumers to adjust energy use in response to renewable availability and grid conditions, such as through dynamic or demand-responsive pricing models that complement solar PV generation and support decarbonization.
- Earmark a percentage of financial incentives for low- and middle-income communities and/or countries.
- Improve labor and human rights laws and environmental standards around solar PV supply chains; enforce standards with industry – particularly for the extraction and use of critical minerals and panel manufacturing.
- Co-design utility-scale solar projects with the local community; ensure the community engagement process starts early and is transparent, inclusive, and ongoing; solicit feedback from the local community – including from opposition groups – on location, design, finance, and mitigation; ensure finalized projects address relevant sociological, agricultural, and ecological considerations.
- Ensure projects operating in or with Indigenous communities only do so under free, prior, and informed consent; codify free, prior, and informed consent into legal systems.
- Encourage utility-scale solar projects to distribute benefits to the local community, such as reduced utility rates; encourage developers to use Community Benefit Agreements (CBAs).
- Create and/or incentivize pathways for community solar projects, such as community-shared and cooperative business models.
- Regulate zoning and distance from existing houses, communities, and villages to prevent enclosing these spaces or interfering with the quality of life for local residents; avoid developing on sensitive ecosystems, such as wetlands and forests; require assessments and techniques to protect against negative impacts on biodiversity.
- Ensure strong quality control requirements for all stages of deployment including resource extraction, manufacturing, installation, maintenance, and end-of-life service; create certification programs for each stage of the process.
- Work with the private sector to develop workforce training programs, ensuring capacity development for all stages of deployment – including end-of-life services.
- Ensure strong regulations are in place for end-of-life services; enact Extended Producer Responsibility (EPR) for manufacturers; work with industry to foster a market for used, refurbished, and recycled panels.
- Join, create, or participate in public-private partnerships dedicated to de-risking markets, deployment, technology transfers, education, and other relevant areas.
- Establish one-stop-shop educational programs that use online and in-person methods to educate the industry and public on regulations, the benefits of solar, best practices for development, and other relevant information: ensure the material is sufficient and appropriate for local contexts, paying particularly close attention to language barriers.
Further information:
- Solar PV. Bojek (2025)
- Trends in PV applications 2025. Masson et al. (2025)
- Government relations and public policy job function action guide. Project Drawdown (2022)
- Legal job function action guide. Project Drawdown (2022)
Practitioners
- Enter into long-term flexible industry agreements, such as PPAs, with both public and private sectors.
- If possible, work with government bodies, companies, and large institutions to provide renewable energy directly to their operations.
- Take advantage of government incentives such as subsidies, feed-in tariffs, auctions, tax credits, and contracts-for-difference; as the market matures and becomes competitive, seek to gradually reduce reliance on these incentives to create long-term market stability.
- Consider using green bonds to finance public projects or de-risk markets.
- Invest in strengthening grid integration and flexibility through expanded energy storage, upgraded transmission infrastructure, and the deployment of smart grid technologies to effectively manage variable renewable generation.
- Work with the public sector to diversify supply chains; take advantage of incentives and policies that stimulate local or regional production and advance R&D.
- Ensure supply chains comply with international labor and human rights laws and standards – particularly, for the extraction of critical minerals and panel manufacturing.
- Co-design utility-scale solar projects with the local community; ensure the community engagement process starts early and is transparent, inclusive, and ongoing; solicit feedback from the local community – including from opposition groups – on location, design, finance, and mitigation; ensure finalized projects address relevant sociological, agricultural, and ecological considerations.
- Ensure projects operating in or with Indigenous communities only do so under free, prior, and informed consent; incorporate free, prior, and informed consent into bylaws and/or procedures.
- Design utility-scale solar projects to support the development of the local community such as reduced utility rates; utilize CBAs.
- Ensure development is a safe distance from existing houses, communities, and villages to prevent enclosing these spaces or interfering with the quality of life for local residents; avoid developing on sensitive ecosystems, such as wetlands and forests; conduct assessments and deploy techniques to protect negative impacts on biodiversity.
- Seek to decarbonize the full life cycle including supply chains, production, installation, recycling, and disposal as much as possible.
- Ensure strong quality control for all stages of deployment, including resource extraction, manufacturing, installation, maintenance, and end-of-life service.
- Work with the public sector and private organizations to develop workforce training programs, ensuring capacity development for all stages of deployment – including end-of-life services.
- Adhere to regulations regarding end-of-life servicing; adopt extended producer responsibility and high-integrity end-of-life servicing standards if no policy framework exists.
- Use bifacial modules, tracking systems, and improved maintenance practices, such as dry-cleaning, when beneficial.
- Invest directly into and help develop recycling infrastructure for solar panels.
- Participate in, offer, or explore co-investments in electricity infrastructure (e.g., shared transmission).
- Grant access to researchers and offer data, when possible, to advance deployment and refine best practices.
- Participate in voluntary agreements with government bodies to increase policy support for solar capacity and power generation.
- Stay abreast of and engage with changing policies, regulations, zoning laws, tax incentives, and related developments to help remove commercial barriers.
- Join, create, or participate in public-private partnerships dedicated to de-risking markets, deployment, technology transfers, education, and other relevant areas.
Further information:
- Solar PV. Bojek (2025)
- Trends in PV applications 2025. Masson et al. (2025)
Business Leaders
- Set ambitious long term renewable energy goals, incorporate them into corporate net zero strategies.
- Enter into PPAs, long-term contracts between a company (the buyer) and a renewable energy producer (the seller).
- Support long-term, stable contracts (e.g., PPAs or contracts for difference) that de-risk investment in solar technologies and incentivize local supply chain development.
- Take advantage of government incentives, such as tax credits, if possible; seek to gradually reduce reliance on these incentives to create long-term market stability.
- Purchase high-integrity renewable energy certificates (RECs) for solar energy; help create transparent, verified, and reliable REC markets.
- Invest in companies that produce, deploy, or provide end-of-life servicing for solar panels; seek to diversify and localize supply chains.
- Invest in R&D and related technology.
- Support workforce development programs, offer employee scholarships, and/or sponsor training for careers in solar power; ensuring capacity development for all stages of deployment – including end-of-life services.
- Participate in community engagement processes and co-design utility-scale solar projects with the local community; help educate the public and highlight the local economic benefits of solar and renewable energy.
- Offer pro bono business advice or general support for community solar projects, such as community-shared and cooperative business models.
- Join, create, or participate in public-private partnerships dedicated to de-risking markets, deployment, technology transfers, education, and other relevant areas.
Further information:
- Solar PV. Bojek (2025)
- Trends in PV applications 2025. Masson et al. (2025)
- Climate solutions at work. Project Drawdown (2021)
- Drawdown-aligned business framework. Project Drawdown (2021)
Nonprofit Leaders
- Advocate for ambitious long-term national goals on solar and renewable energy; advocate to incorporate them into national climate plans and multilateral agreements.
- Operate or help with equipment testing and certification systems, market information disclosures, and onsite supervision.
- Coordinate voluntary agreements between governments and industry to increase utility-scale solar capacity and power generation.
- Conduct open-access research to improve the performance of solar PVs, forecasting, and related technologies.
- Advocate for strong regulatory frameworks that are also accessible and timely; recommend coordinated solar power policies – both horizontally (e.g., across agencies) and vertically (e.g., across subnational, national, and international efforts); help align social and environmental safeguards and pursue streamlined permitting processes.
- Urge governments to provide incentives to manufacturers, operators, developers, and other relevant actors, such as subsidies, feed-in tariffs, auctions, tax credits, and contracts-for-difference; recommend gradual reductions of these incentives to create long-term market stability.
- Campaign for public investments in improvements to grid integration and flexibility, storage, and transmission infrastructure to manage variable generation.
- Call for a percentage of public financing to be earmarked for low- and middle-income communities and/or countries.
- Help improve enforcement of labor and human rights laws and standards around solar PV supply chains – particularly for the extraction and use of critical minerals.
- Call on governments and developers to use transparent, inclusive, and ongoing community engagement processes to co-design utility-scale solar installations; help solicit community feedback on location, design, finance, mitigation, and distribution of benefits; help ensure finalized projects address relevant sociological, agricultural, and ecological considerations.
- Advocate and/or support for the use of free, prior, and informed consent with projects operating in or with Indigenous communities; advocate to codify free, prior, and informed consent into legal systems.
- Advocate for distributed benefits to the local community from utility-scale solar projects, such as reduced utility rates; encourage developers to use CBAs.
- Help create or support community solar projects, such as community-shared, third-party-owned, and cooperative business models.
- Advocate for zoning laws to prevent enclosing communities or interfering with the quality of life for local residents; help developers avoid sensitive ecosystems, such as wetlands and forests; conduct site assessments and offer recommendations to prevent or mitigate negative impacts on biodiversity.
- Create resources and/or standards to improve quality control for all stages of deployment, including resource extraction, manufacturing, installation, maintenance, and end-of-life service; create and/or administer certification programs for each stage of the process.
- Work with the public and private sectors to develop workforce training programs, ensuring capacity development for all stages of deployment – including end-of-life services.
- Urge governments and industry to adopt strong regulations for end-of-life services; call for extended producer responsibility; work with industry to foster a market for used, refurbished, or recycled panels.
- Advocate for carbon taxes and the removal of subsidies from fossil fuel infrastructure; recommend those funds be redirected into renewable energy.
- Join, create, or participate in public-private partnerships dedicated to de-risking markets, deployment, technology transfers, education, and other relevant areas.
- Establish one-stop-shop educational programs that use online and in-person methods to educate the industry and public on regulations, the benefits of solar, best practices for development, and other relevant information; ensure the material is sufficient and appropriate for local contexts, paying particularly close attention to language barriers.
Further information:
- Solar PV. Bojek (2025)
- Trends in PV applications 2025. Masson et al. (2025)
Investors
- Offer low-interest loans and concessional financing for manufacturers, developers, operators, and recyclers.
- Invest directly in the development of utility-scale solar projects; ensure projects include community engagement processes, seek to distribute benefits, and operate under free, prior, and informed consent when working with Indigenous communities.
- Invest in companies that produce, deploy, or provide end-of-life servicing for solar panels; seek to diversify and localize supply chains.
- Invest in supporting infrastructures, such as utility companies, grid development, and access roads.
- Invest in green bonds and/or explore blended finance structures to mobilize capital for companies developing solar energy or supporting infrastructure.
- Invest in the recycling infrastructure for solar panels and circular supply chains.
- Invest in R&D, component technology, and related science, such as forecasting.
- Help de-risk energy transitions in low- and middle-income countries by offering low-interest loans, concessional financing, and/or favorable terms.
- Align investments with existing public-private partnerships, voluntary agreements, or voluntary guidance that may apply in the location of the investment (including those that apply to biodiversity).
Further information:
- Solar PV. Bojek (2025)
- Trends in PV applications 2025. Masson et al. (2025)
Philanthropists and International Aid Agencies
- Provide catalytic financing for, or help develop, utility-scale solar projects.
- Award grants to improve supporting infrastructures, such as utility companies, grid development, and access roads.
- Support the development of component technology and related science, such as forecasting.
- Award grants to improve the recycling infrastructure for solar panels and build circular supply chains.
- Facilitate partnerships to share solar technology and best practices between established and emerging markets, promoting energy equity and access.
- Foster cooperation and technology transfer between low- and middle-income countries with emerging solar sectors.
- Award grants to enhance grid integration, flexibility, and reliability by supporting innovations in energy storage systems, advanced grid management, and transmission infrastructure that enable effective integration of solar PV generation.
- Advocate for ambitious long-term national goals on solar and renewable energy; advocate to incorporate them into national climate plans and multilateral agreements.
- Operate, fund, or support equipment testing and certification systems, market information disclosures, and onsite supervision.
- Coordinate voluntary agreements between governments and industry to increase utility-scale solar capacity and power generation.
- Conduct open-access research to improve the performance of solar PVs, forecasting, and related technologies.
- Advocate for strong regulatory frameworks that are also accessible and timely; recommend coordinated solar power policies – both horizontally (e.g., across agencies) and vertically (e.g., across subnational, national, and international efforts); help align social and environmental safeguards and pursue streamlined permitting processes.
- Advocate for a percentage of public financing to be earmarked for low- and middle-income communities and/or countries.
- Help improve enforcement of labor and human rights laws and standards around solar PV supply chains – particularly for the extraction and use of critical minerals.
- Call on governments and developers to use transparent, inclusive, and ongoing community engagement processes to co-design utility-scale solar installations; help solicit community feedback on location, design, finance, mitigation, and distribution of benefits; help ensure finalized projects address relevant sociological, agricultural, and ecological considerations.
- Champion and/or support for the use of free, prior, and informed consent with projects operating in or with Indigenous communities; advocate to codify free, prior, and informed consent into legal systems.
- Advocate for distributed benefits to the local community from utility-scale solar projects, such as reduced utility rates; encourage developers to use CBAs.
- Help create or support community solar projects, such as community-shared and cooperative business models.
- Create resources and/or standards to improve quality control for all stages of deployment, including resource extraction, manufacturing, installation, maintenance, and end-of-life service; create and/or administer certification programs for each stage of the process.
- Work with the public and private sectors to develop workforce training programs; ensuring capacity development for all stages of deployment – including end-of-life services.
- Urge governments and industry to adopt strong regulations for end-of-life services; call for extended producer responsibility; work with industry to foster a market for used, refurbished, or recycled panels.
- Join, create, or participate in public-private partnerships dedicated to de-risking markets, deployment, technology transfers, education, and other relevant areas.
- Establish one-stop-shop educational programs that use online and in-person methods to educate the industry and public on regulations, the benefits of solar, best practices for development, and other relevant information; ensure the material is sufficient and appropriate for local contexts, paying particularly close attention to language barriers.
Further information:
Further information:
- Solar PV. Bojek (2025)
- Trends in PV applications 2025. Masson et al. (2025)
Thought Leaders
- Advocate for ambitious long-term national goals on solar and renewable energy; advocate to incorporate them into national climate plans and multilateral agreements.
- Operate or help with equipment testing and certification systems, market information disclosures, and onsite supervision.
- Conduct open-access research to improve the performance of solar PVs, forecasting, and related technologies.
- Advocate for strong regulatory frameworks that are also accessible and timely; recommend coordinated solar power policies – both horizontally (e.g., across agencies) and vertically (e.g., across subnational, national, and international efforts); help align social and environmental safeguards and pursue streamlined permitting processes.
- Urge governments to provide incentives to manufacturers, operators, developers, and other relevant actors, such as subsidies, feed-in tariffs, auctions, tax credits, and contracts-for-difference; recommend gradual reductions of these incentives to create long-term market stability.
- Campaign for public investments in improvements to grid integration and flexibility, storage, and transmission infrastructure to manage variable generation.
- Advocate for a percentage of public financing to be earmarked for low- and middle-income communities and/or countries.
- Help improve enforcement of labor and human rights laws and standards around solar PV supply chains – particularly for the extraction and use of critical minerals.
- Call on governments and developers to use transparent, inclusive, and ongoing community engagement processes to co-design utility-scale solar installations; help solicit community feedback on location, design, finance, mitigation, and distribution of benefits; help ensure finalized projects address relevant sociological, agricultural, and ecological considerations.
- Champion and/or support for the use of free, prior, and informed consent with projects operating in or with Indigenous communities; advocate to codify free, prior, and informed consent into legal systems.
- Advocate for distributed benefits to the local community from utility-scale solar projects, such as reduced utility rates; encourage developers to use CBAs.
- Help create or support community solar projects, such as community-shared, third-party-owned, and cooperative business models.
- Advocate for strong regulations for end-of-life services; advocate for extended producer responsibility; work with industry to foster a market for used, refurbished, or recycled panels.
- Advocate for carbon taxes and the removal of subsidies from fossil fuel infrastructure; recommend those funds be redirected into renewable energy.
- Join, create, or participate in public-private partnerships dedicated to de-risking markets, deployment, technology transfers, education, and other relevant areas.
- Establish one-stop-shop educational programs that use online and in-person methods to educate the industry and public on regulations, the benefits of solar, best practices for development, and other relevant information; ensure the material is sufficient and appropriate for local contexts, paying particularly close attention to language barriers.
Further information:
- Solar PV. Bojek (2025)
- Trends in PV applications 2025. Masson et al. (2025)
Technologists and Researchers
- Continue advancing the performance of monocrystalline and polycrystalline silicon cells.
- Continue advancing bifacial module designs and next-generation solar cell technologies, including perovskite-silicon tandem cells, organic photovoltaics, dye-sensitized solar cells, and passivated emitter and rear contact cells.
- Advance energy storage systems technologies, such as battery, hydrogen, gravity-based, and other energy storage systems.
- Improve manufacturing efficiencies, such as larger wafer formats, improved cell architectures, and advanced wafer processing techniques.
- Continue developing agrivoltaics; improve scientific understanding of water drainage, runoff, and erosion under and near utility-scale solar PV; develop relevant best practices.
- Advance technologies for floating solar PV installations; seek scalable solutions relevant for utility-scale.
- Improve recycling infrastructure and scalable technologies to repair, reuse, or recover materials from solar panels.
- Create more heat-tolerant PV technologies and systems to reduce heat exposure and/or absorption.
- Create better protection and cleaning systems for PV to preserve functionality during extreme weather and in extreme environments, particularly in deserts.
- Improve related mining technologies for critical minerals to be safer, less disruptive to local communities and ecosystems, and less energy-intensive.
- Develop ways of eliminating, reducing, reusing, and/or safely disposing of hazardous byproducts of the PV manufacturing process.
- Research and develop analytical tools for land allocation and development, taking into account human rights, environmental concerns, energy needs, agricultural demands, and other relevant factors, such as changing weather patterns.
- Research factors that lead to community acceptance and energy justice for utility-scale solar.
- Research the impact of utility-scale solar on biodiversity – particularly mammals, amphibians, reptiles, and microorganisms; examine methods to mitigate impacts on biodiversity; research optimal land allocation strategies, comparisons between installation methods and operations, best practices, and the potential for solar installations to provide habitats to some native species; examine relationship with and impacts on invasive species.
- Research the impacts of floating PV installations on biodiversity – particularly terrestrial or semi-aquatic species.
Further information:
- Solar PV. Bojek (2025)
- Trends in PV applications 2025. Masson et al. (2025)
Communities, Households, and Individuals
- Purchase high-integrity RECs, which track ownership of renewable energy generation.
- If your utility company offers transparent green pricing – which charges a premium to cover the extra cost of renewable energy – and if it fits your budget, opt into it.
- Help create or support community solar projects, such as community-shared, third-party-owned, and cooperative business models.
- Call on governments and developers to use transparent, inclusive, and ongoing community engagement processes; participate in these processes when possible to co-design utility-scale solar installations; provide and help collect feedback on location, design, finance, mitigation, and distribution of benefits; help ensure finalized projects address relevant sociological, agricultural, and ecological considerations.
- Advocate for a percentage of public financing to be earmarked for low- and middle-income communities and/or countries.
- Champion and/or support for the use of free, prior, and informed consent with projects operating in or with Indigenous communities; advocate to codify free, prior, and informed consent into legal systems.
- Advocate for distributed benefits to the local community from utility-scale solar projects, such as reduced utility rates; encourage developers to use CBAs.
- Participate in public awareness campaigns focused on solar projects; share information with your community and networks.
Further information:
- Solar PV. Bojek (2025)
- Trends in PV applications 2025. Masson et al. (2025)
“Take Action” Sources
- Solar PV power potential is greatest over croplands. Adeh et al. (2019)
- Maximising solar PV potential: A comprehensive review of factors affecting photovoltaic installation and generation in a mild temperate oceanic climate. Ahmad et al. (2025)
- Current practices on solar photovoltaic waste management: An overview of the potential risk and regulatory approaches of the photovoltaic waste. Bajagain et al. (2020)
- The environmental factors affecting solar photovoltaic output. Bamisile et al. (2025)
- Comprehensive review on agrivoltaics with technical, environmental and societal insights. Chopdar et al. (2024)
- An overview of solar photovoltaic panels’ end-of-life material recycling. Chowdhury et al. (2020)
- The global technical, economic, and feasible potential of renewable electricity. de La Beaumelle et al. (2023)
- The interplay of future solar energy, land cover change, and their projected impacts on natural lands and croplands in the US. Diffendorfer et al. (2024)
- How can we finance a fair energy transition in Africa? Dioha (2025)
- Energy transition outlook 2024. DNV (2024)
- Harnessing photovoltaic innovation: Advancements, challenges, and strategic pathways for sustainable global development. Firoozi et al. (2025)
- Solar PV global supply chains. IEA (2022)
- Trends in PV applications 2025. Masson et al. (2025)
- Renewable energy integration in power grids: technology brief. IEA-ETSAP and IRENA (2015)
- Future of solar photovoltaic: Deployment, investment, technology, grid integration and socio-economic aspects. IRENA (2019)
- End-of-life management: Solar photovoltaic panels. IRENA & IEA-PVPS (2016)
- Existing evidence on the effects of photovoltaic panels on biodiversity: a systematic map with critical appraisal of study validity. Lafitte et al. (2023)
- A comprehensive review on solar photovoltaics: Navigating generational shifts, innovations, and sustainability. Mdallal et al. (2025)
- A dark spot for the solar energy industry: Forced labor in Xinjiang. Reinsch & Arrieta-Kenna (2021)
- Socio-technical tensions from community acceptance, energy transition, and energy justice: Lessons from solar photovoltaic projects in Taiwan. Shyu & Yang (2025)
- Global market outlook for solar power 2025-2029. SolarPower Europe (2025)
- Sources of opposition to renewable energy projects in the United States. Susskind et al. (2022)
- Renewable energy scenarios for sustainable electricity supply in Nigeria. Tambari et al. (2020)
- Climate, air quality and human health benefits of various solar photovoltaic deployment scenarios in China in 2030. Yang et al. (2018)
- Minimizing environmental impacts of solar farms: a review of current science on landscape hydrology and guidance on stormwater management. Yavari et al. (2022)
Evidence Base
Consensus of effectiveness of utility-scale solar PV in reducing greenhouse gas emissions: High
Utility-scale solar PV is firmly established as an efficient and effective electricity source. Increasing availability of energy produced from PV reduces the need for fossil fuel–derived energy sources such as coal and gas, leading to lower GHG emissions from the global electricity sector. The evidence base for utility-scale solar PV is robust and a wide range of peer-reviewed studies, international energy outlooks, and meta-analyses converge on the conclusion that solar PV is a cornerstone of sustainable global energy production. The IPCC (IPCC, 2023) identifies solar PV as indispensable in all mitigation scenarios, while the IEA’s World Energy Outlook 2024 (IEA, 2024a) highlights PV as the largest single source of electricity in net-zero aligned pathways. Similarly, IRENA documents how rapid cost declines, performance improvements, and policy support have enabled utility-scale solar PV to become one of the cheapest sources of new electricity in many regions (IRENA, 2025). Utility-scale solar PV projects have particularly benefited from economies of scale and competitive auctions, accelerating their role in global electricity markets (DNV, 2024; Masson et al., 2024).
The technical potential of solar PV refers to the maximum electricity generation achievable given solar resource availability, constrained only by physical and technological factors. Meta-analyses reveal wide ranges from 101 PWh/yr to more than 13,600 PWh/yr (de La Beaumelle et al., 2023). With only 1.29 PWh generated from solar PV in 2023, the sector is still far from its potential ceiling due to multiple barriers (IEA, 2024b).
Integration into power systems requires significant investment in grid flexibility, storage, and transmission infrastructure to manage variable generation (Frew et al., 2021; IEA-ETSAP & IRENA, 2015; Tambari et al., 2020). Financing barriers, particularly in Africa and parts of the Global South, remain critical, with high capital costs and policy uncertainty slowing adoption despite abundant solar resource (Dato et al., 2025).
Notwithstanding, there is high scientific agreement on the effectiveness of utility-scale solar PV as a core climate solution. The results presented here summarize findings from 11 reviews/meta-analyses, 45 research articles, and 25 institutional reports, covering evidence from different parts of the world. We acknowledge potential underrepresentation of insights from sub-Saharan Africa and Latin America, which could introduce regional bias in those regions where utility-scale solar PV deployment potential remains substantially underdeveloped.
Updated Date
Coming Soon Label
Coming Soon