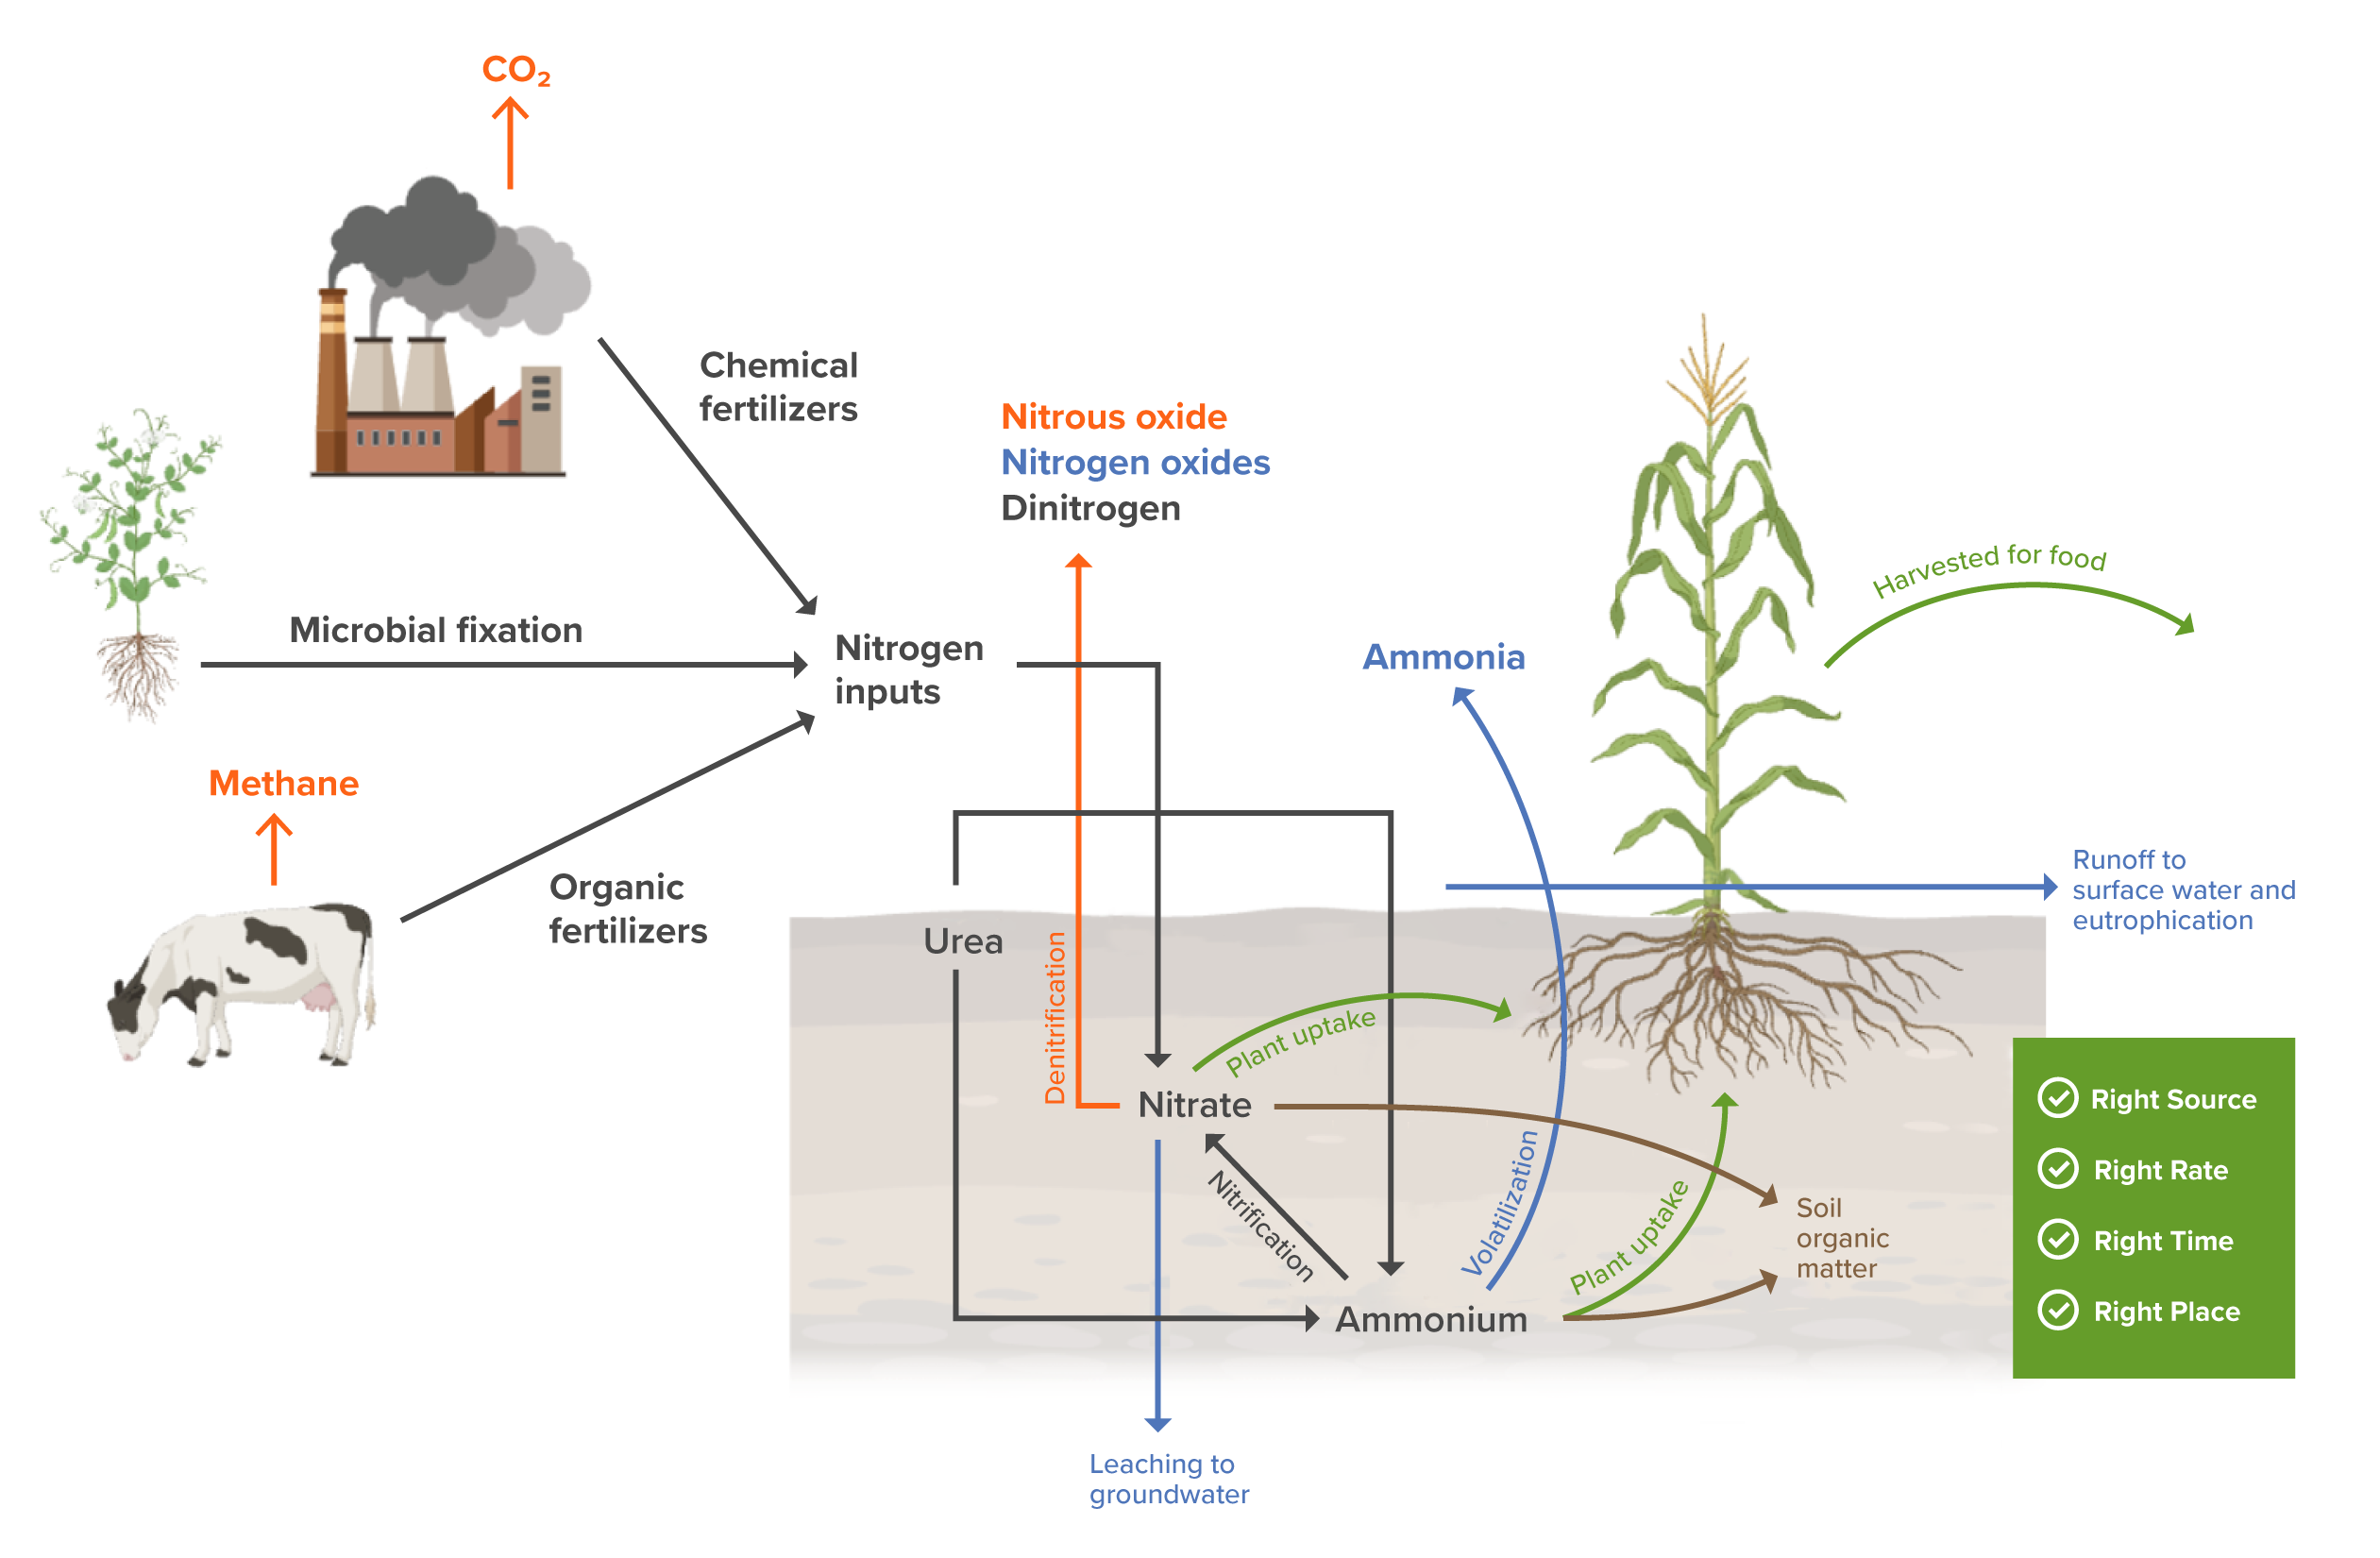
Agriculture is the dominant source of human-caused emissions of nitrous oxide (Tian et al., 2020). Nitrogen is critical for plant growth and is added to croplands in synthetic forms, such as urea, ammonium nitrate, or anhydrous ammonia; in organic forms, such as manure or compost; and by growing legume crops, which host microbes that capture nitrogen from the air and add it to the soil (Adalibieke et al., 2023; Ludemann et al., 2024). If more nitrogen is added than crops can use, the excess can be converted to other forms, including nitrous oxide, through microbial processes called denitrification and nitrification (Figure 1; Reay et al., 2012).
Improve Nutrient Management
Mode
Cut Emissions
Cluster
Shift Agriculture Practices
Image
Image
Coming Soon
Off
Summary
We define the Improve Nutrient Management solution as reducing excessive nitrogen use on croplands. Nitrogen is critical for crop production and is added to croplands as synthetic or organic fertilizers and through microbial activity. However, farmers often add more nitrogen to croplands than crops can use. Some of that excess nitrogen is emitted to the atmosphere as nitrous oxide, a potent GHG.
Overview
Figure 1. The agricultural nitrogen cycle represents the key pathways by which nitrogen is added to croplands and lost to the environment, including as nitrous oxide. The “4R” nutrient management principles – right source, right rate, right time, right place – increase the proportion of nitrogen taken up by the plant, therefore reducing nitrogen losses to the environment.
Image
Illustrations: BioRender CC-BY 4.0
Farmers can reduce nitrous oxide emissions from croplands by using the right amount and the right type of fertilizer at the right time and in the right place (Fixen, 2020; Gao & Cabrera Serrenho, 2023). Together, these four “rights” increase nitrogen use efficiency – the proportion of applied nitrogen that the crop uses (Congreves et al., 2021). Improved nutrient management is often a win-win for the farmer and the environment, reducing fertilizer costs while also lowering nitrous oxide emissions (Gu et al., 2023).
Improving nutrient management involves reducing the amount of nitrogen applied to match the crop’s requirements in areas where nitrogen is currently overapplied. A farmer can implement the other three principles – type, time, and place – in a number of ways. For example, fertilizing just before planting instead of after the previous season’s harvest better matches the timing of nitrogen addition to that of plant uptake, reducing nitrous oxide emissions before the crop is planted. Certain types of fertilizers are better suited for maximizing plant uptake, such as extended-release fertilizers, which allow the crop to steadily absorb nutrients over time. Techniques such as banding, in which farmers apply fertilizers in concentrated bands close to the plant roots instead of spreading them evenly across the soil surface, also reduce nitrous oxide emissions. Each of these practices can increase nitrogen use efficiency and decrease the amount of excess nitrogen lost as nitrous oxide (Gao & Cabrera Serrenho, 2023; Gu et al., 2023; Wang et al., 2024; You et al., 2023).
For this solution, we estimated a target rate of nitrogen application for major crops as the 20th percentile of the current rate of nitrogen application (in t N/t crop) in areas where yields are near a realistic ceiling. Excess nitrogen was defined as the amount of nitrogen applied beyond the target rate (see Adoption and Appendix for more details). Our emissions estimates include nitrous oxide from croplands, fertilizer runoff, and fertilizer volatilization. They do not include emissions from fertilizer manufacturing, which are addressed in the Deploy Low-Emission Industrial Feedstocks and Increase Industrial Efficiency solutions. We excluded nutrient management on pastures from this solution due to data limitations, and address nutrient management in paddy rice systems in the Improve Rice Management solution instead.
Adalibieke, W., Cui, X., Cai, H., You, L., & Zhou, F. (2023). Global crop-specific nitrogen fertilization dataset in 1961–2020. Scientific Data, 10(1), 617. https://doi.org/10.1038/s41597-023-02526-z
Almaraz, M., Bai, E., Wang, C., Trousdell, J., Conley, S., Faloona, I., & Houlton, B. Z. (2018). Agriculture is a major source of NOx pollution in California. Science Advances, 4(1), eaao3477. https://doi.org/10.1126/sciadv.aao3477
Antil, R. S., & Raj, D. (2020). Integrated nutrient management for sustainable crop production and improving soil health. In R. S. Meena (Ed.), Nutrient Dynamics for Sustainable Crop Production (pp. 67–101). Springer. https://doi.org/10.1007/978-981-13-8660-2_3
Bijay-Singh, & Craswell, E. (2021). Fertilizers and nitrate pollution of surface and ground water: An increasingly pervasive global problem. SN Applied Sciences, 3(4), 518. https://doi.org/10.1007/s42452-021-04521-8
Chivenge, P., Saito, K., Bunquin, M. A., Sharma, S., & Dobermann, A. (2021). Co-benefits of nutrient management tailored to smallholder agriculture. Global Food Security, 30, 100570. https://doi.org/10.1016/j.gfs.2021.100570
Deng, J., Guo, L., Salas, W., Ingraham, P., Charrier-Klobas, J. G., Frolking, S., & Li, C. (2018). Changes in irrigation practices likely mitigate nitrous oxide emissions from California cropland. Global Biogeochemical Cycles, 32(10), 1514–1527. https://doi.org/10.1029/2018GB005961
Domingo, N. G. G., Balasubramanian, S., Thakrar, S. K., Clark, M. A., Adams, P. J., Marshall, J. D., Muller, N. Z., Pandis, S. N., Polasky, S., Robinson, A. L., Tessum, C. W., Tilman, D., Tschofen, P., & Hill, J. D. (2021). Air quality–related health damages of food. Proceedings of the National Academy of Sciences, 118(20), e2013637118. https://doi.org/10.1073/pnas.2013637118
Elberling, B. B., Kovács, G. M., Hansen, H. F. E., Fensholt, R., Ambus, P., Tong, X., Gominski, D., Mueller, C. W., Poultney, D. M. N., & Oehmcke, S. (2023). High nitrous oxide emissions from temporary flooded depressions within croplands. Communications Earth & Environment, 4(1), 1–9. https://doi.org/10.1038/s43247-023-01095-8
Fixen, P. E. (2020). A brief account of the genesis of 4R nutrient stewardship. Agronomy Journal, 112(5), 4511–4518. https://doi.org/10.1002/agj2.20315
Foley, J. A., Ramankutty, N., Brauman, K. A., Cassidy, E. S., Gerber, J. S., Johnston, M., Mueller, N. D., O’Connell, C., Ray, D. K., West, P. C., Balzer, C., Bennett, E. M., Carpenter, S. R., Hill, J., Monfreda, C., Polasky, S., Rockström, J., Sheehan, J., Siebert, S., … Zaks, D. P. M. (2011). Solutions for a cultivated planet. Nature, 478(7369), 337–342. https://doi.org/10.1038/nature10452
Gao, Y., & Cabrera Serrenho, A. (2023). Greenhouse gas emissions from nitrogen fertilizers could be reduced by up to one-fifth of current levels by 2050 with combined interventions. Nature Food, 4(2), 170–178. https://doi.org/10.1038/s43016-023-00698-w
Gerber, J. S., Carlson, K. M., Makowski, D., Mueller, N. D., Garcia de Cortazar-Atauri, I., Havlík, P., Herrero, M., Launay, M., O’Connell, C. S., Smith, P., & West, P. C. (2016). Spatially explicit estimates of nitrous oxide emissions from croplands suggest climate mitigation opportunities from improved fertilizer management. Global Change Biology, 22(10), 3383–3394. https://doi.org/10.1111/gcb.13341
Gerber, J. S., Ray, D. K., Makowski, D., Butler, E. E., Mueller, N. D., West, P. C., Johnson, J. A., Polasky, S., Samberg, L. H., & Siebert, S. (2024). Global spatially explicit yield gap time trends reveal regions at risk of future crop yield stagnation. Nature Food, 5(2), 125–135. Link to source: https://doi.org/10.1038/s43016-023-00913-8
Gong, C., Tian, H., Liao, H., Pan, N., Pan, S., Ito, A., Jain, A. K., Kou-Giesbrecht, S., Joos, F., Sun, Q., Shi, H., Vuichard, N., Zhu, Q., Peng, C., Maggi, F., Tang, F. H. M., & Zaehle, S. (2024). Global net climate effects of anthropogenic reactive nitrogen. Nature, 632(8025), 557–563. https://doi.org/10.1038/s41586-024-07714-4
Gu, B., Zhang, X., Lam, S. K., Yu, Y., van Grinsven, H. J. M., Zhang, S., Wang, X., Bodirsky, B. L., Wang, S., Duan, J., Ren, C., Bouwman, L., de Vries, W., Xu, J., Sutton, M. A., & Chen, D. (2023). Cost-effective mitigation of nitrogen pollution from global croplands. Nature, 613(7942), 77–84. https://doi.org/10.1038/s41586-022-05481-8
Hergoualc’h, K., Akiyama, H., Bernoux, M., Chirinda, N., del Prado, A., Kasimir, Å., MacDonald, J. D., Ogle, S. M., Regina, K., & van der Weerden, T. J. (2019). Chapter 11: nitrous oxide Emissions from managed soils, and CO2 emissions from lime and urea application (2019 Refinement to the 2006 IPCC Guidelines for National Greenhouse Gas Inventories). Intergovernmental Panel on Climate Change. https://www.ipcc-nggip.iges.or.jp/public/2019rf/pdf/4_Volume4/19R_V4_Ch11_Soils_nitrous oxide_CO2.pdf
Hergoualc’h, K., Mueller, N., Bernoux, M., Kasimir, Ä., van der Weerden, T. J., & Ogle, S. M. (2021). Improved accuracy and reduced uncertainty in greenhouse gas inventories by refining the IPCC emission factor for direct nitrous oxide emissions from nitrogen inputs to managed soils. Global Change Biology, 27(24), 6536–6550. https://doi.org/10.1111/gcb.15884
IPCC, 2019: Summary for Policymakers. In: Climate Change and Land: an IPCC special report on climate change, desertification, land degradation, sustainable land management, food security, and greenhouse gas fluxes in terrestrial ecosystems [P.R. Shukla, J. Skea, E. Calvo Buendia, V. Masson-Delmotte, H.-O. Pörtner, D. C. Roberts, P. Zhai, R. Slade, S. Connors, R. van Diemen, M. Ferrat, E. Haughey, S. Luz, S. Neogi, M. Pathak, J. Petzold, J. Portugal Pereira, P. Vyas, E. Huntley, K. Kissick, M. Belkacemi, J. Malley, (eds.)].
Lam, S. K., Suter, H., Mosier, A. R., & Chen, D. (2017). Using nitrification inhibitors to mitigate agricultural nitrous oxide emission: A double-edged sword? Global Change Biology, 23(2), 485–489. https://doi.org/10.1111/gcb.13338
Lawrence, N. C., Tenesaca, C. G., VanLoocke, A., & Hall, S. J. (2021). Nitrous oxide emissions from agricultural soils challenge climate sustainability in the US Corn Belt. Proceedings of the National Academy of Sciences, 118(46), e2112108118. https://doi.org/10.1073/pnas.2112108118
Ludemann, C. I., Wanner, N., Chivenge, P., Dobermann, A., Einarsson, R., Grassini, P., Gruere, A., Jackson, K., Lassaletta, L., Maggi, F., Obli-Laryea, G., van Ittersum, M. K., Vishwakarma, S., Zhang, X., & Tubiello, F. N. (2024). A global FAOSTAT reference database of cropland nutrient budgets and nutrient use efficiency (1961–2020): Nitrogen, phosphorus and potassium. Earth System Science Data, 16(1), 525–541. https://doi.org/10.5194/essd-16-525-2024
Menegat, S., Ledo, A., & Tirado, R. (2022). Greenhouse gas emissions from global production and use of nitrogen synthetic fertilisers in agriculture. Scientific Reports, 12(1), 14490. https://doi.org/10.1038/s41598-022-18773-w
Michaelowa, A., Hermwille, L., Obergassel, W., & Butzengeiger, S. (2019). Additionality revisited: Guarding the integrity of market mechanisms under the Paris Agreement. Climate Policy, 19(10), 1211–1224. https://doi.org/10.1080/14693062.2019.1628695
Mueller, N. D., Gerber, J. S., Johnston, M., Ray, D. K., Ramankutty, N., & Foley, J. A. (2012). Closing yield gaps through nutrient and water management. Nature, 490(7419), Article 7419. https://doi.org/10.1038/nature11420
Patel, N., Srivastav, A. L., Patel, A., Singh, A., Singh, S. K., Chaudhary, V. K., Singh, P. K., & Bhunia, B. (2022). Nitrate contamination in water resources, human health risks and its remediation through adsorption: A focused review. Environmental Science and Pollution Research, 29(46), 69137–69152. https://doi.org/10.1007/s11356-022-22377-2
Pinder, R. W., Davidson, E. A., Goodale, C. L., Greaver, T. L., Herrick, J. D., & Liu, L. (2012). Climate change impacts of US reactive nitrogen. Proceedings of the National Academy of Sciences, 109(20), 7671–7675. https://doi.org/10.1073/pnas.1114243109
Porter, E. M., Bowman, W. D., Clark, C. M., Compton, J. E., Pardo, L. H., & Soong, J. L. (2013). Interactive effects of anthropogenic nitrogen enrichment and climate change on terrestrial and aquatic biodiversity. Biogeochemistry, 114(1), 93–120. https://doi.org/10.1007/s10533-012-9803-3
Qiao, C., Liu, L., Hu, S., Compton, J. E., Greaver, T. L., & Li, Q. (2015). How inhibiting nitrification affects nitrogen cycle and reduces environmental impacts of anthropogenic nitrogen input. Global Change Biology, 21(3), 1249–1257. https://doi.org/10.1111/gcb.12802
Qin, Z., Deng, S., Dunn, J., Smith, P., & Sun, W. (2021). Animal waste use and implications to agricultural greenhouse gas emissions in the United States. Environmental Research Letters, 16(6), 064079. https://doi.org/10.1088/1748-9326/ac04d7
Reay, D. S., Davidson, E. A., Smith, K. A., Smith, P., Melillo, J. M., Dentener, F., & Crutzen, P. J. (2012). Global agriculture and nitrous oxide emissions. Nature Climate Change, 2(6), 410–416. https://doi.org/10.1038/nclimate1458
Rockström, J., Williams, J., Daily, G., Noble, A., Matthews, N., Gordon, L., Wetterstrand, H., DeClerck, F., Shah, M., Steduto, P., de Fraiture, C., Hatibu, N., Unver, O., Bird, J., Sibanda, L., & Smith, J. (2017). Sustainable intensification of agriculture for human prosperity and global sustainability. Ambio, 46(1), 4–17. https://doi.org/10.1007/s13280-016-0793-6
Rurinda, J., Zingore, S., Jibrin, J. M., Balemi, T., Masuki, K., Andersson, J. A., Pampolino, M. F., Mohammed, I., Mutegi, J., Kamara, A. Y., Vanlauwe, B., & Craufurd, P. Q. (2020). Science-based decision support for formulating crop fertilizer recommendations in sub-Saharan Africa. Agricultural Systems, 180, 102790. https://doi.org/10.1016/j.agsy.2020.102790
Scavia, D., David Allan, J., Arend, K. K., Bartell, S., Beletsky, D., Bosch, N. S., Brandt, S. B., Briland, R. D., Daloğlu, I., DePinto, J. V., Dolan, D. M., Evans, M. A., Farmer, T. M., Goto, D., Han, H., Höök, T. O., Knight, R., Ludsin, S. A., Mason, D., … Zhou, Y. (2014). Assessing and addressing the re-eutrophication of Lake Erie: Central basin hypoxia. Journal of Great Lakes Research, 40(2), 226–246. https://doi.org/10.1016/j.jglr.2014.02.004
Selim, M. M. (2020). Introduction to the integrated nutrient management strategies and their contribution to yield and soil properties. International Journal of Agronomy, 2020(1), 2821678. https://doi.org/10.1155/2020/2821678
Shcherbak, I., Millar, N., & Robertson, G. P. (2014). Global metaanalysis of the nonlinear response of soil nitrous oxide (nitrous oxide) emissions to fertilizer nitrogen. Proceedings of the National Academy of Sciences, 111(25), 9199–9204. https://doi.org/10.1073/pnas.1322434111
Shindell, D. T., Faluvegi, G., Koch, D. M., Schmidt, G. A., Unger, N., & Bauer, S. E. (2009). Improved attribution of climate forcing to emissions. Science, 326(5953), 716–718. https://doi.org/10.1126/science.1174760
Sobota, D. J., Compton, J. E., McCrackin, M. L., & Singh, S. (2015). Cost of reactive nitrogen release from human activities to the environment in the United States. Environmental Research Letters, 10(2), 025006. https://doi.org/10.1088/1748-9326/10/2/025006
Tian, H., Xu, R., Canadell, J. G., Thompson, R. L., Winiwarter, W., Suntharalingam, P., Davidson, E. A., Ciais, P., Jackson, R. B., Janssens-Maenhout, G., Prather, M. J., Regnier, P., Pan, N., Pan, S., Peters, G. P., Shi, H., Tubiello, F. N., Zaehle, S., Zhou, F., … Yao, Y. (2020). A comprehensive quantification of global nitrous oxide sources and sinks. Nature, 586(7828), 248–256. https://doi.org/10.1038/s41586-020-2780-0
van Grinsven, H. J. M., Bouwman, L., Cassman, K. G., van Es, H. M., McCrackin, M. L., & Beusen, A. H. W. (2015). Losses of ammonia and nitrate from agriculture and their effect on nitrogen recovery in the European Union and the United States between 1900 and 2050. Journal of Environmental Quality, 44(2), 356–367. https://doi.org/10.2134/jeq2014.03.0102
Vanlauwe, B., Descheemaeker, K., Giller, K. E., Huising, J., Merckx, R., Nziguheba, G., Wendt, J., & Zingore, S. (2015). Integrated soil fertility management in sub-Saharan Africa: Unravelling local adaptation. SOIL, 1(1), 491–508. https://doi.org/10.5194/soil-1-491-2015
Wang, C., Shen, Y., Fang, X., Xiao, S., Liu, G., Wang, L., Gu, B., Zhou, F., Chen, D., Tian, H., Ciais, P., Zou, J., & Liu, S. (2024). Reducing soil nitrogen losses from fertilizer use in global maize and wheat production. Nature Geoscience, 17(10), 1008–1015. https://doi.org/10.1038/s41561-024-01542-x
Wang, Y., Li, C., Li, Y., Zhu, L., Liu, S., Yan, L., Feng, G., & Gao, Q. (2020). Agronomic and environmental benefits of Nutrient Expert on maize and rice in Northeast China. Environmental Science and Pollution Research, 27(22), 28053–28065. https://doi.org/10.1007/s11356-020-09153-w
Ward, M. H., Jones, R. R., Brender, J. D., de Kok, T. M., Weyer, P. J., Nolan, B. T., Villanueva, C. M., & van Breda, S. G. (2018). Drinking water nitrate and human health: an updated review. International Journal of Environmental Research and Public Health, 15(7), 1557. https://doi.org/10.3390/ijerph15071557
Withers, P. J. A., Neal, C., Jarvie, H. P., & Doody, D. G. (2014). Agriculture and eutrophication: where do we go from here? Sustainability, 6(9), Article 9. https://doi.org/10.3390/su6095853
You, L., Ros, G. H., Chen, Y., Shao, Q., Young, M. D., Zhang, F., & de Vries, W. (2023). Global mean nitrogen recovery efficiency in croplands can be enhanced by optimal nutrient, crop and soil management practices. Nature Communications, 14(1), 5747. https://doi.org/10.1038/s41467-023-41504-2
Zaehle, S., Ciais, P., Friend, A. D., & Prieur, V. (2011). Carbon benefits of anthropogenic reactive nitrogen offset by nitrous oxide emissions. Nature Geoscience, 4(9), 601–605. https://doi.org/10.1038/ngeo1207
Zhang, X., Fang, Q., Zhang, T., Ma, W., Velthof, G. L., Hou, Y., Oenema, O., & Zhang, F. (2020). Benefits and trade-offs of replacing synthetic fertilizers by animal manures in crop production in China: A meta-analysis. Global Change Biology, 26(2), 888–900. https://doi.org/10.1111/gcb.14826
Credits
Lead Fellow
Avery Driscoll
Contributors
Ruthie Burrows, Ph.D.
James Gerber, Ph.D.
Yusuf Jameel, Ph.D.
Daniel Jasper
Alex Sweeney
Eric Toensmeier
Internal Reviewers
Aiyana Bodi
Hannah Henkin
Ted Otte
Effectiveness
We relied on the 2019 IPCC emissions factors to calculate the emissions impacts of improved nutrient management. These are disaggregated by climate zone (“wet” vs. “dry”) and by fertilizer type (“organic” vs. “synthetic”). Nitrogen use reductions in wet climates, which include ~65% of the cropland area represented in this analysis (see Appendix for details), have the largest impact. In these areas, a 1 t reduction in nitrogen use reduces emissions by 8.7 t CO₂‑eq on average for synthetic fertilizers and by 5.0 t CO₂‑eq for organic fertilizers. Emissions savings are lower in dry climates, where a 1 t reduction in nitrogen use reduces emissions by 2.4 t CO₂‑eq for synthetic fertilizers and by 2.6 t CO₂‑eq for organic fertilizers. While these values reflect the median emissions reduction for each climate zone and fertilizer type, they are associated with large uncertainties because emissions are highly variable depending on climate, soil, and management conditions.
Based on our analysis of the adoption ceiling for each climate zone and fertilizer type (see Appendix), we estimated that a 1 t reduction in nitrogen use reduces emissions by 6.0 t CO₂‑eq at the global median (Table 1). This suggests that ~1.4% of the applied nitrogen is emitted as nitrous oxide at the global average, which is consistent with existing estimates (IPCC, 2019).
left_text_column_width
Table 1. Effectiveness at reducing emissions.
Unit: t CO₂‑eq /tN, 100-yr basis
| 25th percentile | 4.2 |
| median (50th percentile) | 6.0 |
| 75th percentile | 7.7 |
Left Text Column Width
Cost
Improving nutrient management typically reduces fertilizer costs while maintaining or increasing yields, resulting in a net financial benefit to the producer. Gu et al. (2023) found that a 21% reduction in global nitrogen use would be economically beneficial, notably after accounting for increased fertilizer use in places that do not currently have adequate access. Using data from their study, we evaluated the average cost of reduced nitrogen application considering the following nutrient management practices: increased use of high-efficiency fertilizers, organic fertilizers, and/or legumes; optimizing fertilizer rates; altering the timing and/or placement of fertilizer applications; and use of buffer zones. Implementation costs depend on the strategy used to improve nutrient management. For example, optimizing fertilizer rates requires soil testing and the ability to apply different fertilizer rates to different parts of a field. Improving timing can involve applying fertilizers at two different times during the season, increasing labor and equipment operation costs. Furthermore, planting legumes incurs seed purchase and planting costs.
Gu et al. (2023) estimated that annual reductions of 42 Mt of nitrogen were achievable globally using these practices, providing total fertilizer savings of US$37.2 billion and requiring implementation costs of US$15.9 billion, adjusted for inflation to 2023. A 1 t reduction in excess nitrogen application, therefore, was estimated to provide an average of US$507.80 of net cost savings, corresponding to a savings of US$85.21 per t CO₂‑eq of emissions reductions (Table 2).
left_text_column_width
Table 2. Cost per unit of climate impact, 100-yr basis.
Unit: 2023 US$/t CO₂‑eq
| mean | -85.21 |
Left Text Column Width
Methods and Supporting Data
Abatzoglou, J. T., Dobrowski, S. Z., Parks, S. A., & Hegewisch, K. C. (2018). TerraClimate, a high-resolution global dataset of monthly climate and climatic water balance from 1958–2015. Scientific Data, 5(1), 170191. https://doi.org/10.1038/sdata.2017.191
Adalibieke, W., Cui, X., Cai, H., You, L., & Zhou, F. (2023). Global crop-specific nitrogen fertilization dataset in 1961–2020. Scientific Data, 10(1), 617. https://doi.org/10.1038/s41597-023-02526-z
Gerber, J. S., Ray, D. K., Makowski, D., Butler, E. E., Mueller, N. D., West, P. C., Johnson, J. A., Polasky, S., Samberg, L. H., & Siebert, S. (2024). Global spatially explicit yield gap time trends reveal regions at risk of future crop yield stagnation. Nature Food, 5(2), 125–135. https://doi.org/10.1038/s43016-023-00913-8
IPCC, 2019: Summary for Policymakers. In: Climate Change and Land: an IPCC special report on climate change, desertification, land degradation, sustainable land management, food security, and greenhouse gas fluxes in terrestrial ecosystems [P.R. Shukla, J. Skea, E. Calvo Buendia, V. Masson-Delmotte, H.-O. Pörtner, D. C. Roberts, P. Zhai, R. Slade, S. Connors, R. van Diemen, M. Ferrat, E. Haughey, S. Luz, S. Neogi, M. Pathak, J. Petzold, J. Portugal Pereira, P. Vyas, E. Huntley, K. Kissick, M. Belkacemi, J. Malley, (eds.)].
Mehta, P., Siebert, S., Kummu, M., Deng, Q., Ali, T., Marston, L., Xie, W., & Davis, K. F. (2024). Half of twenty-first century global irrigation expansion has been in water-stressed regions. Nature Water, 2(3), 254–261. https://doi.org/10.1038/s44221-024-00206-9
Learning Curve
The improved nutrient management strategies considered for this solution are already well-established and widely deployed (Fixen, 2020). Large nitrogen excesses are relatively easy to mitigate through simple management changes with low implementation costs. As nitrogen use efficiency increases, further reductions may require increasingly complex mitigation practices and increasing marginal costs. Therefore, a learning curve was not quantified for this solution.
left_text_column_width
Speed of Action
Speed of action refers to how quickly a climate solution physically affects the atmosphere after it is deployed. This is different from speed of deployment, which is the pace at which solutions are adopted.
At Project Drawdown, we define the speed of action for each climate solution as emergency brake, gradual, or delayed.
Improve Nutrient Management is a GRADUAL climate solution. It has a steady, linear impact on the atmosphere. The cumulative effect over time builds as a straight line.
left_text_column_width
Caveats
Emissions reductions from improved nutrient management are permanent, though they may not be additional in all cases.
Permanence
As this solution reduces emissions rather than enhancing sequestration, permanence is not applicable.
Additionality
Additionality requires that the emissions benefits of the practice are attributable to climate-related incentives and would not have occurred in the absence of incentives (Michaelowa et al., 2019). If they are not contingent on external incentives, fertilizer use reductions implemented solely to maximize profits do not meet the threshold for additionality. However, fertilizer reductions may be additional if incentives are required to provide access to the technical knowledge and soil testing required to identify optimal rates. Other forms of nutrient management (e.g., applying nitrification inhibitors, using extended-release or organic fertilizers, or splitting applications between two time points) may involve additional costs, substantial practice change, and technical expertise. Thus, these practices are likely to be additional.
left_text_column_width
Current Adoption
Given that improved nutrient management takes a variety of forms and data on the adoption of individual practices are very limited, we leveraged several global datasets related to nitrogen use and yields to directly assess improvements in nitrogen use efficiency (see Appendix for details).
First, we calculated nitrogen use per t of crop produced using global maps of nitrogen fertilizer use (Adalibieke et al., 2023) and global maps of crop yields (Gerber et al., 2024) for 17 major crops (see Appendix). Next, we determined a target nitrogen use rate (t N/t crop) for each crop, corresponding to the 20th percentile of nitrogen use rates observed in croplands with yield gaps at or below the 20th percentile, meaning that actual yields were close to an attainable yield ceiling (Gerber et al., 2024). Areas with large yield gaps were excluded from the calculation of target nutrient use efficiency because insufficient nitrogen supply may be compromising yields (Mueller et al., 2012). Yield data were not available for a small number of crops; for these, we assumed reductions in nitrogen use to be proportional to those of other crops.
We considered croplands that had achieved the target rate and had yield gaps lower than the global median to have adopted the solution. We calculated the amount of excess nitrogen use avoided from these croplands as the difference in total nitrogen use under current fertilization rates relative to median fertilizer application rates. As of 2020, croplands that had achieved the adoption threshold for improved nutrient management avoided 10.45 Mt of nitrogen annually relative to the median nitrogen use rate (Table 3), equivalent to 11% of the adoption ceiling.
left_text_column_width
Table 3. Current (2020) adoption level.
Unit: tN/yr
| estimate | 10,450,000 |
Left Text Column Width
Adoption Trend
Global average nitrogen use efficiency increased from 47.7% to 54.6% between 2000 and 2020, a rate of approximately 0.43%/yr (Ludemann et al., 2024). This increase accelerated somewhat in the latter decade, from an average rate of 0.38%/yr to 0.53%/yr. Underlying this increase were increases in both the amount of nitrogen used and the amount of excess nitrogen. Total nitrogen additions increased by approximately 2.64 Mt/yr, with the amount of nitrogen used increasing more rapidly (1.99 Mt/yr) than the amount of excess nitrogen (0.65 Mt/yr) between 2000 and 2020 (Ludemann et al., 2024). Although nitrogen use increased between 2000 and 2020 as yields increased, the increase in nitrogen use efficiency suggests uptake of this solution.
left_text_column_width
Adoption Ceiling
We estimated the adoption ceiling of improved nutrient management to be 95.13 Mt avoided excess nitrogen use/year, not including current adoption (Table 4). This value reflects our estimate of the maximum potential reduction in nitrogen application while avoiding large yield losses and consists of the potential to avoid 62.25 Mt of synthetic nitrogen use and 32.88 Mt of manure and other organic nitrogen use, in addition to current adoption. In total, this is equivalent to an additional 68% reduction in global nitrogen use. The adoption ceiling was calculated as the difference between total nitrogen use at the current rate and total nitrogen use at the target rate (as described in Current Adoption), assuming no change in crop yields. For nitrogen applied to crops for which yield data were not available, the potential reduction in nitrogen use was assumed to be proportional to that of crops for which full data were available.
left_text_column_width
Table 4. Adoption ceiling.
Unit: tN/yr
| estimate | 105,580,000 |
Left Text Column Width
Achievable Adoption
We estimated that fertilizer use reductions of 69.85–91.06 Mt of nitrogen are achievable, reflecting current adoption plus nitrogen savings due to the achievement of nitrogen application rates equal to the median and 30th percentile of nitrogen application rates occurring in locations where yield gaps are small (Table 5).
This range is more ambitious than a comparable recent estimate by Gu et al. (2023), who found that reductions of approximately 42 Mt of nitrogen are avoidable via cost-effective implementation of similar practices. Differences in target nitrogen use efficiencies underlie differences between our estimates and those of Gu et al., whose findings correspond to an increase in global average cropland nitrogen use efficiency from 42% to 52%. Our estimates reflect higher target nitrogen use efficiencies. Nitrogen use efficiencies greater than 52% have been widely achieved through basic practice modification without compromising yields or requiring prohibitively expensive additional inputs. For instance, You et al. (2023) estimated that the global average nitrogen use efficiency could be increased to 78%. Similarly, cropland nitrogen use efficiency in the United States in 2020 was estimated to be 71%, and substantial opportunities for improved nitrogen use efficiency are still available within the United States (Ludemann et al., 2024), though Lu et al. (2019) and Swaney et al. (2018) report slightly lower estimates. These findings support our slightly more ambitious range of achievable nitrogen use reductions for this solution.
left_text_column_width
Table 5. Range of achievable adoption levels.
Unit: tN/yr
| Current Adoption | 10,450,000 |
| Achievable – Low | 69,850,000 |
| Achievable – High | 91,060,000 |
| Adoption Ceiling | 105,580,000 |
Left Text Column Width
We estimated that improved nutrient management has the potential to reduce emissions by 0.63 Gt CO₂‑eq/yr, with achievable emissions reductions of 0.42–0.54 Gt CO₂‑eq/yr (Table 6). This is equivalent to an additional 56–76% reduction in total nitrous oxide emissions from fertilizer use, based on the croplands represented in our analysis.
We estimated avoidable emissions by multiplying our estimates of adoption ceiling and achievable adoption by the relevant IPCC 2019 emissions factors, disaggregated by climate zone and fertilizer type. Under the adoption ceiling scenario, approximately 70% of emissions reductions occurred in wet climates, where emissions per t of applied fertilizer are higher. Reductions in synthetic fertilizer use, which are larger than reductions in organic fertilizer use, contributed about 76% of the potential avoidable emissions. We estimated that the current implementation of improved nutrient management was associated with 0.06 Gt CO₂‑eq/yr of avoided emissions.
Our estimates are slightly more optimistic but well within the range of the IPCC 2021 estimates, which found that improved nutrient management could reduce nitrous oxide emissions by 0.06–0.7 Gt CO₂‑eq/yr.
left_text_column_width
Table 6. Climate impact at different levels of adoption.
Unit: Gt CO₂-eq/yr, 100-yr basis
| Current Adoption | 0.06 |
| Achievable – Low | 0.42 |
| Achievable – High | 0.54 |
| Adoption Ceiling | 0.63 |
Left Text Column Width
Additional Benefits
Droughts
Balanced nutrient concentration contributes to long-term soil fertility and improved soil health by enhancing organic matter content, microbial diversity, and nutrient cycling (Antil & Raj, 2020; Selim, 2020). Healthy soil experiences reduced erosion and has higher water content, which increases its resilience to droughts and extreme heat (Rockström et al., 2017).
Income and Work
Better nutrient management reduces farmers' input costs and increases profitability (Rurinda et al., 2020; Wang et al., 2020). It is especially beneficial to smallholder farmers in sub-Saharan Africa, where site-specific nutrient management programs have demonstrated a significant increase in yield (Chivenge et al., 2021). A review of 61 studies across 11 countries showed that site-specific nutrient management resulted in an average increase in yield by 12% and increased farmer’s’ income by 15% while improving nitrogen use efficiency (Chivenge et al., 2021).
Food Security
While excessive nutrients cause environmental problems in some parts of the world, insufficient nutrients are a significant problem in others, resulting in lower agricultural yields (Foley et al., 2011). Targeted, site-specific, efficient use of fertilizers can improve crop productivity (Mueller et al., 2012; Vanlauwe et al., 2015), improving food security globally.
Health
Domingo et al. (2021) estimated about 16,000 premature deaths annually in the United States are due to air pollution from the food sector and found that more than 3,500 premature deaths per year could be avoided through reduced use of ammonia fertilizer, a secondary particulate matter precursor. Better agriculture practices overall can reduce particulate matter-related premature deaths from the agriculture sector by 50% (Domingo et al., 2021). Nitrogen oxides from fertilized croplands are another source of agriculture-based air pollution, and improved management can lead to decreased respiratory and cardiovascular disease (Almarez et al., 2018; Sobota et al., 2015).
Nitrate contamination of drinking water due to excessive runoff from agriculture fields has been linked to several health issues, including blood disorders and cancer (Patel et al., 2022; Ward et al., 2018). Reducing nutrient runoff through better management is critical to minimize these risks (Ward et al., 2018).
Nature Protection
Nutrient runoff from agricultural systems is a major driver of water pollution globally, leading to eutrophication and hypoxic zones in aquatic ecosystems (Bijay-Singh & Craswell, 2021). Nitrogen pollution also harms terrestrial biodiversity through soil acidification and increases productivity of fast-growing species, including invasives, which can outcompete native species (Porter et al., 2013). Improved nutrient management is necessary to reduce nitrogen and phosphorus loads to water bodies (Withers et al., 2014; van Grinsven et al., 2019) and terrestrial ecosystems (Porter et al., 2013). These practices have been effective in reducing harmful algal blooms and preserving biodiversity in sensitive water systems (Scavia et al., 2014).
left_text_column_width
Risks
Although substantial reductions in nitrogen use can be achieved in many places with no or minimal impacts on yields, reducing nitrogen application by too much can lead to yield declines, which in turn can boost demand for cropland, causing GHG-producing land use change. Reductions in only excess nitrogen application will prevent substantial yield losses.
left_text_column_width
Some nutrient management practices are associated with additional emissions. For example, nitrification inhibitors reduce direct nitrous oxide emissions (Qiao et al., 2014) but can increase ammonia volatilization and subsequent indirect nitrous oxide emissions (Lam et al., 2016). Additionally, in wet climates, nitrous oxide emissions may be reduced through the use of manure instead of synthetic fertilizers (Hergoualc’h et al., 2019), though impacts vary across sites and studies (Zhang et al., 2020). Increased demand for manure could increase livestock production, which has high associated GHG emissions. Emissions also arise from transporting manure to the site of use (Qin et al., 2021).
Although nitrous oxide has a strong direct climate-warming effect, fertilizer use can cool the climate through emissions of other reactive nitrogen-containing compounds (Gong et al., 2024). First, aerosols from fertilizers scatter heat from the sun and cool the climate (Shindell et al., 2009; Gong et al., 2024). Moreover, other reactive nitrogen compounds from fertilizers shorten the lifespan of methane in the atmosphere, reducing its warming effects (Pinder et al., 2012). Finally, nitrogen fertilizers that leave farm fields through volatilization or runoff are ultimately deposited elsewhere, enhancing photosynthesis and storing more carbon in plants and soils (Zaehle et al., 2011; Gong et al., 2024). Improved nutrient management would reduce these cooling effects.
left_text_column_width
Interactions with Other Solutions
Reinforcing
Improved nutrient management will reduce emissions from the production phase of biomass crops, increasing their benefit.
left_text_column_width
Competing
Improved nutrient management will reduce the GHG production associated with each calorie and, therefore, the impacts of the Improve Diets and Reduce Food Loss and Waste solutions will be reduced
left_text_column_width
Each of these solutions could decrease emissions associated with fertilizer production, but improved nutrient management will reduce total demand for fertilizers.
left_text_column_width
Dashboard
Solution Basics
t avoided excess nitrogen application
t CO₂-eq (100-yr)/unit
04.26
units/yr
Current 1.045×10⁷
06.985×10⁷9.106×10⁷
Achievable (Low to High)
Climate Impact
Gt CO₂-eq (100-yr)/yr
Current 0.06
0.420.54
US$ per t CO₂-eq
-85
Gradual
N₂O
t CO2-eq/ha
The Problem — Emissions of Nitrous Oxide Coming from Over-fertilized Soils
The world’s agricultural lands can emit high levels of nitrous oxide (N2O), the third most powerful greenhouse gas. These emissions stem from overusing nitrogen-based fertilizers, especially in regions in China, India, Western Europe, and central North America (in red). While crops absorb some of the nitrogen fertilizer we apply, much of what remains is lost to the atmosphere as nitrous oxide pollution or to local waterways as nitrate pollution. Using fertilizers more wisely can dramatically reduce greenhouse gas emissions and water pollution while maintaining high levels of crop production.
Project Drawdown
Maps Introduction
Improved nutrient management will have the greatest emissions reduction if it is targeted at areas with the largest excesses of nitrogen fertilizer use. In 2020, China, India, and the United States alone accounted for 52% of global excess nitrogen application (Ludemann et al., 2024). Improved nutrient management could be particularly beneficial in China and India, where nutrient use efficiency is currently lower than average (Ludemann et al., 2024). You et al. (2023) also found potential for large increases in nitrogen use efficiency in parts of China, India, Australia, Northern Europe, the United States Midwest, Mexico, and Brazil under standard best management practices. Gu et al. (2024) found that nitrogen input reductions are economically feasible in most of Southern Asia, Northern and Western Europe, parts of the Middle East, North America, and Oceania.
In addition to regional patterns in the adoption ceiling, greater nitrous oxide emissions reductions are possible in wet climates or on irrigated croplands compared to dry climates. Nitrous oxide emissions tend to peak when nitrogen availability is high and soil moisture is in the ~70–90% range (Betterbach-Bahl et al., 2013; Elberling et al., 2023; Hao et al., 2025; Lawrence et al., 2021), though untangling the drivers of nitrous oxide emissions is complex (Lawrence et al., 2021). Water management to avoid prolonged periods of soil moisture in this range is an important complement to nutrient management in wet climates and on irrigated croplands (Deng et al., 2018).
Importantly, improved nutrient management, as defined here, is not appropriate for implementation in areas with nitrogen deficits or negligible nitrogen surpluses, including much of Africa. In these areas, crop yields are constrained by nitrogen availability, and an increase in nutrient inputs may be needed to achieve target yields. Additionally, nutrient management in paddy (flooded) rice systems is not included in this solution but rather in the Improve Rice Production solution.
Action Word
Improve
Solution Title
Nutrient Management
Classification
Highly Recommended
Lawmakers and Policymakers
- Focus policies and regulations on the four nutrient management principles – right rate, type, time, and place.
- Create dynamic nutrient management policies that account for varying practices, environments, drainage, historical land use, and other factors that may require adjusting nutrient regulations.
- Offer financial assistance responsive to local soil and weather conditions, such as grants and subsidies, insurance programs, and tax breaks, to encourage farmers to comply with regulations.
- Mandate insurance schemes that allow farmers to reduce fertilizer use.
- Mandate nutrient budgets or ceilings that are responsive to local yield, weather, and soil conditions.
- Require farmers to formulate nutrient management and fertilizer plans.
- Mandate efficiency rates for manure-spreading equipment.
- Ensure access to and require soil tests to inform fertilizer application.
- Invest in research on alternative organic nutrient sources.
- Create and expand education programs and extension services that highlight the problems that arise from the overuse of fertilizers, benefits of soil management such as cost-savings, and penalties for non-compliance
- Create ongoing support groups among farmers.
Further information:
- Toolbox. Global Partnership on Nutrient Management
- Government relations and public policy job function action guide. Project Drawdown (2022)
- Legal job function action guide. Project Drawdown (2022)
- Nutrient management. U.S. Department of Agriculture
- Nutrient management. Watershed Agricultural Council
Practitioners
- Use the four nutrient management principles – right rate, type, time, and place – to guide fertilizer application.
- Utilize or advocate for financial assistance and tax breaks for farmers to improve nutrient management techniques.
- Create and adhere to nutrient and fertilizer management plans.
- Conduct soil tests to inform fertilizer application.
- Use winter cover crops, crop rotations, residue retention, and split applications for fertilizer.
- Improve the efficiency of, and regularly calibrate, manure-spreading equipment.
- Leverage agroecological practices such as nutrient recycling and biological nitrogen fixation.
- Join, create, or participate in partnerships or certification programs dedicated to improving nutrient management.
- Take advantage of education programs, support groups, and extension services focused on improved nutrient management.
Further information:
- Toolbox. Global Partnership on Nutrient Management
- Nutrient management. U.S. Department of Agriculture
- Nutrient management. Watershed Agricultural Council
Business Leaders
- Provide incentives for farmers in primary sourcing regions to adopt best management practices for reducing nitrogen application.
- Invest in companies that use improved nutrient management techniques or produce equipment or research for fertilizer application and testing.
- Advocate to policymakers for improved nutrient management techniques, incentives, and regulations.
- Join, create, or participate in partnerships or certification programs dedicated to improving nutrient management practices.
- Promote products produced with improved nutrient management techniques and educate consumers about the importance of the practice.
- Create or support education programs and extension services that highlight the problems that arise from the overuse of fertilizers, benefits of soil management such as cost-savings, and penalties for non-compliance.
- Create ongoing support groups among farmers.
Further information:
- Toolbox. Global Partnership on Nutrient Management
- Climate solutions at work. Project Drawdown (2021)
- Drawdown-aligned business framework. Project Drawdown (2021)
- Nutrient management. U.S. Department of Agriculture
- Nutrient management. Watershed Agricultural Council
Nonprofit Leaders
- Start model farms to demonstrate improved nutrient management techniques, conduct experiments, and educate local farmers.
- Conduct and share research on improved nutrient management techniques, alternative organic fertilizers, or local policy options.
- Advocate to policymakers for improved nutrient management techniques, incentives, and regulations.
- Engage with businesses to encourage corporate responsibility and/or monitor water quality and soil health.
- Join, create, or participate in partnerships or certification programs dedicated to improving nutrient management practices.
- Create or support education programs and extension services that highlight the problems that arise from the overuse of fertilizers, benefits of soil management such as cost-savings, and penalties for non-compliance.
- Create ongoing support groups among farmers.
Further information:
- Toolbox. Global Partnership on Nutrient Management
- Nutrient management. U.S. Department of Agriculture
- Nutrient management. Watershed Agricultural Council
Investors
- Invest in companies developing technologies that support improved nutrient management such as precision fertilizer applicators, alternative fertilizers, soil management equipment, and software.
- Invest in ETFs and ESG funds that hold companies committed to improved nutrient management techniques in their portfolios.
- Encourage companies in your investment portfolio to adopt improved nutrient management.
- Provide access to capital at reduced rates for farmers adhering to improved nutrient management.
Further information:
- Toolbox. Global Partnership on Nutrient Management
- Nutrient management. U.S. Department of Agriculture
- Nutrient management. Watershed Agricultural Council
Philanthropists and International Aid Agencies
- Provide financing for farmers to improve nutrient management.
- Start model farms to demonstrate nutrient management techniques, conduct experiments, and educate local farmers.
- Conduct and share research on improved nutrient management, alternative organic fertilizers, or local policy options.
- Advocate to policymakers for improved nutrient management techniques, incentives, and regulations.
- Engage with businesses to encourage corporate responsibility and/or monitor water quality and soil health.
- Join, create, or participate in partnerships or certification programs dedicated to improving nutrient management practices.
- Create or support education programs and extension services that highlight the problems that arise from the overuse of fertilizers, benefits of soil management such as cost-savings, and penalties for non-compliance.
- Create ongoing support groups among farmers.
Further information:
- Toolbox. Global Partnership on Nutrient Management
- Nutrient management. U.S. Department of Agriculture
- Nutrient management. Watershed Agricultural Council
Thought Leaders
- Start model farms to demonstrate techniques, conduct experiments, and educate local farmers.
- Conduct and share research on improved nutrient management, alternative organic fertilizers, or local policy options.
- Advocate to policymakers for improved nutrient management techniques, incentives, and regulations.
- Engage with businesses to encourage corporate responsibility and/or monitor water quality and soil health.
- Join, create, or participate in partnerships dedicated to improving nutrient management practices.
- Create or support education programs and extension services that highlight the problems that arise from the overuse of fertilizers, benefits of soil management such as cost-savings, and penalties for non-compliance.
- Create ongoing support groups among farmers.
Further information:
- Toolbox. Global Partnership on Nutrient Management
- Nutrient management. U.S. Department of Agriculture
- Nutrient management. Watershed Agricultural Council
Technologists and Researchers
- Improve technology and cost-effectiveness of precision fertilizer application, slow-release fertilizer, alternative organic fertilizers, nutrient recycling, and monitoring equipment.
- Create tracking and monitoring software to support farmers' decision-making.
- Research and develop the application of AI and robotics for precise fertilizer application.
- Improve data and analytics to monitor soil and water quality, assist farmers, support policymaking, and assess the impacts of policies.
- Develop education and training applications to promote improved nutrient management and provide real-time feedback.
Further information:
- Toolbox. Global Partnership on Nutrient Management
- Nutrient management. U.S. Department of Agriculture
- Nutrient management. Watershed Agricultural Council
Communities, Households, and Individuals
- Create or join community-supported agriculture programs that source from farmers who used improved nutrient management practices.
- Conduct soil tests on your lawn and garden and reduce fertilizer use if you are over-fertilizing.
- Volunteer for soil and water quality monitoring and restoration projects.
- Start model farms to demonstrate techniques, conduct experiments, and educate local farmers.
- Advocate to policymakers for improved nutrient management techniques, incentives, and regulations.
- Engage with businesses to encourage corporate responsibility and/or monitor water quality and soil health.
- Join, create, or participate in partnerships dedicated to improving nutrient management.
- Create or support education programs and extension services that highlight the problems that arise from the overuse of fertilizers, benefits of soil management such as cost-savings, and penalties for non-compliance.
- Create ongoing support groups among farmers.
Further information:
- Toolbox. Global Partnership on Nutrient Management
- Nutrient management. U.S. Department of Agriculture
- Nutrient management. Watershed Agricultural Council
Sources
- Which factors influence farmers’ intentions to adopt nutrient management planning?, Daxini, A., et al. (2018)
- Quantification of environmental-economic trade-offs in nutrient management policies, Kaye-Blake, et al. (2019)
- Regulating farmer nutrient management: A three-state case study on the Delmarva Peninsula, Perez, M. R. (2015)
- Promise and performance of agricultural nutrient management policy: lessons from the Baltic Sea, Thorsøe, M. H., et al. (2021)
- Exploring nutrient management options to increase nitrogen and phosphorus use efficiencies in food production of China, Wang, M., et al. (2018)
- Quantifying nutrient budgets for sustainable nutrient management, Zhang, X., et al. (2020)
Evidence Base
There is high scientific consensus that reducing nitrogen surpluses through improved nutrient management reduces nitrous oxide emissions from croplands.
Nutrient additions to croplands produce an estimated 0.9 Gt CO₂‑eq/yr (range 0.7–1.1 Gt CO₂‑eq/yr ) of direct nitrous oxide emissions from fields, plus approximately 0.3 Gt CO₂‑eq/yr of emissions from fertilizers that runoff into waterways or erode (Tian et al., 2020). Nitrous oxide emissions from croplands are directly linked to the amount of nitrogen applied. Furthermore, the amount of nitrous oxide emitted per unit of applied nitrogen is well quantified for a range of different nitrogen sources and field conditions (Reay et al., 2012; Shcherbak et al., 2014; Gerber et al., 2016; Intergovernmental Panel on Climate Change [IPCC], 2019; Hergoualc’h et al., 2021). Tools to improve nutrient management have been extensively studied, and practices that improve nitrogen use efficiency through right rate, time, place, and type principles have been implemented in some places for several decades (Fixen, 2020; Ludemann et al., 2024).
Recently, Gao & Cabrera Serrenho (2023) estimated that fertilizer-related emissions could be reduced up to 80% by 2050 relative to current levels using a combination of nutrient management and new fertilizer production methods. You et al. (2023) found that adopting improved nutrient management practices would increase nitrogen use efficiency from a global average of 48% to 78%, substantially reducing excess nitrogen. Wang et al. (2024) estimated that the use of enhanced-efficiency fertilizers could reduce nitrogen losses to the environment 70–75% for maize and wheat systems. Chivenge et al. (2021) found comparable results in smallholder systems in Africa and Asia.
The results presented in this document were produced through analysis of global datasets. We recognize that geographic biases can influence the development of global datasets and hope this work inspires research and data sharing on this topic in underrepresented regions.
left_text_column_width
Appendix
In this analysis, we calculated the potential for reducing crop nitrogen inputs and associated nitrous oxide emissions by integrating spatially explicit, crop-specific data on nitrogen inputs, crop yields, attainable yields, irrigated extent, and climate. Broadly, we calculated a “target” yield-scaled nitrogen input rate based on pixels with low yield gaps and calculated the difference between nitrous oxide emissions under the current rate and under the hypothetical target emissions rate, using nitrous oxide emissions factors disaggregated by fertilizer type and climate.
Emissions Factors
We used Tier 1 emissions factors from the IPCC 2019 Refinement to the 2006 Guidelines for National Greenhouse Gas Inventories, including direct emissions factors as well as indirect emissions from volatilization and leaching pathways. Direct emissions factors represent the proportion of applied nitrogen emitted as nitrous oxide, while we calculated volatilization and leaching emissions factors by multiplying the proportion of applied nitrogen lost through these pathways by the proportion of volatilized or leached nitrogen ultimately emitted as nitrous oxide. Including both direct and indirect emissions, organic and synthetic fertilizers emit 4.97 kg CO₂‑eq/kg nitrogen and 8.66 kg CO₂‑eq/kg nitrogen, respectively, in wet climates, and 2.59 kg CO₂‑eq/kg nitrogen and 2.38 kg CO₂‑eq/kg nitrogen in dry climates. We included uncertainty bounds (2.5th and 97.5th percentiles) for all emissions factors.
We classified each pixel as “wet” or “dry” using an aridity index (AI) threshold of 0.65, calculated as the ratio of annual precipitation to potential evapotranspiration (PET) from TerraClimate data (1991–2020), based on a threshold of 0.65. For pixels in dry climates that contained irrigation, we took the weighted average of wet and dry emissions factors based on the fraction of cropland that was irrigated (Mehta et al., 2024). We excluded irrigated rice from this analysis due to large differences in nitrous oxide dynamics in flooded rice systems.
Current, Target, and Avoidable Nitrogen Inputs and Emissions
Using highly disaggregated data on nitrogen inputs from Adalibieke et al. (2024) for 21 crop groups (Table S1), we calculated total crop-specific inputs of synthetic and organic nitrogen. We then averaged over 2016–2020 to reduce the influence of interannual variability in factors like fertilizer prices. These values are subsequently referred to as “current” nitrogen inputs. We calculated nitrous oxide emissions under current nitrogen inputs as the sum of the products of nitrogen inputs and the climatically relevant emissions factors for each fertilizer type.
Next, we calculated target nitrogen application rates in terms of kg nitrogen per ton of crop yield using data on actual and attainable yields for 17 crops from Gerber et al., 2024 (Table S1). For each crop, we first identified pixels in which the ratio of actual to attainable yields was above the 80th percentile globally. The target nitrogen application rate was then calculated as the 20th percentile of nitrogen application rates across low-yield-gap pixels. Finally, we calculated total target nitrogen inputs as the product of actual yields and target nitrogen input rates. We calculated hypothetical nitrous oxide emissions from target nitrogen inputs as the product of nitrogen inputs and the climatically relevant emissions factor for each fertilizer type.
The difference between current and target nitrogen inputs represents the amount by which nitrogen inputs could hypothetically be reduced without compromising crop productivity (i.e., “avoidable” nitrogen inputs). We calculated avoidable nitrous oxide emissions as the difference between nitrous oxide emissions with current nitrogen inputs and those with target nitrogen inputs. For crops for which no yield or attainable yield data were available, we applied the average percent reduction in nitrogen inputs under the target scenario from available crops to the nitrogen input data for missing crops to calculate the avoidable nitrogen inputs and emissions.
This simple and empirically driven method aimed to identify realistically low but nutritionally adequate nitrogen application rates by including only pixels with low yield gaps, which are unlikely to be substantially nutrient-constrained. We did not control for other factors affecting nitrogen availability, such as historical nutrient application rates or depletion, rotation with nitrogen fixing crops, or tillage and residue retention practices.
left_text_column_width
Table S1. Crops represented by the source data on nitrogen inputs (Adalibieke et al., 2024) and estimated and attainable yields (Gerber et al., 2024). Crop groups included consistently in both datasets are marked as “both,” and crop groups represented in the nitrogen input data but not in the yield datasets are marked as “nitrogen only.”
| Crop | Dataset(s) |
|---|---|
| Barley | Both |
| Cassava | Both |
| Cotton | Both |
| Maize | Both |
| Millet | Both |
| Oil Palm | Both |
| Potato | Both |
| Rice | Both |
| Rye | Both |
| Rapeseed | Both |
| Sorghum | Both |
| Soybean | Both |
| Sugarbeet | Both |
| Sugarcane | Both |
| Sunflower | Both |
| Sweet Potato | Both |
| Wheat | Both |
| Groundnut | Nitrogen only |
| Fruits | Nitrogen only |
| Vegetables | Nitrogen only |
| Other | Nitrogen only |
Left Text Column Width
Updated Date
Improve Forest Management
Mode
Cut Emissions
Cluster
Protect & Manage Ecosystems
Image
Image

Coming Soon
On
Action Word
Improve
Solution Title
Forest Management
Classification
Highly Recommended
Updated Date
Protect Seafloors
Mode
Cut Emissions
Cluster
Protect & Manage Ecosystems
Image
Image
Coming Soon
Off
Summary
Protect Seafloors is the long-term protection of the seafloor from degradation, which helps preserve existing sediment carbon stocks and avoid CO₂ emissions. Advantages of seafloor protection include the conservation of biodiversity and marine ecosystems, potentially low costs, and the ability for immediate implementation. Disadvantages include uncertainties in the effectiveness of legal protection at preventing degradation and in the amount of CO₂ emissions avoided, as well as the risk of displacement of degradation to non-protected areas and/or an increase in other types of degradation. Given these limitations, we conclude that Seafloor Protection is a climate solution to “Keep Watching” until more research can clearly show the carbon benefits of protection.
Overview
What is our assessment?
Based on our analysis, seafloor protection could avoid some CO₂ emissions while preserving critical marine ecosystems from degradation. However, the effectiveness of protection and the magnitude of avoided CO₂ emissions associated with protection are understudied and currently unclear. Therefore, we will “Keep Watching” this potential climate solution.
| Plausible | Could it work? | Yes |
|---|---|---|
| Ready | Is it ready? | No |
| Evidence | Are there data to evaluate it? | Limited |
| Effective | Does it consistently work? | No |
| Impact | Is it big enough to matter? | Yes |
| Risk | Is it risky or harmful? | No |
| Cost | Is it cheap? | Yes |
What is it?
Protect Seafloors aims to reduce human impacts that can degrade sediment carbon stocks and increase CO₂ emissions. Protection is conferred through legal mechanisms, such as Marine Protected Areas (MPAs), which are managed with the primary goal of conserving nature. The seafloor stores over 2,300 Gt of carbon (roughly 8,400 Gt CO₂‑eq) in the top one meter of sediment. This marine carbon can be stable and remain sequestered for millennia. However, degradation of the seafloor from a range of human activities can disturb bottom sediments, resuspending the carbon and increasing its microbial conversion into CO₂. Currently, degradation of the seafloor primarily results from fishing practices, such as trawling and dredging, which are estimated to occur across 1.3% of the global ocean. Additional sources of degradation include undersea mining, infrastructure development (for offshore wind farms, oil, and gas), and laying telecommunications cables. Estimates of seafloor degradation are highly uncertain due to data limitations and the unpredictable nature of how these activities may expand in the future.
Does it work?
More evidence is needed to confirm whether legal seafloor protection is effective at reducing degradation and the extent to which degradation results in increased CO₂ emissions. While ~8% of the seafloor is currently protected through MPAs, there is mixed evidence that legal protection reduces degradation and CO₂ emissions. For instance, in a review of 49 studies examining the impacts of bottom trawling and dredging on sediment organic carbon stocks, most (61%) showed no change, while nearly a third (29%) showed carbon loss. More recent work suggests that trawling intensity might drive these mixed results, with more heavily trawled areas showing clear reductions in sediment organic carbon. Additionally, the few existing global estimates of CO₂ emissions from trawling and dredging range from 0.03 to 0.58 Gt CO₂/yr, highlighting the need for further research. The effectiveness of MPAs at preventing seafloor degradation is also mixed. In strictly protected areas with enforcement of no-take policies that prevent bottom fishing, MPAs could help minimize degradation and retain seafloor carbon. However, implementation can be challenging, as over half of existing MPAs generally allow high-impact activities. For instance, trawling and dredging occur more frequently in MPAs than in non-protected areas in the territorial waters of Europe.
Why are we excited?
Advantages of seafloor protection include its potential low cost and its ability to conserve often understudied biodiversity and ecosystems. Human activities, such as trawling and dredging, impact marine organisms on the seafloor, and ecosystem recovery can take years to occur. In the case of undersea mining, ecosystems may never fully recover. Increases in CO₂ emissions along the seafloor from degradation can also enhance local acidification and reduce the ocean's buffering capacity, both of which can affect marine organisms and the carbon sequestration capacity of seawater. Protection can also increase fisheries yields in neighboring waters and reduce other negative impacts of seafloor disturbances. While costs are somewhat uncertain, MPA expenses have been estimated to be an order of magnitude less than the often unseen ecosystem service benefits gained with protection, suggesting MPA expansion could provide cost savings.
Why are we concerned?
Disadvantages of seafloor protection include uncertainties surrounding the effectiveness of preventing degradation and avoiding CO₂ emissions, as well as the potential increased risk of disturbance to other ocean areas. The amount and fate of CO₂ generated due to the degradation of seafloor carbon is complex and understudied. It can take months or even centuries for CO₂ produced at depth to reach the sea surface and atmosphere. Current estimates of CO₂ emissions due to dredging and trawling are widely debated and highly variable due to differing methods and assumptions. Large amounts of organic carbon will inevitably re-settle after seafloor disturbances, with no impact on CO₂, but estimates of just how much remain uncertain. The risk of protection-induced leakage, where a reduction in disturbances, such as trawling and dredging in MPAs, leads to increased fishing effort in other ocean areas, is also potentially high.
Amoroso, R. O., Pitcher, C. R., Rijnsdorp, A. D., McConnaughey, R. A., Parma, A. M., Suuronen, P., ... & Jennings, S. (2018). Bottom trawl fishing footprints on the world’s continental shelves. Proceedings of the National Academy of Sciences, 115(43), E10275-E10282. Link to source: https://doi.org/10.1073/pnas.1802379115
Atwood, T. B., Witt, A., Mayorga, J., Hammill, E., & Sala, E. (2020). Global patterns in marine sediment carbon stocks. Frontiers in Marine Science, 7, 165. Link to source: https://doi.org/10.3389/fmars.2020.00165
Atwood, T.B., Sala, E., Mayorga, J. et al. Reply to: Quantifying the carbon benefits of ending bottom trawling. Nature, 617, E3–E5 (2023). Link to source: https://doi.org/10.1038/s41586-023-06015-6
Atwood, T. B., Romanou, A., DeVries, T., Lerner, P. E., Mayorga, J. S., Bradley, D., ... & Sala, E. (2024). Atmospheric CO2 emissions and ocean acidification from bottom-trawling. Frontiers in Marine Science, 10, 1125137. Link to source: https://doi.org/10.3389/fmars.2023.1125137
Balmford, A., Gravestock, P., Hockley, N., McClean, C.J. and Roberts, C.M. (2004). The worldwide costs of marine protected areas. Proceedings of the National Academy of Sciences, 101(26), pp.9694-9697. Link to source: https://doi.org/10.1073/pnas.0403239101
Burdige, D. J. (2005). Burial of terrestrial organic matter in marine sediments: a re-assessment. Global Biogeochem. Cycles, 19:GB4011. Link to source: https://doi.org/10.1029/2004GB002368
Burdige, D. J. (2007). Preservation of organic matter in marine sediments: controls, mechanisms, and an imbalance in sediment organic carbon budgets? Chem. Rev., 107, 467–485. Link to source: https://doi.org/10.1021/cr050347q
Carr, M. E., Friedrichs, M. A. M., Schmeltz, M., Aita, M. N., Antoine, D., Arrigo, K., et al. (2006). A comparison of global estimates of marine primary production from ocean color. Deep-sea Res. II, Top. Stud. Oceanogr., 53, 741–770. Link to source: https://doi.org/10.1016/j.dsr2.2006.01.028
Clare, M. A., Lichtschlag, A., Paradis, S., & Barlow, N. L. M. (2023). Assessing the impact of the global subsea telecommunications network on sedimentary organic carbon stocks. Nature Communications, 14(1), 2080. Link to source: https://doi.org/10.1038/s41467-023-37854-6
Dureuil, M., Boerder, K., Burnett, K. A., Froese, R., & Worm, B. (2018). Elevated trawling inside protected areas undermines conservation outcomes in a global fishing hot spot. Science, 362(6421), 1403-1407. Link to source: https://doi.org/10.1126/science.aau0561
Epstein, G., Middelburg, J. J., Hawkins, J. P., Norris, C. R., & Roberts, C. M. (2022). The impact of mobile demersal fishing on carbon storage in seabed sediments. Global Change Biology, 28(9), 2875-2894. Link to source: https://doi.org/10.1111/gcb.16105
Estes, E. R., Pockalny, R., D’Hondt, S., Inagaki, F., Morono, Y., Murray, R. W., ... & Hansel, C. M. (2019). Persistent organic matter in oxic subseafloor sediment. Nature Geoscience, 12(2), 126-131. Link to source: https://doi.org/10.1038/s41561-018-0291-5
Kandasamy, S., & Nagender Nath, B. (2016). Perspectives on the terrestrial organic matter transport and burial along the land-deep sea continuum: caveats in our understanding of biogeochemical processes and future needs. Frontiers in Marine Science, 3, 259. Link to source: https://doi.org/10.3389/fmars.2016.00259
Muller-Karger, F. E., Varela, R., Thunell, R., Luerssen, R., Hu, C., and Walsh, J. J. (2005). The importance of continental margins in the global carbon cycle. Geophys. Res. Lett., 32:L01602. Link to source: https://doi.org/10.1029/2004gl021346
Putuhena, H., White, D., Gourvenec, S., & Sturt, F. (2023). Finding space for offshore wind to support net zero: A methodology to assess spatial constraints and future scenarios, illustrated by a UK case study. Renewable and Sustainable Energy Reviews, 182, 113358. Link to source: https://doi.org/10.1016/j.rser.2023.113358
Sala, E., Mayorga, J., Bradley, D., Cabral, R. B., Atwood, T. B., Auber, A., ... & Lubchenco, J. (2021). Protecting the global ocean for biodiversity, food and climate. Nature, 592(7854), 397-402. Link to source: https://doi.org/10.1038/s41586-021-03371-z
Sala, E., & Giakoumi, S. (2018). No-take marine reserves are the most effective protected areas in the ocean. ICES Journal of Marine Science, 75(3), 1166-1168. Link to source: https://doi.org/10.1093/icesjms/fsx059
Siegel, D. A., DeVries, T., Doney, S. C., & Bell, T. (2021). Assessing the sequestration time scales of some ocean-based carbon dioxide reduction strategies. Environmental Research Letters, 16(10), 104003. Link to source: https://doi.org/10.1088/1748-9326/ac0be0
(TMC, 2022) The Metals Company. (2022). How much seafloor will the nodule collection industry impact? Retrieved April 17, 2025, from Link to source: https://metals.co/how-much-seafloor-will-the-nodule-collection-industry-impact/
UNEP-WCMC and IUCN (2024). Protected Planet Report 2024. UNEP-WCMC and IUCN: Cambridge, United Kingdom; Gland, Switzerland. Link to source: https://digitalreport.protectedplanet.net/
Zhang, W., Porz, L., Yilmaz, R., Wallmann, K., Spiegel, T., Neumann, A., ... & Schrum, C. (2024). Long-term carbon storage in shelf sea sediments reduced by intensive bottom trawling. Nature Geoscience, 1-9. Link to source: https://doi.org/10.1038/s41561-024-01581-4
van de Velde, S. J., Hylén, A., & Meysman, F. J. (2025). Ocean alkalinity destruction by anthropogenic seafloor disturbances generates a hidden CO2 emission. Science Advances, 11(13), Link to source: https://doi.org/10.1126/sciadv.adp9112
Watson, S. C., Somerfield, P. J., Lemasson, A. J., Knights, A. M., Edwards-Jones, A., Nunes, J., ... & Beaumont, N. J. (2024). The global impact of offshore wind farms on ecosystem services. Ocean & Coastal Management, 249, 107023. Link to source: https://doi.org/10.1016/j.ocecoaman.2024.107023
Credits
Lead Fellow
- Christina Richardson, Ph.D.
Internal Reviewer
- Christina Swanson, Ph.D.
Action Word
Protect
Solution Title
Seafloors
Classification
Keep Watching
Updated Date
Protect Coastal Wetlands
Mode
Cut Emissions
Cluster
Protect & Manage Ecosystems
Image
Image
Coming Soon
On
Summary
Coastal wetland protection is the long-term protection of mangrove, salt marsh, and seagrass ecosystems from degradation by human activities. This solution focuses on legal mechanisms of coastal wetland protection, including the establishment of Protected Areas (PAs) and Marine Protected Areas (MPAs), which are managed with the primary goal of conserving nature. These legal protections reduce a range of human impacts, helping to preserve existing carbon stocks and avoid CO₂ emissions.
Overview
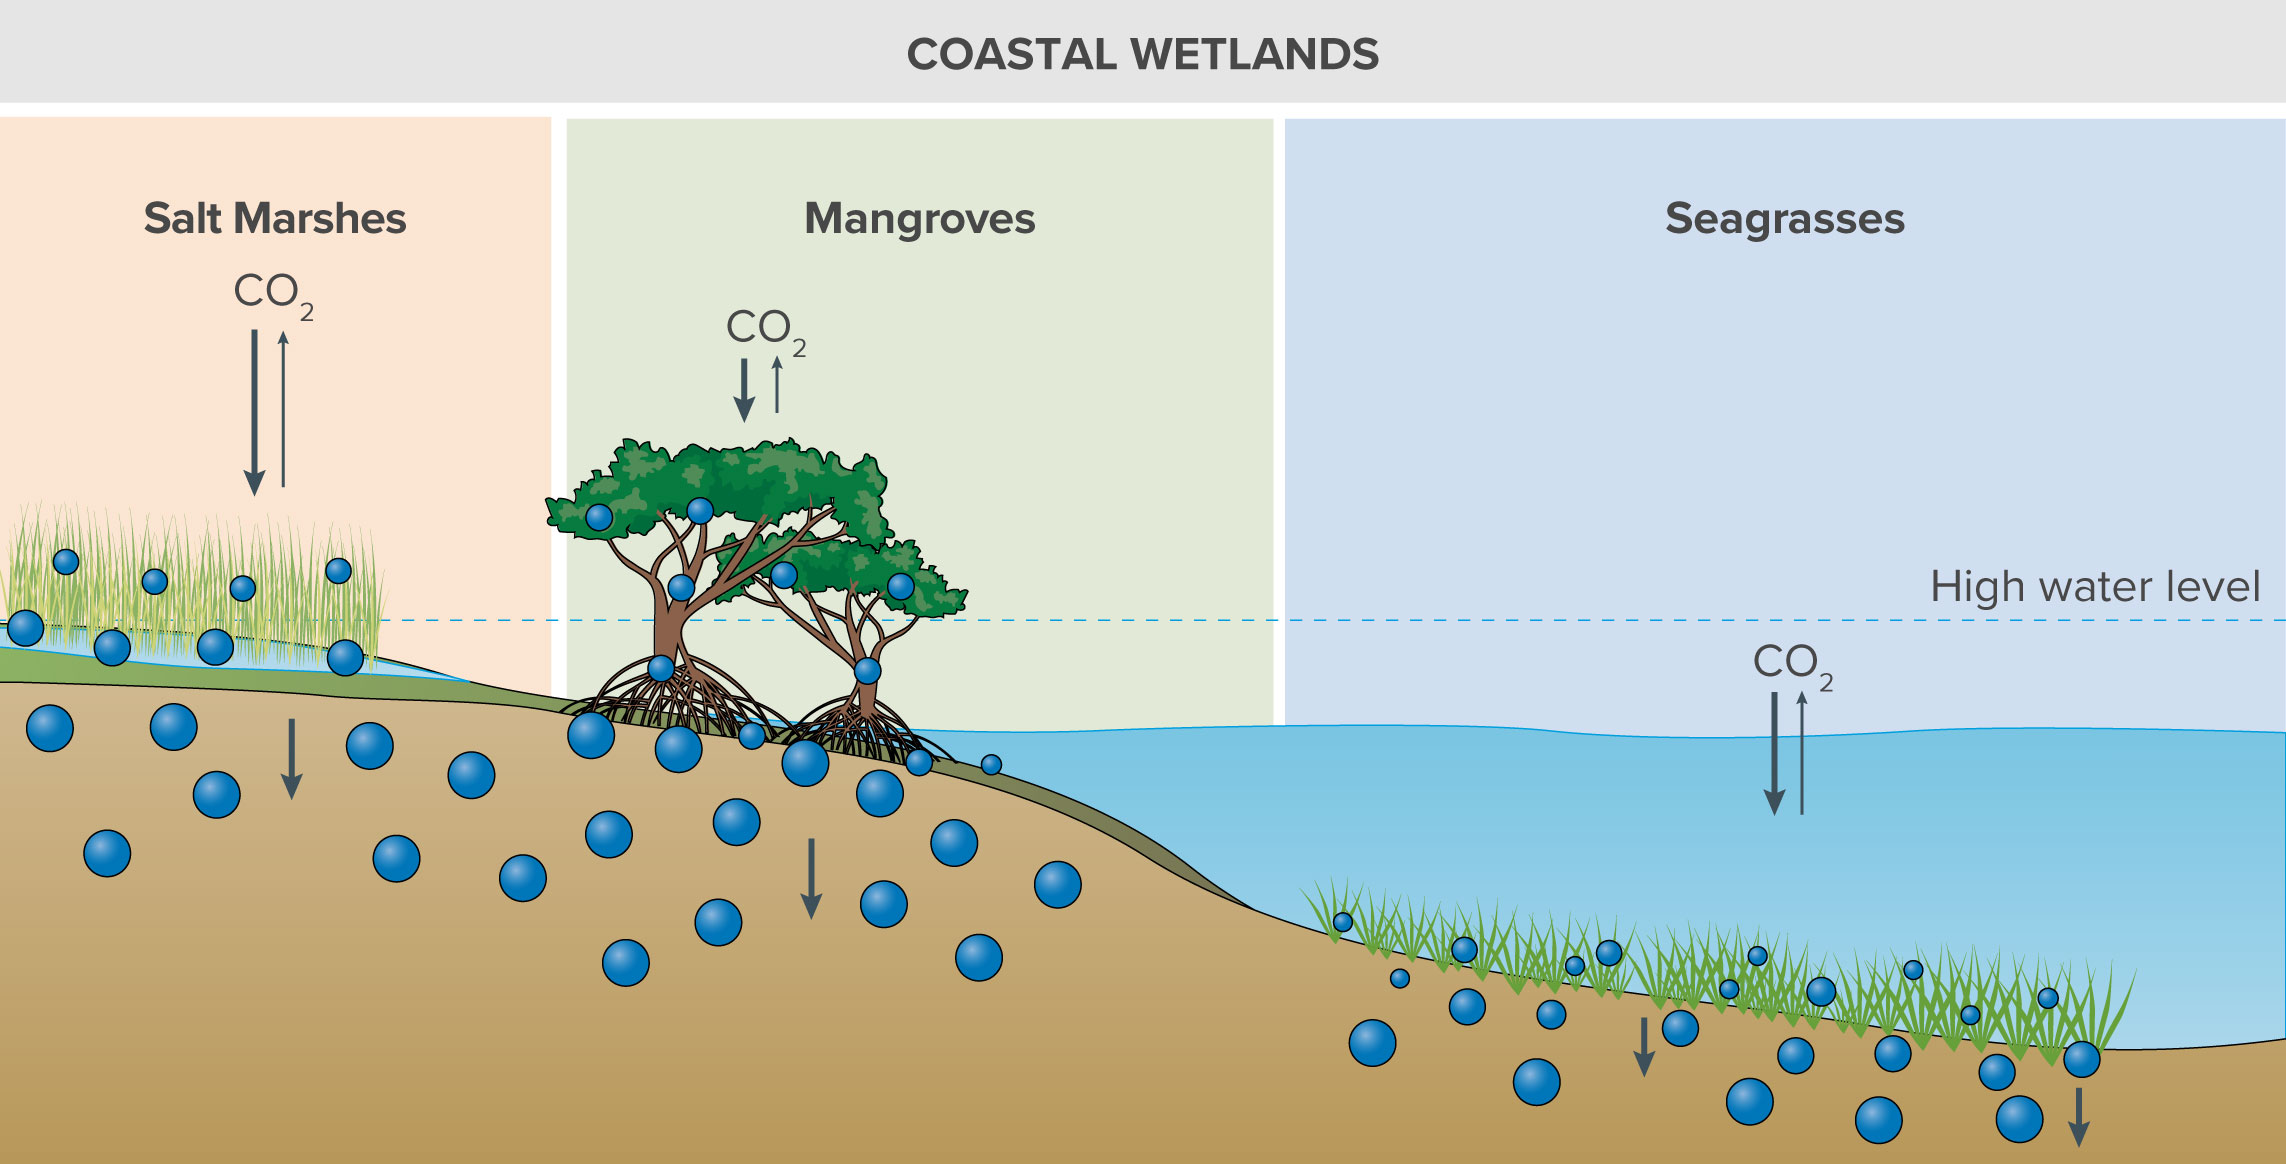
Coastal wetlands (defined as mangrove, salt marsh, and seagrass ecosystems, see Figure 1) are highly productive ecosystems that sequester carbon via photosynthesis, storing it primarily below ground in sediments where waterlogged, low-oxygen conditions help preserve it (Adame et al., 2024; Lovelock et al., 2017).
INSERT FIGURE 1 HERE
These ecosystems are also efficient at trapping carbon suspended in water, which can comprise up to 50% of the carbon sequestered in the system (McLeod et al., 2011; Temmink et al., 2022). Coastal wetlands operate as large carbon sinks (Figure 2), with long-term carbon accumulation rates averaging 5.1–8.3 t CO₂‑eq /ha/yr (McLeod et al., 2011).
Figure 2. Overview of carbon storage in coastal wetlands. Salt marshes, mangroves, and seagrasses, commonly referred to as blue carbon ecosystems, store carbon in plant biomass and sediment.
Image
Source: Macreadie, P. I., Costa, M. D., Atwood, T. B., Friess, D. A., Kelleway, J. J., Kennedy, H., ... & Duarte, C. M. (2021). Blue carbon as a natural climate solution. Nature Reviews Earth & Environment, 2(12), 826-839. Link to source: https://doi.org/10.1038/s43017-021-00224-1
Protection of coastal wetlands preserves carbon stocks and avoids emissions associated with degradation, which can increase CO₂, methane, and nitrous oxide effluxes. Nearly 50% of the total global area of coastal wetlands has been lost since 1900 and up to 87% since the 18th century (Davidson, 2014). With current loss rates, an additional 30–40% of remaining seagrasses, salt marshes, and nearly all mangroves could be lost by 2100 without protection (Pendleton et al., 2012). Protection of existing coastal wetlands is especially important because restoration is challenging, costly, and not yet fully optimized. For example, seagrass restoration has generally been unsuccessful (Macreadie et al., 2021), and restored seagrass systems can have higher GHG fluxes than natural systems (Mason et al., 2023).
On land, degradation often arises from aquaculture, reclamation and drainage, deforestation, diking, and urbanization (Mcleod et al., 2011). In the ocean, impacts often occur due to dredging, mooring, pollution, and sediment disturbance (Mcleod et al., 2011). For instance, deforestation of mangroves for agriculture removes biomass and oxidizes sediment carbon stocks, leading to high CO₂ effluxes and, potentially, methane and nitrous oxide emissions (Chauhan et al., 2017, Kauffman et al., 2016, Sasmito et al., 2019). Likewise, high CO₂ or methane effluxes from salt marshes commonly result from drainage, which can oxygenate the subsurface and fuel carbon loss, or from infrastructure such as dikes, which can reduce saltwater exchange and increase methane production (Kroeger et al., 2017). In another example, dredging in seagrass meadows drives high rates of ecosystem degradation due to reduced light availability, leading to die-offs that can increase erosion and reduce sediment carbon stocks 21–47% (Trevathan-Tackett et al., 2018).
Our analysis focused on the avoided CO₂ emissions and retained carbon sequestration capacity conferred by avoiding degradation of coastal wetlands via legal protection. While degradation can substantially alter emissions of other GHGs, such as methane and nitrous oxide, we focus on CO₂ due to the limited availability of global spatial data on degradation types and extent and associated effluxes of all GHGs across coastal wetlands. Ignoring methane and nitrous oxide benefits with protection is the most conservative approach because limited data exist on emission profiles from both functional and degraded global coastal wetlands, and even PAs/MPAs can be degraded (Holmquist et al., 2023). This solution considered wetlands to be protected if they are formally designated as PAs or MPAs under International Union for Conservation of Nature (IUCN) protection categories I–IV (UNEP-WCMC &IUCN, 2024; see Appendix for more information).
Adame, M. F., Kelleway, J., Krauss, K. W., Lovelock, C. E., Adams, J. B., Trevathan-Tackett, S. M., Noe, G., Jeffrey, L., Ronan, M., Zann, M., Carnell, P. E., Iram, N., Maher, D. T., Murdiyarso, D., Sasmito, S., Tran, D. B., Dargusch, P., Kauffman, J. B., & Brophy, L. (2024). All tidal wetlands are blue carbon ecosystems. BioScience, 74(4), 253–268. Link to source: https://doi.org/10.1093/biosci/biae007
Balmford, A., Gravestock, P., Hockley, N., McClean, C. J., & Roberts, C. M. (2004). The worldwide costs of marine protected areas. Proceedings of the National Academy of Sciences, 101(26), 9694–9697. Link to source: https://doi.org/10.1073/pnas.0403239101
Baniewicz, T. (2020, September 2). Coastal Louisiana tribes team up with biologist to protect sacred sites from rising seas. Southerly. Link to source: https://southerlymag.org/2020/09/02/coastal-louisiana-tribes-team-up-with-biologist-to-protect-sacred-sites-from-rising-seas/
Barbier, E. B., Georgiou, I. Y., Enchelmeyer, B., & Reed, D. J. (2013). The value of wetlands in protecting southeast Louisiana from hurricane storm surges. PLoS ONE, 8(3), Article e58715. Link to source: https://doi.org/10.1371/journal.pone.0058715
Blanchard, L., Haya, B. K., Anderson, C., Badgley, G., Cullenward, D., Gao, P., Goulden, M. L., Holm, J. A., Novick, K. A., Trugman, A. T., Wang, J. A., Williams, C. A., Wu, C., Yang, L., & Anderegg, W. R. L. (2024). Funding forests’ climate potential without carbon offsets. One Earth, 7(7), 1147–1150. Link to source: https://doi.org/10.1016/j.oneear.2024.06.006
Borchert, S. M., Osland, M. J., Enwright, N. M., & Griffith, K. T. (2018). Coastal wetland adaptation to sea level rise: Quantifying potential for landward migration and coastal squeeze. Journal of Applied Ecology, 55(6), 2876–2887. Link to source: https://doi.org/10.1111/1365-2664.13169
Bruner, A. G., Gullison, R. E., & Balmford, A. (2004). Financial costs and shortfalls of managing and expanding protected-area systems in developing countries. BioScience, 54(12), 1119–1126. Link to source: https://doi.org/10.1641/0006-3568(2004)054[1119:FCASOM]2.0.CO;2
Chauhan, R., Datta, A., Ramanathan, A. L., & Adhya, T. K. (2017). Whether conversion of mangrove forest to rice cropland is environmentally and economically viable? Agriculture, Ecosystems & Environment, 246, 38–47. Link to source: https://doi.org/10.1016/j.agee.2017.05.010
Cullen-Unsworth, L. C., & Unsworth, R. (2018). A call for seagrass protection. Science, 361(6401), 446–448. Link to source: https://doi.org/10.1126/science.aat7318
Department of Climate Change, Energy, the Environment and Water. (2016). Wetlands and Indigenous values [Fact sheet]. Commonwealth of Australia. Link to source: https://www.dcceew.gov.au/sites/default/files/documents/factsheet-wetlands-indigenous-values.pdf
Dabalà, A., Dahdouh-Guebas, F., Dunn, D. C., Everett, J. D., Lovelock, C. E., Hanson, J. O., Buenafe, K. C. V., Neubert, S., & Richardson, A. J. (2023). Priority areas to protect mangroves and maximise ecosystem services. Nature Communications, 14(1), Article 5863. Link to source: https://doi.org/10.1038/s41467-023-41333-3
Davidson, N. C. (2014). How much wetland has the world lost? Long-term and recent trends in global wetland area. Marine and Freshwater Research, 65(10), 934–941. Link to source: https://doi.org/10.1071/MF14173
Di Minin, E., & Toivonen, T. (2015). Global protected area expansion: Creating more than paper parks. BioScience, 65(7), 637–638. Link to source: https://doi.org/10.1093/biosci/biv064
Dinerstein, E., Joshi, A. R., Hahn, N. R., Lee, A. T. L., Vynne, C., Burkart, K., Asner, G. P., Beckham, C., Ceballos, G., Cuthbert, R., Dirzo, R., Fankem, O., Hertel, S., Li, B. V., Mellin, H., Pharand‑Deschênes, F., Olson, D., Pandav, B., Peres, C. A., … Zolli, A. (2024). Conservation Imperatives: Securing the last unprotected terrestrial sites harboring irreplaceable biodiversity. Frontiers in Science, 2, Article 1349350. Link to source: https://doi.org/10.3389/fsci.2024.1349350
Donato, D. C., Kauffman, J. B., Murdiyarso, D., Kurnianto, S., Stidham, M., & Kanninen, M. (2011). Mangroves among the most carbon-rich forests in the tropics. Nature Geoscience, 4(5), 293–297. Link to source: https://doi.org/10.1038/ngeo1123
Eyre, B. D., Camillini, N., Glud, R. N., & Rosentreter, J. A. (2023). The climate benefit of seagrass blue carbon is reduced by methane fluxes and enhanced by nitrous oxide fluxes. Communications Earth & Environment, 4(1), Article 374. Link to source: https://doi.org/10.1038/s43247-023-01022-x
Feng, Y., Song, Y., Zhu, M., Li, M., Gong, C., Luo, S., Mei, W., Feng, H., Tan, W., & Song, C. (2025). Microbes drive more carbon dioxide and nitrous oxide emissions from wetland under long-term nitrogen enrichment. Water Research, 272, Article 122942. Link to source: https://doi.org/10.1016/j.watres.2024.122942
Fletcher, M.-S., Hamilton, R., Dressler, W., & Palmer, L. (2021). Indigenous knowledge and the shackles of wilderness. Proceedings of the National Academy of Sciences, 118(40), Article e2022218118. Link to source: https://doi.org/10.1073/pnas.2022218118
Garnett, S. T., Burgess, N. D., Fa, J. E., Fernández-Llamazares, Á., Molnár, Z., Robinson, C. J., Watson, J. E. M., Zander, K. K., Austin, B., Brondizio, E. S., Collier, N. F., Duncan, T., Ellis, E., Geyle, H., Jackson, M. V., Jonas, H., Malmer, P., McGowan, B., Sivongxay, A., & Leiper, I. (2018). A spatial overview of the global importance of Indigenous lands for conservation. Nature Sustainability, 1(7), 369–374. https://doi.org/10.1038/s41893-018-0100-6
Giakoumi, S., McGowan, J., Mills, M., Beger, M., Bustamante, R. H., Charles, A., Christie, P., Fox, M., Garcia‑Borboroglu, P., Gelcich, S., Guidetti, P., Mackelworth, P., Maina, J. M., McCook, L., Micheli, F., Morgan, L. E., Mumby, P. J., Reyes, L. M., White, A., … Possingham, H. P. (2018). Revisiting “success” and “failure” of marine protected areas: A conservation scientist perspective. Frontiers in Marine Science, 5, Article 223. Link to source: https://doi.org/10.3389/fmars.2018.00223
Guannel, G., Arkema, K., Ruggiero, P., & Verutes, G. (2016). The power of three: Coral reefs, seagrasses and mangroves protect coastal regions and increase their resilience. PLoS ONE, 11(7), Article e0158094. Link to source: https://doi.org/10.1371/journal.pone.0158094
Green, E. P., & Short, F. T. (Eds.). (2003). World Atlas of Seagrasses. University of California Press. Link to source: https://environmentalunit.com/Documentation/04%20Resources%20at%20Risk/World%20Seagrass%20atlas.pdf
Heck, N., Goldberg, L., Andradi‐Brown, D. A., Campbell, A., Narayan, S., Ahmadia, G. N., & Lagomasino, D. (2024). Global drivers of mangrove loss in protected areas. Conservation Biology, 38(6), Article e14293. Link to source: https://doi.org/10.1111/cobi.14293
Hochard, J. P., Barbier, E. B., & Hamilton, S. E. (2021). Mangroves and coastal topography create economic “safe havens” from tropical storms. Scientific Reports, 11(1), Article 15359. Link to source: https://doi.org/10.1038/s41598-021-94207-3
Holmquist, J. R., Eagle, M., Molinari, R. L., Nick, S. K., Stachowicz, L. C., & Kroeger, K. D. (2023). Mapping methane reduction potential of tidal wetland restoration in the United States. Communications Earth & Environment, 4(1), Article 353. Link to source: https://doi.org/10.1038/s43247-023-00988-y
Hutchinson, M. (2022, September 2). How coastal erosion is affecting the sacred lands of Indigenous Louisianians. Chênière: The Nicholls Undergraduate Humanities Review. Link to source: https://www.nicholls.edu/cheniere/2022/09/02/how-coastal-erosion-is-affecting-the-sacred-lands-of-indigenous-louisianians
Ickowitz, A., Lo, M. G. Y., Nurhasan, M., Maulana, A. M., & Brown, B. M. (2023). Quantifying the contribution of mangroves to local fish consumption in Indonesia: A cross-sectional spatial analysis. The Lancet Planetary Health, 7(10), e819–e830. Link to source: https://doi.org/10.1016/S2542-5196(23)00196-1
Jensen, K. (2022, July 6). Climate benefits of coastal wetlands and coral reefs show why they merit protection now. The Pew Charitable Trusts. Link to source: https://www.pewtrusts.org/en/research-and-analysis/articles/2022/07/06/climate-benefits-of-coastal-wetlands-and-coral-reefs-show-why-they-merit-protection-now
Kroeger, K. D., Crooks, S., Moseman-Valtierra, S., & Tang, J. (2017). Restoring tides to reduce methane emissions in impounded wetlands: A new and potent Blue Carbon climate change intervention. Scientific Reports, 7(1), Article 11914. Link to source: https://doi.org/10.1038/s41598-017-12138-4
Lamb, J. B., Van De Water, J. A., Bourne, D. G., Altier, C., Hein, M. Y., Fiorenza, E. A., Abu, N., Jompa, J., & Harvell, C. D. (2017). Seagrass ecosystems reduce exposure to bacterial pathogens of humans, fishes, and invertebrates. Science, 355(6326), 731–733. Link to source: https://doi.org/10.1126/science.aal1956
Leal, M., & Spalding, M. D. (Eds.). (2022, September 21). The state of the world’s mangroves 2022. Global Mangrove Alliance. Link to source: https://www.wetlands.org/publication/the-state-of-the-worlds-mangroves-2022/
Leal, M., & Spalding, M. D. (Eds.). (2024). The state of the world’s mangroves 2024. Global Mangrove Alliance. Link to source: https://www.mangrovealliance.org/mangrove-forests/
Leverington, F., Costa, K. L., Pavese, H., Lisle, A., & Hockings, M. (2010). A global analysis of protected area management effectiveness. Environmental Management, 46(5), 685–698. Link to source: https://doi.org/10.1007/s00267-010-9564-5
Lovelock, C. E., Fourqurean, J. W., & Morris, J. T. (2017). Modeled CO2 emissions from coastal wetland transitions to other land uses: Tidal marshes, mangrove forests, and seagrass beds. Frontiers in Marine Science, 4, Article 143. Link to source: https://doi.org/10.3389/fmars.2017.00143
Lu, C., Wang, Z., Li, L., Wu, P., Mao, D., Jia, M., & Dong, Z. (2016). Assessing the conservation effectiveness of wetland protected areas in Northeast China. Wetlands Ecology and Management, 24(4), 381–398. Link to source: https://doi.org/10.1007/s11273-015-9462-y
Macreadie, P. I., Costa, M. D., Atwood, T. B., Friess, D. A., Kelleway, J. J., Kennedy, H., Lovelock, C. E., Serrano, O., & Duarte, C. M. (2021). Blue carbon as a natural climate solution. Nature Reviews Earth & Environment, 2(12), 826–839. Link to source: https://doi.org/10.1038/s43017-021-00224-1
Macreadie, P. I., Robertson, A. I., Spinks, B., Adams, M. P., Atchison, J. M., Bell‑James, J., Bryan, B. A., Chu, L., Filbee‑Dexter, K., Drake, L., Duarte, C. M., Friess, D. A., Gonzalez, F., Grafton, R. Q., Helmstedt, K. J., Kaebernick, M., Kelleway, J., Kendrick, G. A., Kennedy, H., … Rogers, K. (2022). Operationalizing marketable blue carbon. One Earth, 5(5), 485–492. Link to source: https://doi.org/10.1016/j.oneear.2022.04.005
Mason, V. G., Burden, A., Epstein, G., Jupe, L. L., Wood, K. A., & Skov, M. W. (2023). Blue carbon benefits from global saltmarsh restoration. Global Change Biology, 29(23), 6517–6545. Link to source: https://doi.org/10.1111/gcb.16943
Mathews, D. L., & Turner, N. J. (2017). Ocean cultures: Northwest Coast ecosystems and Indigenous management systems. In P. S. Levin & M. R. Poe (Eds.), Conservation for the Anthropocene ocean: Interdisciplinary science in support of nature and people (pp.169–206). Academic Press. Link to source: https://doi.org/10.1016/B978-0-12-805375-1.00009-X
McCrea-Strub, A., Zeller, D., Sumaila, U. R., Nelson, J., Balmford, A., & Pauly, D. (2011). Understanding the cost of establishing marine protected areas. Marine Policy, 35(1), 1–9. Link to source: https://doi.org/10.1016/j.marpol.2010.07.001
Mcleod, E., Chmura, G. L., Bouillon, S., Salm, R., Björk, M., Duarte, C. M., Lovelock, C. E., Schlesinger, W. H., & Silliman, B. R. (2011). A blueprint for blue carbon: Toward an improved understanding of the role of vegetated coastal habitats in sequestering CO2. Frontiers in Ecology and the Environment, 9(10), 552–560. Link to source: https://doi.org/10.1890/110004
McIvor, A. L., Spencer, T., Möller, I., & Spalding, M. (2012). Storm surge reduction by mangroves (Natural Coastal Protection Series: Report No. 2). The Nature Conservancy and Wetlands International. Link to source: https://www.mangrovealliance.org/wp-content/uploads/2018/05/storm-surge-reduction-by-mangroves-1.pdf
McNally, C. G., Uchida, E. and Gold, A. J. (2011). The effect of a protected area on the tradeoffs between short-run and long-run benefits from mangrove ecosystems. Proceedings of the National Academy of Sciences, 108(34), 13945–13950. Link to source: https://doi.org/10.1073/pnas.1101825108
Noyce, G. L., Smith, A. J., Kirwan, M. L., Rich, R. L., & Megonigal, J. P. (2023). Oxygen priming induced by elevated CO2 reduces carbon accumulation and methane emissions in coastal wetlands. Nature Geoscience, 16(1), 63–68. Link to source: https://doi.org/10.1038/s41561-022-01070-6
Mcowen, C. J., Weatherdon, L. V., Van Bochove, J.-W., Sullivan, E., Blyth, S., Zockler, C., Stanwell-Smith, D., Kingston, N., Martin, C. S., Spalding, M., & Fletcher, S. (2017). A global map of saltmarshes. Biodiversity Data Journal, 5, Article e11764. Link to source: https://doi.org/10.3897/BDJ.5.e11764
Narayan, S., Beck, M. W., Wilson, P., Thomas, C. J., Guerrero, A., Shepard, C. C., Reguero, B. G., Franco, G., Ingram, J. C., & Trespalacios, D. (2017). The value of coastal wetlands for flood damage reduction in the Northeastern USA. Scientific Reports, 7(1), Article 9463. Link to source: https://doi.org/10.1038/s41598-017-09269-z
Pendleton, L., Donato, D. C., Murray, B. C., Crooks, S., Jenkins, W. A., Sifleet, S., Craft, C., Fourqurean, J. W., Kauffman, J. B., Marbà, N., Megonigal, J. P., Pidgeon, E., Herr, D., Gordon, D., & Baldera, A. (2012). Estimating global “blue carbon” emissions from conversion and degradation of vegetated coastal ecosystems. PLoS ONE, 7(9), Article e43542. Link to source: https://doi.org/10.1371/journal.pone.0043542
Renwick, A. R., Bode, M., & Venter, O. (2015). Reserves in context: Planning for leakage from protected areas. PLoS ONE, 10(6), Article e0129441. Link to source: https://doi.org/10.1371/journal.pone.0129441
Roberts, C. M., O'Leary, B. C., & Hawkins, J. P. (2020). Climate change mitigation and nature conservation both require higher protected area targets. Philosophical Transactions of the Royal Society B, 375(1794), Article 20190121. Link to source: https://doi.org/10.1098/rstb.2019.0121
Rodríguez-Rodríguez, D., & Martínez-Vega, J. (2022). Ecological effectiveness of marine protected areas across the globe in the scientific literature. In C. Sheppard (Ed.), Advances in marine biology (Vol. 92, pp. 129–153). Elsevier. Link to source: https://doi.org/10.1016/bs.amb.2022.07.002
Rosentreter, J. A., Maher, D. T., Erler, D. V., Murray, R. H., & Eyre, B. D. (2018). Methane emissions partially offset “blue carbon” burial in mangroves. Science Advances, 4(6), Article eaao4985. Link to source: https://doi.org/10.1126/sciadv.aao4985
Sasmito, S. D., Taillardat, P., Clendenning, J. N., Cameron, C., Friess, D. A., Murdiyarso, D., & Hutley, L. B. (2019). Effect of land‐use and land‐cover change on mangrove blue carbon: A systematic review. Global Change Biology, 25(12), 4291–4302. Link to source: https://doi.org/10.1111/gcb.14774
Schuerch, M., Spencer, T., Temmerman, S., Kirwan, M. L., Wolff, C., Lincke, D., McOwen, C. J., Pickering, M. D., Reef, R., Vafeidis, A. T., Hinkel, J., Nicholls, R. J., & Brown, S. (2018). Future response of global coastal wetlands to sea-level rise. Nature, 561(7722), 231–234. Link to source: https://doi.org/10.1038/s41586-018-0476-5
Sheng, P., Y., Paramygin, V. A., Rivera-Nieves, A. A., Zou, R., Fernald, S., Hall, T., & Jacob, K. (2022). Coastal marshes provide valuable protection for coastal communities from storm-induced wave, flood, and structural loss in a changing climate. Scientific Reports, 12(1), Article 3051. Link to source: https://doi.org/10.1038/s41598-022-06850-z
Temmink, R. J. M., Lamers, L. P. M., Angelini, C., Bouma, T. J., Fritz, C., van de Koppel, J., Lexmond, R., Rietkerk, M., Silliman, B. R., Joosten, H., & van der Heide, T. (2022). Recovering wetland biogeomorphic feedbacks to restore the world’s biotic carbon hotspots. Science, 376(6593), Article eabn1479. Link to source: https://doi.org/10.1126/science.abn1479
Thampanya, U., Vermaat, J. E., Sinsakul, S., & Panapitukkul, N. (2006). Coastal erosion and mangrove progradation of Southern Thailand. Estuarine, Coastal and Shelf Science, 68(1–2), 75–85. Link to source: https://doi.org/10.1016/j.ecss.2006.01.011
Trevathan‐Tackett, S. M., Wessel, C., Cebrián, J., Ralph, P. J., Masqué, P., & Macreadie, P. I. (2018). Effects of small‐scale, shading‐induced seagrass loss on blue carbon storage: Implications for management of degraded seagrass ecosystems. Journal of Applied Ecology, 55(3), 1351–1359. Link to source: https://doi.org/10.1111/1365-2664.13081
Unsworth, R. K. F., Cullen-Unsworth, L. C., Jones, B. L. H., & Lilley, R. J. (2022). The planetary role of seagrass conservation. Science, 377(6606), 609–613. Link to source: https://doi.org/10.1126/science.abq6923
UNEP-WCMC, & IUCN. (2024). Protected planet: The world database on protected areas (WDPA) and world database on other effective area-based conservation measures (WD-OECM) [Data set]. Retrieved November 2024, from Link to source: https://www.protectedplanet.net
United Nations Environment Programme. (2014). The importance of mangroves to people: A call to action (J. van Bochove, E. Sullivan, & T. Nakamura, Eds.). United Nations Environment Programme World Conservation Monitoring Centre. Link to source: https://www.unep.org/resources/report/importance-mangroves-people-call-action
United Nations Environment Programme. (2020). Out of the blue: The value of seagrasses to the environment and to people. Link to source: https://www.unep.org/resources/report/out-blue-value-seagrasses-environment-and-people
U.S. Environmental Protection Agency. (2025a). Why are wetlands important? Link to source: https://www.epa.gov/wetlands/why-are-wetlands-important
U.S. Environmental Protection Agency. (2025b). About coastal wetlands. Link to source: https://www.epa.gov/wetlands/about-coastal-wetlands
Waldron, A., Adams, V., Allan, J., Arnell, A., Asner, G., Atkinson, S., Baccini, A., Baillie, J. E. M., Balmford, A., Beau, J. A., Brander, L., Brondizio, E., Bruner, A., Burgess, N., Burkart, K., Butchart, S., Button, R., Carrasco, R., Cheung, W., … Zhang, Y. P. (2020). Protecting 30% of the planet for nature: Costs, benefits and economic implications [Working paper]. Campaign for Nature. Link to source: https://pure.iiasa.ac.at/id/eprint/16560/1/Waldron_Report_FINAL_sml.pdf
Wang, F., Sanders, C. J., Santos, I. R., Tang, J., Schuerch, M., Kirwan, M. L., Kopp, R. E., Zhu, K., Li, X., Yuan, J., Liu, W., & Li, Z. (2021). Global blue carbon accumulation in tidal wetlands increases with climate change. National Science Review, 8(9), Article nwaa296. Link to source: https://doi.org/10.1093/nsr/nwaa296
West, T. A. P., Wunder, S., Sills, E. O., Börner, J., Rifai, S. W., Neidermeier, A. N., Frey, G. P., & Kontoleon, A. (2023). Action needed to make carbon offsets from forest conservation work for climate change mitigation. Science, 381(6660), 873–877. Link to source: https://doi.org/10.1126/science.ade3535
Worthington, T. A., Spalding, M., Landis, E., Maxwell, T. L., Navarro, A., Smart, L. S., & Murray, N. J. (2024). The distribution of global tidal marshes from Earth observation data. Global Ecology and Biogeography, 33(8), Article e13852. Link to source: https://doi.org/10.1111/geb.13852
Credits
Lead Fellow
Christina Richardson, Ph.D.
Contributors
Ruthie Burrows, Ph.D.
Avery Driscoll
James Gerber, Ph.D.
Daniel Jasper
Christina Swanson, Ph.D.
Alex Sweeney
Paul West, Ph.D.
Internal Reviewers
Aiyana Bodi
Avery Driscoll
James Gerber, Ph.D.
Hannah Henkin
Ted Otte
Christina Swanson, Ph.D.
Effectiveness
We estimated that coastal wetland protection avoids emissions of 2.33–5.74 t CO₂‑eq /ha/yr, while also sequestering an additional 1.22–2.14 t CO₂‑eq /ha/yr depending on the ecosystem (Tables 1a–c; see the Appendix for more information). We estimated effectiveness as the avoided CO₂ emissions and the retained carbon sequestration capacity attributable to the reduction in wetland loss conferred by protection, as detailed in Equation 1. First, we calculated the difference between the rate of wetland loss outside PAs and MPAs (Wetland lossbaseline) versus inside PAs and MPAs, since protection does not entirely prevent degradation. Loss rates were primarily driven by anthropogenic habitat conversion. The effectiveness of protection was 53–59% (Reduction in loss). We then multiplied the avoided wetland loss by the sum of the avoided CO₂ emissions associated with the loss of carbon stored in sediment and biomass in one ha of wetland each year over a 30-yr timeframe (Carbonavoided emissions) and the amount of carbon sequestered via long-term storage in sediment carbon by one ha of protected wetland each year over a 30-yr timeframe (Carbonsequestration).
Equation 1. Effectiveness = (Wetland lossbaseline ✕ Reduction in loss)* (Carbonavoided emissions + Carbonsequestration )
We did this calculation separately for mangrove, salt marsh, and seagrass ecosystems, because many of these factors, such as carbon emission and sequestration rates, protection effectiveness, and loss rates, vary across ecosystem types. The rationale for increasing protection varies between coastal wetland ecosystem types, but in all cases, protection is an important tool for retaining and building long-lived carbon stocks. Additionally, climate impacts associated with this solution could be much greater than estimated if protection efficacy improves or is higher than our estimates of 53–59%.
left_text_column_width
Table 1a. Effectiveness at avoiding emissions and sequestering carbon in mangrove ecosystems.
Unit: t CO₂‑eq /ha protected/yr, 100-yr basis
| 25th percentile | 5.64 |
| mean | 6.80 |
| median (50th percentile) | 5.74 |
| 75th percentile | 7.42 |
Unit: t CO₂‑eq /ha protected/yr, 100-yr basis
| 25th percentile | 2.00 |
| mean | 2.14 |
| median (50th percentile) | 2.14 |
| 75th percentile | 2.38 |
Unit: t CO₂‑eq /ha protected/yr, 100-yr basis
| 25th percentile | 7.64 |
| mean | 8.94 |
| median (50th percentile) | 7.88 |
| 75th percentile | 9.81 |
Left Text Column Width
Table 1b. Effectiveness at avoiding emissions and sequestering carbon in salt marsh ecosystems.
Unit: t CO₂‑eq /ha protected/yr, 100-yr basis
| 25th percentile | 2.79 |
| mean | 2.90 |
| median (50th percentile) | 2.90 |
| 75th percentile | 3.01 |
Unit: t CO₂‑eq /ha protected/yr, 100-yr basis
| 25th percentile | 1.59 |
| mean | 1.90 |
| median (50th percentile) | 1.88 |
| 75th percentile | 2.19 |
Unit: t CO₂‑eq /ha protected/yr, 100-yr basis
| 25th percentile | 4.38 |
| mean | 4.80 |
| median (50th percentile) | 4.78 |
| 75th percentile | 5.20 |
Left Text Column Width
Table 1c. Effectiveness at avoiding emissions and sequestering carbon in seagrass ecosystems.
Unit: t CO₂‑eq /ha protected/yr, 100-yr basis
| 25th percentile | 2.11 |
| mean | 2.33 |
| median (50th percentile) | 2.33 |
| 75th percentile | 2.56 |
Unit: t CO₂‑eq /ha protected/yr, 100-yr basis
| 25th percentile | 1.04 |
| mean | 1.53 |
| median (50th percentile) | 1.22 |
| 75th percentile | 1.71 |
Unit: t CO₂‑eq /ha protected/yr, 100-yr basis
| 25th percentile | 3.15 |
| mean | 3.86 |
| median (50th percentile) | 3.56 |
| 75th percentile | 4.27 |
Left Text Column Width
Cost
We estimate that coastal wetland protection costs approximately US$1–2/t CO₂‑eq for mangrove and salt marsh ecosystems and seagrass ecosystem protection saves US$6/t CO₂‑eq (Tables 2a–c). This is based on protection costs of roughly US$11/ha and revenue of US$23/ha compared with the baseline for mangrove/salt marsh and seagrass ecosystems, respectively. However, data related to the costs of coastal wetland protection are extremely limited, and these estimates are uncertain. These estimates likely underestimate the potentially high costs of coastal land acquisition, for instance.
The costs of coastal wetland protection include up-front costs of land acquisition (for salt marshes and mangroves) and other one-time expenditures as well as ongoing operational costs. Protecting coastal wetlands also generates revenue, primarily through increased tourism. For consistency across solutions, we did not include revenue associated with benefits other than climate change mitigation.
Due to data limitations, we estimated the cost of land acquisition for ecosystem protection for mangroves and salt marshes by extracting coastal forest land purchase costs reported by Dinerstein et al. (2024), who found a median cost of US$1,115/ha (range: US$78–5,910/ha), which we amortized over 30 years. For seagrass ecosystems, which do not generally require land acquisition, we based initial costs were on McCrea-Strub et al.’s (2011) findings that reported a median MPA start-up cost of US$208/ha (range: US$55–434/ha) to cover expenses associated with infrastructure, planning, and site research, which we amortized over 30 years.
Costs of PA maintenance were estimated as US$17/ha/yr (Waldron et al., 2020). While these estimates reflect the costs of effective enforcement and management, many PAs lack sufficient funding for effective management (Bruner et al., 2004). Costs of MPA maintenance were estimated at US$14/ha/yr, though only 16% of the MPAs surveyed in this study reported their current funding as sufficient (Balmford et al., 2004). Tourism revenues directly attributable to protection were estimated to be US$43/ha/yr (Waldron et al., 2020) based on estimates for all PAs and MPAs and excluding downstream revenues. For consistency across solutions, we did not include revenues associated with ecosystem services, which would increase projected revenue.
We also excluded carbon credits as a revenue source due to the challenges inherent in accurate carbon accounting in these ecosystems and their frequently intended use to offset carbon emissions, similar to reported concerns with low-quality carbon credits in forest conservation projects (West et al., 2023). Future actions could explore policies that increase market financing for coastal wetland protection in more holistic ways, such as contributions-based approaches as suggested for forests (Blanchard et al., 2024). Financial support will be critical for backing conservation implementation (Macreadie et al., 2022), particularly in the face of existing political and economic challenges that have historically limited expansion.
left_text_column_width
Table 2. Cost per unit climate impact.
Unit: 2023 US$/t CO₂‑eq , 100-yr basis
| estimate | 1 |
Unit: 2023 US$/t CO₂‑eq , 100-yr basis
| estimate | 2 |
Unit: 2023 US$/t CO₂‑eq , 100-yr basis
| estimate | -6 |
Negative value indicates cost savings.
Left Text Column Width
Learning Curve
We define a learning curve as falling costs with increased adoption. The costs of coastal wetland protection do not fall with increasing adoption, so there is no learning curve for this solution.
left_text_column_width
Speed of Action
Speed of action refers to how quickly a climate solution physically affects the atmosphere after it is deployed. This is different from speed of deployment, which is the pace at which solutions are adopted.
At Project Drawdown, we define the speed of action for each climate solution as emergency brake, gradual, or delayed.
Protect Coastal Wetlands is an EMERGENCY BRAKE climate solution. It has the potential to deliver a more rapid impact than gradual and delayed solutions. Because emergency brake solutions can deliver their climate benefits quickly, they can help accelerate our efforts to address dangerous levels of climate change. For this reason, they are a high priority.
left_text_column_width
Caveats
Additionality in this solution refers to whether the ecosystem would have been degraded without protection. In this analysis, we assumed protection confers additional carbon benefits as it reduces degradation and associated emissions. Another aspect of additionality, which is related but not necessarily relevant to our analysis, is whether coastal wetlands would have been protected in the absence of carbon financing, which could be important if protection efforts expand and seek carbon credits as many coastal wetlands are protected for other benefits, such as flood resilience and biodiversity.
The permanence of stored carbon in coastal wetlands is another critical issue as climate change impacts unfold. For instance, with sea-level rise, the ability of salt marshes to expand both vertically and laterally can determine resiliency, suggesting that protection of wetlands might also need to include adjacent areas for expansion (Schuerch et al., 2018). On a global scale, recent research suggests that global carbon accumulation might actually increase by 2100 from climate change impacts on tidal wetlands (Wang et al., 2021), though more work is needed as other work suggests the opposite (Noyce et al., 2023). There is also substantial risk of reversal of carbon benefits if protections are reversed or unenforced, which can require long-term financial investments, community engagement, and management/enforcement commitments (Giakoumi et al., 2018), particularly if the land is leased.
Finally, there are significant uncertainties associated with the available data on coastal wetland areas and distributions, loss rates, drivers of loss, extent and boundaries of PAs/MPAs, and efficacy of PAs/MPAs at reducing coastal wetland disturbance. For example, the geospatial datasets we used to identify the adoption ceiling for this solution could include partially degraded systems, such as drained wetlands, where protection alone would not stop emissions or restore function without restoration – yet we lack enough data to distinguish these current differences at a global scale. Similarly, legal protection of coastal wetlands does not always prevent degradation (Heck et al., 2024). The emissions dynamics of both intact and degraded coastal wetlands are also uncertain. Even less is known about the impacts of different types of degradation on coastal wetland carbon dynamics and how they vary spatially and temporally around the world.
left_text_column_width
Current Adoption
We estimated that approximately 8.04 million ha of coastal wetlands are currently protected, with 5.13 million ha recognized as PAs and MPAs in strict (I–II) protection categories and 2.90 million ha in non-strict protection categories (III–IV) (Tables 3a–c; Garnett et al., 2018; UNEP-WCMC & IUCN, 2024, see Appendix). Indigenous People’s Lands (IPLs) cover an additional 3.44 million ha; we did not include these in our analysis due to limited data, but we recognize that these sites might currently deliver conservation benefits. In total, we estimate that roughly 15% of all coastal wetlands have some protection (as MPAs or PAs in IUCN categories I–IV), though only about 9% are under strict protection (IUCN categories I or II). Across individual ecosystem types, strict protection categories (IUCN I–II) are highest for mangroves (~15%) and lowest for seagrasses (~7%).
Our estimates of PA and MPA protection (12–19%) were lower than previously reported estimates for mangroves (40–43%, Dabalà et al., 2023; Leal and Spalding, 2024), tidal marshes (45%, Worthington et al., 2024), and seagrasses (26%, United Nations Environment Programme [UNEP], 2020). This is likely because our calculations excluded IUCN categories (“not assigned,” “not applicable,” and “not reported”) that contain large areal estimates for each ecosystem type – 4.3 million ha (mangrove), 1.9 million ha (salt marsh), and 5.4 million ha (seagrasses) – because their protection category was unclear as well as IUCN protection categories V–VI, which permit sustainable use and where extractive activities that could degrade these ecosystems are less formally restricted. Our spatial analysis also differed (see Appendix).
Table 3a. Current extent of mangrove ecosystems under legal protection by ecosystem type (circa 2023). “Strict Protection” includes land within IUCN Categories I–II PAs or MPAs. “Nonstrict Protection” includes land within IUCN Categories III–IV PAs or MPAs. “Other” includes land within all remaining IUCN PA or MPA categories (Million ha protected).
left_text_column_width
Table 3. Current extent of ecosystems under legal protection by ecosystem type (circa 2023). “Strict Protection” includes land within IUCN Categories I–II PAs or MPAs. “Nonstrict Protection” includes land within IUCN Categories III–IV PAs or MPAs. “Other” includes land within all remaining IUCN PA or MPA categories.
Unit: million ha protected
| Strict Protection | 2.35 |
| Nonstrict Protection | 0.59 |
| Total (Strict + Nonstrict) | 2.94 |
| IPL | 1.86 |
| Other | 7.52 |
Unit: million ha protected
| Strict Protection | 0.62 |
| Nonstrict Protection | 0.62 |
| Total (Strict + Nonstrict) | 1.24 |
| IPL | 1.09 |
| Other | 3.14 |
Unit: million ha protected
| Strict Protection | 2.17 |
| Nonstrict Protection | 1.69 |
| Total (Strict + Nonstrict) | 3.86 |
| IPL | 0.49 |
| Other | 9.00 |
Left Text Column Width
Adoption Trend
We calculated the rate of PA and MPA expansion based on their recorded year of establishment. Protection expanded by an average of 59,600, 19,700, and 98,500 ha/yr in mangrove, salt marsh, and seagrass ecosystems, respectively (Tables 4a–c; Figure 3, left). Salt marsh ecosystems have the lowest absolute rate of coastal wetland protection expansion (Figure 3a), while seagrasses have the lowest expansion of PAs relative to their adoption ceiling (Figure 3, right). The median total annual adoption trend across the three ecosystems is roughly 123,100 ha/yr (roughly 0.12 million ha/yr).
left_text_column_width
Table 4. 2000–2020 adoption trend for legal protection of ecosystems.
Unit: ha/yr protected
| 25th percentile | 23,000 |
| mean | 59,600 |
| median (50th percentile) | 40,700 |
| 75th percentile | 76,600 |
Unit: ha/yr protected
| 25th percentile | 8,400 |
| mean | 19,700 |
| median (50th percentile) | 18,500 |
| 75th percentile | 23,300 |
Unit: ha/yr protected
| 25th percentile | 12,800 |
| mean | 98,500 |
| median (50th percentile) | 37,800 |
| 75th percentile | 142,900 |
Left Text Column Width
Figure 3. (a) Areal trend in coastal wetland protection by ecosystem type (2000–2020). These values reflect only the area located within IUCN Class I–IV PAs or MPAs; (ha/yr protected). (b) Trend in coastal wetland protection by ecosystem type as a percent of the adoption ceiling. These values reflect only the area located within IUCN Class I–IV PAs or MPAs; (Percent). Source: Project Drawdown original analysis.
Credit: Project Drawdown
Enable Download
Off
Adoption Ceiling
We estimate an adoption ceiling of 54.6 million ha of coastal wetlands globally, which includes 15.7 million ha of mangroves, 7.50 million ha of salt marshes, and 31.4 million ha of seagrasses (Tables 5a–c). This estimate is in line with recent existing global estimates of coastal wetlands (36–185 million ha), which have large ranges due to uncertainties surrounding seagrass and salt marsh distributions (Macreadie et al., 2021, Krause et al., 2025). The adoption ceiling of our solution is therefore a conservative estimate of potential climate impact if global areas are indeed larger than calculated. While the protection of all existing coastal wetlands is highly unlikely, these values are used to represent the technical limits of adoption of this solution.
left_text_column_width
Table 5. Adoption ceiling: upper limit for adoption of legal protection of ecosystems.
Unit: million ha protected
| estimate | 15.7 |
Unit: million ha protected
| estimate | 7.50 |
Unit: million ha protected
| estimate | 31.4 |
Left Text Column Width
Achievable Adoption
We defined the lower end of the achievable range for coastal wetland protection (under IUCN categories I–IV) as 50% of the adoption ceiling and the higher end of the achievable range as 70% of the adoption ceiling for each ecosystem (Tables 6a–c). These numbers are ambitious but precedent exists to support them. For instance, roughly 11 countries already protect over 70% of their mangroves (Dabalà et al., 2023), and the global “30 by 30” target aims to protect 30% of ecosystems on land and in the ocean by 2030 (Roberts et al., 2020). Further, a significant extent of existing global coastal wetland areas already fall under non-strict protection categories not included in our analysis (V–VI and “Other”). These are prime candidates for conversion to stricter protection categories, so long as the designation confers real conservation benefits; recent work suggests that stricter protection can coincide with increased degradation in some mangroves (Heck et al., 2024).
Current adoption of PAs and MPAs in many countries with the highest land areas of coastal wetlands is low. For example, protection levels (IUCN I–IV) in countries with the top 10 greatest mangrove areas ranges between less than 1% (India, Myanmar, Nigeria, and Papua New Guinea) to 8.8–21.2% (Australia, Bangladesh, Brazil, Indonesia, Malaysia, and Mexico;Dabalà et al., 2023). Expansion of PAs, particularly under IUCN I–IV categories, is a significant challenge with real implementation barriers due to competing land uses and local reliance on these areas for livelihoods. Further, protection does not guarantee conservation benefits, and significant funding is required to maintain/enforce these areas or they run the risk of becoming “paper parks” (Di Minin & Toivonen, 2015). Strong policy and financial incentives for conservation will be necessary to achieve these ambitious goals. Pathways for operationalizing protection could include finance, governance, and stakeholder alignment and will likely require a combination of these tactics around the world.
left_text_column_width
Table 6. Range of achievable adoption levels for ecosystems.
Unit: million ha protected
| Current Adoption | 2.94 |
| Achievable – Low | 7.85 |
| Achievable – High | 11.0 |
| Adoption Ceiling | 15.7 |
Unit: million ha protected
| Current Adoption | 1.24 |
| Achievable – Low | 3.75 |
| Achievable – High | 5.25 |
| Adoption Ceiling | 7.50 |
Unit: million ha protected
| Current Adoption | 3.86 |
| Achievable – Low | 15.7 |
| Achievable – High | 22.0 |
| Adoption Ceiling | 31.4 |
Left Text Column Width
We estimated that coastal wetland protection currently avoids approximately 0.04 Gt CO₂‑eq/yr, with potential impacts of 0.27 Gt CO₂‑eq/yr at the adoption ceiling (Table 7a–c, see Appendix for more information on the calculations). The lower-end achievable scenario (50% protection) would avoid 0.14 Gt CO₂‑eq/yr and the upper-end achievable scenario (70% protection) would avoid 0.20 Gt CO₂‑eq/yr (Tables 7a–c). These values are in line with Macreadie et al. (2021), who estimated a maximum mitigation potential from avoided emissions due to degradation (land conversion) of 0.30 (range: 0.14–0.47) Gt CO₂‑eq/yr for mangrove, salt marsh, and seagrass ecosystems. Our estimate was slightly lower, but within their range, and differed in a few key ways. We accounted for the effectiveness of protection at reducing degradation (53–59%, instead of assuming 100%), included retained carbon sequestration with each hectare protected, and used slightly different loss rates and ecosystem areas.
left_text_column_width
Table 7. Climate impact at different levels of adoption for ecosystems.
Unit: Gt CO₂‑eq/yr, 100-yr basis
| Current Adoption | 0.02 |
| Achievable – Low | 0.06 |
| Achievable – High | 0.09 |
| Adoption Ceiling | 0.12 |
Unit: Gt CO₂‑eq/yr, 100-yr basis
| Current Adoption | 0.01 |
| Achievable – Low | 0.02 |
| Achievable – High | 0.03 |
| Adoption Ceiling | 0.04 |
Unit: Gt CO₂‑eq/yr, 100-yr basis
| Current Adoption | 0.01 |
| Achievable – Low | 0.06 |
| Achievable – High | 0.08 |
| Adoption Ceiling | 0.11 |
Left Text Column Width
Additional Benefits
Extreme Weather Events
Wetlands buffer coastal communities from waves and storm surge due to extreme weather and have important roles in disaster risk mitigation (Sheng et al., 2022; Guannel et al., 2016). Mangroves slow the flow of water and reduce surface waves to protect more than 60 million people in low-lying coastal areas, mainly in low- and middle-income countries (McIvor et al., 2012; Hochard et al., 2021). Wetlands also protect structures against damage during storms and lead to savings in insurance claims (Barbier et al., 2013; Sheng et al., 2022). Mangroves provide an estimated US$65 billion in flood protection globally (Menéndez et al., 2020). A study of the damages of Hurricane Sandy found that wetlands in the northeastern United States avoided US$625 million in direct flood damages (Narayan et al., 2017).
Land Resources
Wetlands reduce coastal erosion which can benefit local communities during strong storms (Jensen, 2022). Wetlands mitigate erosion impacts by absorbing wave energy that would degrade sand and other marine sediments (U.S. EPA, 2025b). Specifically, mangroves reduce erosion through their aerial root structure that retain sediments that would otherwise degrade the shoreline (Thampanya et al., 2006).
Income and Work
Wetlands are a contributor to local livelihoods, providing employment for coastal populations via the fisheries and tourism that they support. Coastal ecosystems, such as mangroves, are crucial for subsistence fisheries as they sustain approximately 4.1 million small-scale fishers (Leal and Spalding, 2022). Wetlands provide sources of income for low-income coastal communities as they make small-scale fishing accessible, requiring limited gear and materials to fish (Cullen-Unsworth & Unsworth, 2018). The economic value of mangrove ecosystem services is estimated at US$33,000–57,000/ha/yr and is a major contributor to the national economies of low- and middle-income countries with mangroves (UNEP, 2014).
Food Security
Mangroves support the development of numerous commercially important species and strengthen overall fishery productivity. For example, research conducted across 6,000 villages in Indonesia found that rural coastal households near high and medium-density mangroves consumed more fish and aquatic animals than households without mangroves nearby (Ickowitz et al., 2023). Seagrasses also support fisheries as 20% of the world’s largest fisheries rely on seagrasses for habitats (Jensen, 2022). The amount and diversity of species within seagrasses also provide important nutrition for fishery species (Cullen-Unsworth & Unsworth, 2018).
Equality
Coastal wetlands are significant in cultural heritages and identities for nearby people. They can be associated with historical, religious, and spiritual values for communities and especially for Indigenous communities (UNEP, 2014). For example, a combination of sea-level rise and oil and gas drilling have contributed to the decline of coastal wetlands in Louisiana, which threatens livelihoods and deep spiritual ties of local Indigenous tribes (Baniewicz, 2020; Hutchinson, 2022). Indigenous people have a long history of managing and protecting coastal wetlands (Commonwealth of Australia, 2016; Matthews & Turner, 2017). Efforts to protect these areas must include legal recognition of Indigenous ownership to support a just and sustainable conservation process (Fletcher et al., 2021).
Nature Protection
Coastal wetlands are integral in supporting the biodiversity of surrounding watersheds. High species diversity of mangroves and seagrasses provide a unique habitat for marine life, birds, insects, and mammals, and contain numerous threatened or endangered species (Green and Short, 2003; U.S. EPA, 2025a). A variety of species rely on wetlands for food and shelter, and they can provide temporary habitats for species during critical times in their life cycles, such as migration and breeding (Unsworth et al., 2022). Wetlands can improve water quality, making the surrounding ecosystem more favorable to supporting marine life (Cullen-Unsworth & Unsworth, 2018). Seagrasses can improve coral health by filtering water and reducing pathogens that could cause disease (Cullen-Unsworth & Unsworth, 2018).
Water Quality
Coastal wetlands improve the water quality of watersheds by filtering chemicals, particles (including microplastics), sediment, and cycling nutrients (Unsworth et al. 2022). There is even evidence that wetlands can remove viruses and bacteria from water, leading to better sanitation and health for marine wildlife and humans (Lamb et al., 2017).
left_text_column_width
Risks
There are several risks associated with coastal wetland protection. Leakage, wherein protection in one region could prompt degradation of another, could reduce climate benefits (Renwick et al., 2015). Strict conservation of coastal wetlands could impact local economies, creating “poverty traps” if protection threatens livelihoods (McNally et al., 2011). Conservation projects also risk unequal distribution of benefits (Lang et al., 2023). In places where habitats are fragmented or existing infrastructure limits landward migration, even protected coastal wetlands are at risk of being lost with climate change (commonly known as “the coastal squeeze”; Borchert et al., 2018). Funding gaps risk reversal of climate benefits despite initial conservation efforts; most MPAs and PAs report a lack of funding (Balmford et al., 2004; Bruner et al., 2004). If coastal wetlands are subjected to human impacts that protection cannot prevent, such as upgradient nutrient pollution, there could also be a risk of increased GHG emissions (Feng et al., 2025) and ecosystem degradation.
left_text_column_width
Interactions with Other Solutions
Reinforcing
Other ecosystems often occur adjacent to areas of coastal wetlands, and the health of nearby ecosystems can be improved by the services provided by intact coastal wetlands (and vice versa).
left_text_column_width
Reducing food loss and waste and improving diets reduce demand for agricultural land. These solutions reduce pressure to convert coastal wetlands to agricultural use, easing expansion of PAs.
left_text_column_width
Competing
Mangrove deforestation can occur for fuel wood needs. Fuel wood sourced from mangroves could be replaced with wood sourced from other forested ecosystems.
left_text_column_width
Dashboard
Solution Basics
ha protected
t CO₂-eq (100-yr)/unit/yr
07.647.88
units
Current 2.94×10⁶
07.85×10⁶1.1×10⁷
Achievable (Low to High)
Climate Impact
Gt CO₂-eq (100-yr)/yr
Current 0.02
0.06
US$ per t CO₂-eq
1
Emergency Brake
CO₂
Solution Basics
ha protected
t CO₂-eq (100-yr)/unit/yr
04.384.78
units
Current 1.24×10⁶
03.75×10⁶5.25×10⁶
Achievable (Low to High)
Climate Impact
Gt CO₂-eq (100-yr)/yr
Current 0.01
0.020.03
US$ per t CO₂-eq
2
Emergency Brake
CO₂
Solution Basics
ha protected
t CO₂-eq (100-yr)/unit/yr
03.153.56
units
Current 3.86×10⁶
01.57×10⁷2.2×10⁷
Achievable (Low to High)
Climate Impact
Gt CO₂-eq (100-yr)/yr
Current 0.01
0.060.08
US$ per t CO₂-eq
-6
Emergency Brake
CO₂
Trade-offs
Trade-offs associated with protection of coastal wetlands include emission of other GHGs not quantified in this solution that have higher global warming potentials (GWP) than CO₂. Methane and nitrous oxide emissions can be measurable in coastal wetland ecosystems, though it is important to recognize that degradation can significantly impact the magnitude and types of effluxes, too. In mangroves, methane evasion can offset carbon burial by almost 20% based on a 20-yr GWP (Rosentreter et al., 2018). In seagrasses, methane and nitrous oxide effluxes can offset burial on average, globally, by 33.4% based on a 20-yr GWP and 7.0% based on a 100-yr GWP (Eyre et al., 2023). Finally, conservation of coastal land can also restrict development of desirable coastal property for other uses.
left_text_column_width
Action Word
Protect
Solution Title
Coastal Wetlands
Classification
Highly Recommended
Lawmakers and Policymakers
- Grant Indigenous communities full property rights and autonomy; support them in monitoring, managing, and enforcing MPAs/PAs/IPLs.
- Ensure effective enforcement and monitoring of existing PAs using real-time and satellite data, if available.
- Create or strengthen legislative protections for coastal wetlands, requiring their consideration during land use planning and allowing for local decision-making.
- Start expanding PAs by first designating coastal wetlands adjacent to existing MPAs/PAs/IPLs.
- Increase designated PAs and MPAs and consider all benefits (e.g., climate, human well-being, biodiversity) and dynamics (e.g., water flows, soil, agriculture) when designating PAs to ensure maximum benefits.
- Ensure PAs and MPAs don’t displace, violate rights, or reduce access to vital resources for local and Indigenous communities.
- Classify and map coastal wetlands and tidal information; create local, national, and international standards for classification.
- Integrate river, watershed, and dam management into coastal wetland protection.
- Streamline regulations and legal requirements, when possible to simplify management and designation of MPAs/PAs/IPLs.
- Use financial incentives such as subsidies, tax breaks, payments for ecosystem services (PES), and debt-for-nature swaps to protect coastal wetlands from development.
- Conduct proactive land-use planning to avoid roads and other development projects that might interfere with MPAs and PAs.
- Coordinate MPA and PA efforts horizontally (e.g., across agencies) and vertically (e.g., across subnational, national, and international efforts), ensuring an inclusive process for local and Indigenous communities.
- Incorporate MPAs/PAs/IPLs into local, national, and international climate plans (i.e., Nationally Determined Contributions).
- Work with insurance companies to reduce insurance premiums for properties that protect or maintain coastal wetlands.
- Create processes for legal grievances, dispute resolution, and restitution.
- Create sustainable use regulations for protected coastal wetland areas that provide resources to local communities.
- Empower local communities to manage coastal wetlands and ensure a participatory approach to designating and managing MPAs and PAs.
- Create education programs that educate the public on MPA regulations, the benefits of coastal wetlands, and how to use resources sustainably.
- Join, support, or create certification schemes for sustainable management of coastal wetlands.
Further information:
- Advancing coastal wetlands conservation. Pew Charitable Trust (n.d.)
- Government relations and public policy job function action guide. Project Drawdown (2022)
- Legal job function action guide. Project Drawdown (2022)
- Ocean, seas and coasts. UNEP (n.d.)
- Restoration and management of coastal wetlands. Climate Adapt (2023)
- What you can do to protect coastal wetlands. U.S. EPA (2025)
Practitioners
- Avoid draining or degrading coastal wetlands.
- Avoid developing intact coastal wetlands, including small-scale shoreline developments such as docks.
- Invest in coastal wetland conservation, restoration, sustainable management practices, specialized research facilities, and other R&D efforts.
- Participate in stakeholder engagements and help policymakers designate coastal wetlands, create regulations, and implement robust monitoring and enforcement.
- Grant Indigenous communities full property rights and autonomy and support them in monitoring, managing, and enforcing PAs.
- Ensure protected coastal wetlands don’t displace, violate rights, or reduce access to vital resources for local and Indigenous communities.
- Integrate river, watershed, and dam management into coastal wetland protection.
- Use real-time monitoring and satellite data to manage and enforce PA and MPA regulations.
- Create sustainable use regulations for protected coastal wetland areas that provide resources to the local community.
- Conduct proactive land-use planning to avoid infrastructure or development projects that might interfere with protected coastal wetlands or incentivize drainage.
- Advocate for creating legal grievance processes, dispute resolution mechanisms, and restitution procedures for violations or disagreements over PAs and MPAs.
- Advocate for or use financial incentives such as subsidies, tax breaks, and PES to protect coastal wetlands from development.
- Utilize financial mechanisms such as biodiversity offsets, PES, high-integrity voluntary carbon markets, and debt-for-nature swaps to fund coastal wetland protection.
- Help classify and map coastal wetlands and tidal information as well as create local, national, and international standards for classification.
- Coordinate PA and MPA efforts horizontally (e.g., across agencies) and vertically (e.g., across subnational, national, and international efforts), ensuring an inclusive process for local and Indigenous communities.
- Work with insurance companies to reduce insurance premiums for properties that protect or maintain coastal wetlands.
- Join, support, or create certification schemes for sustainable management of coastal wetlands.
- Create education programs that educate the public on MPA/PA/IPL regulations, the benefits of coastal wetlands, and how to use resources sustainably.
Further information:
- Advancing coastal wetlands conservation. Pew Charitable Trust (n.d.)
- Ocean, seas and coasts. UNEP (n.d.)
- Restoration and management of coastal wetlands. Climate Adapt (2023)
- What you can do to protect coastal wetlands. U.S. EPA (2025)
Business Leaders
- Ensure operations, development, and supply chains are not degrading coastal wetlands or interfering with PA or MPA management.
- Integrate coastal wetland protection into net-zero strategies, if relevant.
- Help revise existing or create new high-integrity carbon markets, institutions, rules, and norms to cultivate the demand for high-quality carbon credits.
- Only purchase carbon credits from high-integrity, verifiable carbon markets, and do not use them as replacements for less carbon-intensive operations or claim them as offsets.
- Consider donating to established coastal wetland protection funds in place of carbon credits.
- Take advantage of financial incentives such as subsidies, tax breaks, and PES to coastal wetlands from development.
- Amplify the voices of local communities and civil society to promote robust media coverage.
- Invest in and support Indigenous and local communities' capacity for management, legal protection, and public relations.
- Leverage political influence to advocate for stronger coastal wetland protection policies at national and international levels.
- Conduct proactive land-use planning to avoid roads and other development projects that might interfere with PAs and MPAs or incentivize deforestation.
- Join, support, or create certification schemes for sustainable management of coastal wetlands.
Further information:
- Advancing coastal wetlands conservation. Pew Charitable Trust (n.d.)
- Climate solutions at work. Project Drawdown (2021)
- Drawdown-aligned business framework. Project Drawdown (2021)
- Ocean, seas and coasts. UNEP (n.d.)
- Restoration and management of coastal wetlands. Climate Adapt (2023)
- What you can do to protect coastal wetlands. U.S. EPA (2025)
Nonprofit Leaders
- Advocate for enhanced enforcement of existing MPAs/PAs/IPLs, expansion of new MPAs/PAs/IPLs, and more public investments.
- Help manage and monitor protected coastal wetlands using real-time monitoring and satellite data.
- Provide financial support for MPAs/PAs/IPLs, monitoring, and enforcement.
- Help conduct proactive land-use planning to avoid infrastructure or development projects that might interfere with protected coastal wetlands or incentivize drainage.
- Advocate for creating legal grievance processes, dispute resolution mechanisms, and restitution procedures for violations or disagreements over PAs or MPAs.
- Help revise existing or create new high-integrity carbon markets, institutions, rules, and norms to cultivate the demand for high-quality carbon credits.
- Amplify the voices of local communities and civil society to promote robust media coverage.
- Invest in and support the capacity of Indigenous and local communities for management, legal protection, and public relations.
- Use or advocate for financial incentives such as subsidies, tax breaks, and PES to protect coastal wetlands from development.
- Help classify and map coastal wetlands and tidal information as well as create local, national, and international standards for classification.
- Work with insurance companies to reduce insurance premiums for properties that protect or maintain coastal wetlands.
- Join, support, or create certification schemes for sustainable management of coastal wetlands.
- Create education programs that educate the public on MPA/PA/IPL regulations, the benefits of coastal wetlands, and how to use resources sustainably.
Further information:
- Advancing coastal wetlands conservation. Pew Charitable Trust (n.d.)
- Ocean, seas and coasts. UNEP (n.d.)
- Restoration and management of coastal wetlands. Climate Adapt (2023)
- What you can do to protect coastal wetlands. U.S. EPA (2025)
Investors
- Ensure investment portfolios do not degrade coastal wetlands or interfere with MPAs/PAs/IPLs, using data, information, and the latest technology to inform investments.
- Invest in coastal wetland protection, monitoring, management, and enforcement mechanisms.
- Use financial mechanisms such as credible biodiversity offsets, PES, voluntary high-integrity carbon markets, and debt-for-nature swaps to fund coastal wetland protection.
- Invest in and support Indigenous and local communities' capacity for legal protection and public relations.
- Share data, information, and investment frameworks that successfully avoid investments that drive coastal wetland destruction with other investors and nongovernmental organizations.
- Provide favorable loans to Indigenous communities and entrepreneurs and businesses protecting wetlands.
- Join, support, or create certification schemes for sustainable management of coastal wetlands.
Further information:
- Advancing coastal wetlands conservation. Pew Charitable Trust (n.d.)
- Ocean, seas and coasts. UNEP (n.d.)
- Restoration and management of coastal wetlands. Climate Adapt (2023)
- What you can do to protect coastal wetlands. U.S. EPA (2025)
Philanthropists and International Aid Agencies
- Advocate for enhanced enforcement of existing MPAs/PAs/IPLs, expansion of new MPAs/PAs/IPLs, and public investments.
- Help manage and monitor protected coastal wetlands, using real-time monitoring and satellite data.
- Provide technical and financial assistance to low- and middle-income countries and communities to protect coastal wetlands.
- Provide financial support to organizations and institutions developing and deploying monitoring technology and conducting wetland research.
- Help manage and monitor protected coastal wetlands using real-time monitoring and satellite data.
- Help conduct proactive land-use planning to avoid infrastructure or development projects that might interfere with protected coastal wetlands or incentivize drainage.
- Help revise existing or create new high-integrity carbon markets, institutions, rules, and norms to cultivate the demand for high-quality carbon credits.
- Amplify the voices of local communities and civil society to promote robust media coverage.
- Invest in and support Indigenous and local communities' capacity for management, legal protection, and public relations.
- Advocate for creating legal grievance processes, dispute resolution mechanisms, and restitution procedures for violations or disagreements over PAs or MPAs.
- Help classify and map coastal wetlands and tidal information as well as create local, national, and international standards for classification.
- Work with insurance companies to reduce insurance premiums for properties that protect or maintain coastal wetlands.
- Join, support, or create certification schemes for sustainable management of coastal wetlands.
- Create education programs that educate the public on MPA/PA/IPL regulations, the benefits of coastal wetlands, and how to use resources sustainably.
Further information:
- Advancing coastal wetlands conservation. Pew Charitable Trust (n.d.)
- Ocean, seas and coasts. UNEP (n.d.)
- Restoration and management of coastal wetlands. Climate Adapt (2023)
- What you can do to protect coastal wetlands. U.S. EPA (2025)
Thought Leaders
- Advocate for enhanced enforcement of existing MPAs/PAs/IPLs, expansion of new MPAs/PAs/IPLs, and for public investments.
- Advocate for or use financial incentives such as subsidies, tax breaks, PES, and debt-for-nature swaps to protect coastal wetlands from development.
- Help manage and monitor protected coastal wetlands using real-time monitoring and satellite data.
- Help conduct proactive land-use planning to avoid infrastructure or development projects that might interfere with protected coastal wetlands or incentivize drainage.
- Advocate for creating legal grievance processes, dispute resolution mechanisms, and restitution procedures for violations or disagreements over PAs or MPAs.
- Help revise existing or create new high-integrity carbon and biodiversity markets, institutions, rules, and norms to cultivate the demand for high-quality carbon credits.
- Amplify the voices of local communities and civil society to promote robust media coverage.
- Support Indigenous and local communities' capacity for legal protection, management, and public relations.
- Help classify and map coastal wetlands and tidal information as well as create local, national, and international standards for classification.
- Join, support, or create certification schemes for sustainable management of coastal wetlands.
- Create programs that educate the public on MPA/PA/IPL regulations, the benefits of coastal wetlands, and how to use resources sustainably.
Further information:
- Advancing coastal wetlands conservation. Pew Charitable Trust (n.d.)
- Ocean, seas and coasts. UNEP (n.d.)
- Restoration and management of coastal wetlands. Climate Adapt (2023)
- What you can do to protect coastal wetlands. U.S. EPA (2025)
Technologists and Researchers
- Study ecosystem services provided by coastal wetlands and catalogue the benefits.
- Improve mapping of coastal wetland areas, carbon content and dynamics, tidal impacts, degradation types and levels, and emissions data – specifically methane and nitrous oxide.
- Improve monitoring methods using field measurements, models, satellite imagery, and GIS tools.
- Research adjacent technologies and practices such as seaweed farm management, kelp forest conservation, sediment management, and biodiversity restoration.
- Conduct meta-analyses or synthesize existing literature on coastal wetlands and protection efforts.
- Explore ways to use smart management systems for PAs and MPAs, including the use of real-time and satellite data.
- Develop land-use planning tools that help avoid infrastructure or development projects that might interfere with PAs and MPAs or incentivize drainage.
- Create tools for local communities to monitor coastal wetlands, such as mobile apps, e-learning platforms, and mapping tools.
- Develop verifiable carbon credits using technology such as blockchain to improve the integrity of carbon markets.
- Develop supply chain tracking software for investors and businesses seeking to create sustainable portfolios and products.
Further information:
- Advancing coastal wetlands conservation. Pew Charitable Trust (n.d.)
- Ocean, seas and coasts. UNEP (n.d.)
- Restoration and management of coastal wetlands. Climate Adapt (2023)
- What you can do to protect coastal wetlands. U.S. EPA (2025)
Communities, Households, and Individuals
- Avoid draining or degrading coastal wetlands.
- Avoid developing intact coastal wetlands, including small-scale shoreline developments such as docks.
- Help manage and monitor protected coastal wetlands using real-time monitoring and satellite data.
- Establish coordinating bodies for farmers, developers, landowners, policymakers, dam operators, and other stakeholders to holistically manage PAs.
- Advocate for enhanced enforcement of existing MPAs/PAs/IPLs, expansion of new MPAs/PAs/IPLs, and public investments.
- Help conduct proactive land-use planning to avoid infrastructure or development projects that might interfere with protected coastal wetlands or incentivize drainage.
- Advocate for creating legal grievance processes, dispute resolution mechanisms, and restitution procedures for violations or disagreements over PAs or MPAs.
- Help revise existing or create new high-integrity carbon and biodiversity markets, institutions, rules, and norms to cultivate the demand for high-quality carbon credits.
- Support Indigenous communities' capacity for management, legal protection, and public relations.
- Use or advocate for financial incentives such as subsidies, tax breaks, and PES to protect coastal wetlands from development.
- Help classify and map coastal wetlands and tidal information as well as create local, national, and international standards for classification.
- Ensure PAs and MPAs don’t displace, violate rights, or reduce access to vital resources for local and Indigenous communities.
- Work with insurance companies to reduce insurance premiums for properties that protect or maintain coastal wetlands.
- Participate or volunteer in local coastal wetland protection efforts.
- Plant native species to help improve the local ecological balance and stabilize the soil – especially on waterfront property.
- Use nontoxic cleaning and gardening supplies, purchase unbleached paper products, and recycle to help keep pollution and debris out of wetlands.
- Join, support, or create certification schemes for sustainable management of coastal wetlands.
- Create education programs that educate the public on MPA/PA/IPL regulations, the benefits of coastal wetlands, and how to use resources sustainably.
Further information:
- Advancing coastal wetlands conservation. Pew Charitable Trust (n.d.)
- Ocean, seas and coasts. UNEP (n.d.)
- Restoration and management of coastal wetlands. Climate Adapt (2023)
- What you can do to protect coastal wetlands. U.S. EPA (2025)
Sources
- Coastal wetlands and climate change in Ghana: Analysis of the regulatory framework. Agyare et al. (2024)
- Complementary approaches to planning a restored coastal wetland and assessing the role of agriculture and biodiversity: An applied case study in southern Italy. Bernadette Cammerino et al. (2024)
- Experience and future research trends of wetland protection and restoration in China. Jiang et al. (2024)
- Governance of coastal wetlands: Beyond the community conservation paradigm. De Oliveira et al. (2024)
- Identifying priorities for reform to integrate coastal wetland ecosystem services into law and policy. Bell-James (2023)
- Legal protection of coastal wetlands: A case study of Mediterranean Sea. Alsamara et al. (2024)
- Policies in coastal wetlands: Key challenges. Velez et al. (2018)
- The transformation of 40-year coastal wetland policies in China: Network analysis and text analysis. Yang et al. (2022)
- What you can do to protect coastal wetlands. U.S. EPA (2025)
Evidence Base
Consensus of effectiveness in sequestering carbon from coastal wetlands: High
There is high scientific consensus that coastal wetland protection is an important strategy for reducing wetland loss due to degradation and that degradation results in carbon stock loss from coastal wetlands. Rates of wetland loss are generally lower inside PAs than outside them. An analysis of over 4,000 PAs (wetland and non-wetland area) showed 59% of sites are in “sound management,” which generally reflects PAs with strong enforcement, management implementation, and conservation outcome indicators (Leverington et al., 2010). Here we used a conservative effectiveness of 59% for salt marshes and mangroves that are under legal protection, consistent with the value from Leverington et al. (2010). Other regional studies show similar PA effectiveness values, with 25–50% of wetland PAs in China exhibiting moderate to very high conservation effectiveness (Lu et al., 2016).
Seagrasses differ from mangroves and salt marshes in that they fall under MPA designation because they are subtidal, or submerged. In an analysis of effectiveness of 66 MPAs in 18 countries, nearly 53% of MPAs reported positive or slightly positive ecosystem outcomes (Rodríguez-Rodríguez & Martínez-Vega, 2022). Less is known about MPA effectiveness for seagrass meadows specifically; we assumed an effectiveness of 53% – similar to other MPAs.
Prevention of degradation via legal coastal wetlands protection avoids emissions by preserving carbon stocks while also retaining carbon sequestration capacity. Degradation of coastal wetlands results in measurable loss of short- and long-lived carbon stocks, with emissions that vary based on ecosystem and degradation type (Donato et al., 2011, Holmquist et al., 2023, Lovelock et al., 2017, Mcleod et al., 2011, Pendleton et al., 2012). Estimates of existing carbon stocks in coastal wetlands are substantial, ranging between 8.97–32.7 Gt of carbon (32.9–120 Gt CO₂‑eq ), most of which is likely susceptible to degradation (Macreadie et al., 2021).
The results presented in this document synthesize findings from 14 global datasets. We recognize that geographic bias in the information underlying global data products creates bias and hope this work inspires research and data sharing on this topic in underrepresented regions and understudied ecosystems.
left_text_column_width
Appendix
In this analysis, we integrated global land cover data; shapefiles of PAs, MPAs, and IPLs; and ecosystem type (mangroves, salt marshes, seagrasses) data on carbon emissions and sequestration rates to calculate currently protected coastal wetland area, total global coastal wetland area, and avoided emissions and additional sequestration from coastal wetland protection by ecosystem type (mangroves, salt marshes, and seagrasses).
Land Cover Data
We used two land cover data products to estimate coastal wetland extent by ecosystem type (mangroves, salt marshes, seagrasses) inside and outside of PAs, MPAs, and IPLs: 1) a global 30 m wetland map, GWL_FCS30, for mangroves and salt marshes (Zhang et al., 2023), and 2) the global distribution of seagrasses map from UN Environment World Conservation Monitoring Centre (UNEP-WCMC & Short, 2021).
Protected Coastal Wetland Areas
The IUCN defines PAs, including MPAs, as geographically distinct areas managed primarily for the long-term conservation of nature and ecosystem services. They are further disaggregated into six levels of protection, ranging from strict wilderness preserves to sustainable use areas that allow for some natural resource extraction (including logging). We calculated all levels of protection but only considered protection categories I–IV in our analysis of adoption. We recognized that other protection categories might provide conservation benefits. We excluded categories labeled as “Not Applicable (NAP),” “Not Reported (NR),” “Not Assigned (NAS),” as well as categories VI and VII. We also estimated IPL area based on available data, but emphasized that much of their extent has not been fully mapped nor recognized for its conservation benefits (Garnett et al., 2018). Additionally, the IPL dataset only covered land and therefore did not include seagrass ecosystems explicitly beyond the extent that ecosystems bordering terrestrial IPL areas were captured within the 1 km pixels of analysis. Coastal wetlands also lack data on the effectiveness of protection with IPLs, so we did not include IPL data as currently protected in our estimates.
We identified protected coastal wetland areas using the World Database on PAs (UNEP-WCMC & IUCN, 2024), which contains boundaries for each PA or MPA and additional information, including their establishment year and IUCN management category (Ia to VI, NAP, NR, and NAS). For each PA or MPA polygon, we extracted the coastal wetland area based on the datasets in section 1. Our spatial analysis required the center point of the pixel of each individual ecosystem under consideration to be covered by the PA or MPA polygon in order to be classified as protected, which is a relatively strict spatial extraction technique that likely leads to lower estimates of conservation compared to previous work with differing techniques (Dabalà et al., 2023).
We used the maps of IPLs from Garnett et al. (2018) to identify IPLs that were not inside of established PAs. We calculated the total coastal wetland area within IPLs (excluding PAs and MPAs) using the same coastal wetland data sources.
Coastal Wetland Loss, Additional Sequestration, and Emissions Factors
We aggregated coastal wetland loss rates by ecosystem type (mangroves, salt marshes, seagrasses). We used data on PA and MPA effectiveness to calculate the difference in coastal wetland loss rates attributable to protection (Equation S1). We compiled baseline estimates of current rates of coastal wetland degradation from all causes (%/yr)from existing literature as shown in the “Detailed coastal wetland loss data” tab of the Supporting Data spreadsheet and used in conjunction with estimates of reductions in loss, 53–59%, associated with protection.
Equation S1.
Wetland lossavoided = Wetland lossbaseline ✕ Reduction in loss
We then used the ratio of coastal wetland loss in unprotected areas versus PAs to calculate avoided CO₂ emissions and additional carbon sequestration for each adoption unit. Specifically, we estimated the carbon benefits of avoided coastal wetland loss by multiplying avoided coastal wetland loss by avoided CO₂ emissions (30-yr time horizon; Equation S2) and carbon sequestration rates (30-yr time horizon; Equation S3) for each ecosystem type. Importantly, the emissions factors we used account for carbon in above- and below-ground biomass and generally do not assume 100% loss of carbon stocks because many land use impacts may retain some stored carbon, some of which is likely resistant to degradation (see the “2. current state effectiveness tab” in the spreadsheet for more information). We derived our estimates of retained carbon sequestration from global databases on sediment organic carbon burial rates in each ecosystem (see the “2. current state effectiveness tab” in the spreadsheet for more information).
Equation S2.
Avoided emissions = Wetland lossavoided t=130(Emissions)
Equation S3.
Sequestration = Wetland lossavoided t=130(Sequestration)
We then estimated effectiveness (Equation S4) as the avoided CO₂ emissions and the retained carbon sequestration capacity attributable to the reduction in wetland loss conferred by protection estimated in Equations S1–S3.
Equation S4.
Effectiveness = (Wetland lossavoided) * (Carbonavoided emissions+ Carbonsequestration)
Finally, we calculated climate impact (Equation S5) by multiplying the adoption area under consideration by the estimated effectiveness from Equation S4.
Equation S5.
Climate Impact = (Effectiveness) * (Adoption )
Appendix References
Garnett, S. T., Burgess, N. D., Fa, J. E., Fernández-Llamazares, Á., Molnár, Z., Robinson, C. J., Watson, J. E. M., Zander, K. K., Austin, B., Brondizio, E. S., Collier, N. F., Duncan, T., Ellis, E., Geyle, H., Jackson, M. V., Jonas, H., Malmer, P., McGowan, B., Sivongxay, A., & Leiper, I. (2018). A spatial overview of the global importance of Indigenous lands for conservation. Nature Sustainability, 1(7), 369–374. https://doi.org/10.1038/s41893-018-0100-6
UNEP-WCMC, & Short, F. T. (2021). Global distribution of seagrasses (version 7.1) [Data set]. UN Environment World Conservation Monitoring Centre. https://doi.org/10.34892/x6r3-d211
UNEP-WCMC, & IUCN. (2024). Protected planet: The world database on protected areas (WDPA) and world database on other effective area-based conservation measures (WD-OECM) [Data set]. Retrieved November 2024, from https://www.protectedplanet.net
Zhang, X., Liu, L., Zhao, T., Chen, X., Lin, S., Wang, J., Mi, J., & Liu, W. (2023). GWL_FCS30: a global 30 m wetland map with a fine classification system using multi-sourced and time-series remote sensing imagery in 2020. Earth System Science Data, 15(1), 265–293. https://doi.org/10.5194/essd-15-265-2023
left_text_column_width
Updated Date
Protect Grasslands & Savannas
Mode
Cut Emissions
Cluster
Protect & Manage Ecosystems
Image
Image
Coming Soon
On
Action Word
Protect
Solution Title
Grasslands & Savannas
Classification
Highly Recommended
Updated Date
Reduce Food Loss & Waste
Mode
Cut Emissions
Cluster
Curb Growing Demands
Image
Image
Coming Soon
On
Summary
More than one-third of all food produced for human consumption is lost or wasted before it can be eaten. This means that the GHGs emitted during the production and distribution of that particular food – including emissions from agriculture-related deforestation and soil management, methane emissions from livestock and rice production, and nitrous oxide emissions from fertilizer management – are also wasted. This solution reduces emissions by lowering the amount of food and its associated emissions that are lost or wasted across the supply chain, from production through consumption.
Overview
The global food system, including land use, production, storage, and distribution, generates more than 25% of global GHG emissions (Poore and Nemecek, 2018). More than one-third of this food is lost or wasted before it can be eaten, with estimated associated emissions being recorded at 4.9 Gt CO₂‑eq/yr (our own calculation). FLW emissions arise from supply chain embodied emissions (i.e., the emissions generated from producing food and delivering to consumers). Reducing food loss and waste helps avoid the embodied emissions while simultaneously increasing food supply and reducing pressure to expand agricultural land use and intensity.
FLW occurs at each stage of the food supply chain (Figure 1). Food loss refers to the stages of production, handling, storage, and processing within the supply chain. Food waste occurs at the distribution, retail, and consumer stages of the supply chain.
Figure 1. GHG emissions occur at each stage of the food supply chain. Food loss occurs at the pre-consumer stages of the supply chain, whereas food waste occurs at the distribution, market, and consumption stages. Credit: Project Drawdown
Image
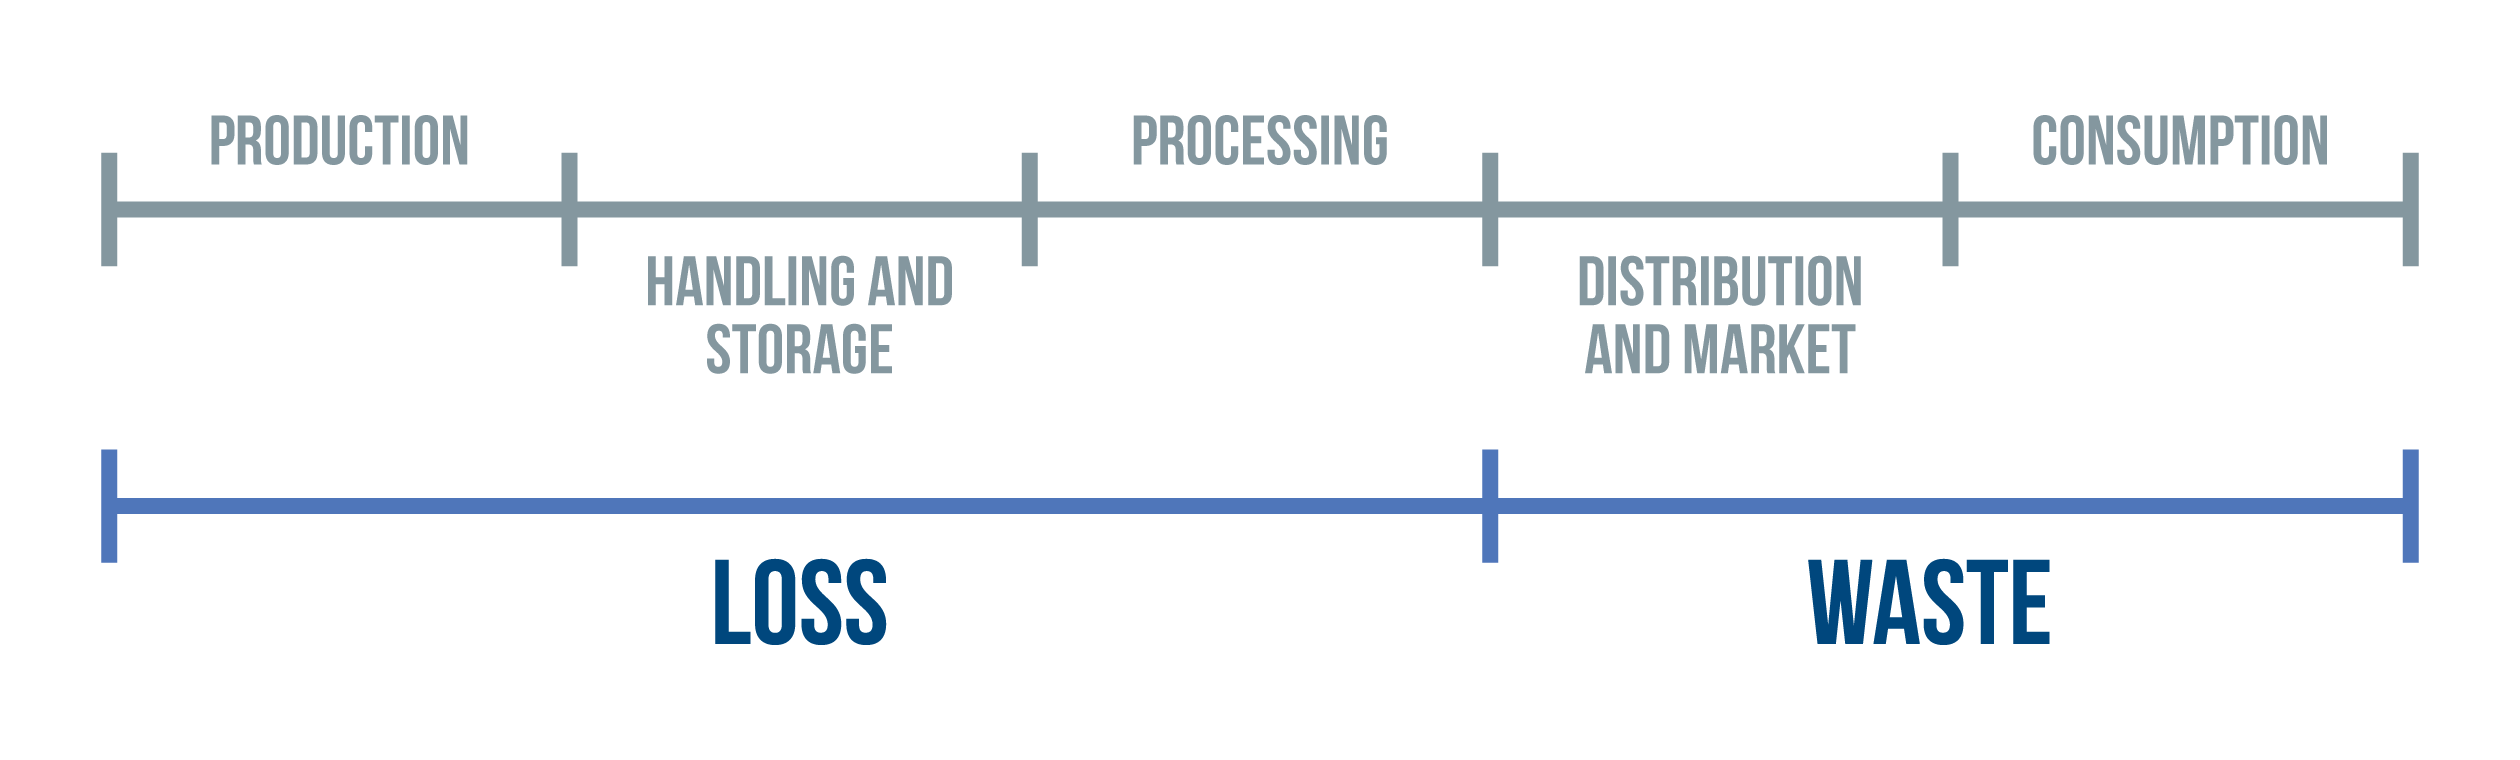
Food loss can be reduced through improved post-harvest management practices, such as increasing the number and storage capacity of warehouses, optimizing processes and equipment, and improving packaging to increase shelf life. Retailers can reduce food waste by improving inventory management, forecasting demand, donating unsold food to food banks, and standardizing date labeling. Consumers can reduce food waste by educating themselves, making informed purchasing decisions, and effectively planning meals. The type of interventions to reduce FLW will depend on the type(s) of food product, the supply chain stage(s), and the location(s).
When FLW cannot be prevented, organic waste can be managed in ways that limit its GHG emissions. Waste management is not included in this solution but is addressed in other Drawdown Explorer solutions (see Deploy Methane Digesters, Improve Landfill Management, and Increase Composting).
Almaraz, M., Houlton, B. Z., Clark, M., Holzer, I., Zhou, Y., Rasmussen, L., Moberg, E., Manaigo, E., Halpern, B. S., Scarborough, C., Lei, X. G., Ho, M., Allison, E., Sibanda, L., & Salter, A. (2023). Model-based scenarios for achieving net negative emissions in the food system. PLOS Clim 2(9). Link to source: https://doi.org/10.1371/journal.pclm.0000181
Amicarelli, V., Lagioia, G., & Bux, C. (2021). Global warming potential of food waste through the life cycle assessment: An analytical review. Environmental Impact Assessment Review, 91. Link to source: https://doi.org/10.1016/j.eiar.2021.106677
Anríquez, G., Foster, W., Santos Rocha, J., Ortega, J., Smolak, J., & Jansen, S. (2023). Reducing food loss and waste in the Near East and North Africa – Producers, intermediaries and consumers as key decision-makers. FAO. Link to source: https://doi.org/10.4060/cc3409en
Babiker, M., Blok, K., Cohen, B., Cowie, A., Geden, O., Ginzburg, V., Leip, A., Smith, P., Sugiyama, M., & Yamba, F. (2023). Cross-sectoral perspectives. In Shukla, P.R, and Skea, J., (Eds.), IPCC, 2022: Climate Change 2022: Mitigation of Climate Change (pp. 1235–1354). Cambridge University Press. Link to source: https://www.ipcc.ch/report/ar6/wg3/downloads/report/IPCC_AR6_WGIII_Chapter12.pdf
Byrne, F., Medina, M. K., Mosqueda, E., Salinas, E., Suarez Peña, A. C., Suarez, J. D., Raimondi, G., & Molina, M. (2024). Sustainability Impacts of Food Recovery & Redistribution Organizations. The Global FoodBanking Network. Link to source: https://www.foodbanking.org/resources/frame-methodology/
Cattaneo, A., Federighi, G., & Vaz, S. (2021). The environmental impact of reducing food loss and waste: A critical assessment. Food Policy, 98. Link to source: https://doi:10.1016/j.foodpol.2020.101890
Cattaneo, A., Sánchez, M. V., Torero, M., & Vos, R. (2021). Reducing food loss and waste: Five challenges for policy and research. Food Policy, 98. Link to source: https://doi.org/10.1016/j.foodpol.2020.101974
Chen, C., Chaudhary, A., & Mathys, A. (2020). Nutritional and environmental losses embedded in global food waste. Resources, Conservation and Recycling, 160. Link to source: https://doi.org/10.1016/j.resconrec.2020.104912
Creutzig, F., Niamir, L., Bai, X., Callaghan, M., Cullen, J., Díaz-José, J, Figueroa, M., Grubler, A., Lamb, W.F., Leip, A., Masanet, E., Mata, É., Mattauch, L., Minx, J., Mirasgedis, S., Mulugetta, Y., Nugroho, S.B., Pathak, M., Perkins, P., Roy, J., de la Rue du Can, S., Saheb, Y., Some, S., Steg, L., Steinberger, J., & Ürge-Vorsatz, D. (2021). Demand-side solutions to climate change mitigation consistent with high levels of well-being. Nature Climate Change, 12(1): 36-46. Link to source: https://doi.org/10.1038/s41558-021-01219-y
Crippa, M., Solazzo, E., Guizzardi, D., Monforti-Ferrario, F., Tubiello, F. N., & Leip, A. (2021). Food systems are responsible for a third of global anthropogenic GHG emissions. Nature Food, 2(3): 198-209. Link to source: https://doi.org/10.1038/s43016-021-00225-9
Davidenko, V., & Sweitzer, M. (2024). U.S. households that earn less spend a higher share of income on food. USDA Economic Research Service. Link to source: https://www.ers.usda.gov/data-products/charts-of-note/chart-detail?chartId=110391#:~:text=U.S.%20households%20were%20divided%20into,32.6%20percent%20of%20their%20income
de Gorter, H., Drabik, D., Just, D. R., Reynolds, C., & Sethi, G. (2021). Analyzing the economics of food loss and waste reductions in a food supply chain. Food Policy, 98. Link to source: https://doi.org/10.1016/j.foodpol.2020.101953
Delgado, L., Schuster, M., & Torero, M. (2021). Quantity and quality food losses across the value chain: A comparative analysis. Food Policy, 98. Link to source: https://doi.org/10.1016/j.foodpol.2020.101958
Eurostat (2024). Food waste and food waste prevention by NACE Rev. 2 activity [Dataset]. Link to source: https://ec.europa.eu/eurostat/databrowser/view/env_wasfw/default/table?lang=en&category=env.env_was.env_wasst
European Commission Knowledge Center for Bioeconomy (2024). EU Bioeconomy Monitoring System [Dataset]. Link to source: https://knowledge4policy.ec.europa.eu/bioeconomy/monitoring_en
Fabi, C., Cachia, F., Conforti, P., English, A., & Rosero Moncayo, J. (2021). Improving data on food losses and waste: From theory to practice. Food Policy, 98. Link to source: https://doi.org/10.1016/j.foodpol.2020.101934
Food and Agriculture Organization of the United Nations. (2014) Food wastage footprint: Full-cost accounting. Food and Agriculture Organization of the United Nations. Link to source: https://openknowledge.fao.org/server/api/core/bitstreams/6a266c4f-8493-471c-ab49-30f2e51eec8c/content
Food and Agriculture Organization of the United Nations. (2019). The State of Food and Agriculture 2019: Moving forward on food loss and waste reduction. Food and Agriculture Organization of the United Nations. Link to source: https://openknowledge.fao.org/server/api/core/bitstreams/11f9288f-dc78-4171-8d02-92235b8d7dc7/content
Food and Agriculture Organization of the United Nations. (2023). Tracking progress on food and agriculture-related SDG indicators 2023. Rome: Link to source: https://doi.org/10.4060/cc7088en
Food Waste Coalition of Action. (2024). Driving Emissions Down and Profit Up by Reducing Food Waste. The Consumer Goods Forum and AlixPartners. Retrieved from Link to source: https://www.theconsumergoodsforum.com/wp-content/uploads/2024/06/Driving-Emissions-Down-Profit-Up-By-Reducing-Food-Waste-FWReport2024-1.pdf
Gatto, A., & Chepeliev, M. (2024). Reducing global food loss and waste could improve air quality and lower the risk of premature mortality. Environmental Research Letters, 19(1). Link to source: https://doi.org/10.1088/1748-9326/ad19ee
Goossens, Y., Wegner, A., & Schmidt, T. (2019). Sustainability assessment of food waste prevention measures: Review of existing evaluation practices. Frontiers in Sustainable Food Systems, 3. Link to source: https://doi.org/10.3389/fsufs.2019.00090
Guo, X., Broeze, J., Groot, J. J., Axmann, H., & Vollebregt, M. (2020). A worldwide hotspot analysis on food loss and waste, associated greenhouse gas emissions, and protein losses. Sustainability, 12(18). https://doi.org/10.3390/su12187488
Hanson, C., & Mitchell, P. (2017). The Business Case for Reducing Food Loss and Waste. Link to source: https://champions123.org/sites/default/files/2020-08/business-case-for-reducing-food-loss-and-waste.pdf
Hanson, C., Flanagan, K., Robertson, K., Axmann, H., Bos-Brouwers, H., Broeze, J., Kneller, C., Maier, D., McGee, C., O’Connor, C., Sonka, S., Timmermans, T., Vollebregt, M., Westra, E. (2019). Reducing Food Loss and Waste: Ten Interventions to Scale Impact. Washington DC: World Resources Institute. Retrieved from: Link to source: https://www.wri.org/reducing-food-loss-and-waste-ten-interventions-scale-impact
Hegnsholt, E., Unnikrishnan, S., Pollmann-Larsen, M., Askelsdottir, B., & Gerard, M. (2018). Tackling the 1.6-billion-ton food loss and waste crisis. The Boston Consulting Group, Food Nation, State of Green. Link to source: https://web-assets.bcg.com/img-src/BCG-Tackling-the-1.6-Billion-Ton-Food-Waste-Crisis-Aug-2018%20%281%29_tcm9-200324.pdf
Hegwood, M., Burgess, M. G., Costigliolo, E. M., Smith, P., Bajzelj, B., Saunders, H., & Davis, S. J. (2023). Rebound effects could offset more than half of avoided food loss and waste. Nat Food, 4(7): 585-595. Link to source: https://doi.org/10.1038/s43016-023-00792-z
Jaglo, K., Kelly, S., & Stephenson, J. (2021). From Farm to Kitchen: The Environmental Impacts of U.S. Food Waste. US Environmental Protection Agency. Link to source: https://www.epa.gov/land-research/farm-kitchen-environmental-impacts-us-food-waste
Karl, K., Tubiello, F. N., Crippa, M., Poore, J., Hayek, M. N., Benoit, P., Chen, M., Corbeels, M., Flammini, A., Garland, S., Leip, A., McClelland, S., Mencos Contreras, E., Sandalow, D., Quadrelli, R., Sapkota, T., and Rosenzweig, C. (2024). Harmonizing food systems emissions accounting for more effective climate action. Environmental Research: Food Systems, 2(1). Link to source: https://doi.org/10.1088/2976-601X/ad8fb3
Kenny, S. (2025). Estimating the Cost of Food Waste to American Consumers. (No. EPA/600/R25-048). U.S. Environmental Protection Agency Office of Research and Development. Link to source: https://www.epa.gov/system/files/documents/2025-04/costoffoodwastereport_508.pdf
Kenny, S., Stephenson, J., Stern, A., Beecher, J., Morelli, B., Henderson, A., Chiang, E., Beck, A., Cashman, S., Wexler, E., McGaughy, K., & Martell, A. (2023). From Field to Bin: The Environmental Impact of U.S. Food Waste Management Pathways (No. EPA/600/R-23/065). U.S. Environmental Protection Agency Office of Research and Development. Link to source: https://www.epa.gov/land-research/field-bin-environmental-impacts-us-food-waste-management-pathways
Kummu, M., De Moel, H., Porkka, M., Siebert, S., Varis, O., & Ward, P. J. (2012). Lost food, wasted resources: Global food supply chain losses and their impacts on freshwater, cropland, and fertiliser use. Science of The Total Environment, 438, 447-489. Link to source: https://doi.org/10.1016/j.scitotenv.2012.08.092
Lipinski, B. (2024). SDG target 12.3 on food loss and waste: 2024 progress report. Champions 12.3. Link to source: https://champions123.org/sites/default/files/2024-09/champions-12-3-2024-progress-report.pdf
Mbow, C., C. Rosenzweig, L.G. Barioni, T.G. Benton, M. Herrero, M. Krishnapillai, E. Liwenga, P. Pradhan, M.G. Rivera-Ferre, T. Sapkota, F.N. Tubiello, Y. Xu, (2019). Food Security. In P.R. Shukla, J. Skea, E. Calvo Buendia, V. Masson-Delmotte, H.-O. Pörtner, D.C. Roberts, P. Zhai, R. Slade, S. Connors, R. van Diemen, M. Ferrat, E. Haughey, S. Luz, S. Neogi, M. Pathak, J. Petzold, J. Portugal Pereira, P. Vyas, E. Huntley, K. Kissick, M. Belkacemi, J. Malley, (Eds.), Climate Change and Land: an IPCC special report on climate change, desertification, land degradation, sustainable land management, food security, and greenhouse gas fluxes in terrestrial ecosystems . Cambridge University Press. Link to source: https://www.ipcc.ch/srccl/chapter/chapter-5/
Marston, L. T., Read, Q. D., Brown, S. P., & Muth, M. K. (2021). Reducing water scarcity by reducing food loss and waste. Frontiers in Sustainable Food Systems, 5. Link to source: https://doi.org/10.3389/fsufs.2021.651476
Moraes, N. V., Lermen, F. H., & Echeveste, M. E. S. (2021). A systematic literature review on food waste/loss prevention and minimization methods. Journal of Environmental Management, 286. Link to source: https://doi.org/10.1016/j.jenvman.2021.112268
Nabuurs, G.-J., Mrabet, R., Hatab, A. A., Bustamante, M., Clark, H., Havlík, P., House, J., Mbow, C., Ninan, K. N., Popp, A., Roe, S., Sohngen, B., and Towprayoon, S. (2022). Agriculture, Forestry and Other Land Uses (AFOLU). In P. R. Shukla, J. Skea, R. Slade, A. A. Khourdajie, R. v. Diemen, D. McCollum, M. Pathak, S. Some, P. Vyas, R. Fradera, M. Belkacemi, A. Hasija, G. Lisboa, S. Luz, & J. Malley (Eds.), Climate Change 2022: Mitigation of Climate Change. Contribution of Working Group III to the Sixth Assessment Report of the Intergovernmental Panel on Climate Change (1st ed, pp. 747-860). . Cambridge, UK and New York, NY, USA: Cambridge University Press. Link to source: https://doi.org/10.1017/9781009157926.009
Neff, R. A., Kanter, R., & Vandevijvere, S. (2015). Reducing food loss and waste while improving the public’s health. Health Affairs, 34(11): 1821-1829. Link to source: https://doi.org/10.1377/hlthaff.2015.0647
Nutrition Connect. (2023). Reducing Waste from Farm to Plate: A Multi-Stakeholder Recipe to Reduce Food Loss and Waste. Global Alliance for Improved Nutrition (GAIN). Link to source: https://nutritionconnect.org/news-events/reducing-food-loss-waste-farm-plate-stakeholder-recipe-compendium
Poore, J., & Nemecek, T. (2018). Reducing food’s environmental impacts through producers and consumers. Science, 360(6392): 987-992. Link to source: https://doi.org/10.1126/science.aaq0216
Porter, S. D., Reay, D. S., Higgins, P., & Bomberg, E. (2016). A half-century of production-phase greenhouse gas emissions from food loss & waste in the global food supply chain. Science of the Total Environment, 571: 721-729. Link to source: https://doi.org/10.1016/j.scitotenv.2016.07.041
Read, Q. D., Brown, S., Cuellar, A. D., Finn, S. M., Gephart, J. A., Marston, L. T., Meyer, E., Weitz, K.A., & Muth, M. K. (2020). Assessing the environmental impacts of halving food loss and waste along the food supply chain. Sci Total Environ, 712. Link to source: https://doi.org/10.1016/j.scitotenv.2019.136255
Read, Q. D., & Muth, M. K. (2021). Cost-effectiveness of four food waste interventions: Is food waste reduction a “win–win?”. Resources, Conservation and Recycling, 168. Link to source: https://doi.org/10.1016/j.resconrec.2021.105448
ReFED. (2024). The Methane Impact of Food Loss and Waste in the United States. Link to source: https://refed.org/uploads/refed-methane-report-final.pdf
Reynolds, C., Goucher, L., Quested, T., Bromley, S., Gillick, S., Wells, V. K., Evans, D., Koh, L., Carlsson Kanyama, A., Katzeff, C., Svenfelt, A., & Jackson, P. (2019). Review: Consumption-stage food waste reduction interventions – What works and how to design better interventions. Food Policy, 83: 7-27. Link to source: https://doi.org/10.1016/j.foodpol.2019.01.009
Rolker, H., Eisler, M., Cardenas, L., Deeney, M., & Takahashi, T. (2022). Food waste interventions in low-and-middle-income countries: A systematic literature review. Resources, Conservation and Recycling, 186. Link to source: https://doi.org/10.1016/j.resconrec.2022.106534
Searchinger, T., Waite, R., Hanson, C., & Ranganathan, J. (2019). Creating a Sustainable Food Future. World Resources Institute. https://research.wri.org/sites/default/files/2019-07/WRR_Food_Full_Report_0.pdf
Sheahan, M., & Barrett, C. B. (2017). Review: Food loss and waste in Sub-Saharan Africa. Food Policy, 70: 1-12. Link to source: https://doi.rog/10.1016/j.foodpol.2017.03.012
Kaza, Silpa, Lisa Yao, Perinaz Bhada-Tata, and Frank Van Woerden (2018). What a Waste 2.0: A Global Snapshot of Solid Waste Management to 2050. Urban Development Series. Washington, DC: World Bank. doi:10.1596/978-1-4648 -1329-0. License: Creative Commons Attribution CC BY 3.0 IGO
Swannell, R., Falconer Hall, M., Tay, R., & Quested, T. (2019). The food waste atlas: An important tool to track food loss and waste and support the creation of a sustainable global food system. Resources, Conservation and Recycling, 146: 534-545. Link to source: https://doi.org/10.1016/j.resconrec.2019.02.006
Thi, N. B. D., Kumar, G., & Lin, C.-Y. (2015). An overview of food waste management in developing countries: Current status and future perspective. Journal of Environmental Management, 157: 220-229. Link to source: https://doi.org/10.1016/j.jenvman.2015.04.022
Tubiello, F. N., Karl, K., Flammini, A., Gütschow, J., Obli-Laryea, G., Conchedda, G., Pan, X., Qi, S. Y., Halldórudóttir Heiðarsdóttir, H., Wanner, N., Quadrelli, R., Rocha Souza, L., Benoit, P., Hayek, M., Sandalow, D., Mencos Contreras, E., Rosenzweig, C., Rosero Moncayo, J., Conforti, P., & Torero, M. (2022). Pre- and post-production processes increasingly dominate greenhouse gas emissions from agri-food systems. Earth System Science Data, 14(4): 1795-1809. Link to source: https://doi.org/10.5194/essd-14-1795-2022
UNEP. (2024). Food Waste Index Report 2024. Think Eat Save: Tracking Progress to Halve Global Food Waste. Link to source: https://wedocs.unep.org/xmlui/handle/20.500.11822/45230
U.S. Food and Drug Administration. (2019). Food Facts: How to Cut Food Waste and Maintain Food Safety. Food and Drug Administration. Link to source: https://www.fda.gov/food/consumers/how-cut-food-waste-and-maintain-food-safety
WasteMAP | Home. (n.d.). Retrieved October 24, 2024, from Link to source: https://wastemap.earth/
Wilson, N. L. W., Rickard, B. J., Saputo, R., & Ho, S.-T. (2017). Food waste: The role of date labels, package size, and product category. Food Quality and Preference, 55, 35-44. Link to source: https://doi.org/10.1016/j.foodqual.2016.08.004
World Bank. (2020). Addressing Food Loss and Waste: A Global Problem with Local Solutions. World Bank. Link to source: https://openknowledge.worldbank.org/entities/publication/1564bf5c-ed24-5224-b5d8-93cd62aa3611
WRAP (2023). UK Food System Greenhouse Gas Emissions: Progress towards the Courtauld 2030 target. Link to source: https://www.wrap.ngo/sites/default/files/2024-05/WRAP-MIANZW-Annual-Progress-Summary-report-22-23-Variation-1-2024-04-30.pdf
WRAP (2024). UK Food System Greenhouse Gas Emissions: Progress towards the Courtauld 2030 target. https://www.wrap.ngo/sites/default/files/2024-12/WRAP-Courtauld-2030-GHG-2324.pdf
WWF-UK. (2021). Driven to waste: The Global Impact of Food Loss and Waste on Farms. Retrieved from Link to source: https://files.worldwildlife.org/wwfcmsprod/files/Publication/file/5p58sxloyr_technical_report_wwf_farm_stage_food_loss_and_waste.pdf
WWF-WRAP. (2020). Halving Food Loss and Waste in the EU by 2030: the major steps needed to accelerate progress. Retrieved from Link to source: https://www.wrap.ngo/resources/report/halving-food-loss-and-waste-eu-2030-major-steps-needed-accelerate-progress
Xue, L., Liu, G., Parfitt, J., Liu, X., Herpen, E. V., O’Connor, C., Östergren, K., & Cheng, S. 2017. Missing food, missing data? A critical review of global food losses and food waste data. Env Sci Technol. 51, 6618-6633. Link to source: https://doi.org/10.1021/acs.est.7b00401
Ziervogel, G., & Ericksen, P. J. (2010). Adapting to climate change to sustain food security. WIREs Climate Change, 1(4), 525-540. Link to source: https://doi.org/10.1002/wcc.56
Zhu, J., Luo, Z., Sun, T., Li, W., Zhou, W., Wang, X., Fei, X., Tong, H., & Yin, K. (2023). Cradle-to-grave emissions from food loss and waste represent half of total greenhouse gas emissions from food systems. Nature Food, 4(3), 247-256. Link to source: https://doi.org/10.1038/s43016-023-00710-3
Credits
Lead Fellows
Erika Luna
Aishwarya Venkat, Ph.D.
Contributors
Ruthie Burrows, Ph.D.
Emily Cassidy, Ph.D.
James Gerber, Ph.D.
Yusuf Jameel, Ph.D.
Daniel Jasper
Alex Sweeney
Eric Toensmeier
Paul C. West, Ph.D.
Internal Reviewers
Aiyana Bodi
Hannah Henkin
Megan Matthews, Ph.D.
Heather McDiarmid, Ph.D.
Ted Otte
Christina Swanson, Ph.D.
Paul C. West, Ph.D.
Effectiveness
Our analysis estimates that reducing FLW reduces emissions 2.82 t CO₂‑eq (100-yr basis) for every metric ton of food saved (Table 1). This estimate is based on selected country and global assessments from nongovernmental organizations (NGOs), public agencies, and development banks (ReFED, 2024; World Bank, 2020; WRAP, 2024). All studies included in this estimation reported a reduction in both volumes of FLW and GHG emissions. However, it is important to recognize that the range of embodied emissions varies widely across foods (Poore and Nemecek, 2018). For example, reducing meat waste can be more effective than reducing fruit waste because the embodied emissions are much higher.
Effectiveness is only reported on a 100-yr time frame here because our data sources did not include enough information to separate out the contribution of different GHGs and calculate the effectiveness on a 20-yr time frame.
left_text_column_width
Table 1. Effectiveness at reducing emissions.
Unit: t CO₂‑eq /t reduced FLW, 100-yr basis
| 25th percentile | 2.75 |
| mean | 3.11 |
| median (50th percentile) | 2.82 |
| 75th percentile | 3.30 |
Left Text Column Width
Cost
The net cost of baseline FLW is US$932.55/t waste, based on values from the Food and Agriculture Organization of the United Nations (FAO, 2014) and Hegensholt et al. (2018). The median net cost of implementing strategies and practices that reduce FLW is US$385.50/t waste reduced, based on values from ReFED (2024) and Hanson and Mitchell (2017). These costs include, but are not limited to, improvements to inventory tracking, storage, and diversion to food banks. Therefore, the net cost of the solution compared to baseline is a total savings of US$547.05/t waste reduced.
Therefore, reducing emissions for FLW is cost-effective, saving US$193.99/t avoided CO2 -eq on a 100-yr basis (Table 2).
left_text_column_width
Table 2. Net cost per unit climate impact.
Unit: US$/t CO₂‑eq , 2023
| Median (100-yr basis) | -193.99 |
Left Text Column Width
Learning Curve
Learning curve data are not yet available for this solution.
left_text_column_width
Speed of Action
Speed of action refers to how quickly a climate solution physically affects the atmosphere after it is deployed. This is different from speed of deployment, which is the pace at which solutions are adopted.
At Project Drawdown, we define the speed of action for each climate solution as emergency brake, gradual, or delayed.
Reduce Food Loss and Waste is an EMERGENCY BRAKE climate solution. It has the potential to deliver a more rapid impact than nominal and delayed solutions. Because emergency brake solutions can deliver their climate benefits quickly, they can help accelerate our efforts to address dangerous levels of climate change. For this reason, they are a high priority.
left_text_column_width
Caveats
Reducing FLW through consumer behavior, supply chain efficiencies, or other means can lead to lower food prices, creating a rebound effect that leads to increased consumption and GHG emissions (Hegwood et al., 2023). This rebound effect could offset around 53–71% of the mitigation benefits (Hegwood et al., 2023). Population and economic growth also increase FLW. The question remains however, who should bear the cost of implementing FLW solutions. A combination of value chain investments by governments and waste taxes for consumers may be required for optimal FLW reduction (Gatto, 2023; Hegwood, 2023; The World Bank, 2020).
Strategies for managing post-consumer waste through composting and landfills are captured in other Project Drawdown solutions (see Improve Landfill Management, Increase Composting, and Deploy Methane Digesters solutions).
left_text_column_width
Current Adoption
Due to a lack of data we were not able to quantify current adoption for this solution.
left_text_column_width
Adoption Trend
Data on adoption trends were not available.
left_text_column_width
Adoption Ceiling
We assumed an adoption ceiling of 1.75 Gt of FLW reduction in 2023, which reflects a 100% reduction in FLW (Table 3). While reducing FLW by 100% is unrealistic because some losses and waste are inevitable (e.g., trimmings, fruit pits and peels) and some surplus food is needed to ensure a stable food supply (HLPE, 2014), we kept that simple assumption because there wasn’t sufficient information on the amount of inevitable waste, and it is consistent with other research used in this assessment.
left_text_column_width
Table 3. Adoption ceiling.
Unit: t FLW reduced/yr
| Median | 1,750,000,000 |
Left Text Column Width
Achievable Adoption
Studies consider that halving the reduction in FLW by 2050 is extremely ambitious and would require “breakthrough technologies,” whereas a 25% reduction is classified as highly ambitious, and a 10% reduction is more realistic based on coordinated efforts (Searchinger, 2019; Springmann et al., 2018). With our estimation of 1.75 Gt of FLW per year, a 25% reduction equals 0.48 Gt, while a 50% reduction would represent 0.95 Gt of reduced FLW.
It is important to acknowledge that, 10 years after the 50% reduction target was set in the Sustainable Development Goals (SDGs, Goal 12.3), the world has not made sufficient progress. The challenge has therefore become larger as the amounts of FLW keep increasing at a rate of 2.2%/yr (Gatto & Chepeliev, 2023; Hegnsholt, et al. 2018; Porter et al., 2016).
As a result of these outcomes, we have selected a 25% reduction in FLW as our Achievable – Low and 50% as our Achievable – High. Reductions in FLW are 437.5, 875, and 1,750 mt FLW/year for Achievable – Low, Achievable – High, and Adoption Ceiling, respectively (Table 4).
left_text_column_width
Table 4: Adoption levels.
Unit: t FLW reduced/yr
| Current adoption (baseline) | Not determined |
| Achievable – Low (25% of total FLW) | 437,500,000 |
| Achievable – High (50% of total FLW) | 875,000,000 |
| Adoption ceiling (100% of total FLW) | 1,750,000,000 |
Left Text Column Width
An Achievable – Low (25% FLW reduction) could represent 1.23 Gt CO₂‑eq/yr (100-yr basis) of reduced emissions, whereas an Achievable – High (50% FLW reduction) could represent up to 2.47 Gt CO₂‑eq/yr. The adoption potential (100% FLW reduction) would result in 4.94 Gt CO₂‑eq/yr (Table 5). We are only able to report emissions outcomes on a 100-yr basis here because our data sources generally did not separate out the emissions from shorter-lived GHGs such as from methane or report emissions on a 20-yr basis.
left_text_column_width
Table 5. Climate impact at different levels of adoption.
Unit: Gt CO₂‑eq/yr, 100-yr basis
| Current adoption (1.5% of total FLW) | Not determined |
| Achievable – Low (25% of total FLW) | 1.23 |
| Achievable – High (50% of total FLW) | 2.47 |
| Adoption ceiling (100% of total FLW) | 4.94 |
Left Text Column Width
We also compiled studies that have modeled the climate impacts of different FLW reduction scenarios, from 10% to 75%. For an achievable 25% reduction, Scheringer (2019) estimated a climate impact of 1.6 Gt CO₂‑eq/yr. Studies that modeled the climate impact of a 50% reduction by 2050 estimated between 0.5 Gt CO₂‑eq/yr (excluding emissions from agricultural production and land use change; Roe at al., 2021) to 3.1–4.5 Gt CO₂‑eq/yr (including emissions from agricultural production and land use change; Roe at al., 2021; Searchinger et al., 2019).
Multiple studies stated that climate impacts from FLW reduction would be greater when combined with the implementation of dietary changes (see the Improve Diets solution; Almaraz et al., 2023; Babiker et al.; 2022; Roe et al., 2021; Springmann et al., 2018; Zhu et al., 2023).
left_text_column_width
Additional Benefits
Extreme Weather Events
Households and communities can strengthen adaptation to climate change by improving food storage, which helps reduce food loss (Ziervogel & Ericksen, 2010). Better food storage infrastructure improves food security from extreme weather events such as drought or floods which make it more difficult to grow food and can disrupt food distribution (Mbow et al., 2020).
Income and Work
FLW accounts for a loss of about US$1 trillion annually (World Bank, 2020). In the United States, a four-person household spends about US$2,913 on food that is wasted (Kenny, 2025). These household-level savings are particularly important for low-income families because they commonly spend a higher proportion of their income on food (Davidenko & Sweitzer, 2024). Reducing FLW can improve economic efficiency (Jaglo et al., 2021). In fact, a report by Champions 12.3 found efforts to reduce food waste produced positive returns on investments in cities, businesses, and households in the United Kingdom (Hanson & Mitchell, 2017). FLW in low- and middle-income mostly occurs during the pre-consumer stages, such as during storage, processing, and transport (World Bank, 2018). Preventive measures to reduce these losses have been linked to improved incomes and profits (Rolker et al., 2022).
Food Security
Reducing FLW increases the amount of available food, thereby improving food security without requiring increased production (Neff et al., 2015). The World Resources Institute estimated that halving the rate of FLW could reduce the projected global need for food approximately 20% by 2050 (Searchinger et al., 2019). In the United States, about 30–40% of food is wasted (U.S. Food and Drug Administration [U.S. FDA], 2019) with this uneaten food accounting for enough calories to feed more than 150 million people annually (Jaglo et al., 2021). These studies demonstrate that reducing FLW can simultaneously decrease the demand for food production while improving food security.
Health
Policies that reduce food waste at the consumer level, such as improved food packaging and clearer information on shelf life and date labels, can reduce the number of foodborne illnesses (Neff et al., 2015; U.S. FDA, 2019). Additionally, efforts to improve food storage and food handling can further reduce illnesses and improve working conditions for food-supply-chain workers (Neff et al., 2015). Reducing FLW can lower air pollution from food production, processing, and transportation, and from disposal of wasted food (Nutrition Connect, 2023). Gatto and Chepeliev (2024) found that reducing FLW can improve air quality (primarily through reductions in carbon monoxide, ammonia, nitrogen oxides, and particulate matter), which lowers premature mortality from respiratory infections. These benefits were primarily observed in China, India, and Indonesia, where high FLW-embedded air pollution is prevalent across all stages of the food supply chain (Gatto & Chepeliev, 2024).
Land Resources
For a description of the land resources benefits, please refer to the “water resources” subsection.
Water Resources
Reducing FLW can conserve resources and improve biodiversity (Cattaneo, Federighi, & Vaz, 2021). A reduction in FLW reflects improvements in resource efficiency of freshwater, synthetic fertilizers, and cropland used for agriculture (Kummu et al., 2012). Reducing the strain on freshwater resources is particularly relevant in water-scarce areas such as North Africa and West-Central Asia (Kummu et al., 2012). In the United States, halving the amount of FLW could reduce approximately 290,000 metric tons of nitrogen from fertilizers, thereby reducing runoff, improving water quality, and decreasing algal blooms (Jaglo et al., 2021).
left_text_column_width
Risks
Some FLW reduction strategies have trade-offs for emission reductions (de Gorter et al., 2021; Cattaneo, 2021). For example, improved cold storage and packaging are important interventions for reducing food loss, yet they require additional energy and refrigerants, which can increase GHG emissions (Babiker, 2017; FAO, 2019).
Interventions to address FLW also risk ignoring economic factors such as price transmission mechanisms and cascading effects, both upstream and downstream in the supply chain. The results of a FLW reduction policy or program depend greatly on the commodity, initial FLW rates, and market integration (Cattaneo, 2021; de Gorter, 2021).
The production site is a critical loss point, and farm incomes, scale of operations, and expected returns to investment affect loss reduction interventions (Anriquez, 2021; Fabi, 2021; Sheahan and Barrett, 2017).
On the consumer side, there is a risk of a rebound effect; i.e., avoiding FLW can lower food prices, leading to increased consumption and net increase in GHG emissions (Hegwood et al., 2023). Available evidence is highly contextual and often difficult to scale, so relevant dynamics must be studied with care (Goossens, 2019).
left_text_column_width
Interactions with Other Solutions
Competing
Food waste is used as raw material for methane digestors and composting. Reducing FLW may reduce the impact of those solutions as a result of decreased feedstock availability.
left_text_column_width
Dashboard
Solution Basics
t reduced FLW
t CO₂-eq (100-yr)/unit
02.752.82
units/yr
Current Not Determined
04.375×10⁸8.75×10⁸
Achievable (Low to High)
Climate Impact
Gt CO₂-eq (100-yr)/yr
Current Not Determined
1.232.47
US$ per t CO₂-eq
Emergency Brake
CO₂ , CH₄ , N₂O
Action Word
Reduce
Solution Title
Food Loss & Waste
Classification
Highly Recommended
Lawmakers and Policymakers
- Ensure public procurement uses strategies to reduce FLW at all stages of the supply chain; consider using the Food Loss and Waste Protocol.
- Use financial incentives and regulations to promote efficient growing practices, harvesting methods, and storage technologies.
- Utilize financial instruments such as taxes, subsidies, or exemptions to support infrastructure, technology, and enforcement.
- Implement bans on food waste in landfills.
- Standardize food date labels.
- Mandate FLW reporting and reduction targets for major food businesses.
- Prioritize policies that divert FLW toward human consumption first, then prioritize animal feed or compost.
- Fund research to improve monitoring technologies, food storage, and resilient crop varieties.
- Invest or expand extension services to work with major food businesses to reduce FLW.
- Invest in and improve supportive infrastructure including electricity, public storage facilities, and roads to facilitate compost supply chains.
- Create, support, or join education campaigns and/or public-private partnerships that facilitate stakeholder discussions.
Further information:
- A Systematic Literature Review on Food Waste/Loss Prevention and Minimization Methods. Moraes et al. (2021)
- An Overview of Food Waste Management in Developing Countries: Current Status and Future Perspective. Thi et al. (2015)
- Food Waste is a Solvable Problem – Here’s How to Do It. ReFED (n.d.)
- Food Waste: The Role of Date Labels, Package Size, and Product Category. Wilson et al. (2017)
- Government Relations and Public Policy Job Function Action Guide. Project Drawdown (2022)
- Legal Job Function Action Guide. Project Drawdown (2022)
- Reducing Food Loss and Waste: Five Challenges for Policy and Research. Cattaneo et al. (2021)
- Reducing Food Loss and Waste: Setting a Global Action Agenda. World Resources Institute (2019)
- Reducing Food Loss and Waste: Ten Interventions to Scale Impact. Hanson et al. (2019)
- Review: Food Loss and Waste in Sub-Saharan Africa. Sheahan et al. (2017)
- The State of Food and Agriculture 2019: Moving Forward on Food Loss and Waste Reduction. FAO (2019)
- The Food Waste Atlas.
Practitioners
- Ensure operations reduce FLW at all stages of the supply chain; consider using the Food Loss and Waste Protocol.
- Set ambitious targets to reduce FLW, reevaluate them regularly, and use thorough measurements that capture FLW, associated GHG emissions, and financial data.
- Take advantage of extension services and financial incentives such as tax rebates and subsidies that promote FLW reduction strategies.
- Work with policymakers, peers, and industry leaders to standardize date labeling.
- Promote cosmetically imperfect food through marketing, discounts, or offtake agreements.
- Utilize behavior change mechanisms such as signage saying “eat what you take,” offer smaller portion sizes, use smaller plates for servings, and visibly post information on the impact of FLW and best practices for prevention.
- Engage with front-line workers to identify and remedy FLW.
- Institute warehouse receipt systems and tracking techniques.
- Use tested storage devices and facilities such as hermetic bags and metal silos.
- Utilize Integrated Pest Management (IPM) during both pre- and post-harvest stages.
- Create, support, or join education campaigns and/or public-private partnerships that facilitate stakeholder discussions.
Further information:
- A Systematic Literature Review on Food Waste/Loss Prevention and Minimization Methods. Moraes et al. (2021)
- Driving Emissions Down and Profit Up by Reducing Food Waste. Food Waste Coalition of Action (2024)
- Food Waste is a Solvable Problem – Here’s How to Do It. ReFED (n.d.)
- Food Waste: The Role of Date Labels, Package Size, and Product Category. Wilson et al. (2017)
- Improving Data on Food Losses and Waste: From Theory to Practice. Fabi et al. (2021)
- Reducing Food Loss and Waste: Five Challenges for Policy and Research. Cattaneo et al. (2021)
- Reducing Food Loss and Waste: Setting a Global Action Agenda. World Resources Institute (2019)
- Reducing Food Loss and Waste: Ten Interventions to Scale Impact. Hanson et al. (2019)
- Reducing Food’s Environmental Impacts Through Producers and Consumers. Poore et al. (2018)
- Review: Consumption-Stage Food Waste Reduction Interventions – What Works and How to Design Better Interventions. Reynolds (2019)
- The Business Case for Reducing Food Loss and Waste. Hanson et al. (2017)
- The State of Food and Agriculture 2019: Moving Forward on Food Loss and Waste Reduction. FAO (2019)
- The Food Waste Atlas.
Business Leaders
- Ensure procurement uses strategies to reduce FLW at all stages of the supply chain; consider using the Food Loss and Waste Protocol.
- Set ambitious targets to reduce FLW, reevaluate them regularly, and use thorough measurements that capture FLW, associated GHG emissions, and financial data.
- Utilize or work with companies that utilize efficient growing practices, harvesting methods, and storage technologies that reduce FLW.
- Enter into offtake agreements for diverted food initiatives.
- Promote cosmetically imperfect food through marketing, discounts, or offtake agreements.
- Work with policymakers and industry peers to standardize date labeling and advocate for bans on food waste in landfills.
- Appoint a senior executive responsible for FLW goals and ensure they have the resources and authority for effective implementation.
- Utilize behavior change mechanisms such as signage saying, “eat what you take,” offer smaller portion sizes, use smaller plates for servings, and visibly post information on the impact of FLW and best practices for prevention.
- Engage with front-line workers to identify and remedy FLW.
- Institute warehouse receipt systems and tracking techniques.
- Fund research or startups that aim to improve monitoring technologies, food storage, packaging materials, stocking practices, and resilient crop varieties.
- Create, support, or join education campaigns and/or public-private partnerships that facilitate stakeholder discussions.
Further information:
- Climate Solutions at Work. Project Drawdown (2021)
- Drawdown-Aligned Business Framework. Project Drawdown (2021)
- Driving Emissions Down and Profit Up by Reducing Food Waste. Food Waste Coalition of Action (2024)
- Food Waste is a Solvable Problem – Here’s How to Do It. ReFED (n.d.)
- Food Waste: The Role of Date Labels, Package Size, and Product Category. Wilson et al. (2017)
- Improving Data on Food Losses and Waste: From Theory to Practice. Fabi et al. (2021)
- Reducing Food Loss and Waste: Setting a Global Action Agenda. World Resources Institute (2019)
- Reducing Food Loss and Waste: Ten Interventions to Scale Impact. Hanson et al. (2019)
- Reducing Food’s Environmental Impacts Through Producers and Consumers. Poore et al. (2018)
- Review: Consumption-Stage Food Waste Reduction Interventions – What Works and How to Design Better Interventions. Reynolds (2019)
- The State of Food and Agriculture 2019: Moving Forward on Food Loss and Waste Reduction. FAO (2019)
- The Business Case for Reducing Food Loss and Waste. Hanson et al. (2017)
- The Food Waste Atlas.
Nonprofit Leaders
- Ensure procurement uses strategies to reduce FLW at all stages of the supply chain; consider using the Food Loss and Waste Protocol.
- Advocate for bans on food waste in landfills.
- Work with policymakers and industry leaders to standardize date labeling.
- Assist food and agricultural companies with utilizing efficient growing practices, harvesting methods, and storage technologies that reduce FLW.
- Advocate for financial instruments such as taxes, subsidies, or exemptions to support infrastructure, technology, and enforcement.
- Use cosmetically imperfect and diverted food for food banks.
- Assist companies in tracking and reporting FLW, monitoring goals, and offering input for improvement.
- Help transfer capacity, knowledge, and infrastructure to support FLW management in low- and middle-income communities.
- Create, support, or join education campaigns and/or public-private partnerships that facilitate stakeholder discussions.
Further information:
- A Systematic Literature Review on Food Waste/Loss Prevention and Minimization Methods. Moraes et al. (2021)
- An Overview of Food Waste Management in Developing Countries: Current Status and Future Perspective. Thi et al. (2015)
- Driving Emissions Down and Profit Up by Reducing Food Waste. Food Waste Coalition of Action (2024)
- Food Waste is a Solvable Problem – Here’s How to Do It. ReFED (n.d.)
- Food Waste: The Role of Date Labels, Package Size, and Product Category. Wilson et al. (2017)
- Improving Data on Food Losses and Waste: From Theory to Practice. Fabi et al. (2021)
- Reducing Food Loss and Waste: Five Challenges for Policy and Research. Cattaneo et al. (2021)
- Reducing Food Loss and Waste: Setting a Global Action Agenda. World Resources Institute (2019)
- Reducing Food Loss and Waste: Ten Interventions to Scale Impact. Hanson et al. (2019)
- Reducing Food’s Environmental Impacts Through Producers and Consumers. Poore et al. (2018)
- Review: Consumption-Stage Food Waste Reduction Interventions – What Works and How to Design Better Interventions. Reynolds (2019)
- Review: Food Loss and Waste in Sub-Saharan Africa. Sheahan et al. (2017)
- The Business Case for Reducing Food Loss and Waste. Hanson et al. (2017)
- The State of Food and Agriculture 2019: Moving Forward on Food Loss and Waste Reduction. FAO (2019)
- The Food Waste Atlas.
Investors
- Ensure portfolio companies and company procurement use strategies to reduce FLW at all stages of the supply chain; consider using the Food Loss and Waste Protocol.
- Require portfolio companies to measure and report on FLW emissions.
- Fund startups which aim to improve monitoring technologies, food storage, packaging materials, stocking practices, and resilient crop varieties.
- Offer financial services, notably rural financial market development, including low-interest loans, micro-financing, and grants to support FLW initiatives.
- Create, support, or join education campaigns and/or public-private partnerships, such as the Food Waste Funder Circle, that facilitate stakeholder discussions.
Further information:
- Driving Emissions Down and Profit Up by Reducing Food Waste. Food Waste Coalition of Action (2024)
- Food Waste is a Solvable Problem – Here’s How to Do It. ReFED (n.d.)
- Food Waste: The Role of Date Labels, Package Size, and Product Category. Wilson et al. (2017)
- Improving Data on Food Losses and Waste: From Theory to Practice. Fabi et al. (2021)
- Reducing Food Loss and Waste: Setting a Global Action Agenda. World Resources Institute (2019)
- Reducing Food’s Environmental Impacts Through Producers and Consumers. Poore et al. (2018)
- Review: Consumption-Stage Food Waste Reduction Interventions – What Works and How to Design Better Interventions. Reynolds (2019)
- The Business Case for Reducing Food Loss and Waste. Hanson et al. (2017)
- The State of Food and Agriculture 2019: Moving Forward on Food Loss and Waste Reduction. FAO (2019)
- The Food Waste Atlas.
Philanthropists and International Aid Agencies
- Ensure procurement uses strategies to reduce FLW at all stages of the supply chain; consider using the Food Loss and Waste Protocol.
- Advocate for bans on food waste in landfills.
- Work with policymakers and industry leaders to standardize date labeling.
- Assist food and agricultural companies with utilizing efficient growing practices, harvesting methods, and storage technologies that reduce FLW.
- Advocate for financial instruments such as taxes, subsidies, or exemptions to support infrastructure, technology, and enforcement.
- Use cosmetically imperfect and diverted food for food banks.
- Assist companies in tracking and reporting FLW, monitoring goals, and offering input for improvement.
- Help transfer capacity, knowledge, and infrastructure to support FLW management in low- and middle-income communities.
- Fund startups that aim to improve monitoring technologies, food storage, packaging materials, stocking practices, and resilient crop varieties.
- Offer financial services, especially for rural financial market development, including low-interest loans, micro-financing, and grants to support FLW initiatives.
- Create, support, or join education campaigns and/or public-private partnerships, such as the Food Waste Funder Circle, that facilitate stakeholder discussions.
Further information:
- A Systematic Literature Review on Food Waste/Loss Prevention and Minimization Methods. Moraes et al. (2021)
- An Overview of Food Waste Management in Developing Countries: Current Status and Future Perspective. Thi et al. (2015)
- Driving Emissions Down and Profit Up by Reducing Food Waste. Food Waste Coalition of Action (2024)
- Food Waste is a Solvable Problem – Here’s How to Do It. ReFED (n.d.)
- Food Waste: The Role of Date Labels, Package Size, and Product Category. Wilson et al. (2017)
- Improving Data on Food Losses and Waste: From Theory to Practice. Fabi et al. (2021)
- Reducing Food Loss and Waste: Five Challenges for Policy and Research. Cattaneo et al. (2021)
- Reducing Food Loss and Waste: Setting a Global Action Agenda. World Resources Institute (2019)
- Reducing Food Loss and Waste: Ten Interventions to Scale Impact. Hanson et al. (2019)
- Reducing Food’s Environmental Impacts Through Producers and Consumers. Poore et al. (2018)
- Review: Consumption-Stage Food Waste Reduction Interventions – What Works and How to Design Better Interventions. Reynolds (2019)
- Review: Food Loss and Waste in Sub-Saharan Africa. Sheahan et al. (2017)
- The Business Case for Reducing Food Loss and Waste. Hanson et al. (2017)
- The State of Food and Agriculture 2019: Moving Forward on Food Loss and Waste Reduction. FAO (2019)
- The Food Waste Atlas.
Thought Leaders
- Adopt behaviors to reduce FLW including portion control, “eating what you take,” and reducing meat consumption.
- Advocate for bans on food waste in landfills.
- Assist food and agricultural companies with utilizing efficient growing practices, harvesting methods, and storage technologies that reduce FLW.
- Work with policymakers and industry leaders to standardize date labeling.
- Advocate for financial instruments such as taxes, subsidies, or exemptions to support infrastructure, technology, and enforcement.
- Assist companies or independent efforts in tracking and reporting FLW data and emissions.
- Help transfer capacity, knowledge, and infrastructure to support FLW management in low- and middle-income communities.
- Create, support, or join education campaigns and/or public-private partnerships that facilitate stakeholder discussions.
Further information:
- A Systematic Literature Review on Food Waste/Loss Prevention and Minimization Methods. Moraes et al. (2021)
- Driving Emissions Down and Profit Up by Reducing Food Waste. Food Waste Coalition of Action (2024)
- Food Waste is a Solvable Problem – Here’s How to Do It. ReFED (n.d.)
- Food Waste: The Role of Date Labels, Package Size, and Product Category. Wilson et al. (2017)
- Improving Data on Food Losses and Waste: From Theory to Practice. Fabi et al. (2021)
- Reducing Food Loss and Waste: Five Challenges for Policy and Research. Cattaneo et al. (2021)
- Reducing Food Loss and Waste: Setting a Global Action Agenda. World Resources Institute (2019)
- Reducing Food Loss and Waste: Ten Interventions to Scale Impact. Hanson et al. (2019)
- Reducing Food’s Environmental Impacts Through Producers and Consumers. Poore et al. (2018)
- Review: Consumption-Stage Food Waste Reduction Interventions – What Works and How to Design Better Interventions. Reynolds (2019)
- The Business Case for Reducing Food Loss and Waste. Hanson et al. (2017)
- The State of Food and Agriculture 2019: Moving Forward on Food Loss and Waste Reduction. FAO (2019)
- The Food Waste Atlas.
Technologists and Researchers
- Research and develop more efficient growing and harvesting practices.
- Develop new crop varieties to increase land productivity, shelf life, durability during transportation, and resistance to contamination.
- Improve the efficiency of cold chains for transportation and storage.
- Design software that can optimize the harvesting, storage, transportation, stocking, and shelf life of produce.
- Improve data collection on FLW, associated GHG emissions, and financial data across the supply chain.
- Develop new non-plastic, biodegradable, low-carbon packaging materials.
- Improve storage devices and facilities such as hermetic bags and metal silos.
- Research technologies, practices, or nonharmful substances to prolong the lifespan of food.
Further information:
- A Systematic Literature Review on Food Waste/Loss Prevention and Minimization Methods. Moraes et al. (2021)
- An Overview of Food Waste Management in Developing Countries: Current Status and Future Perspective. Thi et al. (2015)
- Driving Emissions Down and Profit Up by Reducing Food Waste. Food Waste Coalition of Action (2024)
- Food Waste is a Solvable Problem – Here’s How to Do It. ReFED (n.d.)
- Food Waste: The Role of Date Labels, Package Size, and Product Category. Wilson et al. (2017)
- Improving Data on Food Losses and Waste: From Theory to Practice. Fabi et al. (2021)
- Reducing Food Loss and Waste: Five Challenges for Policy and Research. Cattaneo et al. (2021)
- Reducing Food Loss and Waste: Setting a Global Action Agenda. World Resources Institute (2019)
- Reducing Food Loss and Waste: Ten Interventions to Scale Impact. Hanson et al. (2019)
- Reducing Food’s Environmental Impacts Through Producers and Consumers. Poore et al. (2018)
- Review: Consumption-Stage Food Waste Reduction Interventions – What Works and How to Design Better Interventions. Reynolds (2019)
- Review: Food Loss and Waste in Sub-Saharan Africa. Sheahan et al. (2017)
- The Food Waste Atlas.
Communities, Households, and Individuals
- Adopt behaviors to reduce FLW including portion control, “eating what you take,” and reducing meat consumption.
- Donate food that won’t be used or, if that’s not possible, use the food for animals or compost.
- Advocate for bans on food waste in landfills.
- Advocate for financial instruments such as taxes, subsidies, or exemptions to support infrastructure, technology, and enforcement.
- Demand transparency around FLW from public and private organizations.
- Educate yourself and those around you about the impacts and solutions.
- Create, support, or join education campaigns and/or public-private partnerships that facilitate stakeholder discussions.
Further information:
- Food Waste is a Solvable Problem – Here’s How to Do It. ReFED (n.d.)
- Food Waste: The Role of Date Labels, Package Size, and Product Category. Wilson et al. (2017)
- Reducing Food Loss and Waste: Five Challenges for Policy and Research. Cattaneo et al. (2021)
- Reducing Food Loss and Waste: Setting a Global Action Agenda. World Resources Institute (2019)
- Reducing Food Loss and Waste: Ten Interventions to Scale Impact. Hanson et al. (2019)
- Reducing Food’s Environmental Impacts Through Producers and Consumers. Poore et al. (2018)
- Review: Consumption-Stage Food Waste Reduction Interventions – What Works and How to Design Better Interventions. Reynolds (2019)
- The Business Case for Reducing Food Loss and Waste. Hanson et al. (2017)
- The State of Food and Agriculture 2019: Moving Forward on Food Loss and Waste Reduction. FAO (2019)
- The Food Waste Atlas.
Sources
- A Systematic Literature Review on Food Waste/Loss Prevention and Minimization Methods. Moraes et al. (2021)
- An Overview of Food Waste Management in Developing Countries: Current Status and Future Perspective. Thi et al. (2015)
- Driving Emissions Down and Profit Up by Reducing Food Waste. Food Waste Coalition of Action (2024)
- Food Waste is a Solvable Problem – Here’s How to Do It. ReFED (n.d.)
- Food Waste: The Role of Date Labels, Package Size, and Product Category. Wilson et al. (2017)
- Improving Data on Food Losses and Waste: From Theory to Practice. Fabi et al. (2021)
- Reducing Food Loss and Waste: Five Challenges for Policy and Research. Cattaneo et al. (2021)
- Reducing Food Loss and Waste: Setting a Global Action Agenda. World Resources Institute (2019)
- Reducing Food Loss and Waste: Ten Interventions to Scale Impact. Hanson et al. (2019)
- Reducing Food’s Environmental Impacts Through Producers and Consumers. Poore et al. (2018)
- Review: Consumption-Stage Food Waste Reduction Interventions – What Works and How to Design Better Interventions. Reynolds (2019)
- Review: Food Loss and Waste in Sub-Saharan Africa. Sheahan et al. (2017)
- The Business Case for Reducing Food Loss and Waste. Hanson et al. (2017)
- The State of Food and Agriculture 2019: Moving Forward on Food Loss and Waste Reduction. FAO (2019)
- The Food Waste Atlas.
Evidence Base
A large volume of scientific research exists regarding reducing emissions of FLW effectively. The IPCC Sixth Assessment Report (AR6) estimates the mitigation potential of FLW reduction (through multiple reduction strategies) to be 2.1 Gt CO₂‑eq/yr (with a range of 0.1–5.8 Gt CO₂‑eq/yr ) (Nabuurs et al., 2022). This accounts for savings along the whole value chain.
Following the 2011 Food and Agriculture Organization (FAO) of the United Nations (UN) report – which estimated that around one-third (1.3 Gt) of food is lost and wasted worldwide per year – global coordination has prioritized the measurement of the FLW problem. This statistic, provided by the FAO, has served as a baseline for multiple FLW reduction strategies. However, more recent studies suggest that the percentage of FLW may be closer to 40% (WWF, 2021). The median of the studies included in our analysis is 1.75 Gt of FLW per year (Gatto & Chepeliev, 2024; FAO, 2024; Guo et al., 2020; Porter et al., 2016; UNEP, 2024; WWF, 2021; Zhu et al., 2023), with an annual increasing trend of 2.2%.
Only one study included in our analysis calculated food embodied emissions from all stages of the supply chain, while the rest focused on the primary production stages. Zhu et al. (2023) estimated 6.5 Gt CO₂‑eq/yr arising from the supply chain side, representing 35% of total food system emissions.
When referring to food types, meat and animal products were estimated to emit 3.5 Gt CO₂‑eq/yr compared to 0.12 Gt CO₂‑eq/yr from fruits and vegetables (Zhu et al., 2023). Although meat is emissions-intensive, fruits and vegetables are the most wasted types of food by volume, making up 37% of total FLW by mass (Chen et al., 2020). The consumer stage is associated with the highest share of global emissions at 36% of total supply-embodied emissions from FLW, compared to 10.9% and 11.5% at the retail and wholesale levels, respectively (Zhu et al., 2023).
While efforts to measure the FLW problem are invaluable, critical gaps exist regarding evidence on the effectiveness of different reduction strategies across supply chain stages ( Cattaneo, 2021; Goossens, 2019; Karl et al., 2025). To facilitate impact assessments and cost-effectiveness, standardized metrics are required to report actual quantities of FLW reduced as well as resulting GHG emissions savings (Food Loss and Waste Protocol, 2024).
The results presented in this document summarize findings across 22 studies. These studies are made up of eight academic reviews and original studies, eight reports from NGOs, and six reports from public and multilateral organizations. This reflects current evidence from five countries, primarily the United States and the United Kingdom. We recognize this limited geographic scope creates bias, and hope this work inspires research for meta-analyses and data sharing on this topic in underrepresented regions and stages of the supply chain.
left_text_column_width
Updated Date
Improve Diets
Mode
Cut Emissions
Cluster
Curb Growing Demands
Image
Image
Coming Soon
On
Action Word
Improve
Solution Title
Diets
Classification
Highly Recommended
Updated Date