Sector Color
659D2A

Improve Aquaculture

Image
Image
Peatland
Coming Soon
On
Description for Social and Search
The Improve Aquaculture solution is coming soon.
Solution in Action
Speed of Action
left_text_column_width
Caveats
left_text_column_width
Risks
left_text_column_width
Consensus
left_text_column_width
Trade-offs
left_text_column_width
Action Word
Improve
Solution Title
Aquaculture
Classification
Worthwhile
Lawmakers and Policymakers
Practitioners
Business Leaders
Nonprofit Leaders
Investors
Philanthropists and International Aid Agencies
Thought Leaders
Technologists and Researchers
Communities, Households, and Individuals
Updated Date

Deploy Vertical Farms

Image
Image
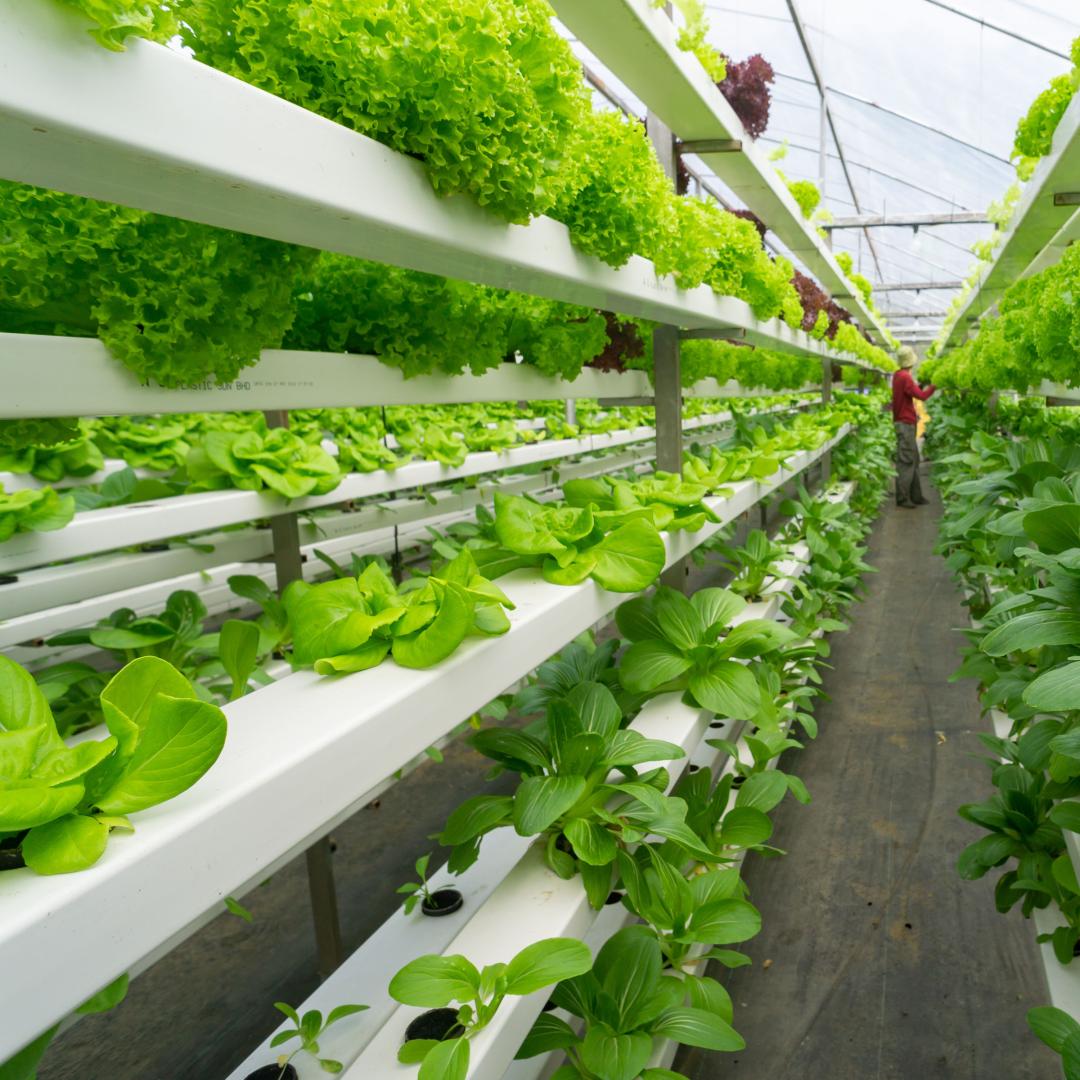
An image of a vertical farm featuring rows of vegetables
Coming Soon
Off
Summary

Vertical farms are facilities that grow crops indoors, vertically stacking multiple layers of plants and providing controlled conditions using artificial light, indoor heating and cooling systems, humidity controls, water pumps, and advanced automation systems. In theory, vertical farms could reduce the need to clear more agricultural land and the distance food travels to market. However, because vertical farms are so energy and material intensive, and food transportation emissions are a small fraction of the overall carbon footprint of food, vertical farms do not reduce emissions overall. We conclude that vertical farms are “Not Recommended” as an effective climate solution.

Description for Social and Search
Because vertical farms are so energy and material intensive, and food transportation emissions are a small fraction of the overall carbon footprint of food, vertical farms do not reduce emissions overall. We conclude that vertical farms are “Not Recommended” as an effective climate solution.
Overview

What is our assessment?

Based on our analysis, vertical farms are not an effective climate solution. The tremendous energy use and embodied emissions of vertical farm operations outweigh any potential savings of reducing food miles or land expansion. Moreover, the ability of vertical farms to truly scale to be a meaningful part of the global food system is extremely limited. We therefore classify this as “Not Recommended” as an effective climate solution.

Plausible Could it work? No
Ready Is it ready? Yes
Evidence Are there data to evaluate it? Yes
Effective Does it consistently work? No
Impact Is it big enough to matter? No
Risk Is it risky or harmful? No
Cost Is it cheap? No

What is it?

Vertical farms are facilities that grow crops indoors, with multiple layers of plants stacked on top of each other, using artificial lights, large heating and cooling systems, humidity controls, water pumps, and complex building automation systems. In principle, vertical farms can dramatically shrink the land “footprint” of agriculture, and this could help reduce the need for agricultural land. Moreover, by growing crops closer to urban centers, vertical farms could potentially reduce “food miles” and the emissions related to food transport.

Does it work? 

The technology of growing some kinds of crops – especially greens and herbs – in indoor facilities is well developed, but there is no evidence to show that doing so can reduce GHG emissions compared to growing the same food on traditional farms. Theoretically, vertical farms could reduce emissions associated with agricultural land expansion and food transportation. However, the operation and construction of vertical farms require enormous amounts of energy and materials, all of which cause significant emissions. Vertical farms require artificial lighting (even with efficient LEDs, this is a considerable energy cost), heating, cooling, humidity control, air circulation, and water pumping – all of which require energy. Vertical farms could be powered by renewable sources; however, this is an inefficient method for reducing GHG emissions compared to using that renewable energy to replace fossil-fuel-powered electricity generation. Growing food closer to urban centers also does not meaningfully reduce emissions because emissions from “food miles” are only a small fraction of the life cycle emissions for most farmed foods. Recent research has found that the carbon footprint of lettuce grown in vertical farms can be 5.6 to 16.7 times greater than that of lettuce grown with traditional methods.

Why are we excited?

While vertical farms are not an effective strategy for reducing emissions, they may have some value for climate resilience and adaptation. Vertical farms offer a protected environment for crop growth and well-managed water use, and they can potentially shield plants from pests, diseases, and natural disasters. Moreover, the controlled environment can be adjusted to adapt to changing climate conditions, helping ensure continuous production and lowering the risks of crop loss.

Why are we concerned?

Vertical farms use enormous amounts of energy and material to grow a limited array of food, all at significant cost. That energy and material have a significant carbon emissions cost, no matter how efficient the technology becomes. On the whole, vertical farms appear to emit far more GHGs than traditional farms do. Moreover, vertical farms are expensive to build and operate, and are unlikely to play a major role in the world’s food system. At present, they are mainly used to grow high-priced greens, vegetables, herbs, and cannabis, which do not address the tremendous pressure points in the global food system to feed the world sustainably. There are also concerns about the future of the vertical farming business. While early efforts were funded by venture capital, vertical farming has struggled to become profitable, putting its future in doubt.
 

Solution in Action

Blom, T. et al.., (2022). The embodied carbon emissions of lettuce production in vertical farming, greenhouse horticulture, and open-field farming in the Netherlands. Journal of Cleaner Production, 377, 134443. Link to source: https://www.sciencedirect.com/science/article/pii/S095965262204015X 

Cornell Chronicle, (2014). Indoor urban farms called wasteful, “pie in the sky”. Link to source: https://news.cornell.edu/stories/2014/02/indoor-urban-farms-called-wasteful-pie-sky

Cox, S., (2012). The vertical farming scam, Counterpunch. Link to source: https://www.counterpunch.org/2012/12/11/the-vertical-farming-scam/ 

Cox, S., (2016). Enough with the vertical farming fantasies: There are still too many unanswered questions about the trendy practice, Salon. Link to source: https://www.salon.com/2016/02/17/enough_with_the_vertical_farming_partner/ 

Foley, J.A. et al., (2011). Solutions for a cultivated planet, Nature. Link to source: http://doi.org/10.1038/nature10452

Foley, J.A., (2018). No, vertical farms won’t feed the world, Medium. Link to source: https://globalecoguy.org/no-vertical-farms-wont-feed-the-world-5313e3e961c0 

Hamm, M., (2015). The buzz around indoor farms and artificial lighting makes no sense. The Guardian. Link to source: https://www.theguardian.com/sustainable-business/2015/apr/10/indoor-farming-makes-no-economic-environmental-sense 

Peters, A., (2023). The vertical farming bubble is finally popping, Fast Company. Link to source: https://www.fastcompany.com/90824702/vertical-farming-failing-profitable-appharvest-aerofarms-bowery

Ritchie, H., (2022). Eating local is still not a good way to reduce the carbon footprint of your diet, Sustainability by the numbers. Link to source: https://www.sustainabilitybynumbers.com/p/food-miles 

Tabibi, A. (2024). Vertical farms: A tool for climate change adaptation, Green.org. January 30, 2024. Link to source: https://green.org/2024/01/30/vertical-farms-a-tool-for-climate-change-adaptation/   

Credits

Lead Author

  • Jonathan Foley, Ph.D.

Internal Reviewer

  • Christina Swanson, Ph.D.
Speed of Action
left_text_column_width
Caveats
left_text_column_width
Additional Benefits
left_text_column_width
Risks
left_text_column_width
Consensus
left_text_column_width
Trade-offs
left_text_column_width
Action Word
Deploy
Solution Title
Vertical Farms
Classification
Not Recommended
Updated Date

Advance Cultivated Meat

Image
Image
Fried chicken sandwich
Coming Soon
Off
Summary

Cultivated meat is produced from a sample of animal cells, rather than by slaughtering animals. This technology shows promise for reducing emissions from animal agriculture, but its climate impact depends on the energy source used during production. Research and development are still in early stages, and whether the products can scale depends on continued investments, consumer approval, technological growth, and regulatory acceptance. While cultivated meat shows potential, evidence about its emissions reduction potential is limited, and the high costs of production may restrain its scalability. Based on our assessment, we will “Keep Watching” this potential solution.

Description for Social and Search
Cultivated meat is produced from a sample of animal cells, rather than by slaughtering animals. This technology shows promise for reducing emissions from animal agriculture, but its climate impact depends on the energy source used during production.
Overview

What is our assessment?

Based on our analysis, cultivated meat is promising in its ability to reduce emissions from meat production, but the impact on a large scale remains unclear. Based on our assessment, we will “Keep Watching” this potential solution.

Plausible Could it work? Yes
Ready Is it ready? Yes
Evidence Are there data to evaluate it? Limited
Effective Does it consistently work? Yes
Impact Is it big enough to matter? ?
Risk Is it risky or harmful? No
Cost Is it cheap? No

What is it?

Cultivated meat (also called lab-grown or cultured meat) is a cellular agriculture product that, when used to replace meat from livestock, can reduce emissions. Cultivated meat is developed through bioengineering. Its production uses sample cells from an animal, in addition to a medium that supports cell growth in a bioreactor. Energy is required to produce the ingredients for the growth medium and to run the bioreactor (e.g., for temperature control, the mixing processes, aeration).

Does it work? 

Since the development of cultivated meat is still in its infancy, there is limited evidence on its emissions savings potential from large-scale production. Preliminary estimates differ by an order of magnitude, depending on the energy source used in the lab environment. Using fossil energy sources, emissions generated from the production of one kilogram of cultivated meat could reach 25 kilograms CO₂‑eq. If renewable energy is used, emissions could be about two kilograms CO₂‑eq per kilogram of cultivated meat. By comparison, producing a kilogram of beef from livestock generates 80–100 kilograms CO₂‑eq, on average. Almost half of those emissions from livestock beef are in the form of methane. Producing pig meat and poultry meat generates about 12 kilograms and 10 kilograms of CO₂‑eq, respectively. Based on these estimates, cultivated meat could substantially reduce the emissions of beef. Compared to pork and chicken, however, its emissions depend on the source of energy used during production.

Why are we excited?

The cultivated meat industry is fairly new but growing rapidly. The first cell-cultivated meat product was developed in 2013. In 2024, there were 155 companies involved in the industry, located across six continents, mostly based in the United States, Israel, the United Kingdom, and Singapore. Agriculture is responsible for about 22% of global GHG emissions, and raising livestock, especially beef, is particularly emissions-intensive. Therefore, cultivated meat has great potential to reduce related emissions as demand for meat continues to grow across the world. Cultivated meat enables the production of a large amount of meat from a single stem cell. This means that far fewer animals will be needed for meat production. Cultivated meat is also more efficient at converting feed into meat than chickens, which reduces emissions associated with feed production and demand for land.

Why are we concerned?

Concerns about cultivated meat include scalability, cost, and consumer acceptance. Because cultivated meat is still an emerging area of food science, the cost of production may be prohibitive at a large scale. Although cell culture is routinely performed in industrial and academic labs, creating the culture medium for mass-market production at competitive prices will require innovations and significant cost reductions. There are still many unknowns about the commercial potential of cultivated meat and whether consumers will accept the products. In 2024, companies began to move from research labs to larger facilities to start producing meat for consumers. There are only two countries that allow the sale of cultivated meat: Singapore and the United States. Within the United States, about one-third of adults find the concept of cultivated meat appealing, and only about 17% would be likely to purchase it, according to a poll conducted on behalf of the Good Food Institute. However, even substituting a fraction of the beef consumed in the United States with cultivated meat could have an important impact on reducing emissions. Cultivated meat is a novel food and may require consumer education and producer transparency on production methods and safeguards in order to become more widely accepted.

Solution in Action

Congressional Research Service of the United States (2023). Cell-Cultivated Meat: An Overview Link to source: https://www.congress.gov/crs-product/R47697

Garrison, G. L., et al. (2022). How much will large-scale production of cell-cultured meat cost?. Journal of Agriculture and Food Research, 10: 100358. Link to source: https://doi.org/10.1016/j.jafr.2022.100358

Good Food Institute (2025). 2024 State of the Industry report: Cultivated meat, seafood, and ingredients. Link to source: https://gfi.org/resource/cultivated-meat-seafood-and-ingredients-state-of-the-industry/

Good Food Institute (2024). Consumer snapshot: Cultivated meat in the U.S. Link to source: https://gfi.org/wp-content/uploads/2025/01/Consumer-snapshot-cultivated-meat-in-the-US.pdf

Good Food Institute (2020). An analysis of culture medium costs and production volumes for cultivated meat Link to source: https://gfi.org/resource/analyzing-cell-culture-medium-costs/

Gursel, I. et al. (2022). Review and analysis of studies on sustainability of cultured meat. Wageningen Food & Biobased Research. Link to source: https://edepot.wur.nl/563404

Mendly-Zambo, Z., et al. (2021). Dairy 3.0: cellular agriculture and the future of milk. Food, Culture & Society, 24(5), 675–693. Link to source: https://doi.org/10.1080/15528014.2021.1888411

MIT Technology Review (2023). Here’s what we know about lab-grown meat and climate change. Link to source: https://www.technologyreview.com/2023/07/03/1075809/lab-grown-meat-climate-change/

J. Poore, & T. Nemecek (2018). Reducing food’s environmental impacts through producers and consumers. Science, 360, 987-992. Link to source: https://doi.org/10.1126/science.aaq0216

Risner, D., et al. (2023) Environmental impacts of cultured meat: A cradle-to-gate life cycle assessment. bioRxiv, 2023.04.21.537778; doi: Link to source: https://doi.org/10.1101/2023.04.21.537778

Sinke, P., et al. (2023). Ex-ante life cycle assessment of commercial-scale cultivated meat production in 2030. Int J Life Cycle Assess, 28, 234–254 Link to source: https://doi.org/10.1007/s11367-022-02128-8

Treich, N. (2021). Cultured Meat: Promises and Challenges. Environ Resource Econ, 79, 33–61 Link to source: https://doi.org/10.1007/s10640-021-00551-3

Tuomisto HL, et al. (2022) Prospective life cycle assessment of a bioprocess design for cultured meat production in hollow fiber bioreactors. Science of the Total Environment, 851:158051

World Bank (2024) Recipe for a Livable Planet: Achieving Net Zero Emissions in the Agrifood System Link to source: https://openknowledge.worldbank.org/entities/publication/406c71a3-c13f-49cd-8f3f-a071715858fb

Xu X, Sharma P, Shu S et al (2021) Global greenhouse gas emissions from animal-based foods are twice those of plant-based foods. Nature Food, 2:724–732 Link to source: https://doi.org/10.1038/s43016-021-00358-x 

Credits

Lead Fellow

  • Emily Cassidy

Internal Reviewers

  • Eric Toensmeier
  • Paul West, Ph.D.
  • Christina Swanson, Ph.D.
Speed of Action
left_text_column_width
Caveats
left_text_column_width
Additional Benefits
left_text_column_width
Risks
left_text_column_width
Consensus
left_text_column_width
Trade-offs
left_text_column_width
Action Word
Advance
Solution Title
Cultivated Meat
Classification
Keep Watching
Updated Date

Use Feed Additives

Image
Image
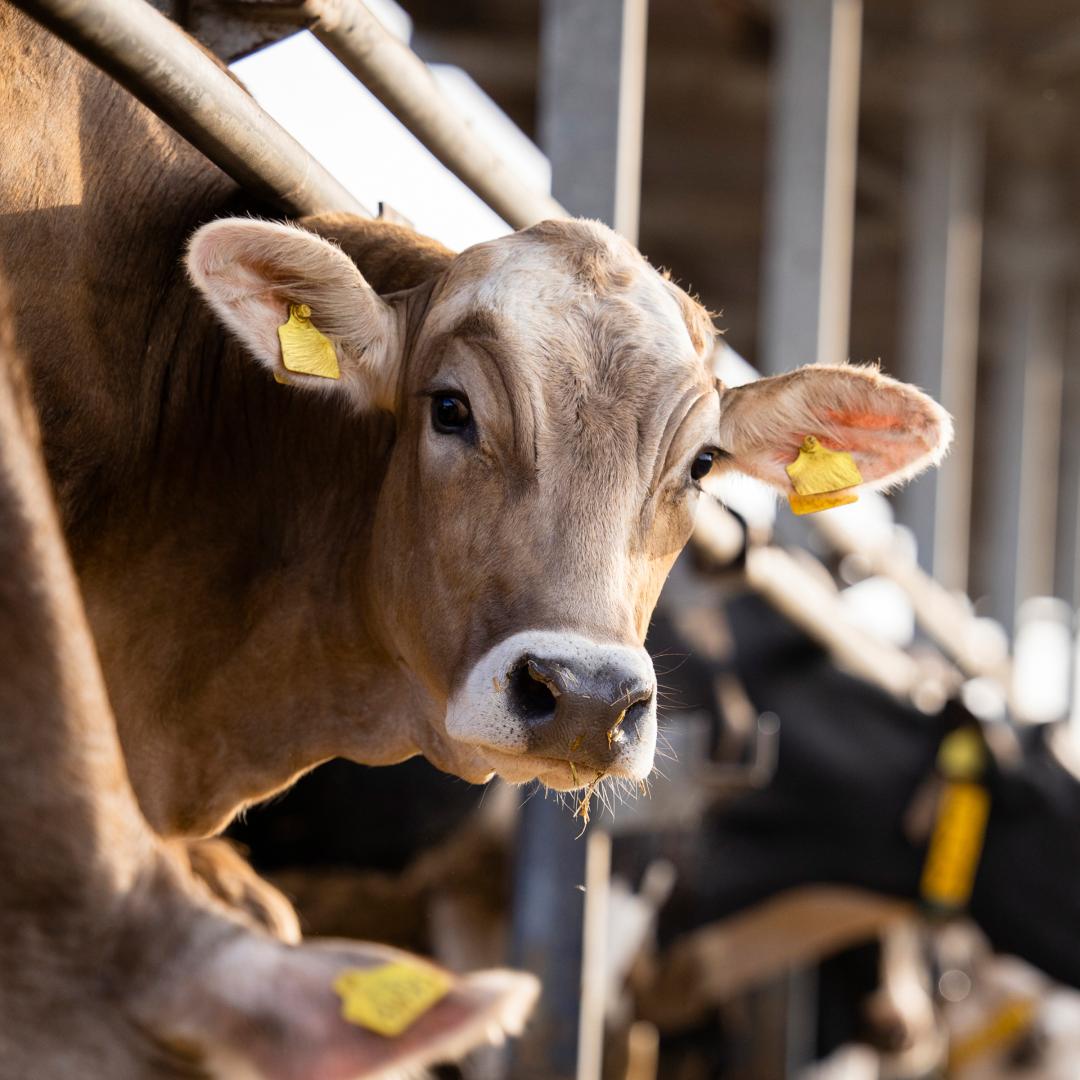
Cow at feeding station
Coming Soon
Off
Summary

Feed additives can reduce enteric methane production in ruminant livestock, such as cattle, goats, and sheep. Most feed additive compounds are still being researched to determine their efficacy and safety; however, at least one product, 3-NOP (3-nitrooxypropanol), has been shown to be effective, has recently been approved for use in many countries, and has experienced some early adoption. However, because of cost and the need to be administered daily, the use of feed additives is currently limited to confined ruminants in high-income countries and is not feasible for the majority of global ruminant livestock. Based on these limitations and current levels of adoption, we will “Keep Watching” this potential solution.

Description for Social and Search
Feed additives can reduce enteric methane production in ruminant livestock, such as cattle, goats, and sheep. Most feed additive compounds are still being researched to determine their efficacy and safety.
Overview

What is our assessment?

Based on our analysis, feed additives are a promising technology that could yield globally meaningful reductions in methane emissions. A few, including 3-NOP, are just on the threshold of commercial adoption and may be widely used by confined ruminant producers in the coming years. The current use of feed additives is low, and the effectiveness of most feed additive compounds is not well-documented. Consequently, wide-scale adoption is largely confined to confined livestock in high-income countries. Based on our assessment, we will “Keep Watching” this potential solution.

Plausible Could it work? Yes
Ready Is it ready? No
Evidence Are there data to evaluate it? Yes
Effective Does it consistently work? Yes
Impact Is it big enough to matter? Yes
Risk Is it risky or harmful? No
Cost Is it cheap? Yes

What is it?

Feed additives are a diverse group of natural and synthetic compounds that, when fed daily, can reduce enteric methane production in ruminant livestock, including cattle, sheep, and goats. Enteric methane from livestock is the source of 21% of humanity’s methane emissions, or 2.9 Gt CO₂‑eq/yr. Feed additives reduce enteric methane production by suppressing the activity of microbes in the digestive system. 3-NOP (3-nitrooxypropanol) is a synthetic that inhibits an enzyme involved in enteric methane production.

Does it work?

More than 170 different feed additives have been developed and tested so far, but only a few of them have been studied enough to offer predictable outcomes and proper doses. Methane reductions from these well-studied additives typically range from 10-30%. The feed additive 3-NOP, the first compound approved for commercial use, reduces enteric methane by an average of 32.5%. A second feed additive derived from active compounds found in Asparagopsis seaweed has shown promising results in some studies and has recently received regulatory approval in two countries. In addition, because different feed additives use different mechanisms to suppress enteric methane production, it’s possible that multiple additives can be used together to achieve greater methane reductions. The great majority of other additives are not yet ready for widespread adoption due to a lack of understanding of effectiveness, side effects on cattle and humans who consume milk from treated cattle, and other concerns.

Why are we excited?

Ruminants are a major source of methane emissions, yet ruminant meat and dairy products are in high demand. Therefore, any strategy that can reduce methane emissions per kilogram of meat or milk is potentially very valuable and, if broadly adopted, could yield globally meaningful reductions in methane emissions (>0.1 Gt CO₂‑eq per year). The feed additive 3-NOP, first approved for commercial use in two countries in 2021, is now legal in 55 countries. Research on other feed additives is active and generally well-supported with funding from philanthropic and investment sources. Although current use of feed additives is very low, successful research and pilot studies, increasing regulatory approvals, and strong positive interest from the livestock industry suggest that wider-scale adoption of this emissions reduction technology could occur quickly. In addition to potential emissions reduction benefits, some additives offer other benefits such as increased productivity and parasite control.

Why are we concerned?

Because they must be fed daily as a supplement to a concentrated feed, use of feed additives is limited to ruminants managed under confined conditions. Most of the billions of ruminant animals today are raised or managed in extensive grazing or pastoralist systems, often in small herds in remote areas. This makes use of feed additives infeasible, although some research is underway to develop methane-reducing compounds that could be added to water troughs instead of to feed. Feed additives are also costly. Though they may be cost-effective in terms of dollars per ton of CO₂‑eq reduced, the cost of additives themselves would likely be prohibitive for smallholders and pastoralists in low-income countries. These limitations mean that feed additives, as currently under development, are only suitable for a subset of total ruminant livestock – those that are raised in confinement systems in wealthy countries. The great majority of feed additives are not yet ready for widespread adoption due to a lack of understanding of effectiveness, side effects on cattle and humans who consume milk from treated cattle, and other concerns. There are also other challenges, including regulatory issues, public acceptance, and effects on livestock and human health. There is also concern that feed additives could be used to divert attention from the importance of reducing ruminant meat and milk products in the diets of wealthy countries and reducing food waste of ruminant products.

Solution in Action

Almeida, A. K., Hegarty, R. S., & Cowie, A. (2021). Meta-analysis quantifying the potential of dietary additives and rumen modifiers for methane mitigation in ruminant production systems. Animal Nutrition, 7(4), 1219-1230. Link to source: https://doi.org/10.1016/j.aninu.2021.09.005

Batley, R. J., Chaves, A. V., Johnson, J. B., Naiker, M., Quigley, S. P., Trotter, M. G., & Costa, D. F. (2024). Rapid screening of methane-reducing compounds for deployment in livestock drinking water using in vitro and FTIR-ATR analyses. Methane, 3(4), 533-560. Link to source: https://doi.org/10.3390/methane3040030 

Canadell, J.G., P.M.S. Monteiro, M.H. Costa, L. Cotrim da Cunha, P.M. Cox, A.V. Eliseev, S. Henson, M. Ishii, S. Jaccard, C. Koven, A. Lohila, P.K. Patra, S. Piao, J. Rogelj, S. Syampungani, S. Zaehle, and K. Zickfeld, 2021: Global Carbon and other Biogeochemical Cycles and Feedbacks. In Climate Change 2021: The Physical Science Basis. Contribution of Working Group I to the Sixth Assessment Report of the Intergovernmental Panel on Climate Change [Masson-Delmotte, V., P. Zhai, A. Pirani, S.L. Connors, C. Péan, S. Berger, N. Caud, Y. Chen, L. Goldfarb, M.I. Gomis, M. Huang, K. Leitzell, E. Lonnoy, J.B.R. Matthews, T.K. Maycock, T. Waterfield, O. Yelekçi, R. Yu, and B. Zhou (eds.)]. Cambridge University Press, Cambridge, United Kingdom and New York, NY, USA, pp. 673–816, doi: 10.1017/9781009157896.007

Foley, J. (2021) To stop climate change, time is as important as tech. February 20, 2021, Medium. Link to source: https://globalecoguy.org/to-stop-climate-change-time-is-as-important-as-tech-1be4beb7094a 

Hanson, M. (2024) What can we really expect from Elanco’s new Bovaer®?. Dairy Herd Management, June 24, 2024. Link to source: https://www.dairyherd.com/news/education/what-can-we-really-expect-elancos-new-bovaerr 

Herrmann, M. (2023) The rise of the ‘climate friendly’ cow. April 26, 2023, DeSmog. Link to source: https://www.desmog.com/2023/04/26/rise-of-the-climate-friendly-cow/ 

Hodge, I., Quille, P., & O’Connell, S. (2024). A review of potential feed additives intended for carbon footprint reduction through methane abatement in dairy cattle. Animals, 14(4), 568. Link to source: https://doi.org/10.3390/ani14040568

Krogsad, K. (2024) Dairy cow enteric carbon mitigation calculator. Link to source: https://view.officeapps.live.com/op/view.aspx?src=https%3A%2F%2Fdairy.osu.edu%2Fsites%2Fdairy%2Ffiles%2Fimce%2FVideos_and_Software%2FDairy%2520Carbon%2520Return%2520Calculator%25202.0.xlsx&wdOrigin=BROWSELINK 

Morse, C. (2024a) Rumin8 achieves first regulatory approval in New Zealand. July 22, 2024 Rumin8.com. Link to source: https://rumin8.com/rumin8-achieves-first-regulatory-approval-in-new-zealand/ 

Morse, C. (2024b) Rumin8 achieves first regulatory approval in Brazil. October 8, 2024 Rumin8.com
Link to source: https://rumin8.com/rumin8-achieves-first-regulatory-approval-in-brazil/  

Nabuurs, G-J., R. Mrabet, A. Abu Hatab, M. Bustamante, H. Clark, P. Havlík, J. House, C. Mbow, K.N. Ninan, A. Popp, S. Roe, B. Sohngen, S. Towprayoon, 2022: Agriculture, Forestry and Other Land Uses (AFOLU). In IPCC, 2022: Climate Change 2022: Mitigation of Climate Change. Contribution of Working Group III to the Sixth Assessment Report of the Intergovernmental Panel on Climate Change [P.R. Shukla, J. Skea, R. Slade, A. Al Khourdajie, R. van Diemen, D. McCollum, M. Pathak, S. Some, P. Vyas, R. Fradera, M. Belkacemi, A. Hasija, G. Lisboa, S. Luz, J. Malley, (eds.)]. Cambridge University Press, Cambridge, UK and New York, NY, USA. doi: 10.1017/9781009157926.009

Paddision, L. (2023) Bill Gates backs start-up tackling cow burps and farts. CNN.com, January 24, 2023. Link to source: https://www.cnn.com/2023/01/24/world/cows-methane-emissions-seaweed-bill-gates-climate-intl/index.html 

Roques, S., Martinez-Fernandez, G., Ramayo-Caldas, Y., Popova, M., Denman, S., Meale, S. J., & Morgavi, D. P. (2024). Recent advances in enteric methane mitigation and the long road to sustainable ruminant production. Annual Review of Animal Biosciences, 12(1), 321-343. Link to source: https://doi.org/10.1146/annurev-animal-021022-024931

Credits

Lead Fellow 

  • Eric Toensmeier

Internal Reviewer

  • Christina Swanson, Ph.D.
Speed of Action
left_text_column_width
Caveats
left_text_column_width
Additional Benefits
left_text_column_width
Risks
left_text_column_width
Consensus
left_text_column_width
Trade-offs
left_text_column_width
Action Word
Use
Solution Title
Feed Additives
Classification
Keep Watching
Updated Date

Improve Rice Production

Image
Image
Peatland
Coming Soon
On
Summary

Rice production is a significant source of methane emissions and a minor source of nitrous oxide emissions. Most rice production occurs in flooded fields called paddies, where anaerobic conditions trigger high levels of methane production. This solution includes two related practices that each reduce emissions from paddy rice production: noncontinuous flooding and nutrient management. Noncontinuous flooding is a water management technique that reduces the amount of time rice paddy soils spend fully saturated, thereby reducing methane. Unfortunately, noncontinuous flooding increases nitrous oxide emissions. Nutrient management helps to address this challenge by controlling the timing, amount, and type of fertilization to maximize plant uptake and minimize nitrous oxide emissions.

Description for Social and Search
Improve Rice Production reduces methane emissions from rice paddies by converting from continuous flooding to noncontinuous flooding, and reduces the nitrous oxide emissions that result by adopting improved nutrient management as well.
Overview

Rice is a staple crop of critical importance, occupying 11% of global cropland (FAOstat, 1997). Rice production has higher emissions than most crop production, accounting for 9% of all anthropogenic methane and 10% of cropland nitrous oxide (Wang et al., 2020). Nabuurs et al. (2022) found methane emissions from global rice production to be 0.8–1.0 Gt CO₂‑eq/yr and growing 0.4% annually.

It is important to first define some terms. Rice paddy systems are fields with berms and plumbing to permit the flooding of rice for the production periods, which helps with weed and pest control (rice thrives in flooded conditions, though it does not require them). Paddy rice is the main source of methane from rice production. Upland rice is grown outside of paddies and does not produce significant methane emissions, so it is excluded from this analysis. Irrigated paddies are provided with irrigation water, while rain-fed paddies are only filled by rainfall and runoff (Raffa, 2021). For this analysis, we consider both irrigated and rain-fed paddies.

Methane Reduction

Flooded rice paddies encourage methanogenesis, the production of methane by microbes. Conventional paddy rice production uses continuous flooding, in which the paddy is flooded for the full rice production period. There are several approaches to reducing methane, with the most widespread being noncontinuous flooding. This is a collection of practices (such as alternate wetting and drying) that drain the fields one or more times during the rice production period. As a result, the paddy spends less time in its methane-producing state. This can be done without reducing rice yields in many, but not all, cases, and also results in a significant reduction of irrigation water use (Bo et al., 2022). Impacts on yields depend on soils, climate, and other variables (Cheng et al., 2022). 

Nitrous Oxide Reduction

A major drawback to noncontinuous flooding is that it increases nitrous oxide emissions from fertilizer application compared to continuous flooding. High nitrogen levels in flooded paddies encourage the growth of bacteria that produce methane, reduce the natural breakdown of methane, and facilitate emissions of nitrous oxide to the atmosphere (Li et al., 2024). The effect is small compared to the mitigated emissions from methane reduction (Jiang et al., 2019), but remains serious. Use of nutrient management techniques, such as controlling fertilizer amount, type (e.g., controlled-release urea), timing, and application techniques (e.g., deep fertilization) can reduce these emissions. This is in part because nitrogen fertilizers are often overapplied, leaving room to increase efficiency without reducing rice yields (Hergoualc’h et al., 2019; Li et al., 2024). 

Other Promising Practices

Other practices also show potential but are not included in our analysis at this time. These include the application of biochar to rice paddies and the use of certain rice cultivars that produce fewer emissions (Qian et al., 2023). Other approaches include saturated soil culture, System of Rice Intensification (“SRI”), ground-cover systems, raised beds, and improved irrigation and paddy infrastructure (Surendran et al., 2021). 

Note that some practices, such as incorporating rice straw or the use of compost or manure, can increase nitrous oxide emissions (Li et al., 2024). 

There is also evidence that, under some circumstances, noncontinuous flooding can sequester soil organic carbon by increasing soil organic matter. However, there are not enough data available to quantify this (Qian et al., 2023). Indeed, one meta-analysis found that noncontinuous flooding can actually lead to a decrease in soil organic carbon (Livsey et al., 2019). One complication is that many production areas plant rice two or even three times per year, and data are typically presented on a per-harvest or even per-flooded day basis. To overcome this challenge, we use data on the percentage of global irrigated rice land in single, double, and triple cropping from Carlson et al. (2016) to create weighted average values as appropriate.

Adalibieke, W., Cui, X., Cai, H., You, L., & Zhou, F. (2023). Global crop-specific nitrogen fertilization dataset in 1961–2020. Scientific Data10(1), 617. Link to source: https://doi.org/10.1038/s41597-023-02526-z

Bo, Y., Jägermeyr, J., Yin, Z., Jiang, Y., Xu, J., Liang, H., & Zhou, F. (2022). Global benefits of non‐continuous flooding to reduce greenhouse gases and irrigation water use without rice yield penalty. Global Change Biology28(11), 3636-3650. Link to source: https://doi.org/10.1111/gcb.16132

Carlson, K. M., Gerber, J. S., Mueller, N. D., Herrero, M., MacDonald, G. K., Brauman, K. A., Havlik, P., O’Connell, C.S., Johnson, J.A., Saatchi, S., & West, P.C. (2017). Greenhouse gas emissions intensity of global croplands. Nature Climate Change7(1), 63-68. Link to source: https://doi.org/10.1038/nclimate3158 

Cheng, H., Shu, K., Zhu, T., Wang, L., Liu, X., Cai, W., Qi, Z., & Feng, S. (2022). Effects of alternate wetting and drying irrigation on yield, water and nitrogen use, and greenhouse gas emissions in rice paddy fields. Journal of Cleaner Production349, 131487. Link to source: https://doi.org/10.1016/j.jclepro.2022.131487

Cui, X., Zhou, F., Ciais, P., Davidson, E. A., Tubiello, F. N., Niu, X., Ju, X., Canadell, J.P., Bouwman, A.F., Jackson, R.B., Mueller, N.D., Zheng, X., Kanter, D.R., Tian, H., Adalibieke, W., Bo, Y., Wang, Q., Zhan, X., & Zhu, D. (2021). Global mapping of crop-specific emission factors highlights hotspots of nitrous oxide mitigation. Nature Food2(11), 886-893. Link to source: https://doi.org/10.1038/s43016-021-00384-9 

Damania, R., Polasky, S., Ruckelshaus, M., Russ, J., Chaplin-Kramer, R., Gerber, J., Hawthorne, P., Heger, M.P., Mamun, S., Amann, M., Ruta, G., & Wagner, F. (2023). Nature's Frontiers: Achieving Sustainability, Efficiency, and Prosperity with Natural Capital. World Bank Publications. Link to source: https://openknowledge.worldbank.org/entities/publication/855c2e15-c88b-4c04-a2e5-2d98c25b8eca 

Enriquez, Y., Yadav, S., Evangelista, G. K., Villanueva, D., Burac, M. A., & Pede, V. (2021). Disentangling challenges to scaling alternate wetting and drying technology for rice cultivation: Distilling lessons from 20 years of experience in the Philippines. Frontiers in Sustainable Food Systems5, 1-16. https://doi.10.3389/fsufs.2021.675818  

Food and Agriculture Organization of the United Nationals. FAOSTAT Statistical Database, [Rome]: FAO, 1997. Link to source: https://www.fao.org/faostat/en/

Gerber, J. S., Ray, D. K., Makowski, D., Butler, E. E., Mueller, N. D., West, P. C., Johnson, J. A., Polasky, S., Samberg, L. H., & Siebert, S. (2024). Global spatially explicit yield gap time trends reveal regions at risk of future crop yield stagnation. Nature Food5(2), 125–135. Link to source: https://doi.org/10.1038/s43016-023-00913-8

Gu, B., Zhang, X., Lam, S. K., Yu, Y., Van Grinsven, H. J., Zhang, S., Wang, X., Bodirsky, B.L., Wang, S., Duan, J., Ren, C., Bouwman, L., de Vries, W., Xu, J., & Chen, D. (2023). Cost-effective mitigation of nitrogen pollution from global croplands. Nature613(7942), 77-84. Link to source: https://doi.org/10.1038/s41586-022-05481-8 

Hergoualc’h, K., Akiyama, H., Bernoux, M., Chirinda, N., del Prado, A., Kasimir, A., MacDonald, J.D., Ogle, S.M., Regina, K., van der Weerden, T.J. (2019) 2019 Refinement to the 2006 IPCC Guidelines for National Greenhouse Gas Inventories. Chapter 11: N2O Emissions from Managed Soils, and CO2 Emissions from Lime and Urea Application. Cambridge University Press, Cambridge, UK and New York, NY USA. Link to source: https://www.ipcc-nggip.iges.or.jp/public/2006gl/pdf/4_Volume4/V4_11_Ch11_N2O%26CO2.pdf

Jiang, Y., Carrijo, D., Huang, S., Chen, J., Balaine, N., Zhang, W., Van Groenigen, K.J. & Linquist, B. (2019). Water management to mitigate the global warming potential of rice systems: A global meta-analysis. Field Crops Research, 234, 47–54. Link to source: https://doi.org/10.1016/j.fcr.2019.02.101

Lampayan, R. M., Rejesus, R. M., Singleton, G. R., & Bouman, B. A. (2015). Adoption and economics of alternate wetting and drying water management for irrigated lowland rice. Field Crops Research170, 95-108. Link to source: https://doi.org/10.1016/j.fcr.2014.10.013

Li, L., Huang, Z., Mu, Y., Song, S., Zhang, Y., Tao, Y., & Nie, L. (2024). Alternate wetting and drying maintains rice yield and reduces global warming potential: A global meta-analysis. Field Crops Research318, 109603. Link to source: https://doi.org/10.1016/j.fcr.2024.109603

Linquist, B. A., Adviento-Borbe, M. A., Pittelkow, C. M., van Kessel, C., & van Groenigen, K. J. (2012). Fertilizer management practices and greenhouse gas emissions from rice systems: a quantitative review and analysis. Field Crops Research135, 10-21. Link to source: https://doi.org/10.1016/j.fcr.2012.06.007

Livsey, J., Kätterer, T., Vico, G., Lyon, S. W., Lindborg, R., Scaini, A., Da, C.T,. & Manzoni, S. (2019). Do alternative irrigation strategies for rice cultivation decrease water footprints at the cost of long-term soil health?. Environmental Research Letters14(7), 074011. Link to source: https://doi.org/10.1088/1748-9326/ab2108 

Ludemann, C. I., Gruere, A., Heffer, P., & Dobermann, A. (2022). Global data on fertilizer use by crop and by country. Scientific data9(1), 1-8. Link to source: https://doi.org/10.1038/s41597-022-01592-z 

Nabuurs, G-J., R. Mrabet, A. Abu Hatab, M. Bustamante, H. Clark, P. Havl.k, J. House, C. Mbow, K.N. Ninan, A. Popp, S. Roe, B. Sohngen, S. Towprayoon, 2022: Agriculture, Forestry and Other Land Uses (AFOLU). In IPCC, 2022: Climate Change 2022: Mitigation of Climate Change. Contribution of Working Group III to the Sixth Assessment Report of the Intergovernmental Panel on Climate Change [P.R. Shukla, J. Skea, R. Slade, A. Al Khourdajie, R. van Diemen, D. McCollum, M. Pathak, S. Some, P. Vyas, R. Fradera, M. Belkacemi, A. Hasija, G. Lisboa, S. Luz, J. Malley, (eds.)]. Cambridge University Press, Cambridge, UK and New York, NY, USA. doi: 10.1017/9781009157926.009

Ogle, S. M., Wakelin, S. J., Buendia, L., McConkey, B., Baldock, J., Akiyama, H., ... & Zheng, X. (2019). 2019 Refinement to the 2006 IPCC Guidelines for National Greenhouse Gas Inventories. Chapter 4: Cropland. Cambridge University Press, Cambridge, UK and New York, NY USA. Link to source: https://www.ipcc.ch/report/2019-refinement-to-the-2006-ipcc-guidelines-for-national-greenhouse-gas-inventories/ 

Qian, H., Zhu, X., Huang, S., Linquist, B., Kuzyakov, Y., Wassmann, R., ... & Jiang, Y. (2023). Greenhouse gas emissions and mitigation in rice agriculture. Nature Reviews Earth & Environment, 4(10), 716-732. Link to source: https://doi.org/10.1038/s43017-023-00482-1 

Raffa, D.W. & Morales-Abubakar, A. L. (2021) Soil Health for Paddy Rice. FAO, Rome. Link to source: https://openknowledge.fao.org/server/api/core/bitstreams/fcd04aae-0389-411b-8a47-a622b23d642f/content 

Roe, S., Streck, C., Beach, R., Busch, J., Chapman, M., Daioglou, V., Deppermann, A., Doelman, J., Emmet-Booth, J., Engelmann, J., Fricko, O., Frischmann, C., Funk, J., Grassi, G., Griscom, B., Havlik, P., Hanssen, S., Humpenöder, F., Landholm, D., LOmax, G., Lehmann, J., Mesnildrey, L., Nabuurrs, G., Popp, A., Rivard, C., Sanderman, J., Sohngen, B., Smith, P., Stehfest, E., Woolf, D., & Lawrence, D. (2021). Land‐based measures to mitigate climate change: Potential and feasibility by country. Global Change Biology27(23), 6025-6058. Link to source: https://doi.org/10.1111/gcb.15873

Salmon, J. M., Friedl, M. A., Frolking, S., Wisser, D., & Douglas, E. M. (2015). Global rain-fed, irrigated, and paddy croplands: A new high resolution map derived from remote sensing, crop inventories and climate data. International Journal of Applied Earth Observation and Geoinformation38, 321-334. Link to source: https://doi.org/10.1016/j.jag.2015.01.014

Surendran, U., Raja, P., Jayakumar, M., & Subramoniam, S. R. (2021). Use of efficient water saving techniques for production of rice in India under climate change scenario: A critical review. Journal of Cleaner Production309Link to source: https://doi.org/10.1016/j.jclepro.2021.127272

Xia, L., Lam, S. K., Chen, D., Wang, J., Tang, Q., & Yan, X. (2017). Can knowledge‐based N management produce more staple grain with lower greenhouse gas emission and reactive nitrogen pollution? A meta‐analysis. Global change biology23(5), 1917-1925. Link to source: https://doi.org/10.1111/gcb.13455

Zhang, Y., Wang, W., Li, S., Zhu, K., Hua, X., Harrison, M.T., Liu, K., Yang, J., Liu, L, & Chan, Y. (2023). Integrated management approaches enabling sustainable rice production under alternate wetting and drying irrigation. Agricultural Water Management, 281. Link to source: https://doi.org/10/1016/j.agwat.2023.108265

Credits

Lead Fellow

  • Eric Toensmeier

Contributors

  • Ruthie Burrows, Ph.D.

  • James Gerber, Ph.D.

  • Yusuf Jameel, Ph.D.

  • Daniel Jasper

  • Alex Sweeney

Internal Reviewers

  • Aiyana Bodi

  • James Gerber, Ph.D.

  • Hannah Henkin

  • Zoltan Nagy, Ph.D.

  • Ted Otte

  • Paul C. West, Ph.D.

Effectiveness

Methane Reduction

We calculated per-hectare methane emissions using the Intergovernmental Panel on Climate Change (IPCC) methodology (Ogle et. al, 2019). To develop regional emissions per rice harvest, we multiplied standard regional daily baseline emissions by standard cultivation period lengths, then multiplied by the mean scaling factor for noncontinuous flooding systems. However, the total number of rice harvests per year ranged from one to three. Carlson et al. (2016) reported a global figure of harvests on rice fields: 42% were harvested once, 50% were harvested twice, and 8% were harvested three times. We used this to develop a weighted average methane emissions figure for each region. National effectiveness ranged from 1.55 to 3.29 t CO2-eq/ha/yr (Table 1).

Nitrous Oxide Reduction

Using data from Adalibieke et al. (2024) and Gerber et al. (2024), we calculated the current country-level rate of nitrogen application per hectare and a target rate reflecting improved efficiency through nutrient management (see “nitrous oxide emissions”). For a full methodology, see the Appendix. 

In noncontinuously flooded systems, nitrous oxide emissions are 1.66 times higher per t of nitrogen applied (Hergoualc’h et al., 2019). Using the different emissions factors, we calculated total nitrous oxide emissions for: 1) flooded rice with current nitrogen application rates, and 2) noncontinuously flooded rice with target nitrogen application rates. 

The combined effectiveness of noncontinuous flooding and nutrient management for each country with over 100,000 ha of rice production was –0.48–0.09 t CO2-eq/ha/yr (Table 1).

Combined Reduction

Combined effectiveness of methane and nitrous oxide reduction was 1.49–3.39 t CO2-eq/ha/yr (Table 1).

left_text_column_width

Table 1. Combined effectiveness at reducing emissions, by country, for noncontinuous flooding with nutrient management. 

Methane & Nitrous Oxide Reductions by Country
Methane & Nitrous Oxide Reduction (t CO2-eq/ha/yr)
Country methane reduction, t CO2-eq/ha/yr nitrous oxide reduction, t CO2-eq/ha/yr Combined effectiveness, t CO2-eq/ha/yr
Afghanistan1.63 (4.75)0.03 (0.03)1.67 (4.78)
Argentina2.70 (7.85)0.07 (0.07)2.77 (7.93)
Bangladesh1.63 (4.75)0.06 (0.06)1.69 (4.81)
Benin2.30 (6.71)0.03 (0.03)2.34 (6.74)
Bolivia (Plurinational State of)2.70 (7.85)0.00 (0.00)2.70 (7.85)
Brazil2.70 (7.85)0.00 (0.00)2.70 (7.86)
Burkina Faso2.30 (6.71)–0.02 (0.02)2.28 (6.68)
Cambodia2.13 (6.21)0.01 (0.01)2.15 (6.22)
Cameroon2.30 (6.71)0.00 (0.00)2.30 (6.71)
Chad2.30 (6.71)0.01 (0.01)2.32 (6.72)
China2.48 (7.20)0.01 (0.01)2.48 (7.21)
Colombia2.70 (7.85)–0.07 (–0.07)2.63 (7.21)
Côte d'Ivoire2.30 (6.71)0.02 (0.02)2.32 (6.73)
Democratic People's Republic of Korea2.48 (7.20)0.02 (0.02)2.50 (7.23)
Democratic Republic of the Congo2.30 (6.71)0.01 (0.01)2.31 (6.71)
Dominican Republic2.70 (7.85)–0.16 (0.16)2.54 (7.69)
Ecuador2.70 (7.85)–0.08 (–0.08)2.62 (7.77)
Egypt2.30 (6.71)–0.15 (–0.15)2.16 (6.56)
Ghana2.30 (6.71)0.05 (0.05)2.35 (6.76)
Guinea2.30 (6.71)0.01 (0.01)2.32 (6.72)
Guinea-Bissau2.30 (6.71)0.01 (0.01)2.32 (6.72)
Guyana2.70 (7.85)–0.06 (–0.06)2.63 (7.79)
India1.63 (4.75)–0.02 (–0.02)1.61 (4.73)
Indonesia2.13 (6.21)0.11 (011)2.24 (6.31)
Iran (Islamic Republic of)3.29 (9.57)–0.05 (–0.05)3.24 (9.52)
Italy3.29 (9.57)0.00 (0.00)3.29 (9.57)
Japan2.48 (7.20)0.07 (0.07)2.54 (7.27)
Lao People's Democratic Republic2.13 (6.21)0.02 (0.02)2.15 (6.23)
Liberia2.30 (6.71)0.02 (0.02)2.32 (6.72)
Madagascar2.30 (6.71)0.00 (0.00)2.31 (6.71)
Malaysia2.13 (6.21)–0.01 (–0.01)2.13 (6.20)
Mali2.30 (6.71)–0.03 (–0.03)2.28 (6.20)
Mozambique2.30 (6.71)0.01 (0.01)2.32 (6.72)
Myanmar2.13 (6.21)0.04 (0.04)2.17 (6.25)
Nepal1.63 (4.75)0.04 (0.04)1.67 (4.79)
Nigeria2.30 (6.71)0.01 (0.01)2.32 (6.72)
Pakistan1.63 (4.75)–0.04 (–0.04)1.59 (4.71)
Paraguay2.70 (7.85)0.01 (0.01)2.71 (7.86)
Peru2.70 (7.85)0.09 (0.09)2.79 (7.95)
Philippines2.13 (6.21)0.00 (0.00)2.14 (6.21)
Republic of Korea2.48 (7.20)0.00 (0.00)2.47 (7.20)
Russian Federation3.29 (9.57)0.04 (0.04)3.33 (9.61)
Senegal2.30 (6.71)–0.04 (–0.04)2.27 (6.67)
Sierra Leone2.30 (6.71)0.02 (0.02)2.32 (6.73)
Sri Lanka1.63 (4.75)0.02 (0.02)1.65 (4.77)
Thailand2.13 (6.21)–0.03 (–0.03)2.10 (6.18)
Turkey3.29 (9.57)0.10 (0.10)3.39 (9.67)
Uganda2.30 (6.71)0.00 (0.00)2.31 (6.71)
United Republic of Tanzania2.30 (6.71)0.04 (0.04)2.35 (6.75)
United States of America1.55 (4.51)–0.05 (–0.05)1.49 (4.45)
Uruguay2.70 (7.85)0.03 (0.03)2.72 (7.88)
Venezuela (Bolivarian Republic of)2.70 (7.85)–0.48 (–0.48)2.22 (7.38)
Vietnam2.13 (6.21)0.00 (0.00)2.13 (6.20)

Unit: t CO₂‑eq (100-yr, with 20-yr in parentheses)/ha installed/yr

Left Text Column Width
Cost

For conventional paddy rice, we assumed an initial cost of US$0 because many millions of hectares of paddies are already in place (Table 2). We used regional per-ha average profits from Damania et al. (2024) as the source for net profit per year. Because the initial cost per hectare is US$0, the net cost per hectare is the negative of the per-hectare annual profit.

left_text_column_width

Table 2. Net cost and profit of conventional paddy rice by region in 2023.

Unit: US$/ha

Africa 0.00
East Asia 0.00
Europe 0.00
North America 0.00
South America 0.00
South Asia 0.00
Southeast Asia 0.00

Unit: US$/ha/yr

Africa 457.34
East Asia 543.67
Europe 585.43
North America 356.27
South America 285.69
South Asia 488.85
Southeast Asia 322.13

Unit: US$/ha/yr

Africa -457.34
East Asia -543.67
Europe -585.43
North America -356.27
South America -285.69
South Asia -488.85
Southeast Asia -322.13
Left Text Column Width

For noncontinuous flooding, we assumed an initial cost of US$0 because no new inputs or changes to paddy infrastructure are required in most cases. Median impact on net profit was an increase of 17% based on nine data points from seven sources. National results are shown in Table 3.

We assumed nutrient management has an initial cost of US$0 because in many cases, nutrient management begins with reducing the over-application of fertilizer. Here we used the mean value from Gu et al. (2023), a savings of US$507.80/t nitrogen. We used our national-level data on over-application of nitrogen to calculate savings per hectare. National results are shown in Table 3.

Combined Net Profit per Hectare

Net profit per hectare varies by country due to regional and some country-specific variables. Country-by-country results are shown in Table 3.

Net Net Cost Compared to Conventional Paddy Rice

Net net cost varies by country. Country-by-country results are shown in Table 3.

left_text_column_width

Table 3. Net cost and profit of noncontinuous flooding with nutrient management by region in 2023 US$/ha/yr.

Unit: US$/ha

Afghanistan 0.00
Argentina 0.00
Bangladesh 0.00
Benin 0.00
Bolivia (Plurinational State of) 0.00
Brazil 0.00
Burkina Faso 0.00
Cambodia 0.00
Cameroon 0.00
Chad 0.00
China 0.00
Colombia 0.00
Cote d'Ivoire 0.00
Democratic People's Republic of Korea 0.00
Democratic Republic of the Congo 0.00
Dominican Republic 0.00
Ecuador 0.00
Egypt 0.00
Ghana 0.00
Guinea 0.00
Guinea–Bissau 0.00
Guyana 0.00
India 0.00
Indonesia 0.00
Iran (Islamic Republic of) 0.00
Italy 0.00
Japan 0.00
Lao People's Democratic Republic 0.00
Liberia 0.00
Madagascar 0.00
Malaysia 0.00
Mali 0.00
Mozambique 0.00
Myanmar 0.00
Nepal 0.00
Nigeria 0.00
Pakistan 0.00
Paraguay 0.00
Peru 0.00
Philippines 0.00
Republic of Korea 0.00
Russian Federation 0.00
Senegal 0.00
Sierra Leone 0.00
Sri Lanka 0.00
Thailand 0.00
Turkey 0.00
Uganda 0.00
United Republic of Tanzania 0.00
United States of America 0.00
Uruguay 0.00
Venezuela (Bolivarian Republic of) 0.00
Viet Nam 0.00

Non-continuous flooding and nutrient management.

Left Text Column Width

Cost per unit climate impact

The cost per t CO₂‑eq varies by country. Country-by-country results are shown in Table 3. The global weighted average is –US$15.03/t CO₂‑eq (Table 4). Note that this cost is the same for both 100- and 20-yr results.

left_text_column_width

Table 4. Weighted average cost per unit climate impact.

Unit: US$ (2023) per t CO₂‑eq

Weighted average -15.03
Left Text Column Width
Learning Curve

Learning curve data are not available for improved rice cultivation.

left_text_column_width
Speed of Action

Speed of action refers to how quickly a climate solution physically affects the atmosphere after it is deployed. This is different from speed of deployment, which is the pace at which solutions are adopted. 

At Project Drawdown, we define the speed of action for each climate solution as gradualemergency brake, or delayed

The noncontinuous flooding component of Improve Rice Production is an EMERGENCY BRAKE climate solution. It has a disproportionately fast impact after implementation because it reduces the short-lived climate pollutant methane. 

The nutrient management component is a GRADUAL climate solution. It has a steady, linear impact on the atmosphere. The cumulative effect over time builds as a straight line.

left_text_column_width
Caveats

Caveats like additionality and permanence do not apply to improve rice production as described here. If its carbon sequestration component were included, those caveats would apply.

left_text_column_width
Current Adoption

Noncontinuous Flooding

Rigorous, up-to-date, country-level data about the extent of noncontinuous flooding in rice production are in short supply. We found five sources reporting adoption in seven major rice-producing countries. We used these to create regional averages and applied them to all countries that produce more than 100,000 ha of rice (paddy and upland). The total estimated current adoption is 48.65 Mha, or 47% of global rice paddy area (Table 5). This should be considered an extremely rough estimate. 

The available sources encompass different forms of noncontinuous flooding, including alternate wetting and drying (Philippines, Vietnam, Bangladesh), mid-season drainage (Japan), or both (China). 

left_text_column_width

Table 5. Current adoption level (2025).

Unit: Mha

mean 46.65

Noncontinuous flooding, ha installed.

Left Text Column Width

Nutrient Management

Nutrient management adoption is based on our analysis of the overapplication of nitrogen fertilizer on a national basis. Rather than calculate adoption in a parallel way to noncontinuous flooding, this approach provides a national average overapplication rate.

left_text_column_width
Adoption Trend

We assume the adoption of both noncontinuous flooding and nutrient management for each hectare.

Adoption trend information here takes the form of annual growth rate (%), with a median of 3.76% (Table 6). Adoption rate data are somewhat scarce.

left_text_column_width

Table 6. Adoption trend.

Unit: %

25th percentile 3.00
median (50th percentile) 3.76
75th percentile 4.25

Percent annual growth rate.

Left Text Column Width
Adoption Ceiling

There are barriers to adoption of these techniques and practices. Not all paddy rice is suitable for improved water management, and under certain conditions, undesirable yield reductions are possible (Bo et al., 2022). Other challenges include water access, coordinating water usage between multiple users, and ownership of water pumps (Nabuurs et al., 2022).

There are many challenges in estimating paddy rice land. Food and Agriculture Organization (FAO) statistics can overcount because land that produces more than one crop is double or triple counted. Satellite imagery is often blocked by clouds in the tropical humid areas where rice paddies are concentrated. A comprehensive effort to calculate total world rice paddy land reported 66.00 Mha of irrigated paddy and 63.00 Mha of rain-fed paddy (Salmon et al., 2015). Our own calculation of the combined paddy rice area of countries producing over 100,000 ha of rice found 104.1 Mha of paddy rice.

We applied national adoption ceilings for noncontinuous flooding from Bo et al. (2022) to the total national paddy area to determine maximum hectares for each country. Several countries have already exceeded this threshold, and we included their higher adoption in our calculation. The sum of these, and therefore, the median adoption ceiling, is 77.53 Mha (Table 7).

left_text_column_width

Table 7. Adoption ceiling: upper limit for adoption level.

Unit: Mha

median 77.53

ha of noncontinuous flooding installed.

Left Text Column Width
Achievable Adoption

Given that both China and Japan have already attained adoption rates above our adoption ceiling (Bo et al., 2022; Zhang et al., 2019), we selected for our adoption ceiling our Achievable – High adoption level, which is 77.53 Mha (Table 8).

In contrast, the countries with the lowest adoption rates had rates under 3%. In the absence of a modest adoption example, we chose to use current adoption plus 10% as our Achievable – Low adoption level. This provides an adoption of 53.15 Mha. 

As described under Adoption Ceiling, adoption of nutrient management is already weighted based on regional or national adoption and should not be overcounted in the achievable range calculations.

left_text_column_width

Table 8. Range of achievable adoption levels.

Unit: Mha

Current Adoption 48.65
Achievable – Low 53.51
Achievable – High 77.53
Adoption Ceiling 77.53

Mha of noncontinuous flooding installed. 

Left Text Column Width

We calculated the potential impact of improved rice, on a 100-yr basis, at 0.10 Gt CO₂‑eq/yr from current adoption, and 0.11, 0.16, and 0.16 from Achievable – Low, Achievable – High, and Adoption Ceiling, respectively (Table 9). On a 20-yr basis, the totals are 0.29, 0.31, 0.48, and 0.48, respectively.

left_text_column_width

Table 9. Climate impact at different levels of adoption.

Unit: Gt CO₂‑eq/yr

Current Adoption 0.10
Achievable – Low 0.11
Achievable – High 0.16
Adoption Ceiling 0.16

Unit: Gt CO₂‑eq/yr

Current Adoption 0.29
Achievable – Low 0.31
Achievable – High 0.48
Adoption Ceiling 0.48
Left Text Column Width

The IPCC estimated a technical potential at 0.3 Gt CO₂‑eq/yr, with 0.2 Gt CO₂‑eq/yr as economically achievable at US$100/t CO₂ (100-yr basis; Nabuurs et al., 2022). Achieving the adoption ceiling of 76% of global flooded rice production could reduce rice paddy methane by 47% (Bo et al., 2022). Applying this percentage to the IPCC reported total paddy methane emissions of 0.49–0.73 Gt CO₂‑eq/yr yields a reduction of 0.23-0.34 Gt CO₂‑eq/yr (Nabuurs et al., 2022). Roe et al. (2021) calculated 0.19 Gt CO₂‑eq/yr. Note that these benchmarks only calculate methane from paddy rice, while we also addressed nitrous oxide from nutrient management.

left_text_column_width
Additional Benefits

The additional benefits of improved rice production arise from both practices (noncontinuous flooding and improved nutrient management) that form this solution. 

Health

Noncontinuous flooding can reduce the accumulation of arsenic in rice grains (Ishfaq et al., 2020). Arsenic is a carcinogen that is responsible for thousands of premature deaths in South and Southeast Asia (Jameel et al., 2021). The amount of arsenic mitigated can vary by 0–90% depending upon the timing of the wetting and drying periods (Ishfaq et al., 2020).

Land Resources

Better nutrient management improves soil fertility and health, increasing resilience to extreme heat and droughts. Noncontinuous flooding also slows down the rate of soil salinization, protecting soil from degradation (Carrijo et al., 2017). 

Water Resources

Rice irrigation is responsible for 40% of all freshwater use in Asia, and rice requires two to three times more water per metric ton of grain than other cereals (Surendran et al., 2021). Field studies across South and Southeast Asia have shown that noncontinuous flooding can typically reduce irrigation requirements 20–30% compared to conventional flooded systems (Suwanmaneepong et al., 2023; Carrijo et al., 2017) without adversely affecting rice yield or grain quality. This reduction in water usage alleviates pressure on water resources in drought-prone areas (Alauddin et al., 2020).

Adoption of noncontinuous flooding up to the adoption ceiling of 76% would reduce rice irrigation needs by 25%. 

Water Quality

Both noncontinuous flooding and improved nutrient management mitigate water pollution. Nitrogen utilization is generally poor using existing growing techniques, with two-thirds of the nitrogen fertilizer being lost through surface runoff and denitrification (Zhang et al., 2021). While noncontinuous flooding is primarily a water-efficiency and methane reduction technique, it can improve nitrogen use efficiency and reduce nitrogen runoff into water bodies (Liang et al., 2017; Liang et al., 2023). Improved nutrient management also reduces the excess fertilizers that could end up in local water bodies. Both mechanisms can mitigate eutrophication and harmful algal blooms, protect aquatic ecosystems, and ensure safer drinking water supplies (Liang et al., 2013; Singh & Craswell, 2021). 

left_text_column_width
Risks

Not all paddies are suitable, with variables including soil type, irrigation infrastructure and ownership, community partitioning and scheduling of water resources, field size, and more (Nabuurs et al., 2022; Enriquez et al., 2021).

Many rice farmers in Asia do not directly control irrigation access, but instead use a municipal system, which is not always available when needed for noncontinuous flooding production. In addition, they may not actually experience cost savings, as pricing may be based on area rather than amount of water. An additional change is that multiple plots owned or rented by multiple farmers may be irrigated by a single irrigation gate, meaning that all must agree to an irrigation strategy. Generally speaking, pump-based irrigation areas see the best adoption, with poor adoption in gravity-based irrigation system areas. Improved irrigation infrastructure is necessary to increase adoption of noncontinuous flooding (Enriquez et al., 2021). 

Continuously flooded paddies have lower weed pressure than noncontinuous paddies, so noncontinuous flooding can raise labor costs or increase herbicide use. Not all rice varieties grow well in noncontinuous flooding (Li et al., 2024). In addition, it is difficult for farmers, especially smallholders, to monitor soil moisture level, which makes determining the timing of the next irrigation difficult (Livsey et al., 2019). 

left_text_column_width
Interactions with Other Solutions

We did not identify any aligned or competing interactions with other solutions.

left_text_column_width
Dashboard

Solution Basics

t CO₂-eq (100-yr)/unit
units
Current 0
Achievable (Low to High)

Climate Impact

Gt CO₂-eq (100-yr)/yr
Current 0.1 0.10.16
US$ per t CO₂-eq
-15
Emergency Brake

CH₄ , N₂O

Trade-offs

In some cases, rice yields are reduced (Nabuurs et al., 2022). However, this has been excluded from our calculations because we worked from the adoption ceiling of Bo et al. (2022), which explicitly addresses the question of maximum adoption without reducing yields.

Long-term impacts on soil health of water-saving irrigation strategies have not been widely studied, but a meta-analysis by Livsey et al. (2019) indicates a risk of decreases in soil carbon and fertility.

left_text_column_width
% of area
0100

Cultivated areas of paddy rice, 2020

Cao, P., Bilotto, F., Gonzalez Fischer, C, Mueller, N. D., Carlson, K. M., Gerber, J.S., Smith, P., Tubiello, F. N., West, P. C., You, L., and Herrero, M. (2025). Mapping greenhouse gas emissions from global cropland circa 2020 [Data set, PREPRINT Version 1]. In review at Nature Communication. Link to source: https://doi.org/10.21203/rs.3.rs-6622054/v1

Tang, F. H. M., Nguyen, T. H., Conchedda, G., Casse, L., Tubiello, F. N., and Maggi, F. (2024). CROPGRIDS: A global geo-referenced dataset of 173 crops [Data set].Scientific Data, 11(1), 413. Link to source: https://doi.org/10.1038/s41597-024-03247-7

Action Word
Improve
Solution Title
Rice Production
Classification
Highly Recommended
Lawmakers and Policymakers
  • Set national targets for improving rice production and incorporate them into planning documents such as Nationally Determined Contributions.
  • If possible and appropriate, encourage rice farmers to adopt noncontinuous flooding.
  • Use policies and regulations to improve nutrient management by focusing on the four principles – right rate, right type of fertilizer, right time, and right place.
  • Invest in research and development to improve rice varieties to require less water, have shorter growth periods, produce higher yields, and tolerate more stress.
  • Invest in research and development to improve water monitoring technology and discover alternative fertilizers.
  • Improve the reliability of water irrigation systems.
  • Work with farmers and private organizations to improve data collection on advanced cultivation uptake and water management.
  • Join, create, or participate in partnerships or certification programs dedicated to improving rice cultivation.
Practitioners
  • Practice noncontinuous flooding.
  • Take advantage of financial incentives such as tax rebates and subsidies for improved rice cultivation.
  • Improve nutrient management by focusing on the four principles – right rate, right type of fertilizer, right time, and right place.
  • Plant improved rice varieties that require less water, have shorter growth periods, produce higher yields, and tolerate more stress.
  • Work with policymakers and private organizations to improve data collection on advanced cultivation uptake and water management.
  • Join, create, or participate in partnerships or certification programs dedicated to improving rice cultivation.
Business Leaders
  • Source food from farms that practice improved rice cultivation.
  • Invest in companies that utilize improved rice cultivation techniques or produce the necessary inputs.
  • Promote products that employ improved rice cultivation techniques and educate consumers about the importance of the practice.
  • Enter into offtake agreements for rice grown with improved techniques.
  • Invest in research and development to improve rice varieties to require less water, have shorter growth periods, produce higher yields, and tolerate more stress.
  • Invest in research and development to improve water monitoring technology and identify alternative fertilizers.
  • Work with farmers and private organizations to improve data collection on advanced cultivation uptake and water management.
  • Advocate to policymakers for improved rice cultivation techniques, incentives, and regulations.
  • Join, create, or participate in partnerships or certification programs dedicated to improving rice cultivation.
Nonprofit Leaders
  • Source food from farms that practice improved rice cultivation.
  • Start model farms to demonstrate techniques, conduct experiments, and educate local farmers.
  • Engage with businesses to encourage corporate responsibility and/or monitor rice production.
  • Help develop rice varieties to require less water, have shorter growth periods, produce higher yields, and tolerate more stress.
  • Help improve water monitoring technology and develop alternative fertilizers.
  • Work with farmers and other private organizations to improve data collection on advanced cultivation uptake and water management.
  • Advocate to policymakers for improved rice cultivation techniques, incentives, and regulations.
  • Join, create, or participate in partnerships or certification programs dedicated to improving rice cultivation.
Investors
  • Ensure portfolio companies and company procurement use improved rice cultivation techniques.
  • Offer financial services, including low-interest loans, micro-financing, and grants to support improving rice cultivation.
  • Invest in electronically-traded funds (ETFs), environmental, social and governance (ESG) funds, and green bonds issued by companies committed to improved rice cultivation.
  • Invest in companies developing technologies that support improved nutrient management, such as precision fertilizer applicators, alternative fertilizers, soil management equipment, and software.
  • Invest in start-ups that aim to improve rice varieties to require less water, have shorter growth periods, produce higher yields, and tolerate more stress.
  • Join, create, or participate in partnerships or certification programs dedicated to improving rice cultivation.
Philanthropists and International Aid Agencies
  • Work with agricultural supply chain sources to ensure partners employ improved rice production methods, if relevant.
  • Start model farms to demonstrate techniques, conduct experiments, and educate local farmers.
  • Offer financial services, including low-interest loans, micro-financing, and grants to support improving rice cultivation.
  • Engage with businesses to encourage corporate responsibility and/or monitor rice production.
  • Help develop rice varieties to require less water, have shorter growth periods, produce higher yields, and tolerate more stress.
  • Help improve water monitoring technology and identify alternative fertilizers.
  • Work with farmers and other private organizations to improve data collection on advanced cultivation uptake and water management.
  • Advocate to policymakers for improved rice cultivation techniques, incentives, and regulations.
  • Join, create, or participate in partnerships or certification programs dedicated to improving rice cultivation.
Thought Leaders
  • Source rice from farms that practice improved rice cultivation.
  • Start model farms to demonstrate techniques, conduct experiments, and educate local farmers.
  • Engage with businesses to encourage corporate responsibility and/or monitor rice production.
  • Help develop rice varieties to require less water, have shorter growth periods, produce higher yields, and tolerate more stress.
  • Help improve water monitoring technology and identify alternative fertilizers.
  • Work with farmers and other private organizations to improve data collection on advanced cultivation uptake and water management.
  • Advocate to policymakers for improved rice cultivation techniques, incentives, and regulations.
  • Join, create, or participate in partnerships or certification programs dedicated to improving rice cultivation.
Technologists and Researchers
  • Improve technology and cost-effectiveness of precision fertilizer application, slow-release fertilizer, alternative organic fertilizers, nutrient recycling, and monitoring equipment.
  • Create tracking and monitoring software to support farmers' decision-making.
  • Research the application of AI and robotics for precise fertilizer application and water management.
  • Improve data and analytics to monitor soil and water quality, assist farmers, support policymaking, and assess the impacts of policies.
  • Improve rice methane emissions modeling and monitoring using all available technologies such as satellites, low-flying instruments, and on-the-ground methods.
  • Develop education and training applications to promote improved rice cultivation techniques and provide real-time feedback.
  • Improve data collection on water management and advanced cultivation uptake.
  • Improve rice varieties to require less water, have shorter growth periods, produce higher yields, and tolerate more stress.
Communities, Households, and Individuals
  • Purchase rice from farms or suppliers that practice improved rice cultivation.
  • Engage with businesses to encourage corporate responsibility and/or monitor rice production.
  • Work with farmers and other private organizations to improve data collection on advanced cultivation uptake and water management.
  • Advocate to policymakers for improved rice cultivation techniques, incentives, and regulations.
  • Join, create, or participate in partnerships or certification programs dedicated to improving rice cultivation.
Evidence Base

There is high consensus on the effectiveness and potential of noncontinuous flooding and nutrient management (Jiang et al., 2019; Zhang et al., 2023; Nabuurs et al., 2022; Qian et al., 2023). 

Hergoualc’h et al. (2019) describe methane reduction and associated nitrous oxide increase from noncontinuous flooding in detail(2019). Bo et al. (2022) calculate that 76% of global rice paddy area is suitable to switch to noncontinuous flooding without reducing yields. Carlson et al. (2016) provide emissions intensities for croplands, including rice production. Ludemann et al. (2024) provide country-by-country and crop-by-crop fertilizer use data. Qian et al. (2023) review methane emissions production and reduction potential.

The results presented in this document summarize findings from 12 reviews and meta-analyses and 26 original studies reflecting current evidence from countries across the Asian rice production region. We recognize this limited geographic scope creates bias, and hope this work inspires research and data sharing on this topic in underrepresented regions.

left_text_column_width
Appendix

In this analysis, we calculated the potential for reducing crop nitrogen inputs and associated nitrous oxide emissions by integrating spatially explicit, crop-specific data on nitrogen inputs, crop yields, attainable yields, irrigated extent, and climate. Broadly, we calculated a “target” yield-scaled nitrogen input rate based on pixels with low yield gaps and calculated the difference between nitrous oxide emissions under the current rate and under the hypothetical target emissions rate, using nitrous oxide emissions factors disaggregated by fertilizer type and climate. 

Emissions Factors

We used Tier 1 emissions factors from the IPCC 2019 Refinement to the 2006 Guidelines for National Greenhouse Gas Inventories, including direct emissions factors as well as indirect emissions from volatilization and leaching pathways. Direct emissions factors represent the proportion of applied nitrogen emitted as nitrous oxide, while we calculated volatilization and leaching emissions factors by multiplying the proportion of applied nitrogen lost through these pathways by the proportion of volatilized or leached nitrogen ultimately emitted as nitrous oxide. Including both direct and indirect emissions, organic and synthetic fertilizers emit 4.97 kg CO₂‑eq/kg nitrogen and 8.66 kg CO₂‑eq/kg nitrogen, respectively, in wet climates, and 2.59 kg CO₂‑eq/kg nitrogen and 2.38 kg CO₂‑eq/kg nitrogen in dry climates. We included uncertainty bounds (2.5th and 97.5th percentiles) for all emissions factors. 

We classified each pixel as “wet” or “dry” using an aridity index (AI) threshold of 0.65, calculated as the ratio of annual precipitation to potential evapotranspiration (PET) from TerraClimate data (1991–2020), based on a threshold of 0.65. For pixels in dry climates that contained irrigation, we took the weighted average of wet and dry emissions factors based on the fraction of cropland that was irrigated (Mehta et al., 2024). We excluded irrigated rice from this analysis due to large differences in nitrous oxide dynamics in flooded rice systems.

Current, Target, and Avoidable Nitrogen Inputs and Emissions

Using highly disaggregated data on nitrogen inputs from Adalibieke et al. (2024) for 21 crop groups (Table S1), we calculated total crop-specific inputs of synthetic and organic nitrogen. We then averaged over 2016–2020 to reduce the influence of interannual variability in factors like fertilizer prices. These values are subsequently referred to as “current” nitrogen inputs. We calculated nitrous oxide emissions under current nitrogen inputs as the sum of the products of nitrogen inputs and the climatically relevant emissions factors for each fertilizer type.

Next, we calculated target nitrogen application rates in terms of kg nitrogen per ton of crop yield using data on actual and attainable yields for 17 crops from Gerber et al., 2024 (Table S1). For each crop, we first identified pixels in which the ratio of actual to attainable yields was above the 80th percentile globally. The target nitrogen application rate was then calculated as the 20th percentile of nitrogen application rates across low-yield-gap pixels. Finally, we calculated total target nitrogen inputs as the product of actual yields and target nitrogen input rates. We calculated hypothetical nitrous oxide emissions from target nitrogen inputs as the product of nitrogen inputs and the climatically relevant emissions factor for each fertilizer type.

The difference between current and target nitrogen inputs represents the amount by which nitrogen inputs could hypothetically be reduced without compromising crop productivity (i.e., “avoidable” nitrogen inputs). We calculated avoidable nitrous oxide emissions as the difference between nitrous oxide emissions with current nitrogen inputs and those with target nitrogen inputs. For crops for which no yield or attainable yield data were available, we applied the average percent reduction in nitrogen inputs under the target scenario from available crops to the nitrogen input data for missing crops to calculate the avoidable nitrogen inputs and emissions. 

This simple and empirically driven method aimed to identify realistically low but nutritionally adequate nitrogen application rates by including only pixels with low yield gaps, which are unlikely to be substantially nutrient-constrained. We did not control for other factors affecting nitrogen availability, such as historical nutrient application rates or depletion, rotation with nitrogen fixing crops, or tillage and residue retention practices.

left_text_column_width
Updated Date
Subscribe to Food, Agriculture, Land & Ocean