The international climate community is clear that net zero emissions, wherein we don’t emit more greenhouse gases into the atmosphere than can be removed, are what we need to achieve to halt global warming and the most dire effects of climate change.
Improving fishing vessel efficiency cuts CO₂
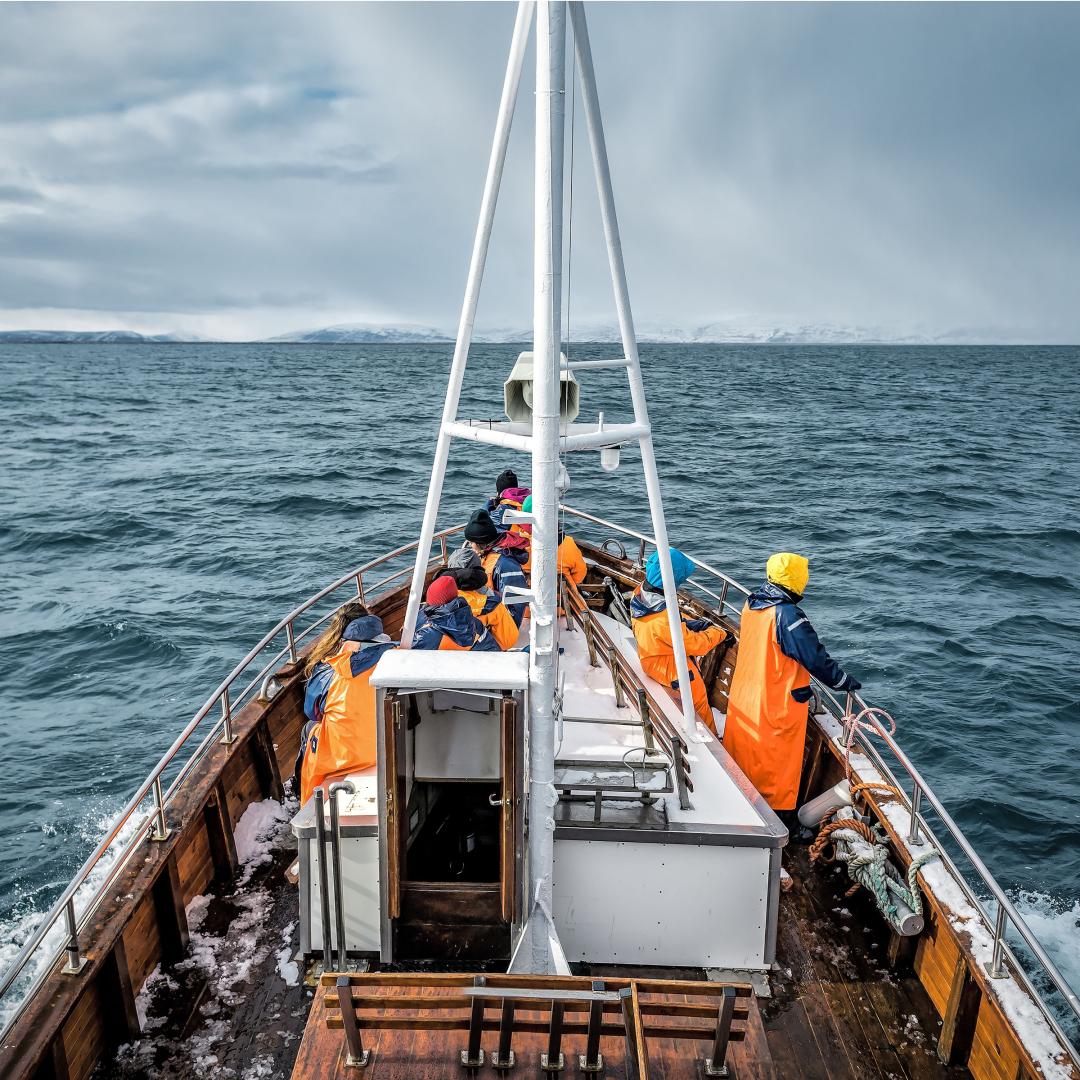
emissions in wild capture fisheries by lowering fuel use through vessel, gear, or operational modifications. Advantages include the long-term cost savings from fuel use reductions, the ability to implement many of these improvements without reducing fishing effort, and the potential additional benefits for air quality and marine ecosystems. Disadvantages include its limited climate impact due to the sector’s overall small contribution to global GHG emissions and the possibly high up-front costs associated with vessel or gear upgrades. We conclude that, despite its modest emissions impact, Improve Fishing Vessel Efficiency is “Worthwhile,” with likely ecosystem and economic benefits.
Description for Social and Search
Improving fishing vessel efficiency cuts CO2 emissions in wild capture fisheries by lowering fuel use through vessel, gear, or operational modifications.
Overview
What is our assessment?
Based on our analysis, we find that fishing vessel efficiency improvements are ready to deploy and feasible, but probably have limited climate impact because the wild capture fisheries sector contributes a relatively small share of global GHG emissions. These improvements will likely provide long-term cost savings and added benefits for ecosystems and air quality. We conclude this climate solution is “Worthwhile.”
Plausible
Could it work?
Yes
Ready
Is it ready?
Yes
Evidence
Are there data to evaluate it?
Yes
Effective
Does it consistently work?
Yes
Impact
Is it big enough to matter?
No
Risk
Is it risky or harmful?
No
Cost
Is it cheap?
?
What is it?
Improving fishing vessel efficiency reduces CO₂
emissions by using gear, vessel, or operational changes that lower fuel use in wild capture fisheries. Vessel upgrades include propulsion-related changes, such as installation of more efficient engines, and non-propulsion-related alterations, such as modified bows and hulls that reduce drag. Changing to low-fuel-use gear to catch fish, when and where possible, can also reduce CO₂
emissions. Operational changes, such as speed reductions or route optimization, can likewise lead to more efficient fuel use.
Does it work?
Vessel efficiency improvements are expected to deliver substantial fuel savings. An estimated 60–90% of emissions in wild capture fisheries, which emit roughly 0.18 GtCO₂‑eq/yr
in total, likely result from fuel consumption. Speed reductions alone can reduce fuel use by up to 30%. Vessel modifications could provide fuel savings of up to 20% in small fishing vessels, which comprise roughly 86% of all motorized fishing vessels globally. Upgrading engines and other propulsion-related equipment can reduce fuel use by up to 30%. Gear switching, when viable, can also be highly effective at improving fuel use efficiency, particularly if the target species are typically caught using methods such as trawling, which has a high carbon footprint.
Why are we excited?
The average emissions per metric ton of landed fish in wild capture fisheries have grown by over 20% since 1990, highlighting the need for efficiency improvements. Many of these improvements can be implemented without sacrificing fishing effort or opportunities, and some operational changes, such as reducing vessel speed, can be done without any new equipment. All changes reduce fuel use, saving fishers money over time and likely resulting in fewer emissions of harmful air pollutants, such as sulfur oxides and black carbon. Some upgrades could deliver additional benefits to air quality and ocean ecosystems. Cleaner engines can further reduce air pollution through more complete combustion of fuel, and gear changes could benefit seafloor ecosystems, which can be damaged from bottom fishing practices, such as trawling and dredging. Additionally, some fishing gear has high bycatch rates, and switching to gear that allows for more exclusive capture of target species can reduce waste.
Why are we concerned?
Even with widespread adoption, efficiency improvements that reduce fuel use are unlikely to have a major climate impact. Efficiency improvements could also inadvertently encourage increases in fishing effort, which would increase fuel use and offset emissions cuts. Initial costs to upgrade can be highly variable, but might be high in some cases and therefore not feasible for some fishers. Gear switching can result in lower fish catches, as some methods might not be as efficient. Some operational changes, such as reducing speeds, could lead to fishers arriving at fishing grounds late.
Solution in Action
Althaus, F., Williams, A., Schlacher, T. A., Kloser, R. J., Green, M. A., Barker, B. A., ... & Schlacher-Hoenlinger, M. A. (2009). Impacts of bottom trawling on deep-coral ecosystems of seamounts are long-lasting. Marine Ecology Progress Series, 397, 279–294. Link to source: https://doi.org/10.3354/meps08248
Bastardie, F., Hornborg, S., Ziegler, F., Gislason, H., & Eigaard, O. R. (2022). Reducing the fuel use intensity of fisheries: through efficient fishing techniques and recovered fish stocks. Frontiers in Marine Science, 9, 817335. Link to source: https://doi.org/10.3389/fmars.2022.817335
Bastardie, F., Feary, D. A., Kell, L., Brunel, T. P. A., Metz, S., Döring, R., ... & van Hoof, L. J. W. (2022). Climate change and the Common Fisheries Policy: adaptation and building resilience to the effects of climate change on fisheries and reducing emissions of greenhouse gases from fishing. European Commission. Link to source: https://doi.org/10.2926/155626
Gilman, E., Perez Roda, A., Huntington, T., Kennelly, S. J., Suuronen, P., Chaloupka, M., & Medley, P. A. H. (2020). Benchmarking global fisheries discards. Scientific Reports, 10(1), 14017. Link to source: https://doi.org/10.1038/s41598-020-71021-x
Gray, C. A., & Kennelly, S. J. (2018). Bycatches of endangered, threatened and protected species in marine fisheries. Reviews in Fish Biology and Fisheries, 28(3), 521–541. Link to source: https://doi.org/10.1007/s11160-018-9520-7
Food and Agriculture Organization of the United Nations. (2018). Impacts of climate change on fisheries and aquaculture. United Nations’ Food and Agriculture Organization, 12(4), 628-635. Link to source: https://fao.org/3/i9705en/i9705en.pdf
Hilborn, R., Amoroso, R., Collie, J., Hiddink, J. G., Kaiser, M. J., Mazor, T., ... & Suuronen, P. (2023). Evaluating the sustainability and environmental impacts of trawling compared to other food production systems. ICES Journal of Marine Science, 80(6), 1567–1579. Link to source: https://doi.org/10.1093/icesjms/fsad115
Parker, R. W., Blanchard, J. L., Gardner, C., Green, B. S., Hartmann, K., Tyedmers, P. H., & Watson, R. A. (2018). Fuel use and greenhouse gas emissions of world fisheries. Nature Climate Change, 8(4), 333–337. Link to source: https://doi.org/10.1038/s41558-018-0117-x
“To meet the urgency of the moment to halt climate change, we must deploy the most effective climate solutions at speed and scale – and these must be based on science,” Bielawski says. “Project Drawdown continues to lead the charge on science-based solutions. I'm thrilled to be joining the leadership team to envision and build ambitious partnerships with businesses, investors, and philanthropists. Together, we will work to scale what is scientifically proven to work, aligning capital and decision-making with the most impactful levers of change.”
Amanda Bielawski, Ph.D., MBA Director of Global Strategic Partnerships
Image
With more than 20 years of experience leading and advising nonprofits, businesses, private sector leaders, and multilateral institutions, Bielawski will help Project Drawdown’s strategic partners utilize cutting-edge new tools, such as the soon-to-launch Drawdown Explorer, to maximize the impact of every dollar, second, and resource they invest in climate action.
“We couldn’t be luckier to have Amanda join Project Drawdown, particularly at this moment,” says Project Drawdown Executive Director Jonathan Foley, Ph.D. “From heading impact strategy at one of the world’s top water sustainability think-tanks to advising the United Nations on global sustainability initiatives, she is just the interdisciplinary and visionary leader we’ve been looking for to build innovative partnerships that drive the adoption of climate solutions and strategies around the world.”
To learn more about Amanda Bielawski, read her bio on our staff page here or reach out to press@drawdown.org
About Project Drawdown Project Drawdown is the world’s leading guide to science-based climate solutions. We conduct rigorous science to identify the most effective climate solutions and strategies and share that science in actionable, compelling ways through stakeholder engagement and powerful storytelling. Project Drawdown is an independent, non-partisan, 501(c)3 nonprofit funded by individual and institutional donations.
Image
Off
Project Drawdown is thrilled to announce that Amanda Bielawski, Ph.D., MBA, will be joining our world-leading nonprofit as the director of global strategic partnerships.
In this instrumental role, Bielawski will develop and steward partnerships with leading businesses, philanthropists, and impact investors as Project Drawdown seeks to drive meaningful climate action by advancing science-based solutions and strategies.
Description for Social and Search
Project Drawdown welcomes Amanda Bielawski, Ph.D., as director of global strategic partnerships
Join the 80,000+ subscribers discovering how to drive meaningful climate action around the world! Every other week, you'll get expert insights, cutting-edge research, and inspiring stories.
Receive biweekly email newsletter updates from Project Drawdown. Unsubscribe at any time.