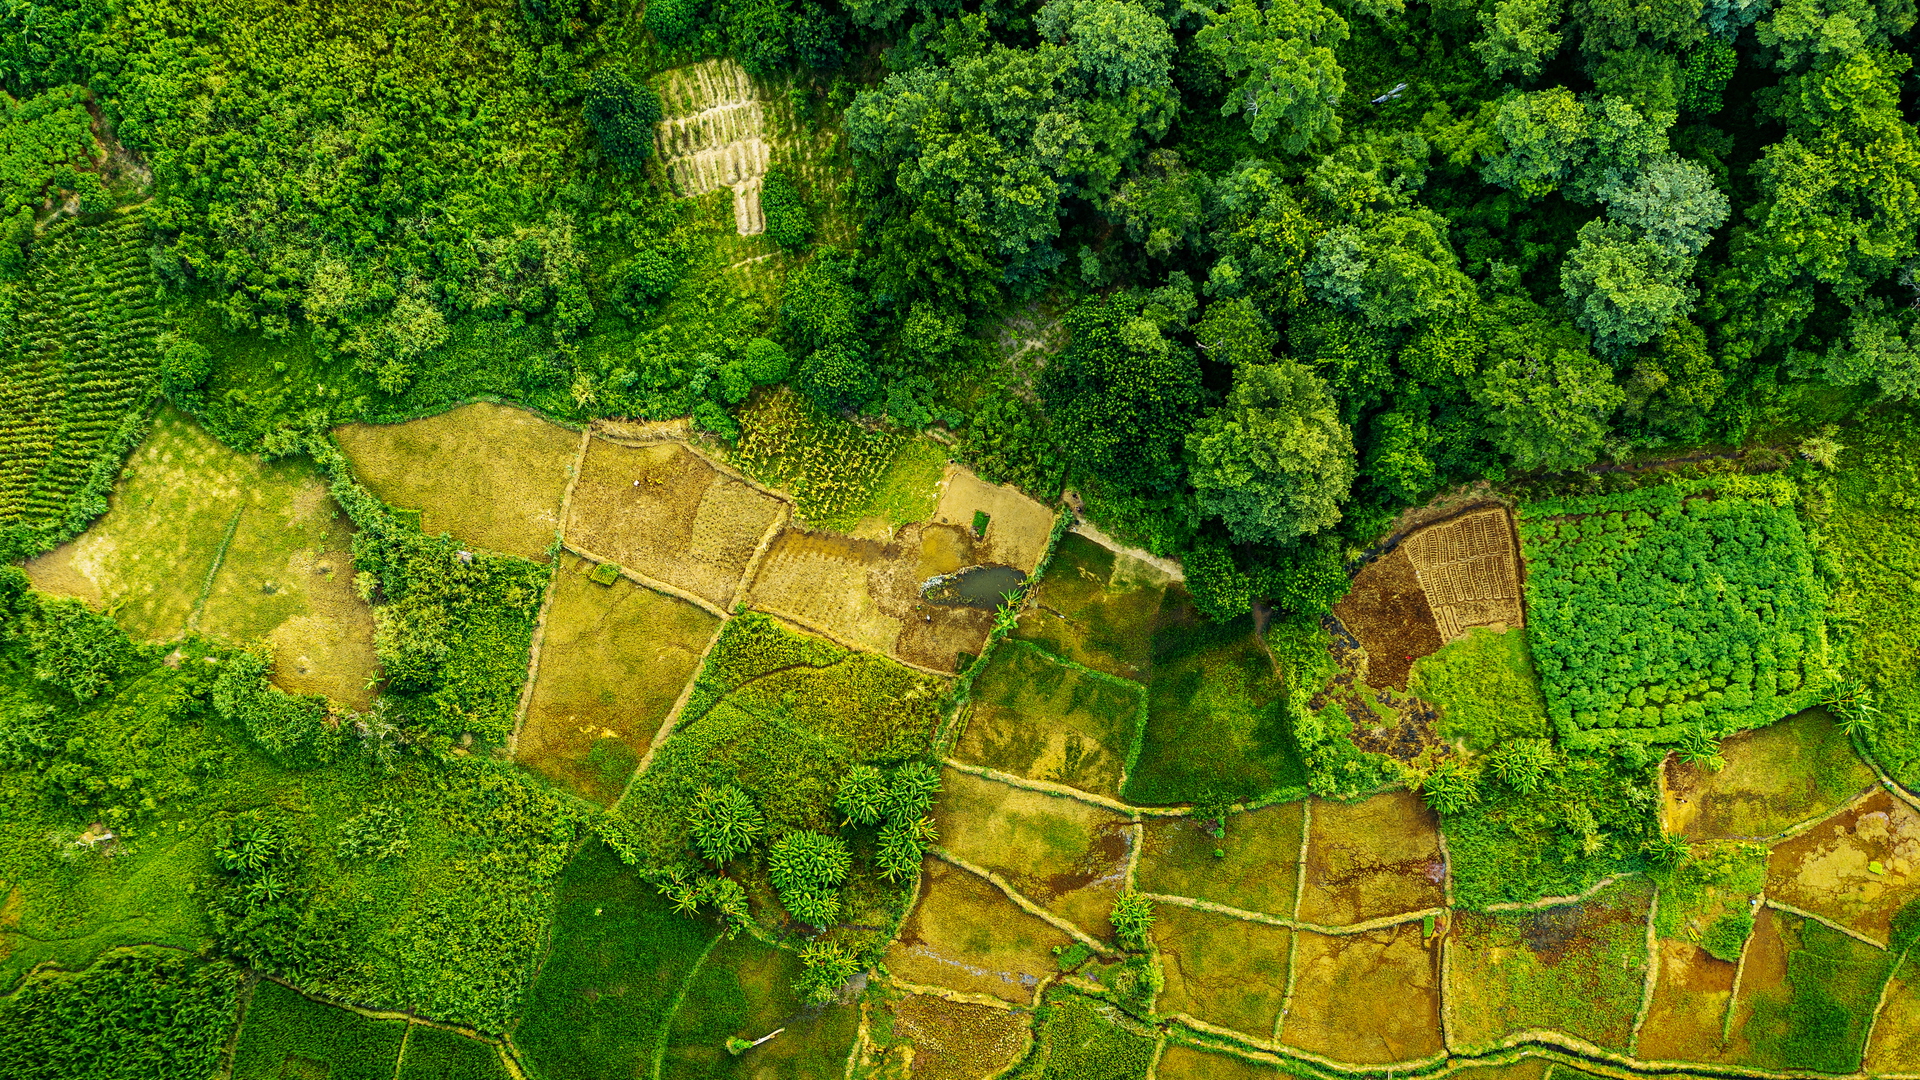
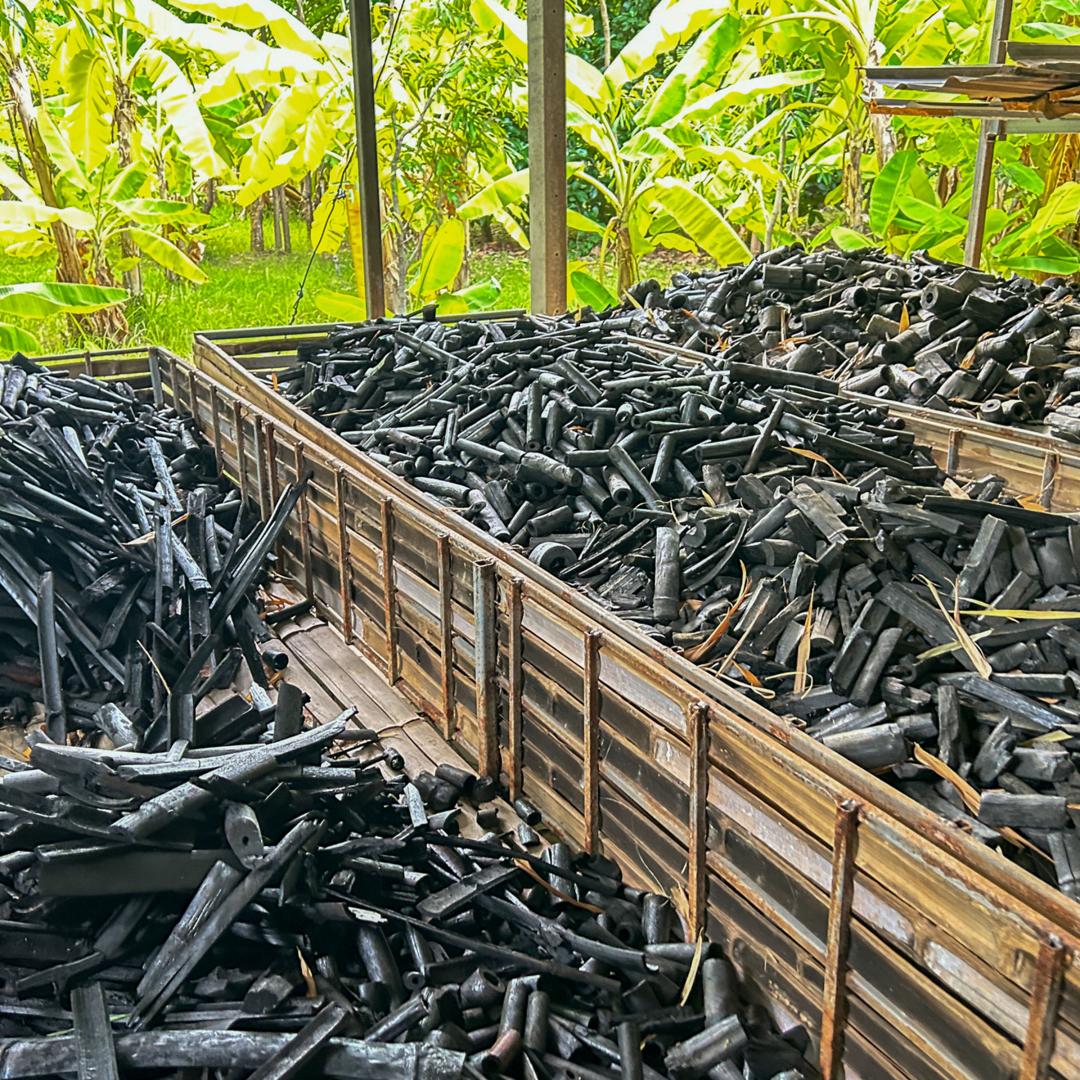
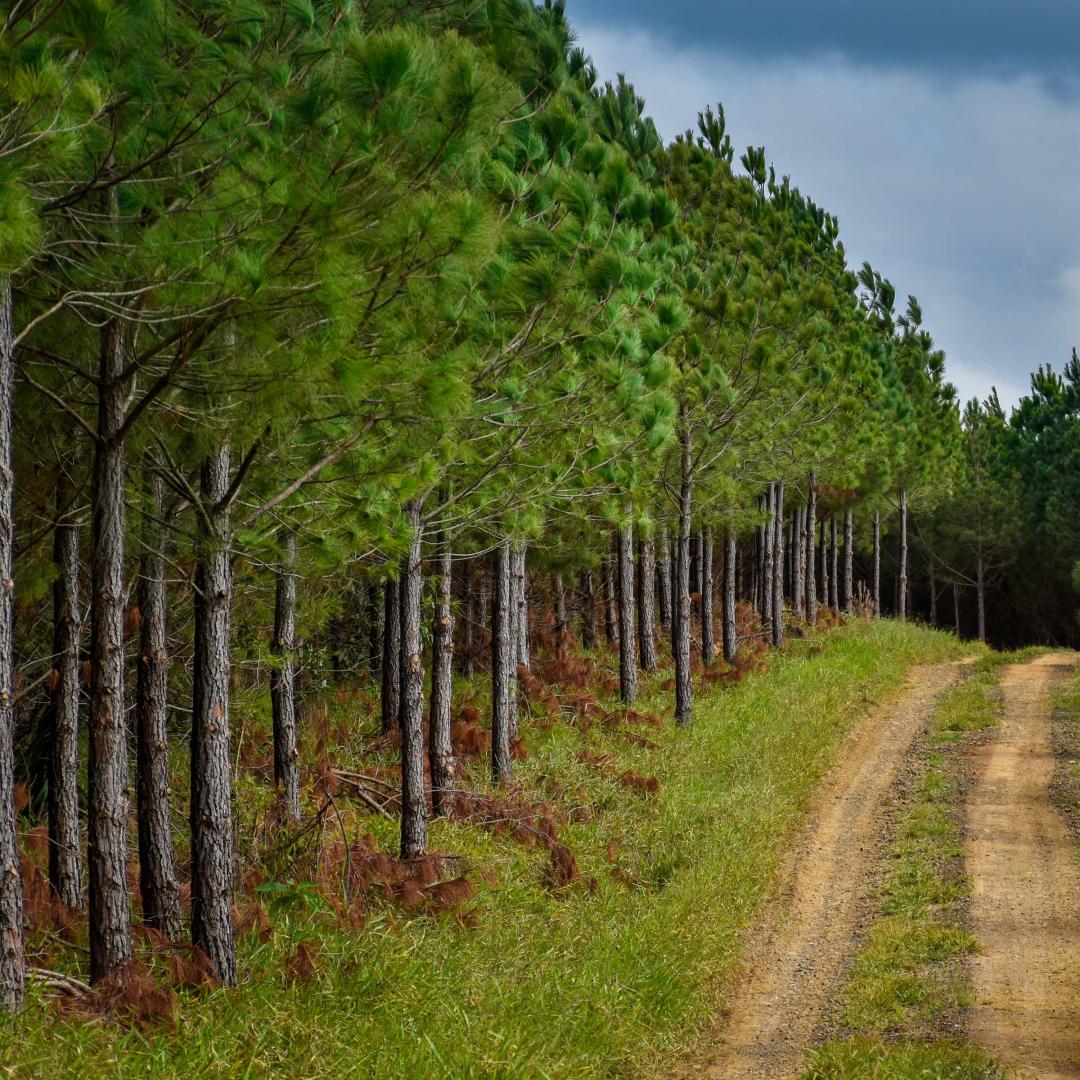
Mobilize Hybrid Cars

Image
Image
Start button on a hybrid vehicle
Coming Soon
Off
Summary

The Mobilize Hybrid Cars solution entails shifting trips from fossil fuel–powered internal combustion engine (ICE) cars to more efficient, lower emitting hybrid cars. Hybrid cars include hybrid electric cars (HEVs) and plug-in hybrid electric cars (PHEVs). They are four-wheeled passenger cars that combine an ICE with an electric motor and battery to improve fuel efficiency and reduce emissions. This definition includes hybrid sedans, sport utility vehicles (SUVs), and pickup trucks, but excludes fully electric cars, two-wheeled vehicles, and hybrid commercial or freight vehicles, such as hybrid buses and delivery trucks. Hybrid cars are a transitional climate solution because they are more efficient and produce fewer emissions per distance traveled than do fossil fuel–powered ICE cars but still rely on fossil fuel combustion.

Description for Social and Search
Mobilize Hybrid Cars is a Highly Recommended climate solution. By combining internal combustion engines with electric motors, hybrids reduce fuel use and air pollution.
Overview

Hybrid cars reduce fuel consumption and tailpipe emissions by relying on electric propulsion for part of their operation. There are currently more than 45 million hybrids making up 2.2% of the more than two billion global car stock. HEVs provide the same functionality as fossil fuel–powered ICE cars, but combine an ICE with an electric motor and battery to improve fuel efficiency. Unlike electric cars, HEVs do not require external charging; instead, they recharge their battery using regenerative braking and energy from the engine. This allows them to use electric power at low speeds and in stop-and-go traffic, reducing fuel consumption and emissions compared to traditional gasoline or diesel cars. PHEVs work similarly but have larger batteries that can be charged using the electricity grid. This enables them to operate in full-electric mode for a limited distance before switching to hybrid mode when the battery is depleted.

Hybrid cars typically offer better acceleration than their purely fossil fuel–powered ICE counterparts, especially at lower speeds. This is because electric motors deliver instant torque, allowing hybrids to respond quickly when accelerating from a stop. PHEVs tend to have stronger electric motors and thus better acceleration. The high torque at low speeds eliminates the need for inefficient gear changes and allows near-constant operation at optimal conditions because the ICE is usually engaged at efficient conditions. This improves the real-world fuel economy 39–58% compared to fossil fuel–powered ICE cars of similar size (Zhang et al., 2025).

While hybrid cars reduce fuel consumption and tailpipe emissions by relying on electric propulsion for part of their operation, their overall emissions depend on how much they use the ICE versus the electric motor, and, for PHEVs, on the emissions intensity of the electricity source used for charging. PHEVs can offer greater potential for emission reductions if charged from low-carbon electricity sources. If driven primarily in electric mode, PHEVs can significantly reduce GHG emissions compared to fossil fuel–powered ICE cars, but if the battery is not regularly charged, their fuel consumption may be similar to or even higher than standard HEVs (Dornoff, 2021; Plötz et al., 2020).

Hybrid technologies also improve car efficiency by reducing energy losses. First, both HEVs and PHEVs recover energy through regenerative braking, converting kinetic energy into electricity and storing it in the battery (Yang et al., 2024). Second, their electric powertrains are more efficient than those of traditional ICEs, particularly in urban driving conditions where frequent stops and starts are common (Verma et al., 2022). These advantages contribute to lower fuel consumption and emissions compared to fossil fuel–powered ICE cars. However, the environmental benefits of hybrids depend on driving patterns, battery charging habits, and the carbon intensity of the electricity grid used to charge PHEVs.

Hybrid cars reduce emissions of CO₂, methane, and nitrous oxide to the atmosphere by increasing fuel efficiency compared to fossil fuel–powered ICE cars, which emit these gases from their tailpipes. Because they are typically fueled by gasoline, hybrid cars produce more methane than any diesel-fueled cars they might be replacing. As a result, their 20-yr effectiveness at addressing climate change is lower than their 100-yr effectiveness. 

Agusdinata, D. B., Liu, W., Eakin, H., & Romero, H. (2018). Socio-environmental impacts of lithium mineral extraction: Towards a research agenda. Environmental Research Letters, 13(12). Article 123001. Link to source: https://doi.org/10.1088/1748-9326/aae9b1

Alberini, A., Di Cosmo, V., & Bigano, A. (2019). How are fuel efficient cars priced? Evidence from eight EU countries. Energy Policy, 134, Article 110978. Link to source: https://doi.org/10.1016/j.enpol.2019.110978

Anenberg, S., Miller, J., Henze, D., & Minjares, R. (2019). A global snapshot of the air pollution-related health impacts of transportation sector emissions in 2010 and 2015. International Council on Clean Transportation. Link to source: https://theicct.org/publication/a-global-snapshot-of-the-air-pollution-related-health-impacts-of-transportation-sector-emissions-in-2010-and-2015/

Asia-Pacific Economic Cooperation. (2024). Connecting traveler choice with climate outcomes: Innovative greenhouse gas emissions reduction policies and practices in the APEC region through traveler behavioral change. Link to source: https://www.apec.org/docs/default-source/publications/2024/9/224_tpt_connecting-traveler-choice-with-climate-outcomes.pdf 

Bell-Pasht, A. (2024). Combined energy burdens: Estimating total home and transportation energy burdens [Topic brief]. American Council for an Energy-Efficient Economy. Link to source: https://www.aceee.org/topic-brief/2024/05/combined-energy-burdens-estimating-total-home-and-transportation-energy-burdens

BEUC. (2021). Electric cars: Calculating the total cost of ownership for consumers [Technical report]. The European Consumer Organisation. Link to source: https://www.beuc.eu/reports/electric-cars-calculating-total-cost-ownership-consumers-technical-report

BloombergNEF. (2024). Electric vehicle outlook 2024. Bloomberg Finance L.P. Link to source: https://about.bnef.com/electric-vehicle-outlook/

Carey, J. (2023, January 11). The other benefit of electric vehicles [News feature]. Proceedings of the National Academy of Sciences, 120(3), Article e2220923120. Link to source: https://doi.org/10.1073/pnas.2220923120

Castelvecchi, D. (2021, August 17). Electric cars and batteries: How will the world produce enough? [News feature]. Nature, 596(7872), 336–339. Link to source: https://doi.org/10.1038/d41586-021-02222-1

Choma, E. F., Evans, J. S., Hammitt, J. K., Gómez-Ibáñez, J. A., & Spengler, J. D. (2020). Assessing the health impacts of electric vehicles through air pollution in the United States. Environment International, 144, Article 106015. Link to source: https://doi.org/10.1016/j.envint.2020.106015 

Dornoff, J. (2021). Plug-in hybrid vehicle CO2 emissions: How they are affected by ambient conditions and driver mode selection [White paper]. International Council on Clean Transportation. Link to source: https://theicct.org/publication/plug-in-hybrid-vehicle-co2-emissions-how-they-are-affected-by-ambient-conditions-and-driver-mode-selection/

Duncan, D., Ku, A. L., Julian, A., Carley, S., Siddiki, S., Zirogiannis, N., & Graham, J. D. (2019). Most consumers don’t buy hybrids: Is rational choice a sufficient explanation? Journal of Benefit-Cost Analysis, 10(1), 1–38. Link to source: https://doi.org/10.1017/bca.2018.24

Fortune Business Insights. (2025). Hybrid vehicle market size, share & growth report, 2024–2032. Link to source: https://www.fortunebusinessinsights.com/hybrid-vehicle-market-105435

Fulton, L. (2020). A publicly available simulation of battery electric, hybrid electric, and gas-powered vehicles. Energies13(10), Article 2569. Link to source: https://doi.org/10.3390/en13102569

Furch, J., Konečný, V., & Krobot, Z. (2022). Modelling of life cycle cost of conventional and alternative vehicles. Scientific Reports, 12(1), Article 10661. Link to source: https://doi.org/10.1038/s41598-022-14715-8

Garcia, E., Johnston, J., McConnell, R., Palinkas, L., & Eckel, S. P. (2023). California’s early transition to electric vehicles: Observed health and air quality co-benefits. Science of The Total Environment, 867, Article 161761. Link to source: https://doi.org/10.1016/j.scitotenv.2023.161761

International Energy Agency. (2021). Global fuel economy initiative 2021 data explorer [Data tool]. Link to source: https://www.iea.org/data-and-statistics/data-tools/global-fuel-economy-initiative-2021-data-explorer

International Energy Agency. (2022). Electric vehicles: Total cost of ownership tool [Data tool]. Link to source: https://www.iea.org/data-and-statistics/data-tools/electric-vehicles-total-cost-of-ownership-tool

International Energy Agency. (2023). Energy technology perspectives 2023. Link to source: https://www.iea.org/reports/energy-technology-perspectives-2023

International Energy Agency. (2024). Global EV outlook 2024. Link to source: https://www.iea.org/reports/global-ev-outlook-2024

International Transport Forum. (2020). Good to go? Assessing the environmental performance of new mobility [Corporate Partnership Board Report]. OECD/ITF Publishing. Link to source: https://www.itf-oecd.org/sites/default/files/docs/environmental-performance-new-mobility.pdf

Isenstadt, A., & Slowik, P. (2025). Hybrid vehicle technology developments and opportunities in the 2025–2035 time frame [Working paper]. International Council on Clean Transportation. Link to source: https://theicct.org/publication/hybrid-vehicle-technology-developments-and-opportunities-in-the-2025-2035-time-frame-feb25/

Jones, S. J. (2019). If electric cars are the answer, what was the question? British Medical Bulletin, 129(1), 13–23. Link to source: https://doi.org/10.1093/bmb/ldy044

Kerr, G. H., Goldberg, D. L., & Anenberg, S. C. (2021). COVID-19 pandemic reveals persistent disparities in nitrogen dioxide pollution. Proceedings of the National Academy of Sciences, 118(30), Article e2022409118. Link to source: https://doi.org/10.1073/pnas.2022409118

Kittner, N., Tsiropoulos, I., Tarvydas, D., Schmidt, O., Staffell, I., & Kammen, D. M. (2020). Electric vehicles. In M. Junginger & A. Louwen (Eds.), Technological learning in the transition to a low‑carbon energy system: Conceptual issues, empirical findings, and use in energy modeling (pp. 145–163). Academic Press. Link to source: https://doi.org/10.1016/B978-0-12-818762-3.00009-1

Larson, E., Greig, C., Jenkins, J., Mayfield, E., Pascale, A., Zhang, C., Drossman, J., Williams, R., Pacala, S., Socolow, R., Baik, E., Birdsey, R., Duke, R., Jones, R., Haley, B., Leslie, E., Paustain, K., & Swan, A. (2020). Net-zero America: Potential pathways, infrastructure, and impacts [Interim report]. Princeton University, Andlinger Center for Energy and the Environment. Link to source: https://netzeroamerica.princeton.edu/the-report

Lutsey, N., Cui, H., & Yu, R. (2021). Evaluating electric vehicle costs and benefits in China in the 2020–2035 time frame [White paper]. International Council on Clean Transportation. Link to source: https://theicct.org/publication/evaluating-electric-vehicle-costs-and-benefits-in-china-in-the-2020-2035-time-frame/

Menes, M. (2021). Two decades of hybrid electric vehicle market. Journal of Civil Engineering and Transport, 3(1), 29–37. Link to source: https://doi.org/10.24136/tren.2021.003

Milovanoff, A., Posen, I. D., & MacLean, H. L. (2020). Electrification of light-duty vehicle fleet alone will not meet mitigation targets. Nature Climate Change, 10(12), 1102–1107. Link to source: https://doi.org/10.1038/s41558-020-00921-7

Mittal, V., & Shah, R. (2024). Modeling and comparing the total cost of ownership of passenger automobiles with conventional, electric, and hybrid powertrains. SAE International Journal of Sustainable Transportation, Energy, Environment, & Policy, 5(2), 179–192. Link to source: https://doi.org/10.4271/13-05-02-0013

Mustapa, S. I., Ayodele, B. V., Mohamad Ishak, W. W., & Ayodele, F. O. (2020). Evaluation of cost competitiveness of electric vehicles in Malaysia using life cycle cost analysis approach. Sustainability, 12(13), Article 5303. Link to source: https://doi.org/10.3390/su12135303

Ouyang, D., Zhou, S., & Ou, X. (2021). The total cost of electric vehicle ownership: A consumer-oriented study of China’s post-subsidy era. Energy Policy, 149, Article 112023. Link to source: https://doi.org/10.1016/j.enpol.2020.112023

Pennington, A. F., Cornwell, C. R., Sircar, K. D., & Mirabelli, M. C. (2024). Electric vehicles and health: A scoping review. Environmental Research, 251, Article 118697. Link to source: https://doi.org/10.1016/j.envres.2024.118697

Peters, D. R., Schnell, J. L., Kinney, P. L., Naik, V., & Horton, D. E. (2020). Public health and climate benefits and trade‐offs of U.S. vehicle electrification. GeoHealth, 4(10), Article e2020GH000275. Link to source: https://doi.org/10.1029/2020GH000275

Petrauskienė, K., Galinis, A., Kliaugaitė, D., & Dvarionienė, J. (2021). Comparative environmental life cycle and cost assessment of electric, hybrid, and conventional vehicles in Lithuania. Sustainability, 13(2), Article 957. Link to source: https://doi.org/10.3390/su13020957

Plötz, P., Moll, C., Li, Y., Bieker, G., & Mock, P. (2020). Real-world usage of plug-in hybrid electric vehicles: Fuel consumption, electric driving, and CO2 emissions [White paper]. International Council on Clean Transportation. Link to source: https://theicct.org/publication/real-world-usage-of-plug-in-hybrid-electric-vehicles-fuel-consumption-electric-driving-and-co2-emissions

Requia, W. J., Mohamed, M., Higgins, C. D., Arain, A., & Ferguson, M. (2018). How clean are electric vehicles? Evidence-based review of the effects of electric mobility on air pollutants, greenhouse gas emissions and human health. Atmospheric Environment185, 64–77. Link to source: https://doi.org/10.1016/j.atmosenv.2018.04.040

Roberts, C. (2022). Easy street for low-carbon mobility? The political economy of mass electric car adoption. In G. Parkhurst & W. Clayton (Eds.), Electrifying mobility: Realising a sustainable future for the car (Vol. 15, pp. 13–31). Emerald Publishing Limited. Link to source: https://doi.org/10.1108/S2044-994120220000015004

Romm, J. J., & Frank, A. A. (2006, April). Hybrid vehicles gain traction. Scientific American, 294(4), 72–79. Link to source: https://doi.org/10.1038/scientificamerican0406-72

Sovacool, B. K. (2019). The precarious political economy of cobalt: Balancing prosperity, poverty, and brutality in artisanal and industrial mining in the Democratic Republic of the Congo. The Extractive Industries and Society, 6(3), 915–939. Link to source: https://doi.org/10.1016/j.exis.2019.05.018

Suttakul, P., Wongsapai, W., Fongsamootr, T., Mona, Y., & Poolsawat, K. (2022). Total cost of ownership of internal combustion engine and electric vehicles: A real-world comparison for the case of Thailand. Energy Reports, 8, 545–553. Link to source: https://doi.org/10.1016/j.egyr.2022.05.213

Vega-Perkins, J., Newell, J. P., & Keoleian, G. (2023). Mapping electric vehicle impacts: Greenhouse gas emissions, fuel costs, and energy justice in the United States. Environmental Research Letters, 18(1), Article 014027. Link to source: https://doi.org/10.1088/1748-9326/aca4e6

Verma, S., Dwivedi, G., & Verma, P. (2022). Life cycle assessment of electric vehicles in comparison to combustion engine vehicles: A review. Materials Today: Proceedings, 49, 217–222. Link to source: https://doi.org/10.1016/j.matpr.2021.01.666

Weiss, M., Zerfass, A., & Helmers, E. (2019). Fully electric and plug-in hybrid cars - An analysis of learning rates, user costs, and costs for mitigating CO2 and air pollutant emissions. Journal of Cleaner Production, 212, 1478–1489. Link to source: https://doi.org/10.1016/j.jclepro.2018.12.019

World Health Organization. (2022). Number of registered vehicles [Data set]. The Global Health Observatory. Link to source: https://www.who.int/data/gho/data/indicators/indicator-details/GHO/number-of-registered-vehicles

Yang, C., Sun, T., Wang, W., Li, Y., Zhang, Y., & Zha, M. (2024). Regenerative braking system development and perspectives for electric vehicles: An overview. Renewable and Sustainable Energy Reviews, 198, Article 114389. Link to source: https://doi.org/10.1016/j.rser.2024.114389

Zhang, Y., Fan, P., Lu, H., & Song, G. (2025). Fuel consumption of hybrid electric vehicles under real-world road and temperature conditions. Transportation Research Part D: Transport and Environment, 142, Article 104691. Link to source: https://doi.org/10.1016/j.trd.2025.104691 

Credits

Lead Fellow

  • Heather Jones, Ph.D.

  • Cameron Roberts, Ph.D.

Contributors

  • Ruthie Burrows, Ph.D.

  • James Gerber, Ph.D.

  • Yusuf Jameel, Ph.D.

  • Daniel Jasper

  • Alex Sweeney

Internal Reviewers

  • Aiyana Bodi

  • Hannah Henkin

  • Zoltan Nagy, Ph.D. 

  • Ted Otte

  • Amanda D. Smith, Ph.D.

  • Christina Swanson, Ph.D.

Effectiveness

Each million pkm shifted from fossil fuel–powered cars to hybrid cars saves 27.11 t CO₂‑eq on a 100-yr basis (26.94 t CO₂‑eq on a 20-yr basis, Table 1). Fossil fuel–powered cars emit 115.3 t CO₂‑eq/million pkm on a 100-yr basis (116.4 t CO₂‑eq/million pkm on a 20-yr basis). The emissions from fossil fuel–powered ICE cars are calculated from the current global fleet mix which is mostly gasoline and diesel powered cars. PHEVs have lower emissions in countries with large shares of renewable, nuclear, or hydropower generation in their electricity grids (International Transport Forum, 2020; Verma et al., 2022).

We found this by collecting data on fuel consumption per kilometer for a range of HEV and PHEV models (International Energy Agency [IEA], 2021; International Transport Forum, 2020) and multiplying it by the emissions intensity of the fuel the vehicle uses (weighting PHEVs for percentage traveled using fuel). Simultaneously, we collected data on electricity consumption for a range of PHEV models (IEA, 2021; International Transport Forum, 2020), and multiplied them by the global average emissions per kWh of electricity generation. This was then weighted by the share of HEVs (73.4%) and PHEVs (26.6%) of the global hybrid car stock.

The amount of emissions savings for PHEVs depends on how often they are charged, the distance traveled using the electric motor, and the emissions intensity of the electrical grid from which they are charged. Hybrid cars today are disproportionately used in high and upper-middle income countries, where electricity grids emit less than the global average per unit of electricity generated (IEA, 2024). HEVs and PHEVs benefit from braking so are more efficient (relative to fossil fuel–powered ICE cars) in urban areas.

Hybrid cars have higher embodied emissions than fossil fuel–powered ICE cars due to the presence of both an ICE and electric motor with a battery that has a GHG-intensive manufacturing process. This gives them a carbon payback period of 2.6 to under 16 years (Alberini et al., 2019; Duncan et al., 2019) for HEVs and as low as one year for PHEVs (Fulton, 2020). Embodied emissions are outside the scope of this assessment. 

left_text_column_width

Table 1. Effectiveness at reducing emissions.

Unit: t CO‑eq/million pkm, 100-yr basis

25th percentile 19.51
Mean 22.36
Median (50th percentile) 27.11
75th percentile 65.85
Left Text Column Width
Cost

Hybrid cars cost on average US$0.01 more per pkm (US$7,200/million pkm) than fossil fuel–powered ICE cars, including purchase price, financing, fuel and electricity costs, and maintenance costs. This is based on a population-weighted average of the cost differential between hybrid and fossil fuel–powered ICE cars in the EU and 11 other countries: Argentina, China, Czechia, India, Indonesia, Lithuania, Malaysia, South Africa, Thailand, Ukraine, and the United States (BEUC, 2021; Furch et al., 2022; IEA, 2022; Isenstadt & Slowik, 2025; Lutsey et al., 2021; Mittal & Shah, 2024; Mustapa et al., 2020; Ouyang et al., 2021; Petrauskienė et al., 2021; Suttakul et al., 2022). The hybrid cost is weighted by the share of car stock of HEVs and PHEVs. 

While this analysis found that hybrid cars are slightly more expensive than fossil fuel–powered ICE cars almost everywhere, the margin is often quite small and hybrids are less expensive in China, Czechia, India, Thailand, and the United States.

This amounts to a cost of US$264/t CO₂‑eq on a 100-yr basis (US$266/t CO₂‑eq avoided emissions on a 20-yr basis, Table 2).

This analysis did not include costs that are the same for both hybrid and fossil fuel–powered ICE cars, including taxes, insurance costs, public costs of building road infrastructure, etc.

left_text_column_width

Table 2. Cost per unit of climate impact.

Unit: 2023 US$/t CO₂‑eq , 100-yr basis

Median 264
Left Text Column Width
Learning Curve

Hybrid car prices are declining. For every doubling in hybrid car production, costs decline in accordance with the learning rate of approximately 10% (Table 3).

The learning curve for hybrids is expected to continue its historical trend of 6–17% declines in production costs with each generation (Kittner et al., 2020; Ouyang et al., 2021; Weiss et al., 2019). For hybrid cars, production costs are driven more by the integration of electric and internal combustion powertrain components than by advancements in battery technology. Because they still rely on ICEs, hybrids do not experience the same rapid cost declines from battery improvements as fully electric cars. Instead, their cost reductions stem from manufacturing efficiencies, economies of scale, and advancements in hybrid powertrain efficiency and electric components (Weiss et al., 2019).

left_text_column_width

Table 3. Learning rate: drop in cost per doubling of the installed solution base %.

Unit: %

25th percentile 8.00
Mean 11.00
Median (50th percentile) 10.00
75th percentile 13.50
Left Text Column Width
Speed of Action

Speed of action refers to how quickly a climate solution physically affects the atmosphere after it is deployed. This is different from speed of deployment, which is the pace at which solutions are adopted. 

At Project Drawdown, we define the speed of action for each climate solution as emergency brake, gradual, or delayed.

Mobilize Hybrid Cars is a GRADUAL climate solution. It has a steady, linear impact on the atmosphere. The cumulative effect over time builds as a straight line.

left_text_column_width
Caveats

Hybrid cars are often considered a transitional technology for climate change mitigation. While they offer immediate reductions in fuel consumption and emissions compared to fossil fuel–powered ICE cars as the world transitions to fully electric transportation, hybrids still rely on the combustion of fossil fuels. The Mobilize Hybrid Cars solution is a move toward lower emissions – not zero emissions. By combining electric and gasoline powertrains, hybrids improve efficiency and reduce GHG emissions without requiring extensive charging infrastructure, making them a practical short-term solution (IEA, 2021). However, as battery costs decline, renewable energy expands, and charging networks improve, fully electric cars (EVs) are expected to replace hybrids as the dominant low-emission transportation option (Plӧtz et al., 2020).

The effectiveness of hybrid cars in reducing fuel consumption and emissions depends significantly on their ability to use electric power, which is influenced by charging habits and regenerative braking efficiency. PHEVs achieve the greatest fuel savings and emissions reductions when they are regularly charged from a low-emissions-intensity electricity grid because this maximizes their electric driving capability and minimizes reliance on the ICE. However, studies show that real-world charging behaviors vary, with some PHEV users failing to charge frequently, leading to higher-than-expected fuel consumption. Regenerative braking also plays a crucial role because it recaptures kinetic energy during deceleration and converts it into electricity to recharge the battery, improving overall efficiency. The extent of these benefits depends on driving conditions, with stop-and-go urban traffic allowing for more energy recovery than highway driving, where regenerative braking opportunities are limited (Plötz et al., 2020).

Hybrid car adoption faces a major obstacle in the form of constraints on battery production. While electric car battery production is being aggressively upscaled (IEA, 2024), building enough batteries to build enough cars to replace a significant fraction of fossil fuel–powered ICE cars is an enormous challenge. This will likely slow down a transition to hybrids, even if consumer demand is high (Milovanoff et al., 2020). This suggests that EV batteries should be prioritized for users whose transport needs are harder to serve with other forms of low-emissions transportation (such as nonmotorized transportation, public transit, etc.). This could include emergency vehicles, commercial vehicles, and vehicles for people who live in rural areas or have disabilities. 

left_text_column_width
Current Adoption

Approximately 12 million PHEVs (IEA, 2024) and more than 33 million HEVs (IEA, 2023) are in use worldwide. This corresponds to about 2.2% of the total car stock of 2,022,057,847 (World Health Organization [WHO], 2022) and means that hybrid cars worldwide travel about 1.3 trillion pkm/yr. We assumed this travel would occur in a fossil fuel–powered ICE car if the car’s occupants did not use a hybrid car. Adoption is much higher in some countries, such as Japan, where the global hybrid car stock share was 20–30% in 2023.

To convert this number into pkm traveled by hybrid car, we need to determine the average passenger-distance that each passenger car travels per year. Using population-weighted data from several different countries, the average car carries 1.5 people and travels about 19,500 vehicle-kilometers (vkm)/yr, or an average of 29,250 pkm/yr. Multiplying this number by the number of hybrid cars in use (48.5 million) gives the total travel distance shifted (1.3 trillion pkm) from fossil fuel–powered ICE cars to hybrid cars (Table 4).

left_text_column_width

Table 4. Current (2024) adoption level.

Unit: million pkm/yr

Population-weighted mean 1,318,000

Implied travel shifted from fossil fuel–powered cars to hybrid cars.

Left Text Column Width
Adoption Trend

Globally, the pkm driven in hybrid cars rather than fossil fuel–powered ICE cars increases by an average of about 178,200 million pkm/yr (Table 5). PHEV car purchases between 2019–2023 grew 45%/yr (IEA, 2024), while HEV purchases increased 10% annually between 2021–2023 (IEA, 2021, 2023). Global purchases of hybrid cars are increasing by around 6.1 million cars/yr. This is based on globally representative data (Bloomberg New Energy Finance [BloombergNEF], 2024; Fortune Business Insights, 2025; IEA, 2024; Menes, 2021).

It is worth noting that despite this impressive rate of growth, hybrid cars still have a long way to go before they replace a large percentage of the more than two billion cars currently driven (WHO, 2022).

left_text_column_width

Table 5. 2023–2024 adoption trend.

Unit: million pkm/yr

Population-weighted mean 178,200

Implied travel shifted from fossil fuel–powered cars to hybrid cars.

Left Text Column Width
Adoption Ceiling

The total adoption ceiling for hybrid cars is equal to the total passenger-distance driven by private cars worldwide. Using a population-weighted mean of the average distance (in pkm) traveled per car annually, this translates to about 59 trillion pkm traveled (Table 6).

Replacing every single fossil fuel–powered ICE passenger car with a hybrid car would require an enormous upscaling of hybrid car production capacity, rapid development of charging infrastructure for PHEVs, cost reductions to make hybrid cars more affordable for more people, and technological improvements to make them more suitable for more kinds of drivers and trips. This shift would also face cultural obstacles from drivers who are attached to fossil fuel–powered cars (Roberts, 2022).

left_text_column_width

Table 6. Adoption ceiling.

Unit: million pkm/yr

Population-weighted mean 59,140,000

Implied travel shifted from fossil fuel–powered cars to hybrid cars.

Left Text Column Width
Achievable Adoption

The achievable adoption of hybrid car travel is about 12-30 trillion pkm shifted from fossil fuel–powered ICE vehicles.

Various organizations have produced forecasts of future hybrid car adoption. These are not assessments of feasible adoption per se; they are instead predictions of likely rates of adoption, given various assumptions about the future (Bloomberg New Energy Finance, 2024; Fortune Business Insights, 2025; IEA, 2021, 2023, 2024). But they are useful in that they take a large number of variables into account. To convert these estimates of future likely adoption into estimates of the achievable adoption range, we applied some optimistic assumptions to the numbers in the scenario projections. 

To find a high rate of hybrid car adoption, we assumed that every country could reach the highest rate of adoption projected to occur for any country. Bloomberg (Bloomberg New Energy Finance, 2024) predicts that some countries will reach 20–50% hybrid vehicle stock share by 2030. We therefore set our high adoption rate at 50% adoption worldwide. This corresponds to 1.011 trillion total hybrid cars in use, or 29.6 trillion pkm traveled by hybrid cars (Table 7). An important caveat is that with a global supply constraint in the production of electric car batteries that are also used by hybrids, per-country adoption rates are somewhat zero-sum. Every hybrid car purchased in Japan is one that cannot be purchased somewhere else. This means that for the whole world to achieve 50% hybrid car stock share, global hybrid car production (especially battery production) would have to radically increase. 

To identify a lower feasible rate of electric car adoption, we took the lower end of Bloomberg’s 20–50% global hybrid car adoption ceiling. This is also the current adoption rate in the most intensive country (Japan at 20%), proving it feasible. This translates to 404 million hybrid cars, or 11.8 trillion pkm traveled by hybrid car.

left_text_column_width

Table 7. Range of achievable adoption levels.

Unit: million pkm/yr

Current adoption 1,318,000
Achievable – low 11,830,000
Achievable – high 29,570,000
Adoption ceiling 59,140,000
Left Text Column Width

Hybrid cars currently displace 0.036 Gt CO₂‑eq/yr of GHG emissions from the transportation system on a 100-yr basis (Table 8; 0.036 Gt CO₂‑eq/yr on a 20-yr basis).

If hybrid cars reach 20% of the global private car stock share as BloombergNEF (2024) projects, then with the current number of cars on the road, they will displace 0.321 Gt CO₂‑eq/yr GHG emissions on a 100-yr basis (0.319 Gt CO₂‑eq/yr on a 20-yr basis).

If hybrid cars globally reach 50% of global private car stock share, as BloombergNEF (2024) estimates might happen in some markets, they will displace 0.802 Gt CO₂‑eq/yr GHG emissions on a 100-yr basis (0.796 Gt CO₂‑eq/yr on a 20-yr basis).

If hybrid cars replace 100% of the global car fleet, they will displace 1.603 Gt CO₂‑eq/yr GHG emissions on a 100-yr basis (1.593 Gt CO₂‑eq/yr on a 20-yr basis).

These numbers are based on the present-day average fuel consumption for hybrids and include emissions intensity from electrical grids for PHEVs. If fuel efficiency continues to improve (including hybrids getting lighter) and grids become cleaner, the total climate impact from hybrids cars will increase.

left_text_column_width

Table 8. Climate impact at different levels of adoption.

Unit: Gt CO₂‑eq/yr, 100-yr basis

Current adoption 0.036
Achievable – low 0.321
Achievable – high 0.802
Adoption ceiling 1.603
Left Text Column Width
Additional Benefits

Air Quality

HEVs and PHEVs cars can reduce emissions of air pollutants, including sulfur oxides, sulfur dioxide, particulate matter, nitrogen oxides, and especially carbon monoxide and volatile organic compounds (Requia et al., 2018). Some air pollution reductions are limited (particularly particulate matter and ozone) because hybrid cars are heavy. The added weight can increase emissions from brakes, tires, and wear on the batteries (Carey, 2023; Jones, 2019).

Health

Because hybrid cars have lower tailpipe emissions than fossil fuel–powered ICE cars, they can reduce traffic-related air pollution, which is associated with asthma, lung cancer, increased emergency department visits for respiratory disease, and increased mortality (Anenberg et al., 2019). Transitioning to hybrid cars can reduce exposure to air pollution, improve health, and prevent premature mortality (Garcia et al., 2023; Larson et al., 2020; Peters et al., 2020).

The health benefits of lower traffic-related air pollution vary spatially and – for PHEVs – partly depend on how communities generate electricity (Choma et al., 2020). Racial and ethnic minority communities located near highways and major traffic corridors are disproportionately exposed to air pollution (Kerr et al., 2021). Transitioning to HEVs and PHEVs could improve health in marginalized urban neighborhoods located near highways, industry, or ports (Pennington et al., 2024). These benefits depend on an equitable distribution of hybrid cars and infrastructure to support the adoption of plug-in hybrid cars (Garcia et al., 2023). 

Income and Work

Adopting hybrid cars can lead to savings in a household’s energy burden spent on fuel, or the proportion of income spent on fuel for transportation (Vega-Perkins et al., 2023). Plug-in hybrids can be charged during off-peak times, leading to further reductions in transportation costs (Romm & Frank, 2006). Savings from HEVs and PHEVs may be especially important for low-income households because they have the highest energy burdens (Bell-Pasht, 2024). 

left_text_column_width
Risks

There is some criticism against any solution that advocates for car ownership (electric cars in particular and hybrids – which use fossil fuels – by extension) and that the focus should be on solutions such as public transport systems that reduce car ownership and usage (Jones, 2019; Milovanoff et al., 2020).

There is potential for a rebound effect, where improved fuel efficiency encourages people to drive more, potentially offsetting some of the expected fuel and emissions savings. This can occur because lower fuel costs per kilometer make driving more affordable and so increase vehicle use.

There is a risk that allocating the limited global battery supply to hybrid cars might undermine the deployment of solutions that also require batteries but are more effective at avoiding GHG emissions (Castelvecchi, 2021). These could include electric buses, electric rail, and electric bicycles.

Mining minerals necessary to produce hybrid car batteries carries environmental and social risks. Such mining has been associated with significant harm, particularly in lower-income countries that supply many of these minerals (Agusdinata et al., 2018; Sovacool, 2019).

Hybrid cars might also pose additional safety risks due to their higher weight, which means that they have longer stopping distances and can cause greater damage in collisions and to pedestrians and cyclists (Jones, 2019). 

The operating efficiency depends on charging for PHEVs and braking intensity for all hybrids. The results of efficiency studies also depend on assumptions such as car type, fuel efficiency, battery size, electricity grid, km/yr, and car lifetime. 

left_text_column_width
Interactions with Other Solutions

Competing

Hybrid cars compete directly with electric cars for adoption as well as for batteries, public resources, and infrastructural investment.

left_text_column_width

Traveling by bicycle, sidewalk, public transit network, fully electric car, or smaller electric vehicle (such as electric bicycle) provides a greater climate benefit than traveling by hybrid car. There is an opportunity cost to deploying hybrid cars because those resources could otherwise be used to support these more effective solutions (Asia-Pacific Economic Cooperation [APEC], 2024).

left_text_column_width
Dashboard

Solution Basics

million passenger kilometers (million pkm)

t CO₂-eq (100-yr)/unit
019.5127.11
units/yr
Current 1.318×10⁶ 01.183×10⁷2.957×10⁷
Achievable (Low to High)

Climate Impact

Gt CO₂-eq (100-yr)/yr
Current 0.036 0.3210.802
US$ per t CO₂-eq
264
Gradual

CO₂ , CH₄, N₂O, BC

Trade-offs

Hybrid cars have higher embodied emissions than fossil fuel–powered ICE cars due to the presence of both an ICE and electric motor with a battery that has a GHG-intensive manufacturing process. While the embodied emissions are higher for hybrid cars than ICE cars, coupling them with operating emissions yields a carbon payback period of several years. Embodied emissions were outside the scope of this assessment.

left_text_column_width
Mt CO2-eq/yr
0–4
4–8
8–12
12–16
16–20
> 20
No data

Annual road transportation emissions, 2024

Cars are the largest source of vehicle emissions, which are shown here for urban areas.

Kott, T., Foster, K., Villafane-Delgado, M., Loschen, W., Sicurello, P., Ghebreselassie, M., Reilly, E., and Hughes, M. (2024). Transportation sector - Global road emissions [Data set]. The Johns Hopkins University Applied Physics Laboratory (JHU/APL), USA, Climate TRACE Emissions Inventory. Retrieved March 12, 2025 from, Link to source: https://climatetrace.org  

Maps Introduction

Hybrid cars can mitigate climate change across a wide range of geographic regions. However, their effectiveness varies due to spatial differences in driving conditions, vehicle usage patterns, the carbon intensity of local fuel mixes, and the carbon intensity of the charging source for plug-in hybrid electric vehicles (PHEVs). Hybrids are most effective in urban environments with stop-and-go traffic. Unlike fully electric cars, hybrids do not depend on external charging infrastructure, making them more immediately viable in areas where transport electrification is a challenge.

Socioeconomic factors, including fuel prices, vehicle taxes, and the availability of incentives, influence the adoption of hybrids. Hybrids may be most attractive in areas with high gasoline prices and underdeveloped electric charging infrastructure. They can be a practical transition technology in countries where civil society or government institutions have not yet mobilized large-scale investments in charging infrastructure.

Hybrid cars have an advantage in hot and cold climates, where battery range degradation and heating/cooling loads might discourage electric car adoption.

Hybrid cars have already experienced high adoption in regions such as Japan and North America. Looking forward, they could be particularly impactful in South and Southeast Asia, where urban congestion and poor air quality make cleaner vehicles highly desirable but electricity infrastructure remains unreliable; Sub-Saharan Africa, where hybrids offer emission reductions without requiring major grid upgrades; and middle-income countries in Latin America and Eastern Europe, where rising car ownership coupled with energy price volatility makes fuel-efficient hybrids more attractive than fossil fuel–powered cars.

Action Word
Mobilize
Solution Title
Hybrid Cars
Classification
Highly Recommended
Lawmakers and Policymakers
  • Create time-bound government procurement policies and targets to transition government fleets to hybrid cars when fully electric cars aren’t possible.
  • Provide financial incentives such as tax breaks, subsidies, or grants for hybrid car production and purchases that gradually reduce as market adoption increases.
  • Provide complimentary benefits for hybrid car drivers, such as privileged parking areas, free tolls, and access schemes.
  • Use targeted financial incentives to help low-income communities buy hybrid cars and incentivize manufacturers to produce more affordable options.
  • Develop charging infrastructure, ensuring adequate spacing between stations and equitable distribution of stations.
  • Invest in R&D or implement regulations to improve manufacturing, adoption, supply chain standards, and circularity of hybrid cars – particularly batteries.
  • Transition fossil fuel electricity production to renewables while promoting the transition to hybrid cars.
  • Disincentivize fossil fuel–powered ICE car ownership by gradually introducing taxes, penalties, buy-back programs, or other mechanisms.
  • Offer one-stop shops for information on hybrid vehicles, including demonstrations and educational resources on cost savings, environmental impact, and maintenance.
  • Work with industry and labor leaders to construct new hybrid car plants and transition fossil fuel–powered ICE car manufacturing into hybrid car production.
  • Set regulations for sustainable use of hybrid car batteries and improve recycling infrastructure.
  • Join international efforts to promote and ensure supply chain environmental and human rights standards.
  • Incentivize or mandate life-cycle assessments and product labeling (e.g., Environmental Product Declarations).
  • Create, support, or join partnerships that offer information, training, and general support for hybrid car adoption.
Practitioners
  • Produce and sell affordable hybrid car models.
  • Collaborate with dealers to provide incentives, low-interest financing, or income-based payment options.
  • Develop charging infrastructure, ensuring adequate spacing between stations and equitable distribution of stations.
  • Offer lifetime warranties for hybrid batteries and easy-to-understand maintenance instructions.
  • Invest in R&D to improve manufacturing, adoption, supply chain standards, and circularity of hybrid cars, particularly batteries.
  • Provide customers with real-world data to help alleviate fuel efficiency concerns.
  • Offer one-stop shops for information on hybrid cars, including educational resources on cost savings, environmental impact, optimal charging, and maintenance.
  • Work with policymakers and labor leaders to construct new hybrid car plants and transition fossil fuel–powered ICE car manufacturing into hybrid car production.
  • Join international efforts to promote and ensure supply chain environmental and human rights standards.
  • Invest in recycling and circular economy infrastructure.
  • Conduct life-cycle assessments and ensure product labeling (e.g., Environmental Product Declarations).
  • Create, support, or join partnerships that offer information, training, and general support for hybrid car adoption.
Business Leaders
  • Set time-bound company procurement policies and targets to transition corporate fleets to hybrid cars when fully electric cars aren’t feasible and report on these metrics regularly.
  • Encourage supply chain partners to transition their delivery fleets to hybrid vehicles when fully electric cars aren’t feasible.
  • Take advantage of financial incentives, such as tax breaks, subsidies, or grants for hybrid car purchases.
  • Create purchasing agreements with hybrid car manufacturers to support stable demand and improve economies of scale.
  • Install charging stations and offer employee benefits for hybrid car drivers, such as privileged parking areas.
  • Invest in R&D to improve manufacturing, adoption, supply chain standards, and circularity of hybrid cars – particularly batteries.
  • Work with industry and labor leaders to transition fossil fuel–powered ICE car manufacturing into hybrid car production.
  • Advocate for financial incentives and policies that promote hybrid car adoption.
  • Join international efforts to promote and ensure supply chain environmental and human rights standards.
  • Educate employees, customers, and investors about the company's transition to hybrid cars and encourage them to learn more about them.
  • Offer one-stop shops for information on hybrid cars, including demonstrations and educational resources on cost savings, environmental impact, and maintenance.
  • Create, support, or join partnerships that offer information, training, and general support for hybrid car adoption.

Further information:

Nonprofit Leaders
  • Set time-bound organizational procurement policies and targets to transition fleets to hybrid cars when fully electric cars aren’t feasible.
  • Take advantage of financial incentives, such as tax breaks, subsidies, or grants for hybrid car purchases.
  • Advocate for financial incentives and policies that promote hybrid car adoption.
  • Install charging stations and offer employee benefits for hybrid car drivers, such as privileged parking areas.
  • Advocate for or provide improved charging infrastructure.
  • Offer workshops or support to low-income communities for purchasing and owning hybrid cars.
  • Work with industry and labor leaders to transition fossil fuel–powered ICE car manufacturing into hybrid car production.
  • Join international efforts to promote and ensure supply chain environmental and human rights standards.
  • Advocate for regulations on lithium-ion batteries and investments in recycling facilities.
  • Offer one-stop shops for information on hybrid cars, including demonstrations and educational resources on cost savings, environmental impact, and maintenance.
  • Create, support, or join partnerships that offer information, training, and general support for hybrid car adoption.
Investors
  • Invest in hybrid car companies and companies that provide charging equipment or installation.
  • Pressure and support portfolio companies in transitioning their corporate fleets.
  • Pressure portfolio companies to establish and report on time-bound targets for corporate fleet transition and roll-out of employee incentives.
  • Invest in R&D to improve manufacturing, adoption, supply chain standards, and circularity of hybrid cars – particularly batteries.
  • Invest in hybrid car companies, associated supply chains, and end-user businesses like rideshare apps.
  • Join international efforts to promote and ensure supply chain environmental and human rights standards.
  • Create, support, or join partnerships that offer information, training, and general support for hybrid car adoption.
  • Offer low-interest loans for purchasing hybrid cars or charging infrastructure.
Philanthropists and International Aid Agencies
  • Set time-bound organizational procurement policies to transition fleets to hybrid cars when fully electric cars aren’t feasible.
  • Install charging stations and offer employee benefits for hybrid car drivers, such as privileged parking areas.
  • Take advantage of financial incentives, such as tax breaks, subsidies, or grants for hybrid car purchases.
  • Advocate for financial incentives and policies that promote hybrid car adoption.
  • Advocate for or provide improved charging infrastructure.
  • Advocate for regulations on lithium-ion batteries and public investments in recycling facilities.
  • Offer financial services such as low-interest loans or grants for purchasing hybrid cars and charging equipment.
  • Offer workshops or support to low-income communities for purchasing and owning hybrid cars.
  • Work with industry and labor leaders to transition fossil fuel–powered ICE car manufacturing into hybrid car production.
  • Join international efforts to promote and ensure supply chain environmental and human rights standards.
  • Offer one-stop shops for information on hybrid vehicles, including demonstrations and educational resources on cost savings, environmental impact, and maintenance.
  • Create, support, or join partnerships that offer information, training, and general support for hybrid car adoption.
Thought Leaders
  • If purchasing a new car, buy a hybrid car if fully electric isn’t feasible.
  • Take advantage of financial incentives, such as tax breaks, subsidies, or grants for hybrid car purchases.
  • Share your experiences with hybrid cars through social media and peer-to-peer networks, highlighting the cost savings, benefits, incentive programs, and troubleshooting tips.
  • Advocate for financial incentives and policies that promote hybrid car adoption.
  • Advocate for improved charging infrastructure.
  • Help improve circularity of hybrid car supply chains.
  • Conduct in-depth life-cycle assessments of hybrid cars in particular geographies.
  • Research ways to reduce weight and improve the performance of hybrid cars while appealing to customers.
  • Join international efforts to promote and ensure supply chain environmental and human rights standards.
  • Create, support, or join partnerships that offer information, training, and general support for hybrid car adoption.
Technologists and Researchers
  • Improve circularity of hybrid car supply chains.
  • Reduce the amount of critical minerals required for hybrid car batteries.
  • Innovate low-cost methods to improve safety, labor standards, and supply chains in mining for critical minerals.
  • Increase the longevity of batteries.
  • Research ways to reduce weight and improve the performance of hybrid cars while appealing to customers.
  • Improve techniques to repurpose used hybrid car batteries for stationary energy storage.
  • Develop methods of adapting fossil fuel–powered car manufacturing and infrastructure to include electric components.
Communities, Households, and Individuals
  • If purchasing a new car, buy a hybrid car when fully electric cars aren’t feasible.
  • Take advantage of financial incentives, such as tax breaks, subsidies, or grants for hybrid car purchases.
  • Share your experiences with hybrid cars through social media and peer-to-peer networks, highlighting the cost savings, benefits, incentive programs, and troubleshooting tips.
  • Help shift the narrative around hybrid cars by demonstrating capability and performance.
  • Advocate for financial incentives and policies that promote hybrid car adoption.
  • Advocate for improved charging infrastructure.
  • Help improve circularity of supply chains for hybrid car components.
  • Join international efforts to promote and ensure supply chain environmental and human rights standards.
  • Create, support, or join partnerships that offer information, training, and general support for hybrid car adoption.
Sources
Evidence Base

Consensus of effectiveness in reducing GHG emissions: Mixed

There is a high level of consensus that hybrid cars emit fewer GHGs per kilometer traveled compared to fossil fuel–powered ICE cars. Hybrid cars achieve these reductions by combining an ICE with an electric motor that improves fuel efficiency and, for some models, allow for limited all-electric driving, further reducing fuel consumption and emissions. This advantage is strongest in places where trips are short and require a lot of braking, such as in cities. 

Globally, cars and vans were responsible for 3.8 Gt CO₂‑eq emissions in 2023 – more than 60% of road transport emissions (IEA, 2024).

Major climate research organizations generally see hybrid cars as a transitional means of reducing GHG emissions from passenger transportation. These technologies offer immediate emissions reductions while the electricity grid decarbonizes and battery technology improves. Any improvement to fuel efficiency or time spent driving electrically reduces emissions. These technologies can be a gateway to fully electric cars by eliminating range anxiety and allowing drivers the experience of electric driving without fully committing to the limitations of current EV infrastructure. 

Hybrid cars, while more fuel-efficient than fossil fuel–powered ICE cars, still rely on gasoline or diesel (or potentially advanced biofuels), meaning they continue to produce tailpipe emissions and contribute to air pollution. Additionally, their dual powertrains add complexity, leading to higher embodied emissions, manufacturing costs, increased maintenance requirements, and potential long-term reliability concerns. The added weight from both an ICE and an electric motor, along with a battery pack, can reduce overall efficiency and raise safety concerns. Embodied emissions are outside the scope of this assessment.

The International Council on Clean Transportation (ICCT; Isenstadt & Slowik (2025) estimated that HEVs reduce tailpipe GHG emissions by 30% while costing an average of US$2,000 more upfront. Over a 10-yr period, they offered an estimated fuel cost savings of US$4,500. ICCT expected future HEVs to achieve an additional 15% reduction in GHG emissions, with a decrease in the price premium of US$300–800. PHEVs reduce GHG emissions by 11–30%, depending on emissions intensity of the electric grid and the proportion of distance driven electrically. 

The IEA (2024) noted that a PHEV bought in 2023 will emit 30% less GHGs than a fossil fuel–powered ICE car over its lifetime. This includes full life cycle impacts, including those from producing the car. 

The International Transport Forum (2020) estimated that fossil fuel–powered ICE cars emit 162 g CO‑eq/pkm while HEVs emit 132 g CO‑eq/pkm and PHEVs emit 124 g CO‑eq/pkm. This includes embodied and upstream emissions.

The results presented in this document summarize findings from 12 reviews and meta-analyses and 29 original studies reflecting current evidence from 72 countries, primarily from the IEA’s Global Electric Vehicle Outlook (2024) and Electric Vehicles: Total Cost of Ownership Tool (2022) and the International Transport Forum’s life-cycle analysis on sustainable transportation (2020). We recognize this limited geographic scope creates bias, and hope this work inspires research and data sharing on this topic in underrepresented regions.

left_text_column_width
Updated Date

Increase Recycling

Image
Image
Metal items
Coming Soon
Off
Summary

Recycling is a mechanical process that repurposes waste into new products without altering their chemical structure. This solution focuses on four common waste types: metals, paper and cardboard, plastics, and glass. It reduces GHG emissions by minimizing reliance on energy-intensive primary material production, reducing demand for raw materials, and diverting paper from landfills, where decomposition can produce methane.

Our focus is on postconsumer municipal solid waste (MSW) collected through residential and commercial recycling programs. Textiles, rubber, wood, and e-waste are also important waste streams but are excluded in our scope due to limited availability of global data. Organic waste is addressed separately in other Drawdown Explorer solutions, including Increase Centralized CompostingIncrease Decentralized Composting, and Produce Biochar.

Description for Social and Search
Increase Recycling is a Highly Recommended climate solution, with paper, cardboard, and metals delivering the most greenhouse gas savings.
Overview

Mechanical recycling mitigates GHG emissions by reducing the need for more energy-intensive and pollutant-emitting raw material extraction and processing (Stegmann et al., 2022; Sun et al., 2018; Zier et al., 2021) and reducing production of methane from decomposing paper in landfills (Demetrious & Crossin, 2019; Lee et al., 2017). 

Recyclable materials constitute a significant portion of global MSW, with average compositions of approximately 14% paper and cardboard, 10% plastics, 4% glass, and 3.5% metals (Kaza et al., 2018; United Nations Environment Programme [UNEP], 2024). Recycling reprocesses postconsumer materials into secondary raw materials or products without altering their chemical composition.

Figure 1 illustrates a typical single-stream recycling system at a materials recovery facility (MRF), where mechanical and optical sorting technologies separate materials by type (Gundupalli et al., 2017; Zhang et al., 2022). The sorted materials then undergo cleaning, crushing or shredding, and remelting or repulping in preparation for use in manufacturing new products.

Figure 1. Overview of the separation steps in a materials recycling facility to separate metal, paper and cardboard, plastic, and glass waste. Modified from Waldrop (2020).

Image
Diagram of a recycling facility

Source: Waldrop, M. M. (2020, October 1). Recycling meets reality. Knowable Magazine.

Metals recycling provides ferrous and non-ferrous inputs for the metal production sector, which globally emits an estimated 3.6 Gt CO₂‑eq/yr for 2–3 Gt of primary metal output (Azadi et al., 2020). Virgin (primary) metals are extracted from nonrenewable ores; as higher-grade ores are consumed, mining shifts to lower-grade ore deposits, which require more energy-intensive extraction and processing (Norgate & Jahanshahi, 2011). Using recycled metals in place of virgin metals reduces energy requirements for smelting and refining (Daehn et al., 2022) and water use during production. 

Virgin ore processing primarily emits CO₂, with smaller contributions of methane and nitrous oxide. Some primary metal production, particularly aluminum production, emits fluorinated gases (F-gases) (Raabe et al., 2019; Raabe et al., 2022). Recycling emits significantly less CO₂ than primary material production.

Paper and cardboard recycling involves hydropulping, deinking, and reforming recovered fibers into new paper products. Conventional paper is produced from virgin tree pulp and involves harvesting, debarking, chipping, and mechanical or chemical pulping. Pulp-making alone accounts for 62% of energy use and 45% of emissions in paper production (Sun et al., 2018), contributing significantly to the 1.3–2% of global GHG emissions from virgin pulp and paper manufacturing (Furszyfer Del Rio et al., 2022). Recycling uses less energy and produces fewer GHG emissions. Recycling 1 t of paper saves ~17 mature trees (U.S. Environmental Protection Agency [U.S. EPA], 2016a), lessening deforestation from harvesting and reducing the energy and water required for pulping. Recovering used paper from landfills further avoids decomposition-related methane release.

Plastics recycling involves melting plastic waste into resin, forming it into granules or pellets, and using it to manufacture new products. The primary material production of plastics represents 4.5–5.3% of total global GHG emissions (Cabernard et al., 2022; Karali et al., 2024), with ~75% occurring in the early life-cycle stages. More than 99% of plastics are derived from fossil fuels. Recycling plastics reduces CO₂ and methane emissions by replacing petroleum-based feedstock with recycled plastic. 

Glass recycling crushes glass waste into cullet, which can then be melted and reintroduced as a raw material in glass manufacturing. Virgin glass production requires melting raw materials such as silica sand, soda ash, and limestone at ~1,500 °C (Baek et al., 2025; Westbroek et al., 2021) and releases CO₂ from decomposition of carbonates. Cullet use releases no CO₂ from carbonate decomposition and lowers the melting temperature, reducing furnace fuel combustion. 

This assessment evaluates metal, paper and cardboard, plastic, and glass recycling separately to better capture the distinct emissions profiles and cost requirements of each material, providing a clearer understanding of the climate benefits and trade-offs. 

Allwood, J. M., Music, O., Loukaides, E. G., & Bambach, M. (2025). Cut the scrap: Making more use of less metal. CIRP Annals74(2), 895–919. Link to source: https://doi.org/10.1016/j.cirp.2025.04.013 

Aparcana, S., & Salhofer, S. (2013). Development of a social impact assessment methodology for recycling systems in low-income countries. The International Journal of Life Cycle Assessment18(5), 1106–1115. Link to source: https://doi.org/10.1007/s11367-013-0546-8

Awino, F. B., & Apitz, S. E. (2024). Solid waste management in the context of the waste hierarchy and circular economy frameworks: An international critical review. Integrated Environmental Assessment and Management20(1), 9–35. Link to source: https://doi.org/10.1002/ieam.4774

Ayodele, T. R., Alao, M. A., & Ogunjuyigbe, A. S. O. (2018). Recyclable resources from municipal solid waste: Assessment of its energy, economic and environmental benefits in Nigeria. Resources, Conservation and Recycling134, 165–173. Link to source: https://doi.org/10.1016/j.resconrec.2018.03.017

Azadi, M., Northey, S. A., Ali, S. H., & Edraki, M. (2020). Transparency on greenhouse gas emissions from mining to enable climate change mitigation. Nature Geoscience13(2), 100–104. Link to source: https://doi.org/10.1038/s41561-020-0531-3

Baek, C. R., Kim, H. D., & Jang, Y.-C. (2025). Exploring glass recycling: Trends, technologies, and future trajectories. Environmental Engineering Research30(3), Article 240241. Link to source: https://doi.org/10.4491/eer.2024.241

Bajpai, P. (2014). Introduction. In Recycling and deinking of recovered paper (pp. 1–18). Elsevier. Link to source: https://doi.org/10.1016/B978-0-12-416998-2.00001-5

Barbato, P. M., Olsson, E., & Rigamonti, L. (2024). Quality degradation in glass recycling: Substitutability model proposal. Waste Management182, 124–131. Link to source: https://doi.org/10.1016/j.wasman.2024.04.027

Barford, A., & Beales, A. (2025, April 3). Decent work opportunities and challenges in recycling [ILO Technical brief]. International Labour Organization. Link to source: https://www.ilo.org/publications/decent-work-opportunities-and-challenges-recycling 

Bauer, F., Nielsen, T. D., Nilsson, L. J., Palm, E., Ericsson, K., Fråne, A., & Cullen, J. (2022). Plastics and climate change—Breaking carbon lock-ins through three mitigation pathways. One Earth5(4), 361–376. Link to source: https://doi.org/10.1016/j.oneear.2022.03.007

Berardocco, C., Delawter, H., Putzu, T., Wolfe, L. C., & Zhang, H. (2022). Life cycle sustainability assessment of single stream and multi-stream waste recycling systems. Sustainability, 14(24), Article 16747. Link to source: https://doi.org/10.3390/su142416747 

BioCubes. (n.d.). BioCubes: An inventory of biomass and technomass [Interactive infographic]. Retrieved August 8, 2025, from Link to source: https://biocubes.net/ 

Bogner, J., Abdelrafie Ahmed, M., Díaz, C., Faaij, A., Gao, Q., Hashimoto, S., Marecková, K., Pipatti, R., & Zhang, T. (2007). Waste management. In B. Metz, O. R. Davidson, P. R. Bosch, R. Dave, & L. A. Meyer (Eds.), Climate change 2007: Mitigation. Working group III contribution to the fourth assessment report of the intergovernmental panel on climate change (pp. 585–618). Cambridge University Press. Link to source: https://www.ipcc.ch/site/assets/uploads/2018/02/ar4-wg3-chapter10-1.pdf

Burinskienė, A., Lingaitienė, O., & Byčenkaitė, G. (2025). Dynamics of trade of recycled raw materials and the connection with the circular economy. Discover Sustainability, 6, Article  680. Link to source: https://doi.org/10.1007/s43621-025-01502-4

Cabernard, L., Pfister, S., Oberschelp, C., & Hellweg, S. (2022). Growing environmental footprint of plastics driven by coal combustion. Nature Sustainability5(2), 139–148. Link to source: https://doi.org/10.1038/s41893-021-00807-2

Campbell, R., Bond, D. E., Connellan, C., Mohen, P., & Foo, J. (2022, May 5). From trash to treasure: Green metals from recycling [Insight]. White & Case. Link to source: https://www.whitecase.com/insight-our-thinking/trash-treasure-green-metals-recycling 

Chamas, A., Moon, H., Zheng, J., Qiu, Y., Tabassum, T., Jang, J. H., Abu-Omar, M., Scott, S. L., & Suh, S. (2020). Degradation rates of plastics in the environment. ACS Sustainable Chemistry & Engineering8(9), 3494–3511. Link to source: https://doi.org/10.1021/acssuschemeng.9b06635

Charpentier Poncelet, A., Helbig, C., Loubet, P., Beylot, A., Muller, S., Villeneuve, J., Laratte, B., Thorenz, A., Tuma, A., & Sonnemann, G. (2022). Losses and lifetimes of metals in the economy. Nature Sustainability5(8), 717–726. Link to source: https://doi.org/10.1038/s41893-022-00895-8

Chen, D. M.-C., Bodirsky, B. L., Krueger, T., Mishra, A., & Popp, A. (2020). The world’s growing municipal solid waste: Trends and impacts. Environmental Research Letters15(7), Article 074021. Link to source: https://doi.org/10.1088/1748-9326/ab8659

Ciacci, L., Harper, E. M., Nassar, N. T., Reck, B. K., & Graedel, T. E. (2016). Metal dissipation and inefficient recycling intensify climate forcing. Environmental Science & Technology, 50(20), 11394–11402. Link to source: https://doi.org/10.1021/acs.est.6b02714 

Close the Glass Loop. (2025, July 1). Overview of glass packaging collection systems in Europe. Link to source: https://closetheglassloop.eu/overview-of-glass-packaging-collection-systems-in-europe/

Colangelo, S. (2024). Reducing the environmental footprint of glass manufacturing. International Journal of Applied Glass Science15(4), 350–366. Link to source: https://doi.org/10.1111/ijag.16674

Cudjoe, D., Zhu, B., Nketiah, E., Wang, H., Chen, W., & Qianqian, Y. (2021). The potential energy and environmental benefits of global recyclable resources. Science of The Total Environment798, Article 149258. Link to source: https://doi.org/10.1016/j.scitotenv.2021.149258

Daehn, K., Basuhi, R., Gregory, J., Berlinger, M., Somjit, V., & Olivetti, E. A. (2022). Innovations to decarbonize materials industries. Nature Reviews Materials7(4), 275–294. Link to source: https://doi.org/10.1038/s41578-021-00376-y

Damgaard, A., Larsen, A. W., & Christensen, T. H. (2009). Recycling of metals: Accounting of greenhouse gases and global warming contributions. Waste Management & Research27(8), 773–780. Link to source: https://doi.org/10.1177/0734242X09346838

Das, S. K., Green, J. A. S., & Kaufman, J. G. (2010, February). Aluminum recycling: Economic and environmental benefits. Light Metal Age, 22–24. Link to source: https://static1.squarespace.com/static/5fecb6479b54c51485875e10/t/60ac1db2e0db640cb17e0eef/1621892530735/Aluminum+Recycling_+Economic+and+Environmental+...+-+Phinix%2C+LLC.pdf 

DebRoy, T., & Elmer, J. W. (2024). Metals beyond tomorrow: Balancing supply, demand, sustainability, substitution, and innovations. Materials Today80, 737–757. Link to source: https://doi.org/10.1016/j.mattod.2024.09.007

Deer, R. (2021, May 5). Why is glass recycling going away? Roadrunner Waste & Recycling. Link to source: https://www.roadrunnerwm.com/blog/why-is-glass-recycling-going-away

Delbari, S. A., & Hof, L. A. (2024). Glass waste circular economy—Advancing to high-value glass sheets recovery using industry 4.0 and 5.0 technologies. Journal of Cleaner Production462, Article 142629. Link to source: https://doi.org/10.1016/j.jclepro.2024.142629

Demetrious, A., & Crossin, E. (2019). Life cycle assessment of paper and plastic packaging waste in landfill, incineration, and gasification-pyrolysis. Journal of Material Cycles and Waste Management21(4), 850–860. Link to source: https://doi.org/10.1007/s10163-019-00842-4

de Sa, P., & Korinek, J. (2021, March 1). Resource efficiency, the circular economy, sustainable materials management and trade in metals and minerals (OECD Trade Policy Paper No. 245). OECD Publishing. Link to source: https://doi.org/10.1787/69abc1bd-en

Diaz, R., & Warith, M. (2006). Life-cycle assessment of municipal solid wastes: Development of the WASTED model. Waste Management26(8), 886–901. Link to source: https://doi.org/10.1016/j.wasman.2005.05.007

Dokl, M., Copot, A., Krajnc, D., Fan, Y. V., Vujanović, A., Aviso, K. B., Tan, R. R., Kravanja, Z., & Čuček, L. (2024). Global projections of plastic use, end-of-life fate and potential changes in consumption, reduction, recycling and replacement with bioplastics to 2050. Sustainable Production and Consumption51, 498–518. Link to source: https://doi.org/10.1016/j.spc.2024.09.025

Dong, X., Song, J., & Duan, H. (2022). Prioritizing countries for implementing waste recycling under socioeconomic support. Journal of Environmental Management, 322, Article  116158. Link to source: https://doi.org/10.1016/j.jenvman.2022.116158

Dussaux, D., & Glachant, M. (2019). How much does recycling reduce imports? Evidence from metallic raw materials. Journal of Environmental Economics and Policy8(2), 128–146. Link to source: https://doi.org/10.1080/21606544.2018.1520650

Egger, P. H., & Keuschnigg, C. (2024). Resource dependence, recycling, and trade. Journal of Environmental Economics and Management128, Article 103064. Link to source: https://doi.org/10.1016/j.jeem.2024.103064

European Paper Recycling Council. (2024). European declaration on paper recycling 2021-2030: Monitoring report 2023. Confederation of European Paper Industries. Link to source: https://www.cepi.org/wp-content/uploads/2024/11/24-4378_EPRC_2023_Singlepages.pdf

Ferdous, W., Manalo, A., Siddique, R., Mendis, P., Zhuge, Y., Wong, H. S., Lokuge, W., Aravinthan, T., & Schubel, P. (2021). Recycling of landfill wastes (tyres, plastics and glass) in construction – A review on global waste generation, performance, application and future opportunities. Resources, Conservation and Recycling173, Article 105745. Link to source: https://doi.org/10.1016/j.resconrec.2021.105745

Food and Agriculture Organization of the United Nations. (n.d.). FAO‑FAOSTAT: Forestry production and trade [Data set]. Retrieved April 25, 2025, from Link to source: https://www.fao.org/faostat/en/#data/FO/visualize 

Food and Agriculture Organization of the United Nations. (2009). Global demand for wood products. In State of the world’s forests 2009 (pp. 62–73). Link to source: https://www.fao.org/4/i0350e/i0350e02a.pdf 

Furszyfer Del Rio, D. D., Sovacool, B. K., Griffiths, S., Bazilian, M., Kim, J., Foley, A. M., & Rooney, D. (2022). Decarbonizing the pulp and paper industry: A critical and systematic review of sociotechnical developments and policy options. Renewable and Sustainable Energy Reviews167, Article 112706. Link to source: https://doi.org/10.1016/j.rser.2022.112706

Gailani, A., Cooper, S., Allen, S., Pimm, A., Taylor, P., & Gross, R. (2024). Assessing the potential of decarbonization options for industrial sectors. Joule8(3), 576–603. Link to source: https://doi.org/10.1016/j.joule.2024.01.007

Geyer, R., Kuczenski, B., Zink, T., & Henderson, A. (2016). Common misconceptions about recycling. Journal of Industrial Ecology20(5), 1010–1017. Link to source: https://doi.org/10.1111/jiec.12355

Glass Packaging Institute. (n.d.). Facts about glass recycling. Retrieved March 24, 2025, from Link to source: https://www.gpi.org/facts-about-glass-recycling 

Gorman, M. R., Dzombak, D. A., & Frischmann, C. (2022). Potential global GHG emissions reduction from increased adoption of metals recycling. Resources, Conservation and Recycling184, Article 106424. Link to source: https://doi.org/10.1016/j.resconrec.2022.106424

Gundupalli, S. P., Hait, S., & Thakur, A. (2017). A review on automated sorting of source-separated municipal solid waste for recycling. Waste Management60, 56–74. Link to source: https://doi.org/10.1016/j.wasman.2016.09.015

Guo, J., Ali, S., & Xu, M. (2023). Recycling is not enough to make the world a greener place: Prospects for the circular economy. Green Carbon1(2), 150–153. Link to source: https://doi.org/10.1016/j.greenca.2023.10.006 

Halog, A., & Anieke, S. (2021). A review of circular economy studies in developed countries and its potential adoption in developing countries. Circular Economy and Sustainability1(1), 209–230. Link to source: https://doi.org/10.1007/s43615-021-00017-0

Hendrickson, T. P., Bose, B., Vora, N., Huntington, T., Nordahl, S. L., Helms, B. A., & Scown, C. D. (2024). Paths to circularity for plastics in the United States. One Earth, 7(3), 520–531. Link to source: https://doi.org/10.1016/j.oneear.2024.02.005

Houssini, K., Li, J., & Tan, Q. (2025). Complexities of the global plastics supply chain revealed in a trade-linked material flow analysis. Communications Earth & Environment6(1), Article 257. Link to source: https://doi.org/10.1038/s43247-025-02169-5

International Paper. (n.d.). Paper’s life cycle: The recycling process [Infographic]. Retrieved June 10, 2025, from Link to source: https://www.internationalpaper.com/resources/infographic/papers-life-cycle-recycling-process

Karali, N., Khanna, N., & Shah, N. (2024). Climate impact of primary plastic production. Lawrence Berkeley National Laboratory. Link to source: https://escholarship.org/uc/item/6cc1g99q

Kaza, S., Yao, L. C., Bhada-Tata, P., & Van Woerden, F. (2018). What a waste 2.0: A global snapshot of solid waste management to 2050. Urban Development Series. Washington, DC: World Bank. Link to source: https://hdl.handle.net/10986/30317 

Klotz, M., Haupt, M., & Hellweg, S. (2022). Limited utilization options for secondary plastics may restrict their circularity. Waste Management141, 251–270. Link to source: https://doi.org/10.1016/j.wasman.2022.01.002

Klotz, M., Haupt, M., & Hellweg, S. (2023). Potentials and limits of mechanical plastic recycling. Journal of Industrial Ecology27(4), 1043–1059. Link to source: https://doi.org/10.1111/jiec.13393

Lee, U., Han, J., & Wang, M. (2017). Evaluation of landfill gas emissions from municipal solid waste landfills for the life-cycle analysis of waste-to-energy pathways. Journal of Cleaner Production166, 335–342. Link to source: https://doi.org/10.1016/j.jclepro.2017.08.016

Li, H., Aguirre-Villegas, H. A., Allen, R. D., Bai, X., Benson, C. H., Beckham, G. T., Bradshaw, S. L., Brown, J. L., Brown, R. C., Cecon, V. S., Curley, J. B., Curtzwiler, G. W., Dong, S., Gaddameedi, S., García, J. E., Hermans, I., Kim, M. S., Ma, J., Mark, L. O., … Huber, G. W. (2022). Expanding plastics recycling technologies: Chemical aspects, technology status and challenges. Green Chemistry24(23), 8899–9002. Link to source: https://doi.org/10.1039/D2GC02588D

Liu, Y., Park, S., Yi, H., & Feiock, R. (2020). Evaluating the employment impact of recycling performance in Florida. Waste Management101, 283–290. Link to source: https://doi.org/10.1016/j.wasman.2019.10.025

Maximize Market Research Private Limited. (2025). Glass recycling market – Global market forecast and growth opportunities: Forecast 2025–2032 [Report summary]. Link to source: https://www.maximizemarketresearch.com/market-report/glass-recycling-market/22548/ 

McGinty, D. B. (2021, February 3). 5 opportunities of a circular economy. World Resources Institute. Link to source: https://www.wri.org/insights/5-opportunities-circular-economy 

Miserocchi, L., Franco, A., & Testi, D. (2024). Status and prospects of energy efficiency in the glass industry: Measuring, assessing and improving energy performance. Energy Conversion and Management: X24, Article 100720. https://doi.org/10.1016/j.ecmx.2024.100720

Monclús, L., Arp, H. P. H., Groh, K. J., Faltynkova, A., Løseth, M. E., Muncke, J., Wang, Z., Wolf, R., Zimmermann, L., & Wagner, M. (2025). Mapping the chemical complexity of plastics. Nature, 643(8071), 349–355. Link to source: https://doi.org/10.1038/s41586-025-09184-8

Nayanathara Thathsarani Pilapitiya, P. G. C., & Ratnayake, A. S. (2024). The world of plastic waste: A review. Cleaner Materials11, Article 100220. Link to source: https://doi.org/10.1016/j.clema.2024.100220

Ng, K. S., & Phan, A. N. (2021). Evaluating the techno-economic potential of an integrated material recovery and waste-to-hydrogen system. Resources, Conservation and Recycling167, Article 105392. Link to source: https://doi.org/10.1016/j.resconrec.2020.105392

NIH Environmental Management System. (n.d.). Benefits of recycling. U.S. Department of Health and Human Services, National Institutes of Health. Retrieved August 26, 2025, from Link to source: https://nems.nih.gov/environmental-programs/pages/benefits-of-recycling.aspx 

Nordahl, S. L., & Scown, C. D. (2024). Recommendations for life‑cycle assessment of recyclable plastics in a circular economy. Chemical Science, 15, 9397–9407. Link to source: https://doi.org/10.1039/D4SC01340A

Norgate, T., & Jahanshahi, S. (2011). Reducing the greenhouse gas footprint of primary metal production: Where should the focus be? Minerals Engineering24(14), 1563–1570. Link to source: https://doi.org/10.1016/j.mineng.2011.08.007

Obradovic, D., & Mishra, L. N. (2020). Mechanical properties of recycled paper and cardboard. The Journal of Engineering and Exact Sciences6(3), 0429–0434. Link to source: https://doi.org/10.18540/jcecvl6iss3pp0429-0434

Olafasakin, O., Ma, J., Bradshaw, S. L., Aguirre-Villegas, H. A., Benson, C., Huber, G. W., Zavala, V. M., & Mba-Wright, M. (2023). Techno-economic and life cycle assessment of standalone single-stream material recovery facilities in the United States. Waste Management166, 368–376. Link to source: https://doi.org/10.1016/j.wasman.2023.05.011

Oo, P. Z., Prapaspongsa, T., Strezov, V., Huda, N., Oshita, K., Takaoka, M., Ren, J., Halog, A., & Gheewala, S. H. (2024). The role of global waste management and circular economy towards carbon neutrality. Sustainable Production and Consumption52, 498–510. Link to source: https://doi.org/10.1016/j.spc.2024.11.021

Organisation for Economic Co‑operation and Development. (2022a). Global plastics outlook database [Data set]. Link to source: https://data-explorer.oecd.org/vis?tm=recycled%20plastics&pg=0&hc[Measure]=&hc[Plastic%20end-of-life%20fate]=&snb=13&df[ds]=dsDisseminateFinalDMZ&df[id]=DSD_PW%40DF_PW&df[ag]=OECD.ENV.EEI&df[vs]=1.0&dq=..A.REC.&pd=1990%2C2019&to[TIME_PERIOD]=false&vw=tb 

Organisation for Economic Co‑operation and Development. (2022b). Global plastics outlook: Economic drivers, environmental impacts and policy options [Report]. OECD Publishing. Link to source: https://doi.org/10.1787/de747aef-en 

Pivnenko, K., Laner, D., & Astrup, T. F. (2016). Material cycles and chemicals: Dynamic material flow analysis of contaminants in paper recycling. Environmental Science & Technology, 50(22), 12302–12311. Link to source: https://doi.org/10.1021/acs.est.6b01791

Plastics Europe. (2022). Plastics – the facts 2022 [Report]. Link to source: https://plasticseurope.org/knowledge-hub/plastics-the-facts-2022/ 

Plastics Europe. (2023). Plastics – the fast facts 2023 [Infographic]. Link to source: https://plasticseurope.org/knowledge-hub/plastics-the-fast-facts-2023/ 

Plastics Europe. (2024a). Plastics – the fast facts 2024 [Infographic]. Link to source: https://plasticseurope.org/knowledge-hub/plastics-the-fast-facts-2024/ 

Plastics Europe. (2024b). The circular economy for plastics – A European analysis 2024 [Report]. Link to source: https://plasticseurope.org/knowledge-hub/the-circular-economy-for-plastics-a-european-analysis-2024/ 

Raabe, D., Tasan, C. C., & Olivetti, E. A. (2019). Strategies for improving the sustainability of structural metals. Nature575(7781), 64–74. Link to source: https://doi.org/10.1038/s41586-019-1702-5

Raabe, D., Ponge, D., Uggowitzer, P. J., Roscher, M., Paolantonio, M., Liu, C., Antrekowitsch, H., Kozeschnik, E., Seidmann, D., Gault, B., De Geuser, F., Deschamps, A., Hutchinson, C., Liu, C., Li, Z., Prangnell, P., Robson, J., Shanthraj, P., Vakili, S., … Pogatscher, S. (2022). Making sustainable aluminum by recycling scrap: The science of “dirty” alloys. Progress in Materials Science128, Article 100947. Link to source: https://doi.org/10.1016/j.pmatsci.2022.100947

Rajmohan, K. V. S., Ramya, C., Raja Viswanathan, M., & Varjani, S. (2019). Plastic pollutants: Effective waste management for pollution control and abatement. Current Opinion in Environmental Science & Health12, 72–84. Link to source: https://doi.org/10.1016/j.coesh.2019.08.006

Rigamonti, L., Taelman, S. E., Huysveld, S., Sfez, S., Ragaert, K., & Dewulf, J. (2020). A step forward in quantifying the substitutability of secondary materials in waste management life cycle assessment studies. Waste Management114, 331–340. Link to source: https://doi.org/10.1016/j.wasman.2020.07.015

Rissman, J., Bataille, C., Masanet, E., Aden, N., Morrow, W. R., Zhou, N., Elliott, N., Dell, R., Heeren, N., Huckestein, B., Cresko, J., Miller, S. A., Roy, J., Fennell, P., Cremmins, B., Koch Blank, T., Hone, D., Williams, E. D., de la Rue du Can, S., … Helseth, J. (2020). Technologies and policies to decarbonize global industry: Review and assessment of mitigation drivers through 2070. Applied Energy266, Article 114848. Link to source: https://doi.org/10.1016/j.apenergy.2020.114848

Singh, N., & Walker, T. R. (2024). Plastic recycling: A panacea or environmental pollution problem. npj Materials Sustainability, 2, Article 17. Link to source: https://doi.org/10.1038/s44296-024-00024-w

Sobhani, Z., & Palanisami, T. (2025). Emerging contaminants in organic recycling: Role of paper and pulp packaging. Resources, Conservation & Recycling, 215, Article 108070. Link to source: https://doi.org/10.1016/j.resconrec.2024.108070

Stegmann, P., Daioglou, V., Londo, M., van Vuuren, D. P., & Junginger, M. (2022). Plastic futures and their CO2 emissions. Nature612(7939), 272–276. Link to source: https://doi.org/10.1038/s41586-022-05422-5

Sun, M., Wang, Y., Shi, L., & Klemeš, J. J. (2018). Uncovering energy use, carbon emissions and environmental burdens of pulp and paper industry: A systematic review and meta-analysis. Renewable and Sustainable Energy Reviews92, 823–833. Link to source: https://doi.org/10.1016/j.rser.2018.04.036 

Uekert, T., Singh, A., DesVeaux, J. S., Ghosh, T., Bhatt, A., Yadav, G., Afzal, S., Walzberg, J., Knauer, K. M., Nicholson, S. R., Beckham, G. T., & Carpenter, A. C. (2023). Technical, economic, and environmental comparison of closed-loop recycling technologies for common plastics. ACS Sustainable Chemistry & Engineering11(3), 965–978. Link to source: https://doi.org/10.1021/acssuschemeng.2c05497

United Nations Environment Programme. (2024). Global waste management outlook 2024: Beyond an age of waste – Turning rubbish into a resource [Report]. United Nations Environment Programme & International Solid Waste Association. Link to source: https://www.unep.org/resources/global-waste-management-outlook-2024

United Nations Office on Drugs and Crime. (2023, April 4). Unwaste trendspotting alert no. 4: Paper and cardboard waste [Bulletin]. Link to source: https://www.unodc.org/res/environment-climate/asia-pacific/unwaste_html/Unwaste_Trendspotting_Alert_No.4.pdf

U.S. Geological Survey. (2021) Mineral commodity summaries 2021. Link to source: https://doi.org/10.3133/mcs2021 

U.S. Geological Survey. (2022). Iron and steel scrap. In Mineral commodity summaries 2022 (pp. 90–91). Link to source: https://doi.org/10.3133/mcs2022 

U.S. Environmental Protection Agency. (2016a). Environmental factoids [Archived]. U.S. Environmental Protection Agency WasteWise Program. Retrieved March 24, 2025, from Link to source: https://archive.epa.gov/epawaste/conserve/smm/wastewise/web/html/factoid.html 

U.S. Environmental Protection Agency. (2016b). Greenhouse gas inventory guidance: Direct emissions from stationary combustion sources. Link to source: https://www.epa.gov/sites/default/files/2016-03/documents/stationaryemissions_3_2016.pdf 

U.S. Environmental Protection Agency. (2025). Recycling basics and benefits. Retrieved September 2, 2025, from Link to source: https://www.epa.gov/recycle/recycling-basics-and-benefits 

Valenzuela-Levi, N., Araya-Córdova, P. J., Dávila, S., & Vásquez, Ó. C. (2021). Promoting adoption of recycling by municipalities in developing countries: Increasing or redistributing existing resources? Resources, Conservation and Recycling164, Article 105173. Link to source: https://doi.org/10.1016/j.resconrec.2020.105173

van Ewijk, S., Stegemann, J. A., & Ekins, P. (2021). Limited climate benefits of global recycling of pulp and paper. Nature Sustainability, 4(2), 180–187. Link to source: https://doi.org/10.1038/s41893-020-00624-z

van Ewijk, S., & Stegemann, J. A. (2023). Waste recycling. In An introduction to waste management and circular economy (pp. 217–254). UCL Press. Link to source: https://doi.org/10.14324/111.9781800084650

Waldrop, M. M. (2020, October 1). Recycling meets reality. Knowable Magazine. Link to source: https://knowablemagazine.org/content/article/food-environment/2020/recycling-meets-reality-feature

Watari, T., Fishman, T., Wieland, H., & Wiedenhofer, D. (2025). Global stagnation and regional variations in steel recycling. Resources, Conservation & Recycling, 220, Article 108363. Link to source: https://doi.org/10.1016/j.resconrec.2025.108363

Westbroek, C. D., Bitting, J., Craglia, M., Azevedo, J. M. C., & Cullen, J. M. (2021). Global material flow analysis of glass: From raw materials to end of life. Journal of Industrial Ecology25(2), 333–343. Link to source: https://doi.org/10.1111/jiec.13112

World Bank. (2018). What a waste global database: Country-level dataset (Last updated: 2024, June 4) [Data set]. Link to source: https://datacatalogfiles.worldbank.org/ddh-published/0039597/3/DR0049199/country_level_data.csv 

World Wildlife Fund. (2023). Who pays for plastic pollution? [Report]. Link to source: https://www.worldwildlife.org/documents/671/6lohrny0o2_ENGLISH_WWF_ENABLING_GLOBAL_EQUITY_WEBV.pdf 

Yang, H., Ma, M., Thompson, J. R., & Flower, R. J. (2018). Waste management, informal recycling, environmental pollution and public health. Journal of Epidemiology and Community Health72(3), 237–243. Link to source: https://doi.org/10.1136/jech-2016-208597

Yokoi, R., Watari, T., & Motoshita, M. (2022). Future greenhouse gas emissions from metal production: Gaps and opportunities towards climate goals. Energy & Environmental Science15(1), 146–157. Link to source: https://doi.org/10.1039/D1EE02165F

Yuan, X., Wang, J., Song, Q., & Xu, Z. (2024). Integrated assessment of economic benefits and environmental impact in waste glass closed‑loop recycling for promoting glass circularity. Journal of Cleaner Production444, Article 141155. https://doi.org/10.1016/j.jclepro.2024.141155

Zhang, X., Liu, C., Chen, Y., Zheng, G., & Chen, Y. (2022). Source separation, transportation, pretreatment, and valorization of municipal solid waste: A critical review. Environment, Development and Sustainability24(10), 11471–11513. Link to source: https://doi.org/10.1007/s10668-021-01932-w

Zheng, J., & Suh, S. (2019). Strategies to reduce the global carbon footprint of plastics. Nature Climate Change9(5), 374–378. Link to source: https://doi.org/10.1038/s41558-019-0459-z

Zhou, X., Zhang, H., Zheng, S., & Xing, W. (2022). The global recycling trade for twelve critical metals: Based on trade pattern and trade quality analysis. Sustainable Production and Consumption, 33, 831–845. Link to source: https://doi.org/10.1016/j.spc.2022.08.011

Zhu, X., Konik, J., & Kaufman, H. (2025). The knowns and unknowns in our understanding of how plastics impact climate change: A systematic review. Frontiers in Environmental Science13, Article 1563488. Link to source: https://doi.org/10.3389/fenvs.2025.1563488 

Zier, M., Stenzel, P., Kotzur, L., & Stolten, D. (2021). A review of decarbonization options for the glass industry. Energy Conversion and Management: X10, Article 100083. Link to source: https://doi.org/10.1016/j.ecmx.2021.100083

Credits

Lead Fellow

  • Nina-Francesca Farac, Ph.D.

Contributors

  • Ruthie Burrows, Ph.D.

  • James Gerber, Ph.D.

  • Daniel Jasper

  • Alex Sweeney

Internal Reviewers

  • Emily Cassidy

  • Megan Matthews, Ph.D.

  • Christina Swanson, Ph.D.

Effectiveness

We estimated recycling effectiveness as the net emissions savings from avoided primary manufacturing and landfilling, minus the emissions associated with recycling, as outlined in Equation 1 (see Climate Impact for more information on technical substitutability ratios [TSRs]). We included landfilling emissions only for materials that generate meaningful end-of-life GHG impacts. Paper and cardboard emit both biogenic CO₂ and methane emissions from anaerobic decomposition (Lee et al., 2017), and plastics contribute minor emissions from landfill handling due to their inert nature (Chamas et al., 2020; Zheng & Suh, 2019). Metals and glass are also considered inert and do not biodegrade. Their landfilling emissions are primarily from collection and transport, which fall outside the scope of this analysis.

left_text_column_width

Equation 1.

$$Effectiveness = ([Primary\ manufacturing_{emissions} \times TSR]\ + \ Landfilling_{emissions})\ - \ Recycling_{emissions}$$

Metals recycling has a high carbon abatement potential of 1,480,000 t CO₂‑eq /Mt metal waste recycled (1,650,000 t CO₂‑eq /Mt metal waste recycled, 20-year basis) (Table 1a). In our analysis, metal recycling emissions were about one-third of those from primary metal production. 

Paper and cardboard recycling has a similar carbon abatement potential of 1,000,000 t CO₂‑eq /Mt paper and cardboard waste recycled (1,000,000 t CO₂‑eq /Mt paper and cardboard waste recycled, 20-year basis) (Table 1b). Although recycling lowers fossil fuel use in pulping, our estimates showed only slightly lower emissions than primary manufacturing. In contrast, preventing CO₂ and methane release from decomposing paper in landfills have comparable emissions to primary paper production, making landfill diversion the larger climate impact.

Plastics recycling is the most effective of the four materials at reducing emissions, eliminating approximately 2,000,000 t CO₂‑eq /Mt plastic waste recycled (3,000,000 t CO₂‑eq /Mt plastic waste recycled, 20-year basis) (Table 1c). This is largely due to the high emissions intensity of virgin plastic production, which reached global production volumes of 374 Mt in 2023 (Plastics Europe, 2024a) and relies heavily on fossil fuels both as feedstocks and as energy sources for heat generation. While pellet-to-product conversion contributes to overall emissions, plastic pellet manufacturing accounts for most GHGs emitted in the plastic supply chain (Zhu et al., 2025). For studies without clearly defined boundaries, we assumed the reported emissions primarily reflected pellet production.

Glass recycling is the least effective at reducing emissions but still abates a meaningful amount at 79,000 t CO₂‑eq /Mt glass waste recycled (84,000 t CO₂‑eq /Mt glass waste recycled) (Table 1d). Emissions savings come from reduced fuel use in high-temperature melting furnaces and avoiding CO₂ release during the processing of raw materials (Baek et al., 2025).

While nitrous oxide is also released from fuel combustion during recycling of metals, paper and cardboard, plastics, and glass, it represents a small share of total CO₂‑eq emissions, so we considered it negligible (Diaz & Warith, 2006; U.S. EPA, 2016b).

left_text_column_width

Table 1. Effectiveness at reducing emissions.

Unit: t CO₂‑eq /Mt metal waste recycled, 100-yr basis

25th percentile 1,410,000
Mean 1,480,000
Median (50th percentile) 1,480,000
75th percentile 1,550,000

Unit: t CO₂‑eq /Mt paper and cardboard waste recycled, 100-yr basis

25th percentile 600,000
Mean 1,000,000
Median (50th percentile) 1,000,000
75th percentile 2,000,000

Unit: t CO₂‑eq /Mt plastic waste recycled, 100-yr basis

25th percentile 2,000,000
Mean 2,000,000
Median (50th percentile) 2,000,000
75th percentile 2,000,000

Unit: t CO₂‑eq /Mt glass waste recycled, 100-yr basis

25th percentile 58,000
Mean 79,000
Median (50th percentile) 79,000
75th percentile 100,000
Left Text Column Width
Cost

Emissions mitigation from recycling metals and paper and cardboard results in net cost savings, while plastics break even and glass remains cost-intensive. Initial capital costs for all four material recycling systems are higher than for landfilling, but operating costs are lower. Net landfilling costs are overall profitable for all four materials (see Increase Centralized Composting and Improve Landfill Management for more information on landfilling costs). While operational costs for recycling can vary based on the design and efficiency of MRFs, overall savings can result from reduced landfill tipping fees, lower disposal volume, and revenue from selling recovered materials. These economic factors are determined by energy savings, market demand, and materials-specific recovery efficiencies.

Metals recycling generates net net savings of US$200 million/Mt metal waste recycled, or US$100/t CO₂‑eq mitigated (Table 2a). In addition to significantly reduced energy use and raw material costs (DebRoy & Elmer, 2024), metals recycling delivers high-quality materials comparable to newly mined metals (Damgaard et al., 2009). This drives strong market demand, with revenues often covering – and in some cases exceeding – the costs of separation and/or reprocessing alone.

Paper and cardboard recycling has the highest net savings of the four recycling streams compared to landfilling, with US$400 million/Mt paper and cardboard waste recycled. Combining effectiveness with the net costs presented here, we estimated a savings per unit climate impact of US$400/t CO₂‑eq (Table 2b). This reflects the energy and resource efficiency of paper recycling, along with revenue generation from recovered paper sales (Bajpai, 2014).

Plastics recycling costs US$8 million/Mt less than landfilling, yielding a cost saving of US$4/t CO₂‑eq (Table 2c). However, plastics recycling shows the most variability, ranging from modest savings to higher costs than primary material production. Inexpensive virgin plastics, high contamination risk, complex sorting and reprocessing, and weak or volatile market value (Li et al., 2022) make recycling plastics economically challenging without supportive policies or subsidies.

Glass recycling has a net cost of US$700 million/Mt glass waste recycled and the highest cost per unit of climate impact (US$9,000/t CO₂‑eq , Table 2d). This is due to high processing costs, low market value for cullet (e.g., selling for a fraction of the recycling cost; Figure A1), and contamination that limits resale or reuse (Bogner et al., 2007; Ng & Phan, 2021; Olafasakin et al., 2023). Although glass recycling is costly, the societal and environmental benefits are far higher than those of landfilling (Colangelo, 2024).

Financial data were geographically limited. We based cost estimates on global reports with selected studies from India, Saudi Arabia, the United Kingdom, and the United States for landfilling and Canada, the European Union, Germany, Philippines, and the United States for recycling. Transportation and collection of recyclables can add notable costs to waste management, but we did not include them in this analysis. We calculated amortized net cost for landfilling and recycling by subtracting revenues from operating costs and amortized initial costs over a 30-year facility lifetime. Furthermore, revenues reflect market-based prices, which are subject to change based primarily on demand for recyclables.

left_text_column_width

Table 2. Cost per unit of climate impact.

Unit: 2023 US$/t CO₂‑eq , 100-yr basis

Median -100

Unit: 2023 US$/t CO₂‑eq , 100-yr basis

Median -400

Unit: 2023 US$/t CO₂‑eq , 100-yr basis

Median -4

Unit: 2023 US$/t CO₂‑eq , 100-yr basis

Median 9,000
Left Text Column Width
Learning Curve

We did not consider a learning curve for the Increase Recycling solution due to a lack of global data quantifying cost reductions specific to mechanical recycling technologies. Recycling systems use well-established processes that are already mature and widely deployed.

Recycling costs depend largely on regional factors, including material availability, market prices, infrastructure, and transportation distances. Consumer sorting habits and contamination rates also influence recycling performance and often outweigh potential learning-based cost decreases from technological improvements. Additionally, many mechanical recycling facilities operate near or at peak process efficiency, leaving little room for the technological upgrades that typically lower costs over time.

left_text_column_width
Speed of Action

Speed of action refers to how quickly a climate solution physically affects the atmosphere after it is deployed. This is different from speed of deployment, which is the pace at which solutions are adopted.

At Project Drawdown, we define the speed of action for each climate solution as emergency brake, gradual, or delayed.

Increase Recycling is a GRADUAL climate solution. It has a steady, linear impact on the atmosphere.

left_text_column_width
Caveats

Manufacturing emissions reductions due to recycling of metals, paper and cardboard, plastics, and glass are generally both permanent and additional, depending on local regulations and recycling practices. While recycling reduces the need for virgin production of raw materials and associated emissions, several caveats affect the extent of its climate benefits. 

Permanence

There is a low risk that the avoided emissions from increased recycling will be reversed in the next 100 years. Using recycled materials in place of newly extracted (virgin) resources avoids emissions from extraction, refining, and manufacturing. These reductions are considered permanent because the avoided activities occur to a lesser extent and fewer associated emissions are released. Recycling uses less energy and therefore reduces burning of fossil fuels and emits less GHGs. Avoided methane emissions from landfilled paper waste also has high permanence.

Additionality

Emissions reductions from increasing recycling are additional when improvements go beyond what would happen anyway under existing law or infrastructure. Increases in recycled rates, expansion to underdeveloped areas, and improvements in recycled material quality can result in additional climate benefits (Awino & Apitz, 2024; Halog & Anieke, 2021; Oo et al., 2024; Valenzuela-Levi et al., 2021). Efforts to enable or expand closed-loop recycling are also considered additional, especially for glass bottle recycling and in regions without this infrastructure.

Other Caveats

Material-specific limitations also apply. Material losses during product use and end-of-life processing limit metals recycling. Many metals are locked in products with long lifespans, difficult-to-separate designs, or technically unrecoverable applications, reducing availability for recycling (Ciacci et al., 2016; Guo et al., 2023). While improved recycling can decrease losses (Charpentier Poncelet et al., 2022), stagnant recycled metal inputs do not match growing metal demand (Watari et al., 2025).

Paper and cardboard can be recycled only five to seven times before fibers degrade beyond usability (Bajpai, 2014; Obradovic & Mishra, 2020), limiting long-term recyclability. Plastic recycling faces similar limits because many plastics degrade after a few cycles and mechanical processes are highly sensitive to contamination (Klotz et al., 2022; Klotz et al., 2023). For glass, downcycling is common due to quality control issues and variable regional demand for high-purity cullet. Van Ewijk et al. (2021) also emphasized that the benefits of paper recycling depend substantially on the carbon intensity of the energy used, highlighting the need to power recycling with low-carbon electricity.

left_text_column_width
Current Adoption

Worldwide, we estimated that metals are recycled at a rate of 740 Mt/yr (Table 3a). We based this on a study by Gorman et al. (2022), which reported that approximately 1,277 Mt of metals were produced globally in 2018 using recycled feedstocks. This value included all types of scrap metals: postconsumer, pre-consumer, and home scrap reused within factories. To isolate postconsumer recycling, we applied a 58% share based on data from the U.S. Geological Survey (USGS, 2022), which gives a typical breakdown of scrap types across major metals. While this ratio is U.S.-based, we used it as a global proxy due to limited international data. Our current adoption estimate accounts for processing losses, contamination, and quality limits that prevent a full 1:1 replacement of virgin metals (Gorman et al., 2022).

We estimated current paper and cardboard recycling at 160 Mt/yr, the median among two global datasets and one report (United Nations Office on Drugs and Crime [UNODC], 2023; Table 3b). The most recent global data were compiled in 2023 by the Food and Agriculture Organization of the United Nations ([FAO], n.d.), and an earlier dataset from a World Bank analysis from 174 countries in 2018 (World Bank, 2018). To estimate postconsumer recycled paper, we assumed a 75% share of total paper waste based on industry averages (European Paper Recycling Council, 2024).

Plastics are currently recycled at a rate of 35.9 Mt/yr, based on one global dataset (173 countries; World Bank, 2018), two reports, and one study (Table 3c). Plastics Europe (2024a, 2024b) provides data on global mechanically recycled (postconsumer) plastics production, derived from estimations and statistical projections. We assumed the share of postconsumer plastics from Houssini et al. (2025) and World Bank (2018) to be 100% because the vast majority of plastic waste appears to originate from postconsumer sources.

Glass has the lowest current recycling rate at 27 Mt/yr, calculated as the midpoint among one global dataset (168 countries; World Bank, 2018), two reviews (Delbari & Hof, 2024; Ferdous et al., 2021), and one report (Maximize Market Research Private Limited, 2025) (Table 3d). For values based on total waste generation, we used a global production-based recycling rate, which may underestimate actual glass waste recycling due to limited data on postconsumer glass waste.

Since the World Bank (2018) provided data on waste generation in metric tons per year, we applied global recycling rates of 59.3%, 9%, and 21% to the total waste generated for paper and cardboard, plastics, and glass, respectively (see Appendix for details).

left_text_column_width

Table 3. Current adoption level.

Unit: Mt recycled/yr, 2018

Estimate (Gorman et al., 2022) 740

Unit: Mt recycled/yr, 2023

25th percentile 150
Mean 160
Median (50th percentile) 160
75th percentile 180

Unit: Mt recycled/yr, 2023

25th percentile 31.2
Mean 32.0
Median (50th percentile) 35.9
75th percentile 36.6

Unit: Mt recycled/yr, 2020

25th percentile 24
Mean 24
Median (50th percentile) 27
75th percentile 27
Left Text Column Width
Adoption Trend

Postconsumer metals recycling has grown steadily in recent years (Table 4a, Figure 2). We used global data on secondary metals production from Gorman et al. (2022), a 39.1% share of recycled metals from the total addressable market (Gorman et al., 2022), and a 58% postconsumer scrap factor (USGS, 2022) to estimate the metals recycling adoption trend from 2014 to 2018. Annual adoption varies across this period. Taking the median annual change, we estimate a global adoption trend of 12 Mt/yr/yr, or 1.6% growth year-over-year (YoY). The mean annual change is estimated as 11 Mt/yr/yr, indicating consistent growth in the recovery of metals from end-of-life products.

Paper and cardboard recycling has gradually but inconsistently grown over the past two decades (Table 4b, Figure 2). Using worldwide recovered paper production data from the FAO (n.d.), we estimated the annual change in paper and cardboard waste recycled from 2003 to 2023. We applied a 75% factor to restrict this to postconsumer collection. While early years (2003–2016) in the data generally showed positive adoption, albeit with some fluctuations, more recent years (2017–2023) reflect declines, including noticeable drops in 2021–2022 (–1.9 Mt/yr/yr) and 2022–2023 (–5.4 Mt/yr/yr). The overall adoption trend is mixed despite a brief spike in 2020–2021. Taking the median annual change over the full 20-year period, we estimated a global trend of 2.2 Mt/yr/yr or a 1.3% YoY growth. The mean annual change is slightly higher at 2.8 Mt/yr/yr (2.0% YoY growth), indicating moderate but uneven progress in the recovery of paper and cardboard.

Plastics recycling is slowly increasing as a share of global plastic waste management, but the overall trend remains modest (Table 4c, Figure 2). We used data from the Organisation for Economic Co‑operation and Development ([OECD], 2022a) to estimate global adoption trends from 2000–2019 and supplemented this with 2019–2023 estimates from Plastics Europe (2022, 2023, 2024a). The adoption trend fluctuates from year to year, reflecting variability in collection rates, contamination levels, and recycling infrastructure. Taking the median annual change in recycled plastic waste across 23 years, we estimated a global adoption trend of 1.3 Mt/yr/yr, or 8.5% YoY growth. The mean annual change is slightly higher at 1.4 Mt/yr/yr, suggesting a slow growth in recycling capacity compared with plastic production volumes. However, this progress is uneven across geographies, with some countries expanding recycling systems while others face barriers, including limited infrastructure and low incentives for recovery.

Glass recycling showed a median annual change of 0 Mt/yr/yr and a mean of 0.8 Mt/yr/yr (3.7% growth YoY) from 2009–2019 (Table 4d, Figure 2). These estimates are based on Chen et al. (2020), who modeled World Bank data (Kaza et al., 2018) to generate a global dataset of waste treatment quantities across 217 countries. The apparent absence of change likely reflects limited availability of global data and inconsistent reporting rather than truly flat adoption. Although the dataset from Chen et al. (2020) is comprehensive, it is modeled rather than based on reported figures.

left_text_column_width

Table 4. Adoption trend.

Unit: Mt/yr/yr, 2014–2018

25th percentile 2.3
Mean 11
Median (50th percentile) 12
75th percentile 20

Unit: Mt/yr/yr, 2003–2023

25th percentile 0.15
Mean 2.8
Median (50th percentile) 2.2
75th percentile 5.9

Unit: Mt/yr/yr, 2000–2023

25th percentile 0.93
Mean 1.4
Median (50th percentile) 1.3
75th percentile 1.8

Unit: Mt/yr/yr, 2009–2019

25th percentile 0
Mean 0.8
Median (50th percentile) 0
75th percentile 0
Left Text Column Width

Figure 2. Trends in recycling adoption of metals (2014–2018), paper & cardboard (2003–2023), plastics (2000–2023), and glass (2009–2019). Adapted from Chen et al. (2020), FAO (n.d.), Gorman et al. (2022), OECD (2022a), and Plastics Europe (2022, 2023, 2024a).

Sources: Chen, D. M.-C., Bodirsky, B. L., Krueger, T., Mishra, A., & Popp, A. (2020). The world’s growing municipal solid waste: Trends and impacts. Environmental Research Letters15(7), Article 074021; Food and Agriculture Organization of the United Nations. (n.d.). FAO‑FAOSTAT: Forestry production and trade [Data set]. Retrieved April 25, 2025; Gorman, M. R., Dzombak, D. A., & Frischmann, C. (2022). Potential global GHG emissions reduction from increased adoption of metals recycling. Resources, Conservation and Recycling184, Article 106424; Organisation for Economic Co‑operation and Development. (2022a). Global plastics outlook database [Data set]; Plastics Europe. (2022). Plastics – the facts 2022 [Report]; Plastics Europe. (2023). Plastics – the fast facts 2023 [Infographic]; Plastics Europe. (2024a). Plastics – the fast facts 2024 [Infographic].

Enable Download
On
Adoption Ceiling

Metals recycling adoption is expected to remain high, with the global ceiling estimated at 2,100 Mt/yr (Table 5a). This corresponds to 68.2% of total projected metals production by 2050, based on the “maximum scenario” in Gorman et al. (2022). The scenario reflects a best-case technical potential of recycled metals adoption under full utilization of scrap feedstocks (Gorman et al., 2022). It assumes that all available postconsumer, pre-consumer, and home scrap can be recovered and can fully replace as much virgin material as possible using current technologies. We isolated the postconsumer portion as a 58% share of available metal scrap, as outlined in USGS (2022) data. 

There is also a strong potential for increased paper and cardboard recycling, with an estimated adoption ceiling of 360 Mt/yr (Table 5b). We assumed a recovery rate of 85% of total global paper production, accounting for practical limits imposed by fiber degradation, contamination, and processing inefficiencies. According to UNODC (2023), about 48% of paper globally is produced from recycled materials, leaving considerable room for improvement. The 85% ceiling also assumes that not all types of paper can be recovered (e.g., sanitary paper or heavily coated grades). Because this value is based on production rather than discarded paper waste, it may slightly underestimate the ceiling based on postconsumer waste generation. 

We estimated the adoption ceiling for plastics recycling at 180 Mt/yr (Table 5c). Technical barriers such as contamination, material heterogeneity, and plastic degradation constrain large-scale adoption. We therefore assumed and applied a 70% recycling rate to postconsumer plastic waste streams. We obtained similar estimates across multiple sources reporting global plastic waste generation (Houssini et al., 2025; OECD, 2022b; Stegmann et al., 2022). 

We estimated a ceiling of 100 Mt/yr for glass recycling (Table 5d) based on a 90% recovery rate from global waste generation estimates (Chen et al., 2020; Ferdous et al., 2021). Although glass is considered infinitely recyclable, losses due to contamination, sorting inefficiencies, and market constraints limit complete recovery. We included modeled estimates from Chen et al. (2020) to provide a more comprehensive global ceiling due to the scarcity of global data on glass recycling. 

For metals and paper and cardboard, values are derived from single datasets; for plastics, rounding across multiple datasets produced identical values across percentiles. Therefore, only the median is shown for these three subsolutions.

left_text_column_width

Table 5. Adoption ceiling.

Unit: Mt recycled/yr

Estimate (Gorman et al., 2022) 2,100

Unit: Mt recycled/yr

Estimate (UNODC, 2023) 360

Unit: Mt recycled/yr

Median (50th percentile) 180

Unit: Mt recycled/yr

25th percentile 94
Mean 100
Median (50th percentile) 100
75th percentile 110
Left Text Column Width
Achievable Adoption

For sources reporting global recycling rates or tonnage for all materials except metals, we define low and high achievable adoption as 25% or 50% increase in the most recently available material-specific recycle rate, respectively.

For metals recycling, achievable adoption is largely shaped by the dynamics of secondary metal production in global commodity markets, which in turn depends on the relative quantity of scrap available (Ciacci et al., 2016). We set achievable adoption at 1,300–1,400 Mt/yr by 2050 (Table 6a), based on the “plausible” and “ambitious” scenarios from Gorman et al. (2022), respectively. These estimates represent 41–48% of projected global metals production and incorporate both postconsumer and pre-consumer scrap, with the postconsumer share standardized at 58% across scenarios (USGS, 2022). Major commodity metals included in these estimates are steel, aluminum, copper, zinc, lead, iron, nickel, and manganese, which together represent more than 99% of all metal demand by mass from 2014–2018 (USGS, 2021). Material availability and infrastructure for downstream scrap processing remain key hurdles (Allwood et al., 2025), although industrial-scale recovery systems are already well established in many high-income countries (Campbell et al., 2022; de Sa & Korinek, 2021).

We estimated the achievable adoption range for paper and cardboard recycling at 220–260 Mt/yr (Table 6b), with an assumed postconsumer share of 75% applied to the total global recycling volumes reported by FAO (n.d.) and UNODC (2023). This range reflects expanded municipal collection, improvements in fiber separation technologies, and increased demand for recovered pulp in paper manufacturing. 

Plastics recycling has substantial opportunity for growth, given <10% global recycling rates and the exponential growth of plastic accumulation in the environment (Dokl et al., 2024; Nayanathara Thathsarani Pilapitiya & Ratnayake, 2024). A 25–50% increase in global mechanically recycled plastic volumes would bring the achievable range to 45–54 Mt/yr (Table 6c). While meaningful, these levels are 8–9 times smaller than the 414 Mt of plastic produced in 2023 (Plastics Europe, 2024a). Constraints include the complexity of sorting mixed plastic streams, limited market demand for lower-grade recycled pellets, and insufficient investment in complementary technologies such as chemical recycling, which remains below 0.5 Mt/yr.

For glass recycling, we set an achievable adoption range of 36–48 Mt/yr by 2050 (Table 6d), based on harmonized waste modeling and forward-looking estimates from Chen et al. (2020) and Delbari and Hof (2024). However, this scale-up depends substantially on reducing contamination at the collection stage, expanding color- and ceramic-sorting technologies, and improving closed-loop markets for container glass (Baek et al., 2025; Yuan et al., 2024).

left_text_column_width
Enable Download
Off

Table 6. Range of achievable adoption.

Unit: Mt recycled/yr

Current adoption 740
Achievable – low 1300
Achievable – high 1400
Adoption ceiling 2100

Unit: Mt recycled/yr

Current adoption 160
Achievable – low 220
Achievable – high 260
Adoption ceiling 360

Unit: Mt recycled/yr

Current adoption 36
Achievable – low 45
Achievable – high 54
Adoption ceiling 180

Unit: Mt recycled/yr

Current adoption 27
Achievable – low 36
Achievable – high 48
Adoption ceiling 100
Left Text Column Width

Increased recycling has strong potential for climate impact, especially in reducing emissions from virgin material production and landfilling waste (see Appendix for waste sector emissions). 

Metals recycling has the highest current and achievable GHG emissions savings of the four material categories (Table 7a). At a >500 Mt/yr current adoption rate, we estimate current metals recycling avoids 1.1 Gt CO₂‑eq/yr (1.2 Gt CO₂‑eq/yr, 20-year basis). Our low and high achievable adoption levels reduce 1.9 and 2.1 Gt CO₂‑eq/yr (2.1 and 2.4 Gt CO₂‑eq/yr, 20-year basis), respectively, with annual GHG reductions up to 3.1 Gt CO₂‑eq/yr (3.5 Gt CO₂‑eq/yr, 20-year basis) using the adoption ceiling. 

Paper and cardboard recycling currently avoids 0.16 Gt CO₂‑eq/yr (0.16 Gt CO₂‑eq/yr, 20-year basis) (Table 7b). Achievable GHG reduction is 0.22–0.26 Gt CO₂‑eq/yr (0.22–0.26 Gt CO₂‑eq/yr, 20-year basis), with a maximum potential of 0.36 Gt CO₂‑eq/yr (0.36 Gt CO₂‑eq/yr, 20-year basis).

Plastics recycling has a lower current climate impact of 0.07 Gt CO₂‑eq/yr (0.1 Gt CO₂‑eq/yr, 20-year basis), but it has the potential to increase to a ceiling matching that of recycling paper and cardboard (Table 7c). We estimated low and high achievable adoption levels avoid 0.09 and 0.1 Gt CO₂‑eq/yr (0.1 and 0.2 Gt CO₂‑eq/yr, 20-year basis), respectively, with GHG emissions savings of 0.4 Gt CO₂‑eq/yr (0.5 Gt CO₂‑eq/yr, 20-year basis) at the adoption ceiling. The 20-year impacts highlight the mitigated methane emissions associated with oil refining for virgin plastic production, with recycling plastics reducing both the need for petrochemical feedstocks and the volume of waste sent to landfills.

Glass recycling has the lowest current and achievable emissions reductions, avoiding 0.0021 Gt CO₂‑eq/yr (0.0023 Gt CO₂‑eq/yr, 20-year basis) with the potential to increase to 0.0028–0.0038 Gt CO₂‑eq/yr (0.0030–0.0041 Gt CO₂‑eq/yr, 20-year basis) under higher adoption (Table 7d). We estimated a maximum impact ceiling of 0.0079 Gt CO₂‑eq/yr (0.0084 Gt CO₂‑eq/yr, 20-year basis). Although emissions savings are relatively small, glass recycling is still worthwhile to benefit from cullet-driven energy reductions, conserve raw materials, and contribute to larger reductions when combined with other materials in municipal recycling programs.

left_text_column_width

Table 7. Climate impact at different levels of adoption.

Unit: Gt CO₂‑eq/yr, 100-year basis

Current adoption 1.1
Achievable – low 1.9
Achievable – high 2.1
Adoption ceiling 3.1

Unit: Gt CO₂‑eq/yr, 100-year basis

Current adoption 0.16
Achievable – low 0.22
Achievable – high 0.26
Adoption ceiling 0.36

Unit: Gt CO₂‑eq/yr, 100-year basis

Current adoption 0.07
Achievable – low 0.09
Achievable – high 0.1
Adoption ceiling 0.4

Unit: Gt CO₂‑eq/yr, 100-year basis

Current adoption 0.0021
Achievable – low 0.0028
Achievable – high 0.0038
Adoption ceiling 0.0079
Left Text Column Width

In our analysis, we adjusted emissions reductions from recycling using a TSR, since recycled materials often do not replace virgin materials on a 1:1 basis due to differences in quality, durability, or performance (Nordahl & Scown, 2024). To ensure we didn’t overestimate emissions savings, we applied an average material-specific ratio that adjusted the avoided emissions from primary material production. Recycled paper and cardboard and glass were assigned a ratio of 0.83; metals, 0.90; and plastics, 0.80 (Figure 3). These unitless ratios were based on technical literature (Barbato et al., 2024; Rigamonti et al., 2020; UNEP, 2024; Zheng & Suh, 2019) and were applied consistently across all emissions units for effectiveness.

left_text_column_width

Figure 3. Conceptual diagram of a general recycling loop for (a) metals, (b) paper & cardboard, (c) plastics, and (d) glass and how technical substitutability determines the maximum share of recycled content due to quality constraints. Graphics for (b), including the MRF and manufacturing plant for (a), (c), and (d), were modified from International Paper (n.d.). BioRender and Canva were used to make the remaining graphics.

Image
Recycling cycle diagram.

Source: International Paper. (n.d.). Paper’s life cycle: The recycling process [Infographic]. Retrieved June 10, 2025.

Enable Download
On
Additional Benefits

Income and Work

Recycling can create jobs and reduce energy costs. The National Institutes of Health (NIH) estimated that incinerating or landfilling 10 kt of waste creates one or six jobs respectively, while recycling the same amount of waste creates 36 jobs (NIH Environmental Management System [NEMS], n.d.). A case study in Florida found that increasing recycling rates can lead to small amounts of job growth, with most new jobs concentrated in the recycling processing sector (Liu et al., 2020). 

Using recycled materials can reduce the need for imports and support domestic manufacturing (Das et al., 2010; Dussaux & Glachant, 2019). The sale of products manufactured from recyclables instead of virgin materials can translate to economic benefits. A study of recycling systems in Nigeria found that the sale of recyclables could contribute about US$11.7 million to the country’s economy each year and create about 16,562 new jobs (Ayodele et al., 2018).  

Health

Materials in landfills can leach into the surrounding environment (McGinty, 2021). Plastics, along with associated additives such as bisphenol A and phthalates, can degrade into microplastics that enter the surrounding ecosystem and food chain, posing health risks to humans (Bauer et al., 2022; Li et al., 2022; Rajmohan et al., 2019; Zheng & Suh, 2019).

Equality

In low- and middle-income countries, informal recycling, which involves networks of individuals who sort through waste and sell or recycle it using informal methods, is a common form of waste management (Yang et al., 2018). Increasing recycling in these contexts could formalize this recycling method and improve some of the social and health equity concerns associated with informal recycling, such as exploitation, safety, child labor, and occupational health exposures, and may improve income-earning capabilities (Aparcana & Salhofer, 2013; Yang et al., 2018). Low- and middle-income countries typically face a disproportionate burden of plastic pollution, which could be improved by increasing recycling capacities globally (World Wildlife Fund [WWF], 2023). 

Land Resources

Recycling can benefit land resources and soil quality by reducing materials in landfills and incinerators and by reducing the need to extract virgin materials such as timber and minerals (Dussaux & Glachant, 2019; McGinty, 2021; U.S. EPA, 2025). Rajmohan et al. (2019) estimated that about 22–43% of plastic waste reaches landfills. Plastic waste can degrade into microplastics, leaching into surrounding ecosystems and reducing soil fertility (McGinty, 2021; Rajmohan et al., 2019). The environmental benefits of displacing the need for production using virgin materials through recycling may be more significant than reducing landfilling (Geyer et al., 2016). Recycling, along with the use of wood residues, is projected to reduce the demand for wood and fiber, easing pressures on land resources (FAO, 2009). 

Water Resources

Recycling can reduce the amount of water needed to produce new materials. For example, using recycled steel to make steel requires 40% less water than using virgin materials (NEMS, n.d.).

Air Quality

Increasing recycling reduces the amount of waste in landfills and incinerators and can reduce harmful pollution associated with landfilling and incineration (U.S. EPA, 2025). Additionally, recycling reduces the need to mine and process new materials, thereby reducing air pollution emitted during these processes (U.S. EPA, 2025).

left_text_column_width
Risks

Increasing metals recycling, paper and cardboard recycling, and plastics recycling can inadvertently increase environmental and human exposure to hazardous chemicals if not properly managed. Exposure to heavy metal fumes can occur while processing metal waste, and concealed pressurized or reactive items in scrap can cause fires or explosions. Chemical additives such as mineral oils and printing inks often persist throughout the paper life cycle and can migrate into the environment and food packaging, posing health risks such as chronic inflammation, endocrine disruption, and cancer (Pivnenko et al., 2016; Sobhani & Palanisami, 2025). Flame retardants, per- and polyfluoroalkyl substances, and other pollutants can leach from materials during and after plastics recycling. Microplastics accumulate at higher concentrations in recycled plastics and are released during all recycling stages (Monclús et al., 2025; Singh & Walker, 2024). Additionally, recycled papers and plastics contain unintentionally added substances, which carry different additives whose composition is often unknown (Monclús et al., 2025; Sobhani & Palanisami, 2025).

Increased plastics collection for recycling without global coordination can lead to disproportionate plastic pollution if high-income countries export plastic waste to low-income countries with inadequate recycling infrastructure (Singh & Walker, 2024).

When glass recycling is included in single-stream systems, glass shards can damage MRF machinery and contaminate other recyclable materials, decreasing their market value (Deer, 2021). Additionally, the heavy weight and fragility of glass means recycling trucks require multiple trips, consuming more fuel and increasing transportation costs. 

Another key risk is that materials collected for recycling may ultimately be landfilled when poor market conditions prevent their recovery. 

left_text_column_width
Interactions with Other Solutions

Reinforcing

All of these solutions can reuse clean and high-quality recycled materials as a raw material or feedstock or repurpose them as substitute materials in targeted uses. The embodied emissions from the recovered waste used as production or process inputs will be reduced, enhancing the solutions’ net climate impacts and supporting circularity.

left_text_column_width

Recycling paper and cardboard waste reduces deforestation required for extracting and processing primary raw materials.

left_text_column_width

Increased adoption of efficient mechanical recycling systems and equipment can improve the rate and cost of scaling similar highly-efficient, complementary technologies (e.g., chemical recycling). 

left_text_column_width

Competing

Diverting certain paper and cardboard types from landfills lowers methane emissions available to be captured and sold for biogas revenue. Paper and cardboard recycling also can reduce the amount of material that can be converted into biochar or compost.

left_text_column_width
Dashboard

Solution Basics

Mt recycled

t CO₂-eq (100-yr)/unit
01.41×10⁶1.48×10⁶
units/yr
Current 740 01,3001,400
Achievable (Low to High)

Climate Impact

Gt CO₂-eq (100-yr)/yr
Current 1.1 1.92.1
US$ per t CO₂-eq
-100
Gradual

CO₂ , CH₄

Solution Basics

Mt recycled

t CO₂-eq (100-yr)/unit
0600,0001.0×10⁶
units/yr
Current 160 0220260
Achievable (Low to High)

Climate Impact

Gt CO₂-eq (100-yr)/yr
Current 0.16 0.220.26
US$ per t CO₂-eq
-400
Gradual

CO₂ , CH₄

Solution Basics

Mt recycled

t CO₂-eq (100-yr)/unit
2.0×10⁶
units/yr
Current 35.9 04554
Achievable (Low to High)

Climate Impact

Gt CO₂-eq (100-yr)/yr
Current 0.07 0.090.1
US$ per t CO₂-eq
-4
Gradual

CO₂ , CH₄

Solution Basics

Mt recycled

t CO₂-eq (100-yr)/unit
058,00079,000
units/yr
Current 27 03648
Achievable (Low to High)

Climate Impact

Gt CO₂-eq (100-yr)/yr
Current 0.002 0.0030.004
US$ per t CO₂-eq
9,000
Gradual

CO₂ , CH₄

Trade-offs

Ciacci et al. (2016) and van Ewijk and Stegemann (2023) noted that as recycling approaches near-total recovery, energy consumption steeply rises, driven by increased decontamination efforts, sorting challenges, and diminished material quality. However, recycling rates are currently low enough that recycling is less carbon intense than primary material manufacturing.

The eventual quality degradation in secondary materials requires supplementation with virgin resources. However, overall embodied emissions are still lower than they would be for producing all-new materials. 

Glass recycling poses a trade-off between convenience and recycling efficiency in single-stream systems. Only 40% of glass is repurposed into new products, and the glass can contaminate other materials. Multi-stream or source-separated systems require more effort but achieve 90%-plus recycling rates (Berardocco et al., 2022; Deer, 2021).

Watari et al. (2025) noted that countries can achieve high local recycling rates and high recycled content by importing scrap metals from elsewhere, but with the trade-off that metal production emissions are offshored rather than reduced. This also introduces dependencies on international scrap flows and global supply chains (Guo et al., 2023), which can similarly occur for paper, cardboard, and plastics.

left_text_column_width
Action Word
Increase
Solution Title
Recycling
Classification
Highly Recommended
Lawmakers and Policymakers
  • Establish ambitious recycling goals; incorporate them into climate plans.
  • Ensure public procurement uses recycled materials or products as much as possible.
  • Consult with manufacturers, retailers, and the public to determine how best to design local recycling programs.
  • Empower citizen leaders to help manage MSW collection and recycling programs; ensure legal and regulatory structures clearly designate citizen and/or local control to avoid political disagreements and interference.
  • Use decision-making models and economic analysis tools to design MSW systems that incorporate aspects such as life-cycle assessments, material flows, cost/benefit analyses, environmental impact assessments, management systems, and assessments of immediate impacts on human well-being, especially in low-income and urban settings.
  • Ensure waste management systems and practices are appropriate for the local context and not just imported models from other countries.
  • Coordinate recycling efforts, policies, and budgets horizontally (e.g., across agencies) and vertically (e.g., across subnational, national, and international efforts), ensuring an inclusive process for local communities.
  • Use financial incentives that are appropriate for the local context such as subsidizing recycling plants, transportation, and pickup; offer tax exemptions and other incentives to low-income communities.
  • Use financial disincentives and taxes appropriate for the local context, such as landfilling fees, rent and/or property taxes, product fees, and collection fees included in utility bills or tied to waste quantity; ensure fees do not burden or stop low-income communities from recycling (possibly by tying collection fees to income bracket).
  • Invest in waste management infrastructure, including waste drop-off and buy-back centers, collection and separation facilities, roads and collection vehicles, education programs, community engagement mechanisms, and research and development for more efficient recycling techniques, behavioral change mechanisms, product design, and alternative materials.
  • Institute bans on landfilling recyclable (or compostable) materials; establish penalties for noncompliance.
  • Enact container deposit programs to encourage recycling and reuse.
  • Mandate standard shapes and color coding for waste bins to facilitate collection and separation.
  • Ban single-use plastics such as shopping bags and water bottles; ensure strong customs enforcement for imports.
  • Enact extended producer responsibility approaches that hold producers accountable for waste; set standards for the traceability of materials; require clear labeling for recyclable products.
  • Aim to eliminate government corruption behind illicit waste trade; create monitoring programs to hold waste managers accountable.
  • Incentivize or encourage waste management facilities to run on renewable energy and use electric fleets.
  • Incentivize or encourage manufacturers – including climate solution industries such as solar and wind producers – to use as much recycled materials as possible.
  • Require products made of metal, paper, plastic, or glass to contain a minimum percentage of recycled materials; ensure packaging producers meet recycling obligations potentially through the use of market-based mechanisms such as packaging waste recovery notes (PRNs) and/or packaging waste export recovery notes (PERNs).
  • Work to bring informal waste pickers into the formal MSW system by providing or advocating for training, protective gear, formal employment, free or low-cost childcare services, and other social benefits and purchasing separated recyclable waste.
  • Work with businesses and industries to develop consistent markets for recycled goods and stabilize the price of recycled materials.
  • Carefully enter into transparent public–private recycling partnerships, ensuring legal systems can enforce compliance with contractual terms.
  • Set collection fees, designate collection areas, and establish the amount of monitoring services at the municipal level rather than letting private companies do so.
  • Improve building codes and manufacturing regulations to require the use of recycled materials and material traceability; set standards for building and vehicle demolition to require the recovery of window glass and other recyclable materials.
  • Set recycling-facilitating regulations and standards for product disassembly.
  • Set standards that ease barriers for trading recycled goods and recyclable materials; halt the export of waste from rich countries to low- and middle-income countries; enforce trade standards and ensure illicit trade networks do not circumvent them.
  • Foster cooperation and technology transfers between low- and middle-income countries, avoiding models used in rich countries that are ill-suited for other contexts.
  • Deploy diverse means of engaging the public in recycling, such as volunteer groups, social activities, and musical trucks.
  • Create or improve training programs for waste management professionals that focus on practical skills and knowledge for working with communities to design and manage MSW systems.
  • Partner with schools, manufacturers, retailers, nonprofits, and other community organizations to promote recycling.
  • Establish programs that teach how to separate waste effectively, the waste hierarchy, and why these processes are important; incorporate these concepts into public school curricula.
Practitioners
  • Place recycling plants as close to points of waste generation as possible.
  • Consult with government officials, manufacturers, retailers, and the public to determine how best to design local recycling programs; utilize local data to inform planning, development, collection, and sorting techniques.
  • Support and cooperate with citizen leaders to help manage MSW collection and recycling programs.
  • Use decision-making models and economic analysis tools to design MSW systems that incorporate aspects such as life-cycle assessments, material flows, cost/benefit analyses, environmental impact assessments, management systems, and assessments of immediate impacts on human well-being, especially in low-income and urban settings.
  • Take advantage of financial incentives such as subsidies for recycling plant construction, transportation, and pickup; if none exist, advocate to policymakers for incentives.
  • Invest in waste management infrastructure, including waste drop-off and buy-back centers, collection and separation facilities, roads, collection vehicles, education programs, community engagement mechanisms, and research and development for more efficient recycling techniques, behavioral change mechanisms, product design, and alternatives to non-recyclable materials.
  • Use energy efficiency equipment and enhanced heat recovery techniques; install smart technology control systems.
  • Use electric equipment and renewable energy sources as much as possible.
  • Work with the renewable energy industry to ensure new solar photovoltaic panels and wind turbines utilize as much recycled materials as possible.
  • Work to bring informal waste pickers into the formal MSW system by providing or advocating for training, protective gear, formal employment, free or low-cost childcare services, and other social benefits and purchasing separated recyclable waste.
  • Work with policymakers, businesses, and industries to develop consistent markets for recycled goods and stabilize the price of recycled materials.
  • Deploy diverse means of engaging the public in recycling, such as volunteer groups, social activities, and musical trucks.
  • Create or improve training programs for waste management professionals that focus on practical skills and knowledge for working with communities to design and manage MSW systems.
  • Partner with schools, manufacturers, retailers, nonprofits, and other community organizations to promote recycling.
  • Establish programs that teach how to separate waste effectively, the waste hierarchy, and why these processes are important; incorporate these concepts into public school curricula.
Business Leaders
  • Use recycled materials in business operations as much as possible and ensure employees recycle.
  • Improve the quality of products, reduce material usage and product weight, and extend product life cycles through design that allows for easy reuse, repair, upgrading, recycling, and remanufacturing.
  • Work with industry peers to set design standards for common products that contain recycled materials.
  • Improve the traceability of materials used in products to enhance sorting efficiency.
  • Collect used products and reuse the materials for future production.
  • Advocate to policymakers for improved municipal recycling programs and support for integrating recycled products into your industry.
  • Provide financial assistance to employees for training in sustainable waste management, circular business models, and other related fields.
  • Create or join platforms that allow business-to-business collaboration to increase adoption of recycling and integration of recycled materials into products and business models.
  • Conduct market research on consumer demands and trends to identify potential markets for recycled materials.
  • Fund research or start-ups that aim to boost recycling in your industry.
  • Create, support, or join education campaigns and/or public-private partnerships that facilitate collaboration on recycling.
Nonprofit Leaders
  • Ensure procurement uses strategies to reduce waste and use recycled materials as much as possible.
  • Help administer local recycling programs; take advantage of financial incentives such as subsidies for recycling plants, transportation, and pickup; ensure services are provided to low-income communities.
  • Consult with government officials, manufacturers, retailers, and the public to determine how best to design local recycling programs.
  • Help recycling service providers navigate certification and permitting; help identify funding opportunities.
  • Help develop decision-making models and economic analyses for designing recycling systems, incorporating aspects such as life-cycle assessments, material flows, cost/benefit analyses, environmental impact assessments, management systems, and assessments of impacts on human well-being, especially in low-income and urban settings.
  • Improve data collection on employment figures in the waste and recycling sectors; work to capture labor statistics for informal waste pickers – especially, women and children involved in the sector that are not captured by current data.
  • Advocate for ambitious public recycling goals, including integration into local and national climate plans.
  • Advocate for international trade standards that ease barriers for trading in recycled goods and recyclable materials; seek to halt the practice of rich countries exporting waste to low- and middle-income countries; advocate for better enforcement of trade standards to ensure illicit trade networks do not circumvent these standards.
  • Create or improve training programs for waste management professionals that focus on practical skills and knowledge for working with communities to design and manage MSW systems.
  • Advocate for bans on discarding recyclable materials to landfills and penalties for noncompliance.
  • Establish or advocate for container deposit programs to encourage recycling and reuse.
  • Advocate for bans on single use plastics such as shopping bags and water bottles.
  • Advocate for extended producer responsibility approaches that hold producers accountable for waste; demand standards for traceability and labeling of materials in products to facilitate recycling.
  • Empower citizen leaders to help manage MSW collection and recycling programs; advocate for clear legal and regulatory structures to avoid political disagreements and interference.
  • Help safeguard against government corruption to avoid the illicit waste trade; create monitoring programs to hold waste management companies and/or leadership accountable.
  • Deploy diverse means of engaging the public in recycling, such as volunteer groups, social activities, and musical trucks.
  • Work to bring informal waste pickers into the formal MSW system by providing or advocating for training, protective gear, formal employment, free or low-cost childcare services, and other social benefits.
  • Help facilitate local cooperatives or other management structures for recycling programs; offer to purchase separated recyclable waste from waste pickers.
  • Work with businesses and industry to develop consistent markets for recycled goods and stabilize the price of recycled materials.
  • Partner with schools, manufacturers, retailers, nonprofits, and other community organizations to promote recycling.
  • Establish programs that teach how to separate waste effectively, the waste hierarchy, and why these processes are important; incorporate these concepts into public school curricula.
  • Create, support, or join education campaigns and/or public-private partnerships that facilitate collaboration on recycling.
Investors
  • Ensure portfolio companies and company procurement reduce waste, recycle, and use recycled materials at all stages of the supply chain.
  • Require portfolio companies to measure and report on waste, recycling rates, and use of recycled materials.
  • Provide low-interest loans to recycling service providers for start-up capital, improving efficiency, transitioning to renewable energy, and other development needs.
  • Invest in companies developing or modifying products to be compatible with a circular economy.
  • Fund start-ups that aim to improve sorting technologies, alternative packaging materials, energy efficiency of waste separation equipment, and other industry needs.
  • Offer financial services, notably rural financial market development, including low-interest loans, microfinancing, and grants, to support recycling initiatives.
  • Create, support, or join education campaigns and/or public-private partnerships that facilitate collaboration on recycling.
Philanthropists and International Aid Agencies
  • Ensure your organization’s procurement recycles and uses recycled materials as much as possible.
  • Help administer local recycling programs; take advantage of financial incentives such as subsidies for recycling plants, transportation, and pickup; ensure services are provided to low-income communities.
  • Foster cooperation and technology transfers between low- and middle-income countries, avoiding models used in rich countries that are ill-suited for other contexts.
  • Offer grants and loans to establish recycling projects, ensuring projects have sustainable means of generating income sources to maintain operations after grant or loan terms end.
  • Provide low-interest loans to recycling service providers for start-up capital, improving efficiency, transitioning to renewable energy, and other development needs.
  • Invest in companies developing or modifying products to be compatible with a circular economy.
  • Fund start-ups that aim to improve sorting technologies, alternative packaging materials, energy efficiency of waste separation equipment, and other industry needs.
  • Offer financial services, notably rural financial market development, including low-interest loans, microfinancing, and grants to support recycling initiatives.
  • Hold community consultations with government officials, manufacturers, retailers, and the public to determine how best to design local recycling programs.
  • Help recycling service providers navigate certification and permitting processes.
  • Help develop decision-making models and economic analyses for designing recycling systems, incorporating aspects such as life-cycle assessments, material flows, cost/benefit analyses, environmental impact assessments, management systems, and assessments of impacts on human well-being, especially in low-income and urban settings.
  • Improve data collection on employment figures in the waste and recycling sectors; work to capture labor statistics for informal waste pickers – especially, women and children involved in the sector that are not captured by current data.
  • Advocate for ambitious public recycling goals and for the goals to be integrated into local and national climate plans.
  • Advocate for international trade standards that ease barriers for trading in recycled goods and recyclable materials; seek to halt the practice of rich countries exporting waste to low- and middle-income countries; advocate for better enforcement of trade standards to ensure illicit trade networks do not circumvent these standards.
  • Create or improve training programs for waste management professionals that focus on practical skills and knowledge for working with communities to design and manage MSW systems.
  • Advocate for bans on discarding recyclable (or compostable) materials to landfills and penalties for noncompliance.
  • Establish or advocate for container deposit programs to encourage recycling and reuse.
  • Advocate for bans on single use plastics such as shopping bags and water bottles.
  • Advocate for extended producer responsibility approaches that hold producers accountable for waste; demand standards for the traceability and labeling of materials in products to facilitate the recycling process.
  • Empower citizen leaders to help manage MSW collection and recycling programs; advocate for clear legal and regulatory structures to avoid political disagreements and interference.
  • Help safeguard against government corruption to avoid the illicit waste trade; create monitoring programs to hold waste management companies and/or leadership accountable.
  • Deploy diverse means of engaging the public in recycling, such as volunteer groups, social activities, and musical trucks.
  • Work to bring informal waste pickers into the formal MSW system by providing or advocating for training, protective gear, formal employment, free or low-cost childcare services, and other social benefits.
  • Help facilitate local cooperatives or other management structures for recycling programs; offer to purchase separated recyclable waste from waste pickers.
  • Work with businesses and industry to develop consistent markets for recycled goods and to stabilize the price of recycled materials.
  • Partner with schools, manufacturers, retailers, nonprofits, and other community organizations to promote recycling.
  • Establish programs that teach how to separate waste effectively, the waste hierarchy, and why these processes are important; incorporate these concepts into public school curricula.
  • Create, support, or join education campaigns and/or public-private partnerships that facilitate collaboration on recycling.
Thought Leaders
  • Adopt recycling, share your experience, and inform your community how to effectively recycle in your area.
  • Consult with government officials, manufacturers, retailers, and the public to determine how best to design local recycling programs.
  • Help recyclers navigate certification and permitting; help identify funding opportunities.
  • Help develop decision-making models and economic analyses for designing recycling systems, incorporating aspects such as life-cycle assessments, material flows, cost/benefit analyses, environmental impact assessments, management systems, and assessments of impacts on human well-being, especially in low-income and urban settings.
  • Create ways of tracing materials and verifying recycled materials; explore the use of blockchain technology.
  • Conduct climate impact assessments of chemical recycling for plastics at an industrial scale; assess its feasibility to supplement mechanical recycling.
  • Improve data collection on employment figures in the waste and recycling sectors; work to capture labor statistics for informal waste pickers – especially, women and children involved in the sector that are not captured by current data.
  • Research and develop strategies for increasing recycling behavior.
  • Advocate for ambitious public recycling goals and for the goals to be integrated into local or national climate plans.
  • Advocate for international trade standards that ease barriers for trading in recycled goods and recyclable materials; seek to halt the practice of rich countries exporting waste to low- and middle-income countries (“waste dumping”); advocate for better enforcement of trade standards to ensure illicit trade networks do not circumvent these standards.
  • Create or improve training programs for waste management professionals that go into practical skills and knowledge for working with communities to design and manage MSW systems.
  • Advocate for bans on discarding recyclable (or compostable) materials to landfills and penalties for noncompliance.
  • Advocate for container deposit programs to encourage recycling and reuse.
  • Advocate for bans on single use plastics such as shopping bags and water bottles.
  • Advocate for extended producer responsibility approaches that hold producers accountable for waste; demand standards for the traceability and labeling of materials in products to facilitate the recycling process.
  • Empower citizen leadership to help manage MSW collection and recycling programs; advocate for clear legal and regulatory structures to avoid political disagreements and interference.
  • Help safeguard against government corruption to avoid the illicit waste trade; create monitoring programs to hold waste management companies and/or leadership accountable.
  • Deploy diverse means of engaging the public in recycling, such as volunteer groups, social activities, and musical trucks.
  • Work with businesses and industry to develop consistent markets for recycled goods and to stabilize the price of recycled materials.
  • Partner with schools, manufacturers, retailers, nonprofits, and other community organizations to promote recycling.
  • Establish programs that teach how to separate waste effectively, the waste hierarchy, and why these processes are important; incorporate these concepts into public school curricula.
  • Create, support, or join education campaigns and/or public-private partnerships that facilitate collaboration on recycling.
Technologists and Researchers
  • Improve the efficiency of waste separation machinery and develop low-cost, low-maintenance means of waste management – particularly for contexts such as low- and middle-income countries.
  • Improve collecting, sorting, and pre-treating processes to enhance recovery of materials while minimizing degradation and contamination.
  • Improve energy efficiency of equipment such as glass furnaces by enhancing heat recovery; design or improve smart technology control systems.
  • Explore the use of artificial intelligence in separating waste streams.
  • Explore, discover, or improve new uses for recycled or recovered materials.
  • Create ways of tracing materials and verifying recycled materials, such as blockchain technology.
  • Engineer means of reducing the weight of materials in common products such as packaging and glass without sacrificing recyclability or functionality.
  • Improve chemical recycling of plastics – particularly solvent-based purification and de-polymerization – while maintaining low energy consumption and high utilization rates for the remaining waste.
  • Assess the climate impact of industrial-scale chemical recycling of plastics and its feasibility to supplement mechanical recycling.
  • Advance systems for collecting, sorting, and recycling metals, plastics, and glass contained in electronic devices.
  • Improve means of removing ink and adhesives from paper.
  • Improve waste handling techniques and environmental safeguards for the sludge produced during paper recycling; design products using the sludge.
  • Enhance systems for sorting plastics.
  • Research ways to improve recycling or reusing agricultural, construction, and thermoset plastics; find means to recycle polymers such as PVC.
  • Increase the performance of metal-sensing and -sorting equipment such as X-ray detection or spectroscopy; improve means of detecting external impurities, especially in steel scrap.
  • Design recycle-friendly alloys that can be used in a variety of ways and products.
  • Improve technology for sorting colored glass and detecting ceramics.
  • Improve liquefaction technology for plastics to reduce costs, minimize upgrading needs, and produce higher quality products.
  • Research and develop strategies for increasing recycling behavior.
  • Collect up-to-date data on recycled materials - particularly, on glass recycling. 
Communities, Households, and Individuals
  • Participate in local recycling programs, share your experience with your community, and educate others on how to recycle in your area.
  • Practice conscious consumerism; buy only what’s needed and avoid products that use excessive packaging or have a short lifespan.
  • Form stakeholder groups to monitor and help administer local recycling systems.
  • Reuse products, packaging, and materials as much as possible before recycling or disposing of them.
  • Use your power as a consumer to influence businesses to adopt practices that increase recycling.
  • Participate in or advocate for consultations with government officials, manufacturers, retailers, and the public to determine how best to design local recycling programs.
  • Advocate for ambitious public recycling goals to be integrated into local or national climate plans.
  • Advocate for bans on discarding recyclable materials to landfills and penalties for noncompliance.
  • Establish or advocate for container deposit programs to encourage recycling and reuse.
  • Advocate for bans on single use plastics such as shopping bags and water bottles.
  • Advocate for extended producer responsibility approaches that hold producers accountable for waste; demand standards for the traceability and labeling of materials in products to facilitate recycling.
  • Help safeguard against government corruption to avoid the illicit waste trade; create community monitoring programs to hold waste management companies and/or leaders accountable.
  • Create, support, or join education campaigns and/or public-private partnerships that facilitate collaboration on recycling.
Sources
Evidence Base

Consensus of effectiveness of recycling as a climate solution: High 

Recycling reduces solid waste, mitigates GHG emissions from landfilled solid waste, and offers significant savings in electricity and fuel consumption (Cudjoe et al., 2021; Kaza et al., 2018; Uekert et al., 2023). UNEP (2024) estimated that 2.1 Gt of municipal solid waste was generated globally in 2020, and projected that to increase to 3.8 Gt by 2050 if action is not taken. Although postconsumer waste contributes ~5% to total global GHG emissions (Oo et al., 2024), around 30–37% of global waste ends up in landfills with only 19% recovered through recycling and composting processes (Kaza et al., 2018; UNEP, 2024).

Three extensive reviews of industrial decarbonization identify four technologies either ready for near-term deployment or already achieving material impact across global industries: electrification, material efficiency, energy efficiency, and circularity driven by increased reuse and recycling (Daehn et al., 2022; Gailani et al., 2024; Rissman et al., 2020). The last includes recovery of the four waste subcategories considered in this solution, where metals and plastics rank among the top six most-produced human-made materials globally (BioCubes, n.d.).

Incorporating recycled metal scraps into manufacturing consumes 30–95% less energy than producing metals from raw feedstocks, where the primary metal sector emits approximately 10% of global GHG emissions from energy-intensive mining, smelting, and refining (Yokoi et al., 2022). Reprocessing 1 t of plastic waste can save up to 130 GJ of energy (Singh & Walker, 2024), and secondary production of plastics with a ~40% global collection rate could mitigate 160 Mt CO₂ /yr in 2050 (Daehn et al., 2022). Glass recycling offers 2–3% energy savings and a 5% reduction in CO₂ emissions from furnace fuel combustion for every 10% increase in cullet content in the melting batch (Baek et al., 2025; Glass Packaging Institute, n.d.; Miserocchi et al., 2024). 

We reiterate that GHG savings from recycling are highly sensitive to assumptions such as material quality, contamination rates, transportation distances, and market conditions. These factors introduce uncertainty because recycling benefits can vary depending on the efficiency of recycling systems in practice and market viability.

The results presented in this document summarize findings from 18 reports, 22 reviews and meta-analyses, 41 original studies, nine perspectives, two books, five web articles, and three datasets reflecting the most recent evidence for more than 200 countries. 

left_text_column_width
Appendix

Market Revenue Variability of Recyclables

left_text_column_width

Figure A1. The % revenue from recyclables compared to the % mass of each recyclable processed in an MRF. Values pertain to 2021.

Source: Bradshaw, S. L., Aguirre-Villegas, H. A., Boxman, S. E., & Benson, C. H. (2025). Material recovery facilities (MRFs) in the United States: Operations, revenue, and the impact of scale. Waste Management193, 317–327.

Enable Download
On

Current Adoption

In addition to applying global recycling rates of 59.3%, 9%, and 21% to the total waste generated for paper and cardboard, plastics, and glass, respectively (World Bank, 2018; Table A1), we also calculated total tonnage recycled using reported recycling percentages and total MSW tonnage for each country. Combined recycled percentages were consistently lower than the total combined percentage of metal, paper and cardboard, plastic, and glass waste in MSW. This indicates ample opportunity for increased recycling, even in regions where it is already well established. 

left_text_column_width

Table A1. Global recycling rates for each of the waste materials analyzed in this solution.

Waste material Global recycling rate (%) Reference
Metals 76a Charpentier Poncelet et al. (2022)
Paper and cardboard 59.3b European Paper Recycling Council (2020)
Plastics 9c OECD (2022b)
Glass 21d Ferdous et al. (2021)
Westbroek et al. (2021)

aEstimated using end-of-life recycling rates from Charpentier Poncelet et al. (2022), weighted by average annual global production for aluminum, copper, zinc, lead, iron, nickel, and manganese 2015–2019. We normalized weights against total metal production (1,619 Mt) to reflect each metal’s contribution to global scrap availability. This approach reflects the dominance of aluminum and iron in global scrap flows.

bBased on the average global paper recycling rate in 2018.

cBased on the global plastic recycling rate in 2019.

dBased on total glass produced in 2018 (a production-based recycling rate, meaning the share of recycled cullet used in total glass production), rather than on total glass waste generated (a waste-based recycling rate). We used this value due to a lack of consistent global data on postconsumer (end-of-life, old scrap) glass waste generation, although it may underestimate the recycling rate of actual discarded glass.

Left Text Column Width

Achievable Adoption

The World Bank (2018) also provided country-specific recycling rates and waste composition fractions of MSW for the materials we considered. Metals, paper and cardboard, plastics, and glass were reported as percentages of MSW by 169, 174, 173, and 168 countries, respectively. However, only 125 countries reported recycling rates, and these rates reflect combined MSW rather than material-specific recovery, so the dataset could not be used to estimate achievable adoption ranges for individual materials. 

Example Calculation of Achievable Adoption

For low achievable adoption, we assumed global recycling increases by 25% of the existing or most recently available rates or total recycled waste tonnage (i.e., recycling volumes) for all four materials except metals. For example, Delbari and Hof (2024) reported 2018 estimates of global glass recycling volumes at 27 Mt annually, so the Adoption – Low recycling rate was calculated at 34 Mt of glass waste recycled/yr. 

For high achievable adoption, we assume that global recycling rates increase by 50% of the existing or most recently available rates or total recycled waste tonnage (i.e., recycling volumes) for all four materials except metals. As an example, Houssini et al. (2025) reported global plastic production in 2022, from which 38 Mt were generated as secondary plastics from plastic mechanical recycling. Therefore, the high adoption recycling rate came out to 57 Mt of plastic waste recycled/yr.

Waste Sector Emissions

According to estimates by Ferdous et al. (2021), Ge et al. (2024), and Oo et al. (2024), the waste sector is responsible for 3.4–5% of total global GHG emissions, with solid waste management of landfills accounting for roughly two-thirds (Ge et al., 2024). In view of this and the energy-intensive production of raw materials, consistently improving recycling efficiency and rates can meaningfully mitigate the world’s carbon output.

left_text_column_width

Sources

Bradshaw, S. L., Aguirre-Villegas, H. A., Boxman, S. E., & Benson, C. H. (2025). Material recovery facilities (MRFs) in the United States: Operations, revenue, and the impact of scale. Waste Management193, 317–327. https://doi.org/10.1016/j.wasman.2024.12.008

Charpentier Poncelet, A., Helbig, C., Loubet, P., Beylot, A., Muller, S., Villeneuve, J., Laratte, B., Thorenz, A., Tuma, A., & Sonnemann, G. (2022). Losses and lifetimes of metals in the economy. Nature Sustainability5(8), 717–726. https://doi.org/10.1038/s41893-022-00895-8

Delbari, S. A., & Hof, L. A. (2024). Glass waste circular economy—Advancing to high-value glass sheets recovery using industry 4.0 and 5.0 technologies. Journal of Cleaner Production462, Article 142629. https://doi.org/10.1016/j.jclepro.2024.142629

European Paper Recycling Council. (2020). European declaration on paper recycling 2016-2020: Monitoring report 2019. Confederation of European Paper Industries. https://www.cepi.org/wp-content/uploads/2020/10/EPRC-Monitoring-Report_2019.pdf 

Ferdous, W., Manalo, A., Siddique, R., Mendis, P., Zhuge, Y., Wong, H. S., Lokuge, W., Aravinthan, T., & Schubel, P. (2021). Recycling of landfill wastes (tyres, plastics and glass) in construction – A review on global waste generation, performance, application and future opportunities. Resources, Conservation and Recycling173, Article 105745. https://doi.org/10.1016/j.resconrec.2021.105745

Ge, M., Friedrich, J., & Vigna, L. (2024, December 5). Where do emissions come from? 4 charts explain greenhouse gas emissions by sector. World Resources Institute. https://www.wri.org/insights/4-charts-explain-greenhouse-gas-emissions-countries-and-sectors

Houssini, K., Li, J., & Tan, Q. (2025). Complexities of the global plastics supply chain revealed in a trade-linked material flow analysis. Communications Earth & Environment6(1), Article 257. https://doi.org/10.1038/s43247-025-02169-5

Oo, P. Z., Prapaspongsa, T., Strezov, V., Huda, N., Oshita, K., Takaoka, M., Ren, J., Halog, A., & Gheewala, S. H. (2024). The role of global waste management and circular economy towards carbon neutrality. Sustainable Production and Consumption52, 498–510. https://doi.org/10.1016/j.spc.2024.11.021

Organisation for Economic Co‑operation and Development. (2022b). Global plastics outlook: Economic drivers, environmental impacts and policy options [Report]. OECD Publishing. https://doi.org/10.1787/de747aef-en 

Westbroek, C. D., Bitting, J., Craglia, M., Azevedo, J. M. C., & Cullen, J. M. (2021). Global material flow analysis of glass: From raw materials to end of life. Journal of Industrial Ecology25(2), 333–343. https://doi.org/10.1111/jiec.13112

World Bank. (2018). What a waste global database: Country-level dataset (Last updated: 2024, June 4) [Data set]. https://datacatalogfiles.worldbank.org/ddh-published/0039597/3/DR0049199/country_level_data.csv

left_text_column_width
Updated Date

Increase Centralized Composting

Image
Image
Centralized composting facility
Coming Soon
Off
Summary

A composting system diverts organic waste (OW) from landfills, reducing the production of methane and other GHG emissions. OW is defined as the combination of food waste and green waste, composed of yard and garden trimmings. Composting transforms it into a nutrient-rich soil supplement.

Our focus is on centralized (city- or regional-level) composting systems for the OW components of municipal solid waste (MSW). Decentralized (home- and community-level) and on-farm composting are also valuable climate actions, but are not included here due to limited data availability at the global level (see Increase Decentralized Composting).

Description for Social and Search
Increase Centralized Composting reduces methane and other GHG emissions by diverting organic waste from landfills to facilities that turn it into soil supplements.
Overview

There are many stages involved in a composting system to convert organic MSW into finished compost that can be used to improve soil health (Figure 1). Within this system, composting is the biochemical process that transforms OW into a soil amendment rich in nutrients and organic matter. 

Figure 1. Stages of a composting system. Solution boundaries exclude activities upstream and downstream of centralized MSW composting such as waste collection and compost application. Modified from Kawai et al. (2020) and Manea et al. (2024).

Image
Diagram demonstrating process steps for landfill and compost materials.

Sources: Kawai, K., Liu, C., & Gamaralalage, P. J. D. (2020). CCET guideline series on intermediate municipal solid waste treatment technologies: Composting. United Nations Environment Programme; Manea, E. E., Bumbac, C., Dinu, L. R., Bumbac, M., & Nicolescu, C. M. (2024). Composting as a sustainable solution for organic solid waste management: Current practices and potential improvements.  Sustainability16(15), Article 6329.

The composting process is based on aerobic decomposition, driven by complex interactions among microorganisms, biodegradable materials, and invertebrates and mediated by water and oxygen (see the Appendix). Without the proper balance of oxygen and water, anaerobic decomposition occurs, leading to higher methane emissions during the composting process (Amuah et al., 2022; Manea et al., 2024). Multiple composting methods can be used depending on the amounts and composition of OW feedstocks, land availability, labor availability, finances, policy landscapes, and geography. Some common methods include windrow composting, bay or bin systems, and aerated static piles (Figure 2; Amuah et al., 2022; Ayilara et al., 2020; Cao et al., 2023).

Figure 2. Examples of commonly used centralized composting methods. Bay systems (left) move organics between different bays at different stages of the composting process. Windrows (center) are long, narrow piles that are often turned using large machinery. Aerated static piles (right) can be passively aerated as shown here or actively aerated with specialized blowing equipment.

Image
Decentralized composting examples

Credit: Bays, iStock | nikolay100; Windrows, iStock | Jeremy Christensen; Aerated static pile, iStock | AscentXmedia

Centralized composting generally refers to processing large quantities (>90 t/week) of organic MSW (Platt, 2017). Local governments often manage centralized composting as part of an integrated waste management system that can also include recycling non-OW, processing OW anaerobically in methane digesters, landfilling, and incineration (Kaza et al., 2018). 

Organic components of MSW include food waste and garden and yard trimmings (Figure 2). In most countries and territories, these make up 40–70% of MSW, with food waste as the largest contribution (Ayilara et al., 2020; Cao et al., 2023; Food and Agriculture Organization [FAO], 2019; Kaza et al., 2018; Manea et al., 2024; U.S. Environmental Protection Agency [U.S. EPA], 2020; U.S. EPA, 2023). 

Diverting OW, particularly food waste, from landfill disposal to composting reduces GHG emissions (Ayilara et al., 2020; Cao et al., 2023; FAO, 2019). Diversion of organics from incineration could also have emissions and pollution reduction benefits, but we did not include incineration as a baseline disposal method for comparison since it is predominantly used in high-capacity and higher resourced countries and contributes less than 1% to annual waste-sector emissions (Intergovernmental Panel On Climate Change [IPCC], 2023; Kaza et al., 2018). 

Disposal of waste in landfills leads to methane emissions estimated at nearly 1.9 Gt CO₂‑eq (100-yr basis) annually (International Energy Agency [IEA], 2024). Landfill emissions come from anaerobic decomposition of inorganic waste and OW and are primarily methane with smaller contributions from ammonia, nitrous oxide, and CO₂ (Cao et al., 2023; Kawai et al., 2020; Manea et al., 2024). Although CO₂, methane, and nitrous oxide are released during composting, methane emissions are up to two orders of magnitude lower than emissions from landfilling for each metric ton of waste (Ayilara et al., 2020; Cao et al, 2023; FAO, 2019; IEA, 2024; Nordahl et al., 2023; Perez et al., 2023). GHG emissions can be minimized by fine-tuning the nutrient balance during composting. 

Depending on the specifics of the composting method used, the full transformation from initial feedstocks to finished compost can take weeks or months (Amuah et al., 2022; Manea et al., 2024; Perez et al., 2023). Finished compost can be sold and used in a variety of ways, including application to agricultural lands and green spaces as well as for soil remediation (Gilbert et al., 2020; Platt et al., 2022; Ricci-Jürgensen et al., 2020a; Sánchez et al., 2025). 

Abedin, T., Pasupuleti, J., Paw, J.K.S., Tak, Y. C., Islam, M. R., Basher, M. K., & Nur-E-Alam, M. (2025). From waste to worth: Advances in energy recovery technologies for solid waste management. Clean Technologies and Environmental Policy27, 5963–5989. Link to source: https://doi.org/10.1007/s10098-025-03204-x

Alves Comesaña, D., Villar Comesaña, I., & Mato de la Iglesia, S. (2024). Community composting strategies for biowaste treatment: Methodology, bulking agent and compost quality. Environmental Science and Pollution Research, 31(7), 9873–9885. Link to source: https://doi.org/10.1007/s11356-023-25564-x 

Amuah, E. E. Y., Fei-Baffoe, B., Sackey, L. N. A., Douti, N. B., & Kazapoe, R. W. (2022). A review of the principles of composting: Understanding the processes, methods, merits, and demerits. Organic Agriculture12(4), 547–562. Link to source: https://doi.org/10.1007/s13165-022-00408-z

Ayilara, M., Olanrewaju, O., Babalola, O., & Odeyemi, O. (2020). Waste management through composting: Challenges and potentials. Sustainability12(11), Article 4456. Link to source: https://doi.org/10.3390/su12114456

Bekchanov, M., & Mirzabaev, A. (2018). Circular economy of composting in Sri Lanka: Opportunities and challenges for reducing waste related pollution and improving soil health. Journal of Cleaner Production202, 1107–1119. Link to source: https://doi.org/10.1016/j.jclepro.2018.08.186

Bell, B., & Platt, B. (2014). Building healthy soils with compost to protect watersheds. Institute for Local Self-Reliance. Link to source: https://ilsr.org/wp-content/uploads/2013/05/Compost-Builds-Healthy-Soils-ILSR-5-08-13-2.pdf 

Brown, S. (2015, July 14). Connections: YIMBY. Biocycle. Link to source: https://www.biocycle.net/connections-yimby/

Cai, B., Lou, Z., Wang, J., Geng, Y., Sarkis, J., Liu, J., & Gao, Q. (2018). CH4 mitigation potentials from China landfills and related environmental co-benefits. Science Advances4(7), Article eaar8400. Link to source: https://doi.org/10.1126/sciadv.aar8400

Cao, X., Williams, P. N., Zhan, Y., Coughlin, S. A., McGrath, J. W., Chin, J. P., & Xu, Y. (2023). Municipal solid waste compost: Global trends and biogeochemical cycling. Soil & Environmental Health1(4), Article 100038. Link to source: https://doi.org/10.1016/j.seh.2023.100038

Casey, J. A., Cushing, L., Depsky, N., & Morello-Frosch, R. (2021). Climate justice and California’s methane superemitters: Environmental equity Assessment of community proximity and exposure intensity. Environmental Science & Technology55(21), 14746–14757. Link to source: https://doi.org/10.1021/acs.est.1c04328

Coker, C. (2020, March 3). Composting business management: Revenue forecasts for composters. Biocycle. Link to source: https://www.biocycle.net/composting-business-management-revenue-forecasts-composters/

Coker, C. (2020, March 10). Composting business management: Capital cost of composting facility construction. Biocycle. Link to source: https://www.biocycle.net/composting-business-management-capital-cost-composting-facility-construction/

Coker, C. (2020, March 17). Composting business management: Composting facility operating cost estimates. Biocycle. Link to source: https://www.biocycle.net/composting-business-management-composting-facility-operating-cost-estimates/ 

Coker, C. (2022, August 23). Compost facility planning: Composting facility approvals and permits. Biocycle. Link to source: https://www.biocycle.net/composting-facility-approval-permits/

Coker, C. (2022, September 27). Compost facility planning: Composting facility cost estimates. Biocycle. Link to source: https://www.biocycle.net/compost-facility-planning-cost/

Coker, C. (2024, August 20). Compost market development. Biocycle. Link to source: https://www.biocycle.net/compost-market-development/

European Energy Agency. (2024). Greenhouse gas emissions by source sector. (Last Updated: April 18, 2024). Eurostat. [Data set and codebook]. Link to source: https://ec.europa.eu/eurostat/databrowser/view/env_air_gge__custom_16006716/default/table 

Farhidi, F., Madani, K., & Crichton, R. (2022). How the US economy and environment can both benefit from composting management. Environmental Health Insights16. Link to source: https://doi.org/10.1177/11786302221128454

Food and Agriculture Organization of the United Nations. (2024). The state of food and agriculture 2024 – Value-driven transformation of agrifood systems. Link to source: https://doi.org/10.4060/cd2616en

Finlay, K. (2024). Turning down the heat: how the U.S. EPA can fight climate change by cutting landfill emissions. Industrious Labs. Link to source: https://cdn.sanity.io/files/xdjws328/production/657706be7f29a20fe54692a03dbedce8809721e8.pdf

Global Alliance for Incinerator Alternatives. (2019). Pollution and health impacts of waste-to-energy incineration [Fact sheet]. Link to source: https://www.cms.gov/newsroom/fact-sheets/delivering-service-school-based-settings-comprehensive-guide-medicaid-services-and-administrative

González, D., Barrena, R., Moral-Vico, J., Irigoyen, I., & Sánchez, A. (2024). Addressing the gaseous and odour emissions gap in decentralised biowaste community composting. Waste Management178, 231–238. Link to source: https://doi.org/10.1016/j.wasman.2024.02.042 

International Energy Agency. (2024), Global Methane Tracker 2024. Link to source: https://www.iea.org/reports/global-methane-tracker-2024

Intergovernmental Panel On Climate Change. (2023). Climate change 2022 – Impacts, adaptation and vulnerability: Working Group II contribution to the sixth assessment report of the Intergovernmental Panel on Climate Change (1st ed.). Cambridge University Press. Link to source: https://doi.org/10.1017/9781009325844

Intergovernmental Panel On Climate Change. (2019). 2019 Refinement to the 2006 IPCC Guidelines for National Greenhouse Gas Inventories, Calvo. Buendia, E., Tanabe, K., Kranjc, A., Baasansuren, J., Fukuda, M., Ngarize S., Osako, A., Pyrozhenko, Y., Shermanau, P. and Federici, S. (eds). Link to source: https://www.ipcc-nggip.iges.or.jp/public/2019rf/index.html 

Jamroz, E., Bekier, J., Medynska-Juraszek, A., Kaluza-Haladyn, A., Cwielag-Piasecka, I., & Bednik, M. (2020). The contribution of water extractable forms of plant nutrients to evaluate MSW compost maturity: A case study. Scientific Reports10(1), Article 12842. Link to source: https://doi.org/10.1038/s41598-020-69860-9

Kawai, K., Liu, C., & Gamaralalage, P. J. D. (2020). CCET guideline series on intermediate municipal solid waste treatment technologies: Composting. United Nations Environment Programme. Link to source: https://www.unep.org/ietc/resources/publication/ccet-guideline-series-intermediate-municipal-solid-waste-treatment

Kaza, S., Yao, L. C., Bhada-Tata, P., Van Woerden, F., (2018). What a waste 2.0: A global snapshot of solid waste management to 2050. Urban Development. World Bank. Link to source: http://hdl.handle.net/10986/30317 

Krause, M., Kenny, S., Stephenson, J., & Singleton, A. (2023). Quantifying methane emissions from landfilled food waste (Report No. EPA-600-R-23-064). U.S. Environmental Protection Agency Office of Research and Development. Link to source: https://www.epa.gov/system/files/documents/2023-10/food-waste-landfill-methane-10-8-23-final_508-compliant.pdf 

Liu, K-. M., Lin, S-. H., Hsieh, J-., C., Tzeng, G-., H. (2018). Improving the food waste composting facilities site selection for sustainable development using a hybrid modified MADM model. Waste Management75, 44–59. Link to source: https://doi.org/10.1016/j.wasman.2018.02.017

Liu, H., Zhang, X., & Hong, Q. (2021). Emission characteristics of pollution gases from the combustion of food waste. Energies14(19), Article 6439. Link to source: https://doi.org/10.3390/en14196439

Maalouf, A., & Agamuthu, P. (2023). Waste management evolution in the last five decades in developing countries – A review. Waste Management & Research: The Journal for a Sustainable Circular Economy41(9), 1420–1434. Link to source: https://doi.org/10.1177/0734242X231160099

Manea, E. E., Bumbac, C., Dinu, L. R., Bumbac, M., & Nicolescu, C. M. (2024). Composting as a sustainable solution for organic solid waste management: Current practices and potential improvements. Sustainability16(15), Article 6329. Link to source: https://doi.org/10.3390/su16156329

Martínez-Blanco, J., Lazcano, C., Christensen, T. H., Muñoz, P., Rieradevall, J., Møller, J., Antón, A., & Boldrin, A. (2013). Compost benefits for agriculture evaluated by life cycle assessment. A review. Agronomy for Sustainable Development33(4), 721–732. Link to source: https://doi.org/10.1007/s13593-013-0148-7

Martuzzi, M., Mitis, F., & Forastiere, F. (2010). Inequalities, inequities, environmental justice in waste management and health. The European Journal of Public Health20(1), 21–26. Link to source: https://doi.org/10.1093/eurpub/ckp216

Nordahl, S. L., Devkota, J. P., Amirebrahimi, J., Smith, S. J., Breunig, H. M., Preble, C. V., Satchwell, A. J., Jin, L., Brown, N. J., Kirchstetter, T. W., & Scown, C. D. (2020). Life-Cycle greenhouse gas emissions and human health trade-offs of organic waste management strategies. Environmental Science & Technology54(15), 9200–9209. Link to source: https://doi.org/10.1021/acs.est.0c00364 

Nordahl, S. L., Preble, C. V., Kirchstetter, T. W., & Scown, C. D. (2023). Greenhouse gas and air pollutant emissions from composting. Environmental Science & Technology57(6), 2235–2247. Link to source: https://doi.org/10.1021/acs.est.2c05846 

Nubi, O., Murphy, R., & Morse, S. (2024). Life cycle sustainability assessment of waste to energy systems in the developing world: A review. Environments11(6), 123. Link to source: https://doi.org/10.3390/environments11060123

Organisation for Economic Co-operation and Development. (2021). Waste - Municipal waste: generation and treatment. (Downloaded: March 20, 2025) [Data set]. Link to source: https://data-explorer.oecd.org/vis?lc=en&df[ds]=dsDisseminateFinalDMZ&df[id]=DSD_MUNW%40DF_MUNW&df[ag]=OECD.ENV.EPI&dq=.A.INCINERATION_WITHOUT%2BLANDFILL.T&pd=2014%2C&to[TIME_PERIOD]=false&vw=ov 

Pérez, T., Vergara, S. E., & Silver, W. L. (2023). Assessing the climate change mitigation potential from food waste composting. Scientific Reports13(1), Article 7608. Link to source: https://doi.org/10.1038/s41598-023-34174-z

Platt, B., Bell, B., & Harsh, C. (2013). Pay dirt: Composting in Maryland to reduce waste, create jobs, & protect the bay. Institute for Local Self-Reliance. Link to source: https://ilsr.org/wp-content/uploads/2013/05/Pay-Dirt-Report.pdf

Platt, B. (2017, April 4). Hierarchy to Reduce Food Waste & Grow Community, Institute for Local Self-Reliance. Link to source: https://ilsr.org/articles/food-waste-hierarchy/

Platt, B., and Fagundes, C. (2018). Yes! In my backyard: A home composting guide for local government. Institute for Local Self-Reliance. Link to source: https://ilsr.org/articles/yimby-compost/

Platt, B., Libertelli, C., & Matthews, M. (2022). A growing movement: 2022 community composter census. Institute for Local Self-Reliance. Link to source: https://ilsr.org/articles/composting-2022-census/ 

Ricci-Jürgensen, M., Gilbert, J., & Ramola, A.. (2020a). Global assessment of municipal organic waste production and recycling. International Solid Waste Association. Link to source: https://www.altereko.it/wp-content/uploads/2020/03/Report-1-Global-Assessment-of-Municipal-Organic-Waste.pdf 

Ricci-Jürgensen, M., Gilbert, J., & Ramola, A.. (2020b). Benefits of compost and anaerobic digestate when applied to soil. International Solid Waste Association. Link to source: https://www.altereko.it/wp-content/uploads/2020/03/Report-2-Benefits-of-Compost-and-Anaerobic-Digestate.pdf 

Rynk, R., Black, G., Biala, J., Bonhotal, J., Cooperband, L., Gilbert, J., & Schwarz, M. (Eds.). (2021). The composting handbook. Compost Research & Education Foundation and Elsevier. Link to source: https://www.compostingcouncil.org/store/viewproduct.aspx?id=19341051

Sánchez, A., Gea, T., Font, X., Artola, A., Barrena, R., & Moral-Vico, J. (Eds.). (2025). Composting: Fundamentals and Recent Advances: Chapter 1. Royal Society of Chemistry. Link to source: https://doi.org/10.1039/9781837673650 

Searchinger, T., Peng, L., Zionts, J., & Waite, R. (2024). The global land squeeze: Managing the growing competition for land. World Resources Institute. Link to source: https://www.wri.org/research/global-land-squeeze-managing-growing-competition-land

Souza, M. A. d., Gonçalves, J. T., & Valle, W. A. d. (2023). In my backyard? Discussing the NIMBY effect, social acceptability, and residents’ involvement in community-based solid waste management. Sustainability15(9), Article 7106. Link to source: https://doi.org/10.3390/su15097106

The Environmental Research & Education Foundation. (2024). Analysis of MSW landfill tipping fees — 2023. Link to source: https://erefdn.org/product/analysis-of-msw-landfill-tipping-fees-2023/

U.S. Composting Council. (2008). Greenhouse gases and the role of composting: A primer for compost producers [Fact sheet]. Link to source: https://cdn.ymaws.com/www.compostingcouncil.org/resource/resmgr/documents/GHG-and-Role-of-Composting-a.pdf 

U.S. Environmental Protection Agency. (2020). 2018 wasted food report (EPA Publication No. EPA 530-R-20-004). Office of Resource Conservation and Recovery. Link to source: https://www.epa.gov/system/files/documents/2025-02/2018_wasted_food_report-v2.pdf 

U.S. Environmental Protection Agency. (2023). 2019 Wasted food report (EPA Publication No. 530-R-23-005). National Institutes of Health. Link to source: https://www.epa.gov/system/files/documents/2024-04/2019-wasted-food-report_508_opt_ec_4.23correction.pdf

U.S. Environmental Protection Agency. (2023). Documentation for Greenhouse Gas Emission and Energy Factors Used in the Waste Reduction Model (WARM): Organic Materials Chapters (EPA Publication No. EPA-530-R-23-019). Office of Resource Conservation and Recovery. Link to source: https://www.epa.gov/system/files/documents/2023-12/warm_organic_materials_v16_dec.pdf

U.S. Environmental Protection Agency. (2025, January). Approaches to composting. Link to source: https://www.epa.gov/sustainable-management-food/approaches-composting

U.S. Environmental Protection Agency. (2025, April). Benefits of using compost. Link to source: https://www.epa.gov/sustainable-management-food/benefits-using-compost

United Nations Environment Programme. (2023). Towards Zero Waste: A Catalyst for delivering the Sustainable Development Goals. Link to source: https://doi.org/10.59117/20.500.11822/44102

United Nations Environment Programme. (2024). Global Waste Management Outlook 2024 Beyond an age of waste: Turning rubbish into a resource. Link to source: https://www.unep.org/resources/global-waste-management-outlook-2024 

Urra, J., Alkorta, I., & Garbisu, C. (2019). Potential benefits and risks for soil health derived from the use of organic amendments in agriculture. Agronomy9(9), 542. Link to source: https://doi.org/10.3390/agronomy9090542

Wilson, D. C., Paul, J., Ramola, A., & Filho, C. S. (2024). Unlocking the significant worldwide potential of better waste and resource management for climate mitigation: With particular focus on the Global South. Waste Management & Research: The Journal for a Sustainable Circular Economy42(10), 860–872. Link to source: https://doi.org/10.1177/0734242X241262717

World Bank. (2018). What a waste global database: Country-level dataset. (Last Updated: June 4, 2024) [Data set]. World Bank. Link to source: https://datacatalogfiles.worldbank.org/ddh-published/0039597/3/DR0049199/country_level_data.csv 

Yasmin, N., Jamuda, M., Panda, A. K., Samal, K., & Nayak, J. K. (2022). Emission of greenhouse gases (GHGs) during composting and vermicomposting: Measurement, mitigation, and perspectives. Energy Nexus7, Article 100092. Link to source: https://doi.org/10.1016/j.nexus.2022.100092

Zaman, A. U. (2016). A comprehensive study of the environmental and economic benefits of resource recovery from global waste management systems. Journal of Cleaner Production124, 41–50. Link to source: https://doi.org/10.1016/j.jclepro.2016.02.086

Zero Waste Europe & Bio-based Industries Consortium. (2024). Bio-waste generation in the EU: Current capture levels and future potential (Second edition). LIFE Programme of the European Union. Link to source: https://zerowasteeurope.eu/library/bio-waste-generation-in-the-eu-current-capture-levels-and-future-potential-second-edition/ 

Zhu, J., Luo, Z., Sun, T., Li, W., Zhou, W., Wang, X., Fei, X., Tong, H., & Yin, K. (2023). Cradle-to-grave emissions from food loss and waste represent half of total greenhouse gas emissions from food systems. Nature Food4(3), 247–256. Link to source: https://doi.org/10.1038/s43016-023-00710-3

Credits

Lead Fellow

  • Megan Matthews, Ph. D.

Contributors

  • Ruthie Burrows, Ph.D.

  • James Gerber, Ph.D.

  • Daniel Jasper

  • Alex Sweeney

Internal Reviewers

  • Aiyana Bodi

  • Hannah Henkin

  • Ted Otte

  • Sarah Gleeson, Ph. D.

  • Amanda D. Smith, Ph.D.

  • Paul C. West, Ph.D.

Effectiveness

We estimated that composting reduces emissions by 3.9 t CO₂‑eq /t OW (9.3 t CO₂‑eq /t OW, 20-yr basis) based on avoided landfill emissions minus the emissions during composting of MSW OW (Table 1). In our analysis, composting emissions were an order of magnitude lower than landfill emissions.

left_text_column_width

Table 1. Effectiveness at reducing emissions. 

Unit: t CO₂‑eq (100-yr basis)/t OW

25th percentile 2.5
Mean 3.2
Median (50th percentile) 3.9
75th percentile 4.3
Left Text Column Width

Emissions data from composting and landfilling OW are geographically limited, but our analysis includes three global reports and studies from the U.S., China, Denmark, and the EU (European Energy Agency [EEA], 2024; Industrious Labs, 2024; Perez et al., 2023; U.S. EPA, 2020; Yang et al., 2017, Yasmin et al., 2022). We assumed OW was 39.6% of MSW in accordance with global averages (Kaza et al., 2018; World Bank, 2018).

We estimated that landfills emit 4.3 t CO₂‑eq /t OW (9.9 t CO₂‑eq /t OW, 20-yr basis). We estimated composting emissions were 10x lower at 0.4 t CO₂‑eq /t OW (0.6 t CO₂‑eq /t OW, 20-yr basis). We quantified emissions from a variety of composting methods and feedstock mixes (Cao et al., 2023; Perez et al., 2023; Yasmin et al., 2022). Consistent with Amuah et al. (2022), we assumed a 60% moisture content by weight to convert reported wet waste quantities to dry waste weights. We based effectiveness estimates only on dry OW weights. For adoption and cost, we did not distinguish between wet and dry OW.

left_text_column_width
Cost

Financial data were geographically limited. We based cost estimates on global reports with selected studies from the U.K., U.S., India, and Saudi Arabia for landfilling and the U.S. and Sri Lanka for composting. Transportation and collection costs can be significant in waste management, but we did not include them in this analysis. We calculated amortized net cost for landfilling and composting by subtracting revenues from operating costs and amortized initial costs over a 30-yr facility lifetime.

Landfill initial costs are one-time investments, while operating expenses, which include maintenance, wages, and labor, vary annually. Environmental costs, including post-closure operations, are not included in our analysis, but some countries impose taxes on landfilling to incentivize alternative disposal methods and offset remediation costs. Landfills generate revenue through tip fees and sales of landfill gas (Environmental Research & Education Foundation [EREF], 2023; Kaza et al., 2018). We estimated that landfilling is profitable, with a net cost of –US$30/t OW. 

Initial and operational costs for centralized composting vary depending on method and scale (IPCC, 2023; Manea et al., 2024), but up-front costs are generally cheaper than landfilling. Since composting is labor-intensive and requires monitoring, operating costs can be higher, particularly in regions that do not impose landfilling fees (Manea et al., 2024). 

Composting facilities generate revenue through tip fees and sales of compost products. Compost sales alone may not be sufficient to recoup costs, but medium- to large-scale composting facilities are economically viable options for municipalities (Kawai et al., 2020; Manea et al., 2024). We estimated the net composting cost to be US$20/t OW. The positive value indicates that composting is not globally profitable; however, decentralized systems that locally process smaller waste quantities can be profitable using low-cost but highly efficient equipment and methods (see Increase Decentralized Composting). 

We estimated that composting costs US$50/t OW more than landfilling. Although composting systems cost more to implement, the societal and environmental costs are greatly reduced compared to landfilling (Yasmin et al., 2022). The high implementation cost is a barrier to adoption in lower-resourced and developing countries (Wilson et al., 2024). 

Combining effectiveness with the net costs presented here, we estimated a cost per unit climate impact of US$10/t CO₂‑eq (US$5/t CO₂‑eq , 20-yr basis) (Table 2). 

left_text_column_width

Table 2. Cost per unit climate impact.

Unit: US$ (2023)/t CO₂‑eq (100-yr basis)

Median 10
Left Text Column Width
Learning Curve

Global cost data on composting are limited, and costs can vary depending on composting methods, so we did not quantify a learning rate for centralized composting.

left_text_column_width
Speed of Action

Speed of action refers to how quickly a climate solution physically affects the atmosphere after it is deployed. This is different from speed of deployment, which is the pace at which solutions are adopted.

At Project Drawdown, we define the speed of action for each climate solution as emergency brake, gradual, or delayed.

Increase Centralized Composting is an EMERGENCY BRAKE climate solution. It has the potential to deliver a more rapid impact than nominal and delayed solutions. Because emergency brake solutions can deliver their climate benefits quickly, they can help accelerate our efforts to address dangerous levels of climate change. For this reason, they are a high priority.

left_text_column_width
Caveats

The composting process has a low risk of reversal since carbon is stored stably in finished compost instead of decaying and releasing methane in a landfill (Ayilara et al., 2020; Manea et al., 2024). However, a composting system, from collection to finished product, can be challenging to sustain. Along with nitrogen-rich food and green waste, additional carbon-rich biomass, called bulking material, is critical for maintaining optimal composting conditions that minimize GHG emissions. Guaranteeing the availability of sufficient bulking materials can challenge the success of both centralized and decentralized facilities.

Financially and environmentally sustainable composting depends not only on the quality of incoming OW feedstocks, but also on the quality of the final product. Composting businesses require a market for sales of compost products (in green spaces and/or agriculture), and poor source separation could lead to low-quality compost and reduced demand (Kawai et al., 2020; Wilson et al., 2024). Improvements in data collection and quality through good feedback mechanisms can also act as leverage for expanding compost markets, pilot programs, and growing community support.

If composting facilities close due to financial or other barriers, local governments may revert to disposing of organics in landfills. Zoning restrictions also vary broadly across geographies, affecting how easily composting can be implemented (Cao et al., 2023). In regions where centralized composting is just starting, reversal could be more likely without community engagement and local government support (Kawai et al., 2020; Maalouf & Agamuthu, 2023); however, even if facilities close, the emissions savings from past operation cannot be reversed.

left_text_column_width
Current Adoption

We estimated global composting adoption at 78 million t OW/yr, as the median between two datasets (Table 3). The most recent global data on composting were compiled in 2018 from an analysis from 174 countries and territories (World Bank, 2018). We also used an Organisation for Economic Co-operation and Development (OECD) analysis from 45 countries (OECD, 2021). However, there were still many countries and territories that did not report composting data in one or both datasets. Although the World Bank dataset is comprehensive, it is based on data collected in 2011–2018, so more recent, high-quality, global data on composting are needed.

left_text_column_width

Table 3. Current adoption level (2021).

Unit: t OW composted/yr

25th percentile 67,000,000
Mean 78,000,000
Median (50th percentile) 78,000,000
75th percentile 89,000,000
Left Text Column Width

Globally in 2018, nearly 40% of all waste was disposed of in landfills, 19% was recovered through composting and other recovery and recycling methods, and the remaining waste was either unaccounted for or disposed of through open dumping and wastewater (Kaza et al., 2018)

We calculated total tonnage composted using the reported composting percentages and the total MSW tonnage for each country. Composting percentages were consistently lower than the total percentage of OW present in MSW, suggesting there is ample opportunity for increased composting, even in geographies where it is an established disposal method. In 2018, 26 countries/territories had a composting rate above 10% of MSW, and 15 countries/territories had a composting rate above 20% of MSW. Countries with the highest composting rates were Austria (31%), the Netherlands (27%), and Switzerland (21%) (World Bank, 2018).

left_text_column_width
Adoption Trend

We used OECD data to estimate the composting adoption trend from 2014–2021 (OECD, 2021), which fluctuated significantly from year to year (Table 4). Negative rates indicate less OW was composted globally than in the previous year. Taking the median composting rate across seven years, we estimate the global composting trend as 260,000 t OW/yr/yr. However, the mean composting trend is –1.3 Mt OW/yr/yr, suggesting that on average, composting rates are decreasing globally. 

left_text_column_width

Table 4. Adoption trend (2014–2021).

Unit: t OW composted/yr/yr

25th percentile -1,200,000
Mean -1,300,000
Median (50th percentile) 260,000
75th percentile 4,300,000
Left Text Column Width

Although some regions are increasing their composting capacity, others are either not composting or composting less over time. Germany, Italy, Spain, and the EU overall consistently show increases in composting rates year-to-year, while Greece, Japan, Türkiye, and the U.K. show decreasing composting rates. In Europe, the main drivers for consistent adoption were disposal costs, financial penalties, and the landfill directive (Ayilara et al., 2020). 

Lack of reported data could also contribute to a negative global average composting rate over the past seven years. A large decline in composting rates from 2018–2019 was driven by a lack of data in 2019 for the U.S. and Canada. If we assumed that the U.S. composted the same tonnage in 2019 as in 2018, instead of no tonnage as reported in the data, then the annual trend for 2018–2019 is much less negative (–450,000 t OW/yr/yr) and the overall mean trend between 2014–2019 would be positive (1,400,000 t OW/yr/yr).

left_text_column_width
Adoption Ceiling

We estimate the global adoption ceiling for Increase Centralized Composting to be 1.35 billion t OW/yr (Table 5). In 2016, 2.01 Gt of MSW were generated, and generation is expected to increase to 3.4 Gt by 2050 (Kaza et al., 2018). Due to limited global data availability on composting infrastructure or policies, we estimated the adoption ceiling based on the projected total MSW for 2050 and assumed the OW fraction remains the same over time.

left_text_column_width

Table 5. Adoption ceiling. upper limit for adoption level.

Unit: t OW composted/yr

Median (50th percentile) 1,350,000,000
Left Text Column Width

In reality, amounts of food waste within MSW are also increasing, suggesting that there are sufficient global feedstocks to support widespread composting adoption (Zhu et al., 2023). 

We assume that all OW could be processed via composting, but this ceiling is unlikely to be reached. In practice, organics could also be processed via methane digesters (see Deploy Methane Digesters), incinerated, or dumped, but these waste management treatments have similar environmental risks to landfilling. 

left_text_column_width
Achievable Adoption

Since the global annual trend fluctuates, we used country-specific composting rates and organic fractions of MSW from 2018 to estimate the achievable range of composting adoption (see Appendix for an example). In our analysis, achievable increases in country-specific composting rates cannot exceed the total organic fraction of 2018 MSW. 

For the 106 countries/territories that did not report composting rates, we defined achievable levels of composting relative to the fraction of OW in MSW. When countries also did not report OW percentages, the country-specific composting rate was kept at zero. For the remaining 86 countries/territories, we assumed that 25% of organic MSW could be diverted to composting for low achievable adoption and that 50% could be diverted for high achievable adoption. 

For the 68 countries/territories with reported composting rates, we define low and high achievable adoption as a 25% or 50% increase to the country-specific composting rate, respectively. If the increased rate for either low or high adoption exceeded the country-specific OW fraction of MSW, we assumed that all organic MSW could be composted (see Appendix for an example). Our Achievable – Low adoption level is 201 Mt OW/yr, or 15% of our estimated adoption ceiling (Table 6). Our Achievable – High adoption level is 301 Mt OW/yr, or 22% of our estimated adoption ceiling. 

left_text_column_width

Table 6. Range of achievable adoption levels.

Unit: t OW composted/yr

Current adoption 78,000,000
Achievable – low 201,000,000
Achievable – high 301,000,000
Adoption ceiling 1,350,000,000
Left Text Column Width

Our estimated adoption levels are conservative because some regions without centralized composting of MSW could have subnational decentralized composting programs that aren’t reflected in global data.

left_text_column_width

Although our achievable range is conservative compared to the estimated adoption ceiling, increased composting has the potential to reduce GHG emissions from landfills (Table 7). We estimated that current adoption reduces annual GHG emissions by 0.3 Gt CO₂‑eq/yr (0.73 Gt CO₂‑eq/yr, 20-yr basis). Our estimated low and high achievable adoption levels reduce 0.78 and 1.2 Gt CO₂‑eq/yr (1.9 and 2.8 Gt CO₂‑eq/yr, 20-yr basis), respectively. Using the adoption ceiling, we estimate that annual GHG reductions increase to 5.2 Gt CO₂‑eq/yr (12.6 Gt CO₂‑eq/yr, 20-yr basis).

left_text_column_width

Table 7. Climate impact at different levels of adoption.

Unit: Gt CO₂‑eq (100-yr basis)/yr

Current adoption 0.30
Achievable – low 0.78
Achievable – high 1.2
Adoption ceiling 5.2
Left Text Column Width

The IPCC estimated in 2023 that the entire waste sector accounted for 3.9% of total global GHG emissions, and solid waste management represented 36% of total waste sector emissions (IPCC, 2023). Disposal of waste in landfills leads to methane emissions estimated at nearly 1.9 Gt CO₂‑eq (100-yr basis) annually (IEA, 2024). Based on these estimates, current composting adoption reduces annual methane emissions from landfills more than 16%. 

Increasing adoption to low and high achievable levels could reduce the amount of OW going to landfills by up to 40% and avoid 32–50% of landfill emissions. Reaching our estimated adoption ceilings for Increase Centralized Composting and reduction-focused solutions like Reduce Food Loss and Waste could avoid all food-related landfill emissions.

These climate impacts can be considered underestimates of beneficial mitigation from increased composting since we did not quantify the carbon sequestration benefits of compost application and reduced synthetic fertilizer use. Our estimated climate impacts from composting are also an underestimate because we didn’t include decentralized composting. 

In addition to OW from MSW, large-scale composting also requires agricultural biomass as a feedstock. Multiple climate solutions, in addition to Increase Centralized Composting, require biomass, and projected demand across solutions greatly exceeds supply. The deforestation that would be required to meet demand would produce emissions far greater than any mitigation gains from full deployment of these solutions (Searchinger, 2024). In addition to deforestation, there would also be costs and emissions incurred to transport biomass from where it is produced to where it can be processed and used. Thus, the estimated climate impacts presented here are only possible if feedstocks are prioritized for this solution. If feedstocks are instead prioritized for other climate solutions (see Interactions for examples), adoption and impact will be lower for this solution. It is not possible to set all biomass-dependent solutions to high adoption levels, add up their impacts, and determine an accurate combined emissions impact.

left_text_column_width
Additional Benefits

Income and Work

Composting creates more jobs than landfills or incinerators and can save money compared with other waste management options (Bekchanov & Mirzabaev, 2018; Farhidi et al., 2022; Platt et al., 2013; Zaman, 2016). It is less expensive to build and maintain composting plants than incinerators (Kawai et al., 2020). According to a survey of Maryland waste sites, composting creates twice as many jobs as landfills and four times as many jobs as incineration plants (Platt et al., 2013). Composting also indirectly sustains jobs in the distribution and use of compost products (Platt et al., 2013). Compost is rich in nutrients and can also reduce costs associated with synthetic fertilizer use in agriculture (Farhidi et al., 2022).

Health

Odors coming from anaerobic decomposition landfills, such as ammonia and hydrogen sulfide, are another source of pollutants that impact human well-being, which can be reduced by aerobic composting (Cai et al., 2018).

Equality

Reducing community exposure to air pollution from landfills through composting has implications for environmental justice (Casey et al., 2021; Nguyen et al., 2023). A large review of waste sites in the United States and Europe found that landfills are disproportionately located near populations with low socioeconomic status and near racially and ethnically marginalized neighborhoods (Marzutti et al., 2010). Reducing disproportionate exposures to air pollution from landfills may mitigate poor health outcomes in surrounding communities (Brender et al., 2011)

Land Resources

Compost provides an important soil amendment that adds organic matter and nutrients to soil, reducing the need for synthetic fertilizers (Urra et al., 2019; U.S. EPA, 2025). Healthy soils that are rich in organic matter can benefit the surrounding ecosystem and watershed and lead to more plant growth through improved water retention and filtration, improved soil quality and structure, and reduced erosion and nutrient runoff (Bell & Platt, 2014; Martinez-Blanco et al., 2013; U.S. EPA, 2025). By reducing the need for synthetic fertilizers and by improving soils’ ability to filter and conserve water, compost can also reduce eutrophication of water bodies (U.S. EPA, 2025). These soil benefits are partially dependent on how compost is sorted because there may be risks associated with contamination of microplastics and heavy metals (Manea et al., 2024; Urra et al., 2019).

Water Resources

For a description of water resources benefits, please see Land Resources above. 

Air Quality

Composting can reduce air pollution such as CO₂, methane, volatile organic compounds, and particulate matter that is commonly released from landfills and waste-to-energy systems (Kawai et al., 2020; Nordahl et al., 2020; Siddiqua et al., 2022). An analysis comparing emissions from MSW systems found composting to have lower emissions than landfilling and other waste-to-energy streams (Nordahl et al., 2020). Composting can also reduce the incidence of landfill fires, which release black carbon and carbon monoxide, posing risks to the health and safety of people in nearby communities (Nguyen et al., 2023).

left_text_column_width
Risks

Before the composting process can start, feedstocks are sorted to remove potential contaminants, including nonbiodegradable materials such as metal and glass as well as plastics, bioplastics, and paper products (Kawai et al., 2020; Perez et al., 2023; Wilson et al., 2024). While most contaminants can be removed through a variety of manual and mechanical sorting techniques, heavy metals and microplastics can become potential safety hazards or reduce finished compost quality (Manea et al., 2024). Paper and cardboard should be separated from food and green waste streams because they often contain contaminants such as glue or ink, and they degrade more slowly than other OW, leading to longer processing time and lower-quality finished compost (Kawai et al., 2020; Krause et al., 2023).

Successful and safe composting requires careful monitoring of compost piles to avoid anaerobic conditions and ensure sufficient temperatures to kill pathogens and weed seeds (Amuah et al., 2022; Ayilara et al., 2020; Cao et al., 2023; Kawai et al., 2020; Manea et al., 2024). Anaerobic conditions within the compost pile increase GHGs emitted during composting. Poorly managed composting facilities can also pose safety risks for workers and release odors, leading to community backlash (Cao et al., 2023; Manea et al., 2024; UNEP, 2024). Regional standards, certifications, and composter training programs are necessary to protect workers from hazardous conditions and to guarantee a safe and effective compost product (Kawai et al., 2020). Community outreach and education on the benefits of separating waste and composting prevent “not-in-my-backyard” attitudes or “NIMBYism” (Brown, 2015; Platt & Fagundes 2018) that may lead to siting composting facilities further from the communities they serve (Souza, et al., 2023; Liu et al., 2018).

left_text_column_width
Interactions with Other Solutions

Reinforcing

Increased composting could positively impact annual cropping by providing consistent, high-quality finished compost that can reduce dependence on synthetic fertilizers and improve soil health and crop yields. 

left_text_column_width

High-quality sorting systems also allow for synergies that benefit all waste streams and create flexible, resilient waste management systems. Improving waste separation programs for composting can have spillover effects that also improve other waste streams, such as recyclables, agricultural waste, or e-waste. Access to well-sorted materials can also help with nutrient balance for various waste streams, including agricultural waste.

left_text_column_width

Composting facilities require a reliable source of carbon-rich bulking material. Agricultural waste can be diverted to composting rather than burning to reduce emissions from crop residue burning. 

left_text_column_width

Competing

Diverting OW from landfills will lead to lower landfill methane emissions and, therefore, less methane available to be captured and resold as revenue.

left_text_column_width

Composting uses wood, crop residues, and food waste as feedstocks (raw material). Because the total projected demand for biomass feedstocks for climate solutions exceeds the supply, not all solutions will be able to achieve their potential adoption. This solution is in competition with other climate solutions for raw material.

left_text_column_width
Dashboard

Solution Basics

t organic waste

t CO₂-eq (100-yr)/unit
02.53.9
units/yr
Current 7.8×10⁷ 02.009×10⁸3.01×10⁸
Achievable (Low to High)

Climate Impact

Gt CO₂-eq (100-yr)/yr
Current 0.3 0.781.2
US$ per t CO₂-eq
10
Emergency Brake

CO₂,  CH₄

Trade-offs

Robust collection networks and source separation of OW are vital for successful composting, but they also increase investment costs. However, well-sorted OW can reduce the need for separation equipment and allow for simpler facility designs, leading to lower operational costs. The emissions from transporting OW are not included here, but are expected to be significantly less than the avoided landfill emissions. Composting facilities are typically located close to the source of OW (Kawai et al., 2020; U.S. Composting Council [USCC], 2008), but since centralized composting facilities are designed to serve large communities and municipalities, there can be trade-offs between sufficient land availability and distance from waste sources.

We also exclude emissions from onsite vehicles and equipment such as bulldozers and compactors, assuming that those emissions are small compared to the landfill itself.

left_text_column_width
t/person/yr
< 0.17
0.17–0.32
0.32–0.5
> 0.5
No Data

Per capita MSW generation, 2018

Annual generation of MSW per capita. Total global MSW generation exceeded 2 Gt/yr.

World Bank Group (2021). What a waste global database (Version 3) [Data set]. WBG. Retrieved March 6, 2025, from Link to source: https://datacatalog.worldbank.org/search/dataset/0039597

Maps Introduction

Globally, 17 countries reported composting more than 1 Mt each of organic waste in 2018, with India, China, Germany, and France reporting more than 5 Mt each (World Bank, 2018). With the exception of Austria, which composted nearly all organic waste generated, even countries with established centralized composting could divert more organic waste to composting. 

The fate from which composting diverts organic waste varies from region to region, but globally over 40% of all waste ends up in landfills. Since organic waste makes up the largest percentage of MSW in most regions, excluding North America, parts of East Asia and the Pacific, and parts of Europe and Central Asia, there is ample opportunity to increase composting. In East Asia and the Pacific, South Asia, and sub-Saharan Africa, diverting organics to composting also avoids disposal in waterways and open dumps, which reduces pollution. In North America and Europe and Central Asia, 15–20% of MSW is incinerated (Kaza et al., 2018), so diverting all organic waste to composting would avoid harmful incineration emissions including CO, NOx, and VOCs (Abedin et al., 2025; Global Alliance for Incinerator Alternatives, 2019; Liu et al., 2021; Nubi et al., 2024).

Diversion of organic waste requires separation of waste streams, and cities with better collection and tracking networks often have more robust composting programs. Higher quality and more frequent reporting on waste generation and disposal worldwide could improve source separation and increase composting. Additionally, city-level and decentralized pilot programs allow for better control over feedstock collection and can bolster support for larger scale, centralized operations. 

Multiple cities in Latin America and the Caribbean represent a resurgence in composting markets . In the 1960s and 1970s, composting facilities were built in cities across Mexico, El Salvador, Ecuador, Venezuela, and Brazil, but many closed due to high operational costs (Ricci-Jürgensen et al., 2020a). In 2018, 15% of waste was recycled or composted in Montevideo, Uruguay, and Bogotá and Medellín, Colombia, and 10% of waste was composted in Mexico City, Mexico, and Rosario, Argentina (Kaza et al., 2018).  

Waste generation is increasing globally, with the largest increases projected to occur in sub-Saharan Africa, South Asia, and the Middle East and North Africa (Kaza et al., 2018). As waste generation doubles or triples in these regions, sustainable disposal methods will become more critical for human health and well-being. 

In 2018, Ethiopia reported the highest organic waste percentage in sub-Saharan Africa at 85% of MSW, but no composting (World Bank, 2018). Organic waste percentages are high in other countries in the region, so composting could be a valuable method to handle the growing waste stream. In the Middle East & North Africa, 43% of countries reported composting as of 2018 (Kaza et al., 2018), indicating the presence of infrastructure that could be scaled up to handle increased waste in the future.

Action Word
Increase
Solution Title
Centralized Composting
Classification
Highly Recommended
Lawmakers and Policymakers
  • Establish zero waste and OW diversion goals; incorporate them into local or national climate plans and soil health and conservation policies.
  • Ensure public procurement uses local compost when possible.
  • Participate in consultations with farmers, businesses, and the public to determine where to place plants, how to use compost, pricing, and how to roll out programs.
  • Establish or improve existing centralized composting facilities, collection networks, and storage facilities.
  • Establish incentives and programs to encourage both centralized and decentralized composting.
  • Work with farmers, local gardeners, the private sector, and local park systems to develop markets for compost.
  • Invest in source separation education and waste separation technology that enhances the quality of final compost products.
  • Regulate the use of waste separation technologies to prioritize source separation of waste and the quality of compost products.
  • Ensure low- and middle-income households are served by composting programs with particular attention to underserved communities such as multi-family buildings and rural households.
  • Enact extended producer responsibility approaches that hold producers accountable for waste.
  • Create demonstration projects to show the effectiveness and safety of finished compost.
  • Ensure composting plants are placed as close to farmland as possible and do not adversely affect surrounding communities.
  • Streamline permitting processes for centralized compost facilities and infrastructure.
  • Establish laws or regulations that require waste separation as close to the source as possible, ensuring the rules are effective and practical.
  • Establish zoning policies that support both centralized and decentralized composting efforts, including at the industrial, agricultural, community, and backyard scales.
  • Establish fees or fines for OW going to landfills; use funds for composting programs.
  • Use financial instruments such as taxes, subsidies, or exemptions to support infrastructure, participation, and waste separation.
  • Partner with schools, community gardens, farms, nonprofits, women’s groups, and other community organizations to promote composting and teach the importance of waste separation.
  • Establish one-stop-shop educational programs that use online and in-person methods to teach how to separate waste effectively and why it’s important.
  • If composting is not possible or additional infrastructure is needed, consider methane digesters as alternatives to composting.
  • Create, support, or join certification programs that verify the quality of compost and/or verify food waste suppliers such as hotels, restaurants, and cafes.
Practitioners
  • Work with policymakers and local communities to establish zero-waste and OW diversion goals for local or national climate plans.
  • Participate in consultations with farmers, policymakers, businesses, and the public to determine where to place plants, how to use compost, pricing, and how to roll out programs.
  • Work with farmers, local gardeners, the private sector, and local park systems to create quality supply streams and develop markets for compost.
  • Invest in source separation education and waste separation technology that enhances the quality of final compost products.
  • Establish one-stop-shop educational programs that use online and in-person methods to teach how to separate waste effectively and why that’s important.
  • Ensure low- and middle-income households are served by composting programs with particular attention to underserved communities such as multi-family buildings and rural households.
  • Create demonstration projects to show the effectiveness and safety of finished compost.
  • Ensure composting plants are placed as close to farmland as possible and do not adversely affect surrounding communities.
  • Take advantage of financial incentives such as subsidies or exemptions to set up centralized composting infrastructure, increase participation, and improve waste separation.
  • Partner with schools, community gardens, farms, nonprofits, women’s groups, and other community organizations to promote composting and teach the importance of waste separation.
  • Consider partnerships through initiatives such as sister cities to share innovation and develop capacity.
  • If additional infrastructure is needed, consider methane digesters as alternatives to composting.
  • Create, support, or join certification programs that verify the quality of compost and/or verify food waste suppliers such as hotels, restaurants, and cafes.
Business Leaders
  • Establish zero-waste and OW diversion goals; incorporate the goals into corporate net-zero strategies.
  • Ensure procurement uses strategies to reduce FLW at all stages of the supply chain; consider using the Food Loss and Waste Protocol.
  • Ensure corporate procurement and facilities managers use local compost when possible.
  • Participate in consultations with farmers, policymakers, and the public to determine where to place plants, how to use compost, pricing, and how to roll out programs.
  • Work with farmers, local gardeners, the private sector, and local park systems to develop markets for compost.
  • Offer employee pre-tax benefits on materials to compost at home or participate in municipal composting programs.
  • Offer financial services, including low-interest loans, microfinancing, and grants, to support composting initiatives.
  • Support extended producer responsibility approaches that hold producers accountable for waste.
  • Educate employees on the benefits of composting, include them in companywide waste diversion initiatives, and encourage them to use and advocate for municipal composting in their communities. Clearly label containers and signage for composting.
  • Partner with schools, community gardens, farms, nonprofits, women’s groups, and other community organizations to promote composting and teach the importance of waste separation.
  • Create, support, or join certification programs that verify the quality of compost and/or verify food waste suppliers such as hotels, restaurants, and cafes.

Further information:

Nonprofit Leaders
  • Help policymakers establish zero-waste and OW diversion goals; help incorporate them into local or national climate plans.
  • Ensure organizational procurement uses local compost when possible.
  • Help administer, fund, or promote local composting programs.
  • Help gather data on local OW streams, potential markets, and comparisons of alternative uses such as methane digesters.
  • Participate in consultations with farmers, policymakers, businesses, and the public to determine where to place plants, how to use compost, pricing, and how to roll out programs.
  • Work with farmers, local gardeners, the private sector, and local park systems to develop markets for compost.
  • Help ensure low- and middle-income households are served by composting programs with particular attention to underserved communities such as multi-family buildings and rural households.
  • Advocate for extended producer responsibility approaches that hold producers accountable for waste.
  • Advocate for laws or regulations that require waste separation as close to the source as possible, ensuring the rules are effective and practical.
  • Create demonstration projects to show the effectiveness and safety of finished compost.
  • Establish one-stop-shop educational programs that use online and in-person methods to teach how to separate waste effectively and why that’s important.
  • Partner with schools, community gardens, farms, nonprofits, women’s groups, and other community organizations to promote composting and teach the importance of waste separation.
  • Create, support, or join certification programs that verify the quality of compost and/or verify food waste suppliers such as hotels, restaurants, and cafes.
Investors
  • Ensure relevant portfolio companies separate waste streams, contribute to compost programs, and/or use finished compost.
  • Invest in companies developing composting programs or technologies that support the process, such as equipment, circular supply chains, and consumer products.
  • Fund start-ups or existing companies that are improving waste separation technology that enhances the quality of final compost products.
  • Offer financial services, including low-interest loans, microfinancing, and grants, to support composting initiatives.
  • Invest in companies that adhere to extended producer responsibility or encourage portfolio companies to adopt the policies.
Philanthropists and International Aid Agencies
  • Help policymakers establish zero-waste and OW diversion goals; help incorporate them into local or national climate plans.
  • Advocate for businesses to establish time-bound and transparent zero-waste and OW diversion goals.
  • Advocate for extended producer responsibility approaches that hold producers accountable for waste.
  • Provide financing and capacity building for low- and middle-income countries to establish composting infrastructure and programs.
  • Help administer, fund, or promote composting programs.
  • Invest in companies developing composting programs or technologies that support the process, such as equipment, circular supply chains, and consumer products.
  • Fund startups or existing companies that are improving waste separation technology that enhances the quality of final compost products.
  • Incubate and fund mission-driven organizations and cooperatives that are advancing OW composting.
  • Offer financial services, including low-interest loans, microfinancing, and grants, to support composting initiatives.
  • Participate in consultations with farmers, policymakers, businesses, and the public to determine where to place plants, how to use compost, pricing, and how to roll out programs.
  • Work with farmers, local gardeners, the private sector, and local park systems to develop markets for compost.
  • Help ensure low- and middle-income households are served by composting programs, with particular attention to underserved communities such as multifamily buildings and rural households.
  • Advocate for laws or regulations that require waste separation as close to the source as possible, ensuring the rules are effective and practical.
  • Create demonstration projects to show the effectiveness and safety of finished compost.
  • Research and enact effective composting promotional strategies.
  • Establish one-stop-shop educational programs that use online and in-person methods to teach how to separate waste effectively and why that’s important.
  • Partner with schools, community gardens, farms, nonprofits, women’s groups, and other community organizations to promote composting and teach the importance of waste separation.
  • Create, support, or join certification programs that verify the quality of compost and/or verify food waste suppliers such as hotels, restaurants, and cafes.
Thought Leaders
  • Participate in and promote centralized, community, or household composting programs, if available, and carefully sort OW from other waste streams.
  • If no centralized composting system exists, work with local experts to establish household and community composting systems.
  • Help policymakers establish zero-waste and OW diversion goals; help incorporate them into local or national climate plans.
  • Start cooperatives that provide services and/or equipment for composting.
  • Participate in consultations with farmers, policymakers, businesses, and the public to determine where to place plants, how to use compost, pricing, and how to roll out programs.
  • Help gather data on local OW streams, potential markets, and comparisons of alternative uses such as methane digesters.
  • Help develop waste separation technology that enhances the quality of final compost products and/or improve educational programs on waste separation.
  • Develop innovative governance models for local composting programs; publicly document your experiences.
  • Work with farmers, local gardeners, the private sector, and local park systems to develop markets for compost.
  • Advocate for extended producer responsibility approaches that hold producers accountable for waste.
  • Advocate for laws or regulations that require waste separation as close to the source as possible, ensuring the rules are effective and practical.
  • Create demonstration projects to show the effectiveness and safety of finished compost.
  • Create, support, or join certification programs that verify the quality of compost.
  • Research various governance models for local composting programs and outline options for communities to consider.
  • Research and enact effective composting campaign strategies.
  • Create, support, or join certification programs that verify the quality of compost and/or verify food waste suppliers such as hotels, restaurants, and cafes.
Technologists and Researchers
  • Quantify estimates of OW both locally and globally; estimate the associated potential compost output.
  • Improve waste separation technology to improve the quality of finished compost.
  • Create tracking and monitoring software for OW streams, possible uses, markets, and pricing.
  • Research the application of AI and robotics for optimal uses of OW streams, separation, collection, distribution, and uses.
  • Research various governance models for local composting programs and outline options for communities to consider.
  • Research effective composting campaign strategies and how to encourage participation from individuals.
Communities, Households, and Individuals
  • Participate in and promote centralized composting programs, if available, and carefully sort OW from other waste.
  • If no centralized composting system exists, work with local experts to establish household and community composting systems.
  • Participate in consultations with farmers, policymakers, and businesses to determine where to place plants, how to use compost, pricing, and how to roll out programs.
  • Take advantage of educational programs, financial incentives, employee benefits, and other programs that facilitate composting.
  • Advocate for extended producer responsibility approaches that hold producers accountable for waste.
  • Advocate for laws or regulations that require waste separation, ensuring the rules are effective and practical.
  • Partner with schools, community gardens, farms, nonprofits, women’s groups, and other community organizations to promote composting and teach the importance of waste separation.
  • Create, support, or join certification programs that verify the quality of compost and/or verify food waste suppliers such as hotels, restaurants, and cafes.
Evidence Base

Consensus of effectiveness as a climate solution: High

Composting reduces OW, prevents pollution and GHG emissions from landfilled OW, and creates soil amendments that can reduce the use of synthetic fertilizers (Kaza et al., 2018; Manea et al., 2024). Although we do not quantify carbon sequestration from compost use in this analysis, a full life-cycle analysis that includes application could result in net negative emissions for composting (Morris et al., 2013).

Globally, the waste sector was responsible for an estimated 3.9% of total global GHG emissions in 2023, and solid waste management represented 36% of those emissions (IPCC, 2023; UNEP, 2024). Emissions estimates based on satellite and field measurements from landfills or direct measurements of carbon content in food waste can be significantly higher than IPCC Tier 1-based estimates. Reviews of global waste management estimated that food loss and food waste account for around 6% of global emissions or approximately 2.8 Gt CO₂‑eq/yr (Wilson et al., 2024; Zhu et al., 2023). Facility-scale composting reduces emissions 38–84% relative to landfilling (Perez et al., 2023), and monitoring and managing the moisture content, aeration, and carbon to nitrogen ratios can further reduce emissions (Ayilara et al., 2020).

Unclear legislation and regulation for MSW composting can prevent adoption, and there is not a one-size-fits-all approach to composting (Cao et al., 2023). Regardless of the method used, composting converts OW into a nutrient-rich resource and typically reduces incoming waste volumes 40–60% in the process (Cao et al., 2023; Kaza et al., 2018). A comparative cost and energy analysis of MSW components highlighted that while composting adoption varies geographically and economically, environmental benefits also depend on geography and income (Zaman, 2016). Food and green waste percentages of MSW are higher in lower-resourced countries than in high-income countries due to less packaging, and more than one-third of waste in high-income countries is recovered through recycling and composting (Kaza et al., 2018).

The results presented in this document summarize findings from 22 reports, 31 reviews, 12 original studies, two books, nine web articles, one fact sheet, and three data sets reflecting the most recent evidence for more than 200 countries and territories. 

left_text_column_width
Appendix

Global MSW Generation and Disposal

Analysis of MSW in this section is based on the 2018 What a Waste 2.0 global dataset and report as well as the references cited in the report (Kaza et al., 2018; World Bank 2018). In 2018, approximately 2 Gt of waste was generated globally. Most of that went to landfills (41%) and open dumps (22%). Out of 217 countries and territories, 24 sent more than 80% of all MSW to landfills and 3 countries reported landfilling 100% of MSW. The average across all countries/territories was 28% of MSW disposed of in landfills. Both controlled and sanitary landfills with gas capture systems are included in the total landfilled percentage.

Approximately 13% of MSW was treated through recycling and 13% through incineration, but slightly more waste was incinerated than recycled per year. Incineration was predominately used in upper-middle and high-income countries with negligible amounts of waste incinerated in low- and lower-middle income countries.

Globally, only about 5% of MSW was composted and nearly no MSW was processed via methane digestion. However, OW made up nearly 40% of global MSW, so most OW was processed through landfilling, open dumping, and incineration all of which result in significant GHG emissions and pollution. There is ample opportunity to divert more OW from polluting disposal methods toward composting. Due to lack of data on open dumping, and since incineration only accounts for 1% of global GHG emissions, we chose landfilling as our baseline disposal method for comparison.

In addition to MSW, other waste streams include medical waste, e-waste, hazardous waste, and agricultural waste. Global agricultural waste generation in 2018 was more than double total MSW (Kaza et al., 2018). Although these specialized waste streams are treated separately from MSW, integrated waste management systems with high-quality source separation programs could supplement organic MSW with agricultural waste. Rather than being burned or composted on-farm, agricultural waste can provide bulking materials that are critical for maintaining moisture levels and nutrient balance in the compost pile, as well as scaling up composting operations. 

left_text_column_width

Details of a Composting System and Process

Successful centralized composting starts with collection and separation of OW from other waste streams, ideally at the source of waste generation. Financial and regulatory barriers can hinder creation or expansion of composting infrastructure. Composting systems require both facilities and robust collection networks to properly separate OW from nonbiodegradable MSW and transport OW to facilities. Mixed waste streams increase contamination risks with incoming feedstocks, so separation of waste materials at the source of generation is ideal. 

Establishing OW collection presents a financial and logistical barrier to increased composting adoption (Kawai et al., 2020; Kaza et al., 2018). However, when considering a full cost-chain analysis that includes collection, transportation, and treatment, systems that rely on source-separated OW can be more cost-effective than facilities that process mixed organics. 

OW and inorganic waste can also be sorted at facilities manually or mechanically with automated techniques including electromagnetic separation, ferrous metal separation, and sieving or screening (Kawai et al., 2020). Although separation can be highly labor-intensive, it’s necessary to remove potential contaminants, such as plastics, heavy metals, glass, and other nonbiodegradable or hazardous waste components (Kawai et al., 2020; Manea et al., 2024). After removing contaminants, organic materials are pre-processed and mixed to achieve the appropriate combination of water, oxygen, and solids for optimal aerobic conditions during the composting process. 

Regardless of the specific composting method used, aerobic decomposition is achieved by monitoring and balancing key parameters within the compost pile. Key parameters are moisture content, temperature, carbon-to-nitrogen ratio, aeration, pH, and porosity (Cao et al., 2023; Kawai et al., 2020; Manea et al., 2024). The aerobic decomposition process can be split into distinct stages based on whether mesophilic (active at 20–40 oC) or thermophilic (active at 40–70 oC) bacteria and fungi dominate. Compost piles are constructed to allow for sufficient aeration while optimizing moisture content (50–60%) and the initial carbon-to-nitrogen ratio (25:1–40:1), depending on composting method and feedstocks (Amuah et al., 2022; Manea et al, 2024). Optimal carbon-to-nitrogen ratios are achieved through appropriate mixing of carbon-rich “brown” materials, such as sawdust or dry leaves, with nitrogen-rich “green” materials, such as food waste or manure (Manea et al., 2024). During the thermophilic stage, temperatures exceeding 62 oC are necessary to kill most pathogens and weed seeds (Amuah et al., 2022; Ayilara et al., 2020).

Throughout the composting process key nutrients (nitrogen, phosphorus, potassium, calcium, magnesium, and sodium), are mineralized and mobilized and microorganisms release GHGs and heat as by-products of their activity (Manea et al., 2024; Nordahl et al., 2023). Water is added iteratively to maintain moisture content and temperature in the optimal ranges, and frequent turning and aeration are necessary to ensure microorganisms have enough oxygen. Without the proper balance of oxygen and water, anaerobic conditions can lead to higher methane emissions (Amuah et al., 2022; Manea et al., 2024). Although CO₂, methane, and nitrous oxide are released during the process, these emissions are significantly lower than associated emissions from landfilling (Ayilara et al., 2020; Cao et al., 2023; FAO, 2019; Perez et al., 2023).

Once aerobic decomposition is completed, compost goes through a maturation stage where nutrients are stabilized before finished compost can be sold or used as a soil amendment. In stable compost, microbial decomposition slows until nutrients no longer break down, but can be absorbed by plants. Longer maturation phases reduce the proportion of soluble nutrients that could potentially leach into soils. 

The baseline waste management method of landfilling OW is cheaper than composting; however it also leads to significant annual GHG emissions. Composting, although more expensive due to higher labor and operating costs, reduces emissions and produces a valuable soil amendment. Establishing a composting program can have significant financial risks without an existing market for finished compost products (Bogner et al., 2007; Kawai et al., 2020; UNEP, 2024).

left_text_column_width

Example Calculation of Achievable Adoption

In 2018, Austria had the highest composting rate of 31.2%, and Vietnam composted 15% of MSW (World Bank, 2018). 

For low adoption, we assumed composting increases by 25% of the existing rate or until all OW in MSW is composted. In Austria, OW made up 31.4% of MSW in 2018, so the Adoption – Low composting rate was 31.4%. In Vietnam, the Adoption – Low composting rate came out to 18.75%, which is still less than the total OW percentage of MSW (61.9%).

For high adoption, we assumed that composting rates increase by 50% of the existing rate or until all OW in MSW is composted. So high adoption in Austria remains 31.4% (i.e., all OW generated in Austria is composted). In Vietnam, the high adoption composting rate increases to 22.5% but still doesn’t capture all OW generated (61.9% of MSW).

left_text_column_width
Updated Date

Improve Refrigerant Management

Image
Image
Refrigerant controls
Coming Soon
On
Description for Social and Search
The Improve Refrigerant Management solution is coming soon.
Action Word
Improve
Solution Title
Refrigerant Management
Classification
Highly Recommended
Updated Date

Deploy Industrial Green Hydrogen

Image
Image
Industrial Green Hydrogen Feedstock
Coming Soon
On
Summary

In this solution, green hydrogen replaces fossil fuel–based hydrogen for use as a feedstock in the production of more complex molecules such as ammonia for fertilizers and methanol for the production of other commodity chemicals. Green hydrogen production in this solution uses on-site renewable electricity or off-site renewable electricity that directly supplies the facility. It replaces hydrogen produced from fossil fuels. This solution does not include the use of green hydrogen as a fuel or as a feedstock in the production of hydrogen-based fuels.

Description for Social and Search
Green hydrogen is a Highly Recommended climate solution. It cuts GHG emissions by replacing hydrogen made from fossil fuels for use as an industrial feedstock.
Overview

Green hydrogen in this solution is hydrogen produced from water by electrolysis using renewable electricity generated on-site or directly supplied from an off-site location. It can reduce emissions when replacing hydrogen made from fossil fuels as an industrial feedstock

Today, most hydrogen is produced through a chemical reaction of methane or coal with water that generates hydrogen and CO₂. Green hydrogen, made by splitting water into hydrogen and oxygen using electricity generated from renewables, accounts for less than 1% of current production (International Energy Agency [IEA], 2025a). The process of making green hydrogen generates no direct GHGs. Therefore, replacing fossil fuel–derived hydrogen with green hydrogen avoids all direct GHGs from the hydrogen production process. 

Hydrogen prolongs the lifespan and abundance of GHGs in the atmosphere when it leaks, and so can indirectly contribute to climate change. However, because this solution substitutes one source of hydrogen for another, it will have little to no effect on this indirect climate impact. 

The manufacture of industrial hydrogen from fossil fuels for all applications was responsible for 680 Mt of emissions in 2023 (IEA, 2024), nearly all of which could be eliminated by substituting green hydrogen.

In 2023, roughly 60% of industrial feedstock hydrogen was used to produce ammonia, a vital ingredient in nitrogen fertilizers while 30% was used to produce methanol (IEA, 2024), an ingredient in the manufacture of a wide range of chemicals, including plastics, building materials, and car parts (International Renewable Energy Agency [IRENA] & Methanol Institute, 2021). Although alternative low-carbon pathways exist for ammonia and methanol, these are difficult to scale, still under development, or reliant on biomass, which is a finite resource associated with potential land-use change and competing demand(IRENA & Methanol Institute, 2021; Rodriguez, 2025). 

While there are other ways to make low-carbon hydrogen, none has demonstrated potential to cut emissions from hydrogen production as effectively as this solution. For example, harvesting naturally occurring hydrogen is a nascent industry with lots of uncertainties (The Royal Society, 2025), and hydrogen made from biomass must compete for biomass with other hard-to-abate sectors. 

The greatest hurdle to green hydrogen deployment is cost. Green hydrogen is one-and-a-half to six times more expensive to produce than hydrogen from fossil fuels (IEA, 2024). Regulatory and demand uncertainty, licensing and permitting issues, and challenges with operational scale-up are also barriers to green hydrogen projects (IEA, 2024). Nevertheless, production capacity has started to grow: installed electrolyzer capacity doubled in 2023, supported by policies and incentives (Pavan et al., n.d.). 

Ademollo, A., Calabrese, M., & Carcasci, C. (2025). An up-to-date perspective of levelized cost of hydrogen for PV-based grid-connected power-to-hydrogen plants across all Italy. Applied Energy379, 124958. Link to source: https://doi.org/10.1016/j.apenergy.2024.124958  

Anand, C., Chandraja, B., Nithiya, P., Akshaya, M., Tamizhdurai, P., Shoba, G., Subramani, A., Kumaran, R., Yadav, K. K., Gacem, A., Bhutto, J. K., Alreshidi, M. A., & Alam, M. W. (2025). Green hydrogen for a sustainable future: A review of production methods, innovations, and applications. International Journal of Hydrogen Energy111, 319–341. Link to source: https://doi.org/10.1016/j.ijhydene.2025.02.257  

Cho, H. H., Strezov, V., & Evans, T. J. (2022). Environmental impact assessment of hydrogen production via steam methane reforming based on emissions data. Energy Reports8, 13585–13595. Link to source: https://doi.org/10.1016/j.egyr.2022.10.053  

Douglas, M., Trilho, M., & Pellegrinelli, T. (2025). Hydrogen: The outlook to 2050. Wood Mackenzie. Link to source: https://www.woodmac.com/news/opinion/hydrogen-the-outlook-to-2050/  

Du, L., Yang, Y., Bai, X., Xu, S., Lin, L., & Liu, M. (2024). Water scarcity footprint and water saving potential for large-scale green hydrogen generation: Evidence from coal-to-hydrogen substitution in China. Science of The Total Environment940, 173589. Link to source: https://doi.org/10.1016/j.scitotenv.2024.173589  

European Parliament, & Council of the European Union. (2023). Directive (EU) 2023/2413 of the European Parliament and of the Council of 18 October 2023 amending directive (EU) 2018/2001, regulation (EU) 2018/1999 and directive 98/70/EC as regards the promotion of energy from renewable sources, and repealing council directive (EU) 2015/652 (No. 2023/2413). Link to source: https://eur-lex.europa.eu/legal-content/EN/TXT/PDF/?uri=OJ:L_202302413 

Ganter, A., Lonergan, K. E., Büchi, H. M., & Sansavini, G. (2024). Shifting to low-carbon hydrogen production supports job creation but does not guarantee a just transition. One Earth7(11), 1981–1993. Link to source: https://doi.org/10.1016/j.oneear.2024.10.009  

Gasparotto, J., & Da Boit Martinello, K. (2021). Coal as an energy source and its impacts on human health. Energy Geoscience2(2), 113–120. Link to source: https://doi.org/10.1016/j.engeos.2020.07.003  

Gulli, C., Heid, B., Noffsinger, J., Waardenburg, M., & Wilthaner, M. (2024). Global energy perspectives 2023: Hydrogen outlook. McKinsey & Company. Link to source: https://www.mckinsey.com/industries/oil-and-gas/our-insights/global-energy-perspective-2023-hydrogen-outlook  

Henneman, L., Choirat, C., Dedoussi, I., Dominici, F., Roberts, J., & Zigler, C. (2023). Mortality risk from United States coal electricity generation. Science382(6673), 941–946. Link to source: https://doi.org/10.1126/science.adf4915  

Henriksen, M. S., Matthews, H. S., White, J., Walsh, L., Grol, E., Jamieson, M., & Skone, T. J. (2024). Tradeoffs in life cycle water use and greenhouse gas emissions of hydrogen production pathways. International Journal of Hydrogen Energy49, 1221–1234. Link to source: https://doi.org/10.1016/j.ijhydene.2023.08.079  

Hermesmann, M., & Müller, T. E. (2022). Green, turquoise, blue, or grey? Environmentally friendly hydrogen production in transforming energy systems. Progress in Energy and Combustion Science90, 100996. Link to source: https://doi.org/10.1016/j.pecs.2022.100996  

International Energy Agency. (2023). Towards hydrogen definitions based on their emissions intensity. Link to source: https://iea.blob.core.windows.net/assets/acc7a642-e42b-4972-8893-2f03bf0bfa03/Towardshydrogendefinitionsbasedontheiremissionsintensity.pdf  

International Energy Agency. (2024). Global hydrogen review 2024. Link to source: https://iea.blob.core.windows.net/assets/89c1e382-dc59-46ca-aa47-9f7d41531ab5/GlobalHydrogenReview2024.pdf 

International Energy Agency. (2025a). Global hydrogen review 2025. Link to source: https://iea.blob.core.windows.net/assets/12d92ecc-e960-40f3-aff5-b2de6690ab6b/GlobalHydrogenReview2025.pdf  

International Energy Agency. (2025b). Hydrogen production and infrastructure projects database March 2025 [Dataset]. Link to source: https://www.iea.org/data-and-statistics/data-product/hydrogen-production-and-infrastructure-projects-database  

International Energy Agency. (2025c). Hydrogen production and infrastructure projects database September 2025 [Dataset]. Link to source: https://www.iea.org/data-and-statistics/data-product/hydrogen-production-and-infrastructure-projects-database  

Irarrazaval, F., Albornoz, C., & Bogolasky, F. (2026). The troubled geography of green jobs: Examining the estimations and expectations of green hydrogen development in regional labor markets in Chile. Applied Geography186, 103828. Link to source: https://doi.org/10.1016/j.apgeog.2025.103828 

International Renewable Energy Agency, & Bluerisk. (2023). Water for hydrogen production. Link to source: https://www.irena.org/-/media/Files/IRENA/Agency/Publication/2023/Dec/IRENA_Bluerisk_Water_for_hydrogen_production_2023.pdf  

International Renewable Energy Agency & Methanol Institute. (2021). Innovation outlook: Renewable methanol. International Renewable Energy Agency. Link to source: https://www.methanol.org/wp-content/uploads/2020/04/IRENA_Innovation_Renewable_Methanol_2021.pdf  

Iyer, R. K., Prosser, J. H., Kelly, J. C., James, B. D., & Elgowainy, A. (2024). Life-cycle analysis of hydrogen production from water electrolyzers. International Journal of Hydrogen Energy81, 1467–1478. Link to source: https://doi.org/10.1016/j.ijhydene.2024.06.355  

Johnson, N., Liebreich, M., Kammen, D. M., Ekins, P., McKenna, R., & Staffell, I. (2025). Realistic roles for hydrogen in the future energy transition. Nature Reviews Clean Technology1(5), 351–371. Link to source: https://doi.org/10.1038/s44359-025-00050-4  

Kim, H., Song, G., & Ha, Y. (2025). Green hydrogen export potential in each Southeast Asian country based on exportable volumes and levelized cost of hydrogen. Applied Energy383, 125371. Link to source: https://doi.org/10.1016/j.apenergy.2025.125371  

Li, Y., Hao, J., & Zhou, Y. (2025). Economic analysis of different hydrogen production routes under a CO2 pricing mechanism – A levelized cost of hydrogen based study. International Journal of Hydrogen Energy128, 47–67. Link to source: https://doi.org/10.1016/j.ijhydene.2025.04.185  

National Renewable Energy Laboratory. (2021). Life cycle greenhouse gas emissions from electricity generation: update. Link to source: https://docs.nlr.gov/docs/fy21osti/80580.pdf  

Odenweller, A., & Ueckerdt, F. (2025). The green hydrogen ambition and implementation gap. Nature Energy10(1), 110–123. Link to source: https://doi.org/10.1038/s41560-024-01684-7  

Paardekooper, S., Lund, H., Chang, M., Nielsen, S., Moreno, D., & Thellufsen, J. Z. (2020). Heat Roadmap Chile: A national district heating plan for air pollution decontamination and decarbonisation. Journal of Cleaner Production272, 122744. Link to source: https://doi.org/10.1016/j.jclepro.2020.122744  

Pavan, F., Bermudez, J. M., Pizarro, A., Remme, U., & Blanco, H. (n.d.). Electrolysers. International Energy Agency. Retrieved October 10, 2025 from Link to source: https://www.iea.org/energy-system/low-emission-fuels/electrolysers  

Rodriguez, E. (2025, January 30). Low-carbon ammonia technology: Blue, green, and beyond. Rocky Mountain Institute. Link to source: https://rmi.org/low-carbon-ammonia-technology-blue-green-and-beyond/  

Smolinka, T., Bergmann, H., Garche, J., & Kusnezoff, M. (2022). The history of water electrolysis from its beginnings to the present. In Smolinka & Garche (Eds.), Electrochemical power sources: Fundamentals, systems, and applications (pp. 83–164). Elsevier. Link to source: https://doi.org/10.1016/B978-0-12-819424-9.00010-0  

The Royal Society. (2025). Natural hydrogen: Future energy and resources Policy briefing. Link to source: https://royalsociety.org/-/media/policy/projects/natural-hydrogen/natural-hydrogen-policy-briefing.pdf  

U.S. Department of Energy. (n.d.). Hydrogen production: Electrolysis. Retrieved October 10, 2025, from Link to source: https://www.energy.gov/eere/fuelcells/hydrogen-production-electrolysis  

US Environmental Protection Agency. (2025). Power sector programs—Progress report. Link to source: https://www.epa.gov/power-sector/progress-report  

Vartiainen, E., Breyer, C., Moser, D., Román Medina, E., Busto, C., Masson, G., Bosch, E., & Jäger-Waldau, A. (2022). True cost of solar hydrogen. Solar RRL6(5), 2100487. Link to source: https://doi.org/10.1002/solr.202100487  

Credits

Lead Fellow

  • Heather McDiarmid, Ph.D. 

Contributors

  • Ruthie Burrows, Ph.D.

  • James Gerber, Ph.D.

  • Daniel Jasper

  • Alex Sweeney

Internal Reviewers

  • Nina-Francesca Farac, Ph.D.

  • James Gerber, Ph.D.

  • Amanda D. Smith, Ph.D.

Effectiveness

Our analysis showed that replacing hydrogen made from fossil fuels with green hydrogen made using renewable electricity can reduce 0.012 t CO₂‑eq /kg hydrogen (20-yr and 100-yr basis, Table 1). 

This analysis does not include the emissions associated with manufacturing and installing electrolyzer equipment or the energy and emissions impacts of storing or transporting hydrogen if needed. 

left_text_column_width

Table 1. Effectiveness at reducing emissions.

Unit: t CO₂‑eq /kg green hydrogen, 100-yr basis

25th percentile 0.010
Mean 0.014
Median (50th percentile) 0.012
75th percentile 0.016
Left Text Column Width
Cost

Our estimates put the levelized cost of making hydrogen (LCOH) from coal and natural gas without any form of carbon emissions capture at US$1.90/kg hydrogen, while we estimated the LCOH of green hydrogen from renewable electricity at US$3.60/kg green hydrogen. LCOH represents the average cost to make a kilogram of hydrogen over the facility’s lifetime and includes all installation, operating, and equity costs. These values are in line with the IEA’s estimate that renewable hydrogen costs one-and-a-half to six times more than unabated fossil-fuel based production (IEA, 2024), with most of the higher cost attributed to the upfront costs (IEA, 2025a). 

The LCOH for green hydrogen shows significant variability, ranging from US$1.40/kg for hydrogen from solar in Chile (Vartiainen et al., 2022) to US$10.60/kg for hydrogen from solar in Italy (Ademollo et al., 2025). This reflects geographic differences in renewable energy generation potential and costs as well as differences in electrolyzer technologies, financing terms, and project scales (Kim et al., 2025; Li et al., 2025). Variation also arises from how renewable electricity is produced. Some modeled green hydrogen LCOH values may be underestimates due to the higher cost of operating electrolyzers at less than full capacity when intermittent renewable generation is used (Ademollo et al., 2025). 

We do not report the cost per climate impact because most of our cost data are based on theoretical values, not real projects, and because LCOH values do not include revenues. 

left_text_column_width
Learning Curve

Our data show a median learning rate of 18% for the electrolyzer technologies used to make green hydrogen (Table 2) based on five studies. In other words, for every doubling of electrolyzer capacity, the equipment costs decrease by 18%. This is a median value for many electrolyzer types, each of which varies in its technological maturity and rate of cost decline. Research is ongoing to reduce the capital cost of electrolyzers, improve the energy efficiency of the process, and increase operational lifetimes of the equipment (U.S. Department of Energy, n.d.). While these studies consistently indicate declining electrolyzer costs with cumulative electrolyzer capacity, IEA (2025a) reported that costs have recently risen, largely due to inflation. 

The basic technology for splitting water into hydrogen and oxygen using electricity was developed more than 230 years ago (Smolinka et al., 2022). The process is simple enough that it is used in high school science classes around the world, but more complex equipment is needed to make and collect hydrogen on an industrial scale. 

The production of green hydrogen requires additional equipment beyond electrolyzers, such as renewable power generators, water purification plants, and equipment to process hydrogen, all of which have their own learning rates. 

left_text_column_width

Table 2. Learning rate: drop in cost per doubling of installed electrolyzer.

Unit: %

25th percentile 15
Mean 20
Median (50th percentile) 18
75th percentile 24
Left Text Column Width
Speed of Action

Speed of action refers to how quickly a climate solution physically affects the atmosphere after it is deployed. This is different from speed of deployment, which is the pace at which solutions are adopted.

At Project Drawdown, we define the speed of action for each climate solution as emergency brake, gradual, or delayed.

Deploy Industrial Green Hydrogen Feedstock is a GRADUAL climate solution. It has a steady, linear impact on the atmosphere. 

left_text_column_width
Caveats

This analysis defines green hydrogen as hydrogen made through electrolysis using onsite renewable electricity. However, many sources only provide data for electrolytic hydrogen, clean hydrogen, or low-carbon hydrogen. Each of these includes green hydrogen but may also include electrolytic hydrogen made using grid electricity, hydrogen made from biomass, or hydrogen made from fossil fuels with carbon capture and storage. We have clearly labeled when the data refer to the more generalized low-carbon electrolytic hydrogen rather than green hydrogen.

Adoption of green hydrogen as a feedstock depends on policy support for green hydrogen, regulations to drive demand for low-carbon end products made from hydrogen (Odenweller & Ueckerdt, 2025), and standardized certification for green hydrogen, including methodologies for GHG emissions monitoring (IEA, 2025a). Regulation and permitting issues can also delay green hydrogen projects and increase overall costs. 

We assumed that manufacture of methanol, ammonia, and other industrial products currently using hydrogen as a feedstock will not shift to new processes (e.g., biological) for their production. We also assumed that naturally occurring hydrogen (sometimes called white hydrogen) and other forms of very-low-carbon hydrogen will not compete with green hydrogen for use as an industrial feedstock. 

Green hydrogen requires a supply of purified water. Removing impurities, minerals, and ions from water has a carbon footprint (Henriksen et al., 2024); that cost is not included in this analysis. 

left_text_column_width
Current Adoption

Based on IEA (2025c), we estimate that operational projects are currently making 130 million kg of green hydrogen for use as an industrial feedstock per year (Table 3). This represents less than 1% of all industrial hydrogen demand in 2024 (55 Mt) (IEA, 2025a). It may be an underestimate because we only included projects that we were able to confirm to use on-site renewable electricity or off-site renewable electricity that directly supplies the facility. 

The higher cost of green hydrogen relative to hydrogen made from fossil fuels is a major barrier to adoption, along with uncertain demand and regulatory environments (IEA, 2025a). 

left_text_column_width

Table 3. Current (2025) adoption level of green hydrogen as feedstock.

Unit: kg/yr

Estimate (from IEA (2025c) 130,000,000
Left Text Column Width
Adoption Trend

The IEA (2025a) has historical data on the production of low-carbon hydrogen using electrolysis for industrial applications; this includes green hydrogen but could also include hydrogen made from grid electricity. The data give an average annual rate of increase of 8.1 million kg/yr electrolytic hydrogen for use as an industrial feedstock and are likely an overestimate for purely green hydrogen (Table 4). Much of the added industrial low-carbon hydrogen from electrolysis was produced in China (IEA, 2025a). 

This rate of adoption is slower than expected; only 7% of anticipated 2023 projects have materialized, owing in part to high costs, limited demand, and lack of supportive policies (Odenweller & Ueckerdt, 2025). However, while there has been a decline overall in hydrogen offtake agreements, more than half of agreements signed are dedicated to the manufacture of ammonia and methanol, the two main industrial products that rely on hydrogen as a feedstock (IEA, 2025a). Between March 2025 and September 2025, the estimated production volume from operational industrial green hydrogen feedstock projects increased from 32 million kg/yr to 130 million kg/yr (data extracted from IEA, 2025b, 2025c).

left_text_column_width

Table 4. Low-carbon electrolytic hydrogen as feedstock, 2021–2024 adoption trend.

Unit: kg hydrogen/yr

Estimate (from IEA 2025a) 8,100,000
Left Text Column Width
Adoption Ceiling

Current demand for hydrogen as an industrial feedstock is 50 billion kg/yr (Table 5), all of which technically could be supplied with green hydrogen. This value is based on the IEA (2025a)’s estimate of 2024 industrial hydrogen demand, with 90% allocated to its use as a feedstock for ammonia and methanol production. Since demand for industrial hydrogen for ammonia production increased by 3.4% and for methanol production by 2.0% in 2023 (IEA, 2025a), the actual adoption ceiling will increase as the production of industrial hydrogen increases. 

left_text_column_width

Table 5. Green hydrogen as a feedstock adoption ceiling.

Unit: kg/yr

Estimate (from IEA 2025a) 50,000,000,000
Left Text Column Width
Achievable Adoption

We estimated that 26–50 billion kg/yr of fossil-based hydrogen could be replaced with green hydrogen as an industrial feedstock by 2050, which is 53–100% of today’s total demand (Table 6).

The Achievable – Low adoption level is an average of McKinsey & Company and Wood Mackenzie’s estimated percent of hydrogen supplied by “clean” or “low-carbon” hydrogen in 2050, which presumably includes hydrogen made from fossil fuels with capture of carbon emissions (Douglas et al., 2025; Gulli et al., 2024). Wood Mackenzie projects that only 33% of traditional carbon-intensive hydrogen will be replaced with low-carbon hydrogen, while McKinsey & Company expects at least 73% of hydrogen demand to be met with clean hydrogen. These estimates may be low, given that the EU has committed to deriving 42% of industrial hydrogen from renewable sources by 2030 and 60% by 2035 (European Parliament & Council of the European Union, 2023). 

The Achievable – High adoption level is set at 100% of today’s industrial feedstock hydrogen, consistent with McKinsey & Company’s upper-end projection that all hydrogen demand could be met by clean hydrogen by 2050 (Gulli et al., 2024). 

Table 6. Green hydrogen as a feedstock range of achievable adoption levels (kg hydrogen/yr).

left_text_column_width

Table 6. Green hydrogen as a feedstock range of achievable adoption levels.

Unit: kg hydrogen/yr

Current adoption 130,000,000
Achievable – low 26,000,000,000
Achievable – high 50,000,000,000
Adoption ceiling 50,000,000,000
Left Text Column Width

Current adoption of green hydrogen as an alternative is too low to have a globally meaningful climate impact (less than 0.002 Gt CO₂‑eq/yr estimated on both 20- and 100-year basis). We estimate that green hydrogen could reduce 0.31 Gt CO₂‑eq/yr (100- and 20-year basis) of emissions at the Achievable – Low level and 0.60 Gt CO₂‑eq/yr (100- and 20-year basis) at the Achievable – High level (Table 7). This outcome is closely aligned with the IEA’s estimate that in 2023, industrial hydrogen use was responsible for 680 Mt CO₂‑eq/yr, 90% (0.61 Gt CO₂‑eq/yr ) of which is used as a feedstock for ammonia and methanol production (IEA, 2024). 

left_text_column_width

Table 7. Green hydrogen as a feedstock climate impact at different levels of adoption.

Unit: Gt CO₂‑eq/yr, 100-yr basis

Current adoption 0.00
Achievable – low 0.31
Achievable – high 0.60
Adoption ceiling 0.60
Left Text Column Width
Additional Benefits

Income and Work

Research on the direct linkages of green hydrogen with employment is limited; however, the development and adoption of this technology is expected to create jobs (Anand et al., 2025). One study of the expansion of green hydrogen in Europe projected that by 2050, shifting to low-carbon hydrogen would directly create 18,000–50,000 jobs (Ganter et al., 2024). This is mostly driven by the higher labor demand of the electrolysis process. Some jobs associated with green hydrogen are in the construction sector and would not be permanent (Irarrazaval et al., 2026).

Health

Reducing air pollution by switching from fossil fuels to renewable energy decreases exposure to pollutants such as lead and fine particulate matter generated when hydrogen is made from fossil fuels, thereby improving the health of nearby communities (Cho et al., 2022; U.S. Environmental Protection Agency [U.S. EPA], 2025). These pollutants have been linked to increased morbidity from cardiovascular and respiratory disease, asthma, infections, and cancer (Gasparotto & Martinello, 2021) and to increased risk of premature mortality (Henneman et al., 2023).

Water Resources

Green hydrogen production is more water-efficient than most other types of hydrogen production, but water resource benefits can vary based on geography and renewable energy source (IRENA & Bluerisk, 2023; Du et al., 2024).

Air Quality

Displacing fossil fuel–based hydrogen with renewable energy–based hydrogen will reduce climate and air pollutants associated with burning higher-carbon fuels, such as CO₂, nitrogen oxides, methane, lead, and fine particulate matter (Anand et al., 2025; Cho et al., 2022; Paardekooper et al., 2020; U.S. EPA, 2025).

left_text_column_width
Risks

Investments in green hydrogen policies and programs to support its use as a feedstock can also support its use as a fuel. Many potential applications for green hydrogen as a fuel, however, are less practical, cost-effective, and efficient than direct electrification, and investments in green hydrogen infrastructure risk diverting efforts away from these better alternatives (Johnson et al., 2025). 

Green hydrogen production requires a water supply. Many existing and planned green hydrogen projects are in water-stressed regions, including China, India, the Gulf States, and parts of the European Union (IRENA & Bluerisk, 2023). However, hydrogen production by other processes also requires a water supply and can exceed the water demand for green hydrogen (Henriksen et al., 2024). 

left_text_column_width
Interactions with Other Solutions

Competing

Methanol made from industrial green hydrogen could compete with biomass-derived methanol, a product of the Deploy Low-Emission Industrial Feedstocks solution, thereby reducing that solution’s impact. 

left_text_column_width
Dashboard

Solution Basics

kg

t CO₂-eq (100-yr)/unit/yr
00.010.012
units/yr
Current 1.3×10⁸ 02.6×10¹⁰5.0×10¹⁰
Achievable (Low to High)

Climate Impact

Gt CO₂-eq (100-yr)/yr
Current 0 0.310.6
Gradual

CO₂

Trade-offs

There are embodied emissions associated with manufacturing and installing any industrial equipment, including the equipment used to make hydrogen of all kinds and renewable energy. Such emissions are not included in the analysis here, but they can be significant and their value depends on a variety of factors (Hermesmann & Müller, 2022; Iyer et al., 2024, National Renewable Energy Laboratory [NREL], 2021).

left_text_column_width
Action Word
Deploy
Solution Title
Industrial Green Hydrogen
Classification
Highly Recommended
Lawmakers and Policymakers
  • Evaluate and implement green hydrogen feedstock proposals and policies independently of other green hydrogen solutions, such as green hydrogen fuels (see Mobilize Green Hydrogen for Aviation and Trucking).
  • Before approval, conduct thorough reviews of project proposals to ensure statistical rigor and feasibility of business plans; consider requiring beneficiaries of public incentives to have offtake agreements in place; create legal tools to claw back financial incentives if products fail to achieve targeted emissions intensities.
  • Ensure laws and regulations related to green hydrogen use as a feedstock are data-driven and adaptive with short review cycles to remain timely and relevant to the markets; avoid delays leading to loss of investments and project failures.
  • Use both demand- and supply-side interventions to help create stable markets for products made from green hydrogen, ensuring those products are suitable uses for green hydrogen given the alternatives available.
  • Seek to streamline permitting processes while aligning regulations with social and environmental safeguards.
  • Set into place policies to develop strong domestic renewable energy industries concurrently with policies promoting green hydrogen as a feedstock.
  • Offer incentives to relevant actors such as subsidies, grants, guarantees, concessional finance, public investments, tax credits, and contracts for difference for green hydrogen production for use as a feedstock and their derivatives; as the market matures and becomes competitive, gradually reduce these incentives to create long-term market stability.
  • Set into place demand-side policies such as sectoral quotas and mandates for products such as ammonia and methanol made with green hydrogen, but avoiding subsidies for uses that are better served by other low-carbon solutions.
  • Create or improve robust certification schemes for green hydrogen; include clear governance models, standards for how hydrogen would be tested, systems and timelines for evaluation, and enforcement and verification mechanisms.
  • Set deadlines for the retirement of fossil-fuel hydrogen plants for ammonia and methanol production.
  • Work with industry to develop domestic and/or diverse supply chains for electrolyzers and related components.
  • Help establish robust certification systems for low-carbon versions of common hydrogen products such as ammonia and methanol; develop information campaigns to help foster demand.
  • Design incentives and policies to stimulate local or regional production and advance R&D – particularly, to reduce costs and boost efficiency of commercial-scale electrolyzers.
  • Carefully conduct water supply and stress analyses for potential green hydrogen production sites to determine the impact a plant might have on the surrounding communities before approving; require green hydrogen facilities to regularly report on water use metrics.
  • Seek to locate green hydrogen plants near end users to facilitate transport and reduce costs.
  • Implement carbon taxes and remove subsidies from fossil fuel hydrogen.
  • Create regulations that limit the potential for hydrogen leakage and institute monitoring systems to reduce and/or eliminate leakage from infrastructure.
  • Consider creating market platforms and digital product passports that coordinate supply and demand and facilitate uptake for products made with green hydrogen such as ammonia and methanol.

Further information:

Practitioners
  • Design green hydrogen feedstock proposals independent of other green hydrogen solutions, such as green hydrogen fuels (see Mobilize Green Hydrogen for Aviation and Trucking).
  • Stay abreast of policies, regulations, developments to the enabling infrastructure, and the cost-competitiveness of green hydrogen to ensure your company is well positioned to take advantage of incentives, stays in compliance, and is able to respond to changing market conditions.
  • Take advantage of government incentives such as subsidies, grants, guarantees, concessional loans, public investments, tax credits, and contracts-for-difference; as the market matures and becomes competitive, gradually reduce your reliance on these incentives to create long-term market stability.
  • Take advantage of demand-side policies such as sectoral quotas and mandates.
  • Consider using green bonds to finance public projects or to de-risk markets.
  • Seek long-term flexible offtake agreements with both public and private actors; aim to establish the agreement before seeking publicly offered financial incentives.
  • Carefully conduct water supply and stress analyses for potential green hydrogen production sites to determine the impact a plant might have on the surrounding communities before approving; regularly report on water use metrics.
  • Seek to locate green hydrogen feedstock plants near end users to facilitate transport and reduce costs.
  • Identify and help foster markets in which consumers are willing to pay a premium for low-emissions products made from green hydrogen.
  • Establish leak detection and repair programs; invest in R&D to improve leak detection, mitigation, and repair.
  • Ensure project proposals are data-driven and statistically rigorous; do not announce green hydrogen feedstock projects prematurely or without commitments to follow through.
  • Join, help create, or improve existing certification schemes for green hydrogen, include clear governance models, standards for how hydrogen would be tested, systems and timelines for evaluation, and enforcement and verification mechanisms; voluntarily certify your operations if it is not required.
  • Commit to transparent business practices and provide publicly available data on aspects of production such as emissions intensity, cost, compliance, product life cycle, and other relevant components to facilitate policy and investment; help create open databases for hydrogen producers to share this information; verify data with third-party auditors.
  • Work with policymakers to develop domestic and/or diverse supply chains for electrolyzers and related components.
  • Invest in R&D, particularly to reduce costs and boost efficiency of commercial-scale electrolyzers.
  • Regularly monitor impacts of production facilities, – especially when using seawater for cooling, to minimize risks and harms to human well-being and/or nature.
  • Help standardize analysis for life-cycle impacts of green hydrogen to improve global comparisons.
  • Voluntarily use market platforms and digital product passports to coordinate supply and demand and facilitate uptake for products made with green hydrogen, such as ammonia and methanol.

Further information:

Business Leaders
  • Evaluate and implement green hydrogen feedstock proposals and policies independently of other green hydrogen solutions, such as green hydrogen fuels (see Mobilize Green Hydrogen for Aviation and Trucking).
  • Set realistic goals for green hydrogen as a feedstock, if relevant; incorporate them into corporate net-zero strategies.
  • Enter into long-term offtake agreements with green hydrogen producers or manufacturers that use green hydrogen; consider forming consortia to allow offtakers to act as equity partners.
  • Help cultivate demand by advertising the use of green hydrogen in your products, including end-use products such as food grown with fertilizers produced by green hydrogen.
  • Seek to de-risk green hydrogen production by investing in domestic and/or diverse supply chains, supportive infrastructure, and related equipment such as renewable energy production.
  • Take advantage of government incentives such as tax credits, if possible; seek to gradually reduce reliance on these incentives to create long-term market stability.
  • Join, help create, or improve existing certification schemes for green hydrogen, include clear governance models, standards for how hydrogen would be tested, systems and timelines for evaluation, and enforcement and verification mechanisms; voluntarily certify your operations and supply chain if certification is not required.

Further information:

Nonprofit Leaders
  • Propose green hydrogen feedstock programs and policies independent of other green hydrogen solutions, such as green hydrogen fuels (see Mobilize Green Hydrogen for Aviation and Trucking).
  • Operate or help with equipment testing and certification systems, market information disclosures, and onsite monitoring.
  • Urge governments to set into place long-term regulations, using both demand- and supply-side interventions to help create stable markets for products made from green hydrogen; when possible, urge policymakers to align regulations with international standards to facilitate trade – particularly for equipment needed to produce green hydrogen.
  • Advocate for policies that develop strong domestic renewable energy industries concurrently with policies promoting green hydrogen as a feedstock.
  • Join, help create, or improve existing certification schemes for green hydrogen, include clear governance models, standards for how hydrogen would be tested, systems and timelines for evaluation, and enforcement and verification mechanisms.
  • Advocate for financial incentives and favorable policies for products such as ammonia and methanol made from green hydrogen; urge policymakers to gradually reduce subsidies and replace them with market mechanisms such as fixed pricing or contracts for difference as the market matures.
  • Advocate for deadlines for the retirement of fossil-fuel hydrogen plants.
  • Help establish robust certification systems for common products such as ammonia and methanol; develop information campaigns to help foster demand.
  • Advocate for public incentives and policies to advance R&D, particularly to reduce costs and boost efficiency of commercial-scale electrolyzers; carry out open-access research on relevant topics to improve adoption, safety, cost, and efficiency.
  • Conduct water supply and stress analyses for potential green hydrogen production sites to determine the impact a plant might have on the surrounding communities.
  • Regularly monitor impacts of production facilities, especially when using seawater for cooling, to minimize risks and harms to human well-being and/or nature.
  • Advocate for carbon taxes and the removal of subsidies from fossil fuel hydrogen.
  • Create requirements, standards, and programs for digital product passports that coordinate supply and demand and facilitate uptake for products such as ammonia and methanol made with green hydrogen.

Further information:

Investors
  • Invest in green hydrogen feedstock projects independently of other green hydrogen solutions, such as green hydrogen fuels (see Mobilize Green Hydrogen for Aviation and Trucking).
  • Invest directly in the development of green hydrogen feedstock projects.
  • Offer low-interest loans, guarantees, and concessional financing for manufacturers, developers, and operators of green hydrogen feedstock projects; extend these investments to related technology such as renewable energy and water purification; offer these investments to products such as ammonia and methanol made from green hydrogen feedstock.
  • Directly invest in companies that produce end-use products such as food produced with fertilizers made from green hydrogen.
  • Invest in R&D, component technology, and related science, especially in areas that reduce costs, boost efficiency, improve longevity, and decrease material inputs; invest in projects or companies that improve the modularity for electrolyzers and related components to improve mass production.
  • Help de-risk green hydrogen feedstock production in low- and middle-income countries by offering low-interest loans, concessional financing, and/or favorable terms.
  • Align investments with existing voluntary agreements or voluntary guidance that might apply in the location of the investment (including those that apply to biodiversity).

Further information:

Philanthropists and International Aid Agencies
  • Provide financing directly for the development of green hydrogen feedstock projects and ensure they are independent of other green hydrogen solutions, such as green hydrogen fuels (see Mobilize Green Hydrogen for Aviation and Trucking).
  • Help de-risk green hydrogen feedstock production in low- and middle-income countries (LMICs) by offering grants or access to concessional financing for green hydrogen feedstock production.
  • Offer similar grants and financing for related technologies such as renewable energy and water purification; offer the same support for production of end-use products such as ammonia and methanol.
  • Operate or support efforts for equipment testing and certification systems, market information disclosures, and onsite monitoring.
  • Enter into long-term offtake agreements with manufacturers that use green hydrogen.
  • Urge governments to set into place long-term regulations, using both demand- and supply-side interventions to help create stable markets for products of green hydrogen; when possible, urge policymakers to align regulations with international standards to facilitate trade – particularly for equipment needed to produce green hydrogen.
  • Advocate for policies that develop strong domestic renewable energy industries concurrently with policies promoting green hydrogen as a feedstock.
  • Join, help create, or improve existing certification schemes for green hydrogen, include clear governance models, standards for how hydrogen would be tested, systems and timelines for evaluation, and enforcement and verification mechanisms.
  • Advocate for financial incentives and favorable policies for equipment needed to produce green hydrogen such as renewable power generators and water purification plants.
  • Advocate for financial incentives and favorable policies for products such as ammonia and methanol made from green hydrogen; urge policymakers to gradually reduce subsidies and replace them with market mechanisms such as fixed pricing or contracts for difference as the market matures.
  • Advocate for deadlines for the retirement of fossil-fuel hydrogen plants.
  • Help establish robust certification systems for common products such as ammonia and methanol; develop information campaigns to help foster demand.
  • Advocate for public incentives and policies to advance R&D, particularly to reduce costs and boost efficiency of commercial-scale electrolyzers; carry out open-access research on relevant topics to improve adoption, safety, cost, and efficiency.
  • Fund projects that provide water supply and stress analysis for potential green hydrogen production sites to determine the impact a plant might have on the surrounding communities.
  • Provide funding or assistance to projects that regularly monitor impacts of production facilities, especially when using seawater for cooling, to minimize risks and harms to human well-being and/or nature.
  • Advocate for carbon taxes and the removal of subsidies from fossil-fuel hydrogen.
  • Help establish international standards for measuring hydrogen leaks and help collect related data.
  • Create requirements, standards, and programs for digital product passports that coordinate supply and demand and facilitate uptake of products made with green hydrogen such as ammonia and methanol.

Further information:

Thought Leaders
  • Promote green hydrogen feedstock programs and policies independently of other green hydrogen solutions, such as green hydrogen fuels (see Mobilize Green Hydrogen for Aviation and Trucking).
  • Operate or help with equipment testing and certification systems, market information disclosures, and onsite monitoring.
  • Urge governments to set into place long-term regulations, using both demand- and supply-side interventions to help create stable markets for products of green hydrogen; when possible, urge policymakers to align regulations with international standards to facilitate trade – particularly for equipment needed to produce green hydrogen.
  • Advocate for policies that develop strong domestic renewable energy industries concurrently with policies promoting green hydrogen as a feedstock.
  • Join, help create, or improve existing certification schemes for green hydrogen, include clear governance models, standards for how hydrogen would be tested, systems and timelines for evaluation, and enforcement and verification mechanisms.
  • Advocate for financial incentives and favorable policies for equipment needed to produce green hydrogen feedstocks such as renewable power generators and water purification plants.
  • Advocate for financial incentives and favorable policies for products such as ammonia and methanol made from green hydrogen; urge policymakers to gradually reduce subsidies and replace them with market mechanisms such as fixed pricing or contracts for difference as the market matures.
  • Advocate for deadlines for the retirement of fossil-fuel hydrogen plants.
  • Help establish robust certification systems for common products such as ammonia and methanol; develop information campaigns to help foster demand.
  • Advocate for public incentives and policies to advance R&D, particularly to reduce costs and boost efficiency of commercial-scale electrolyzers; carry out open-access research on relevant topics to improve adoption, safety, cost, and efficiency.
  • Advocate for and/or conduct water supply and stress analysis for potential green hydrogen production sites and advocate for measures to avoid or redress harm to surrounding communities.
  • Regularly monitor impacts of production facilities, especially when using seawater for cooling, to minimize risks and harms to human well-being and/or nature.
  • Advocate for carbon taxes and removal of subsidies from fossil-fuel hydrogen.
  • Help standardize analysis for life-cycle impacts of green hydrogen to improve global comparisons.
  • Create requirements, standards, and programs for digital product passports that coordinate supply and demand and facilitate uptake for products such as ammonia and methanol made with green hydrogen.

Further information:

Technologists and Researchers
  • Develop electrolyzer technology for commercial-scale equipment to reduce costs, boost efficiency, improve longevity, and decrease material inputs; help improve modularity for electrolyzers and related components to improve mass production.
  • Improve cooling technology to increase water efficiency, reduce costs, and mitigate impacts on human well-being and the environment.
  • Develop and further improve upon air-cooling technologies.
  • Develop more sensitive leak detection equipment to identify smaller leaks that often go undetected by current technology.

Further information:

Communities, Households, and Individuals
  • Promote green hydrogen feedstock programs and policies independently of other green hydrogen solutions, such as green hydrogen fuels (see Mobilize Green Hydrogen for Aviation and Trucking).
  • Advocate for thorough reviews of project proposals to ensure statistical rigor and feasibility of business plans; consider requiring beneficiaries of public incentives to have offtake agreements in place; suggest legal tools to claw back financial incentives if products fail to achieve targeted emissions intensities.
  • Advocate for policies that develop strong domestic renewable energy industries concurrently with policies promoting green hydrogen as a feedstock.
  • Advocate for financial incentives and favorable policies for equipment needed to produce green hydrogen such as renewable power generators and water purification plants.
  • Advocate for deadlines for the retirement of fossil-fuel hydrogen plants.
  • Advocate for carbon taxes and removal of subsidies for fossil fuel hydrogen.

Further information:

Evidence Base

Consensus of effectiveness in reducing emissions: High

Green hydrogen that replaces fossil fuel–based hydrogen is widely regarded as an important approach for reducing emissions from this industrial feedstock. Blue hydrogen, made from fossil fuels with carbon capture and storage, competes with green hydrogen as a feedstock. However, incomplete carbon capture alongside methane leaks from natural gas extraction and transportation give blue hydrogen a notably higher carbon footprint (IEA, 2023). 

The IEA publishes an annual report on global hydrogen, including updates to global demand for hydrogen by sector, production routes, trade, investments, and policies (IEA, 2024, 2025a). These reports highlight how low-carbon electrolytic hydrogen production is increasing, albeit at a slower pace than previously expected. With 65 countries now having a hydrogen strategy and new policies being implemented in key regions, low-carbon hydrogen demand is expected to grow, with most new investments focused on low-carbon hydrogen as an industrial feedstock. 

Accelerating this growth is critically important to meet established GHG emission targets. Odenweller and Ueckerdt (2025) highlighted how plans for green hydrogen should focus on hard-to-electrify sectors, including industrial hydrogen feedstocks. They also emphasized the need for policymakers to use demand-side policies such as quotas and mandates along with developing plans to transition subsidies to market mechanisms such as fixed pricing mechanisms for green hydrogen and contracts for difference. 

The results presented in this document summarize findings from four reviews and meta-analyses, two databases, three reports, and 11 original studies reflecting current evidence from 10 countries, primarily China and the United States. We recognize this limited geographic scope creates bias, and hope this work inspires research and data sharing on this topic in underrepresented regions.

left_text_column_width
Updated Date

Increase Industrial Electrification

Image
Image
Industrial electrification
Coming Soon
On
Description for Social and Search
The Increase Industrial Electrification solution is coming soon.
Action Word
Increase
Solution Title
Industrial Electrification
Classification
Highly Recommended
Updated Date

Deploy Low-Emission Industrial Feedstocks

Image
Image
Low-emission industrial feedstocks
Coming Soon
On
Description for Social and Search
The Deploy Low-Emission Industrial Feedstocks solution is coming soon.
Action Word
Deploy
Solution Title
Low-Emission Industrial Feedstocks
Classification
Highly Recommended
Updated Date
Subscribe to

Drawdown Delivered

Join the 85,000+ subscribers discovering how to drive meaningful climate action around the world! Every other week, you'll get expert insights, cutting-edge research, and inspiring stories.

Receive biweekly email newsletter updates from Project Drawdown. Unsubscribe at any time.

Support Climate Action