Drawdown Roadmap

The Drawdown Roadmap is a science-based strategy for accelerating climate solutions. It points to which climate actions governments, businesses, investors, philanthropists, community organizations, and others should prioritize to make the most of our efforts to stop climate change.

By showing how to strategically mobilize solutions across sectors, time, and place, engage the power of co-benefits, and recognize and remove obstacles, the Drawdown Roadmap charts a path to accelerate climate solutions before it’s too late.

Drawdown Roadmap Summary

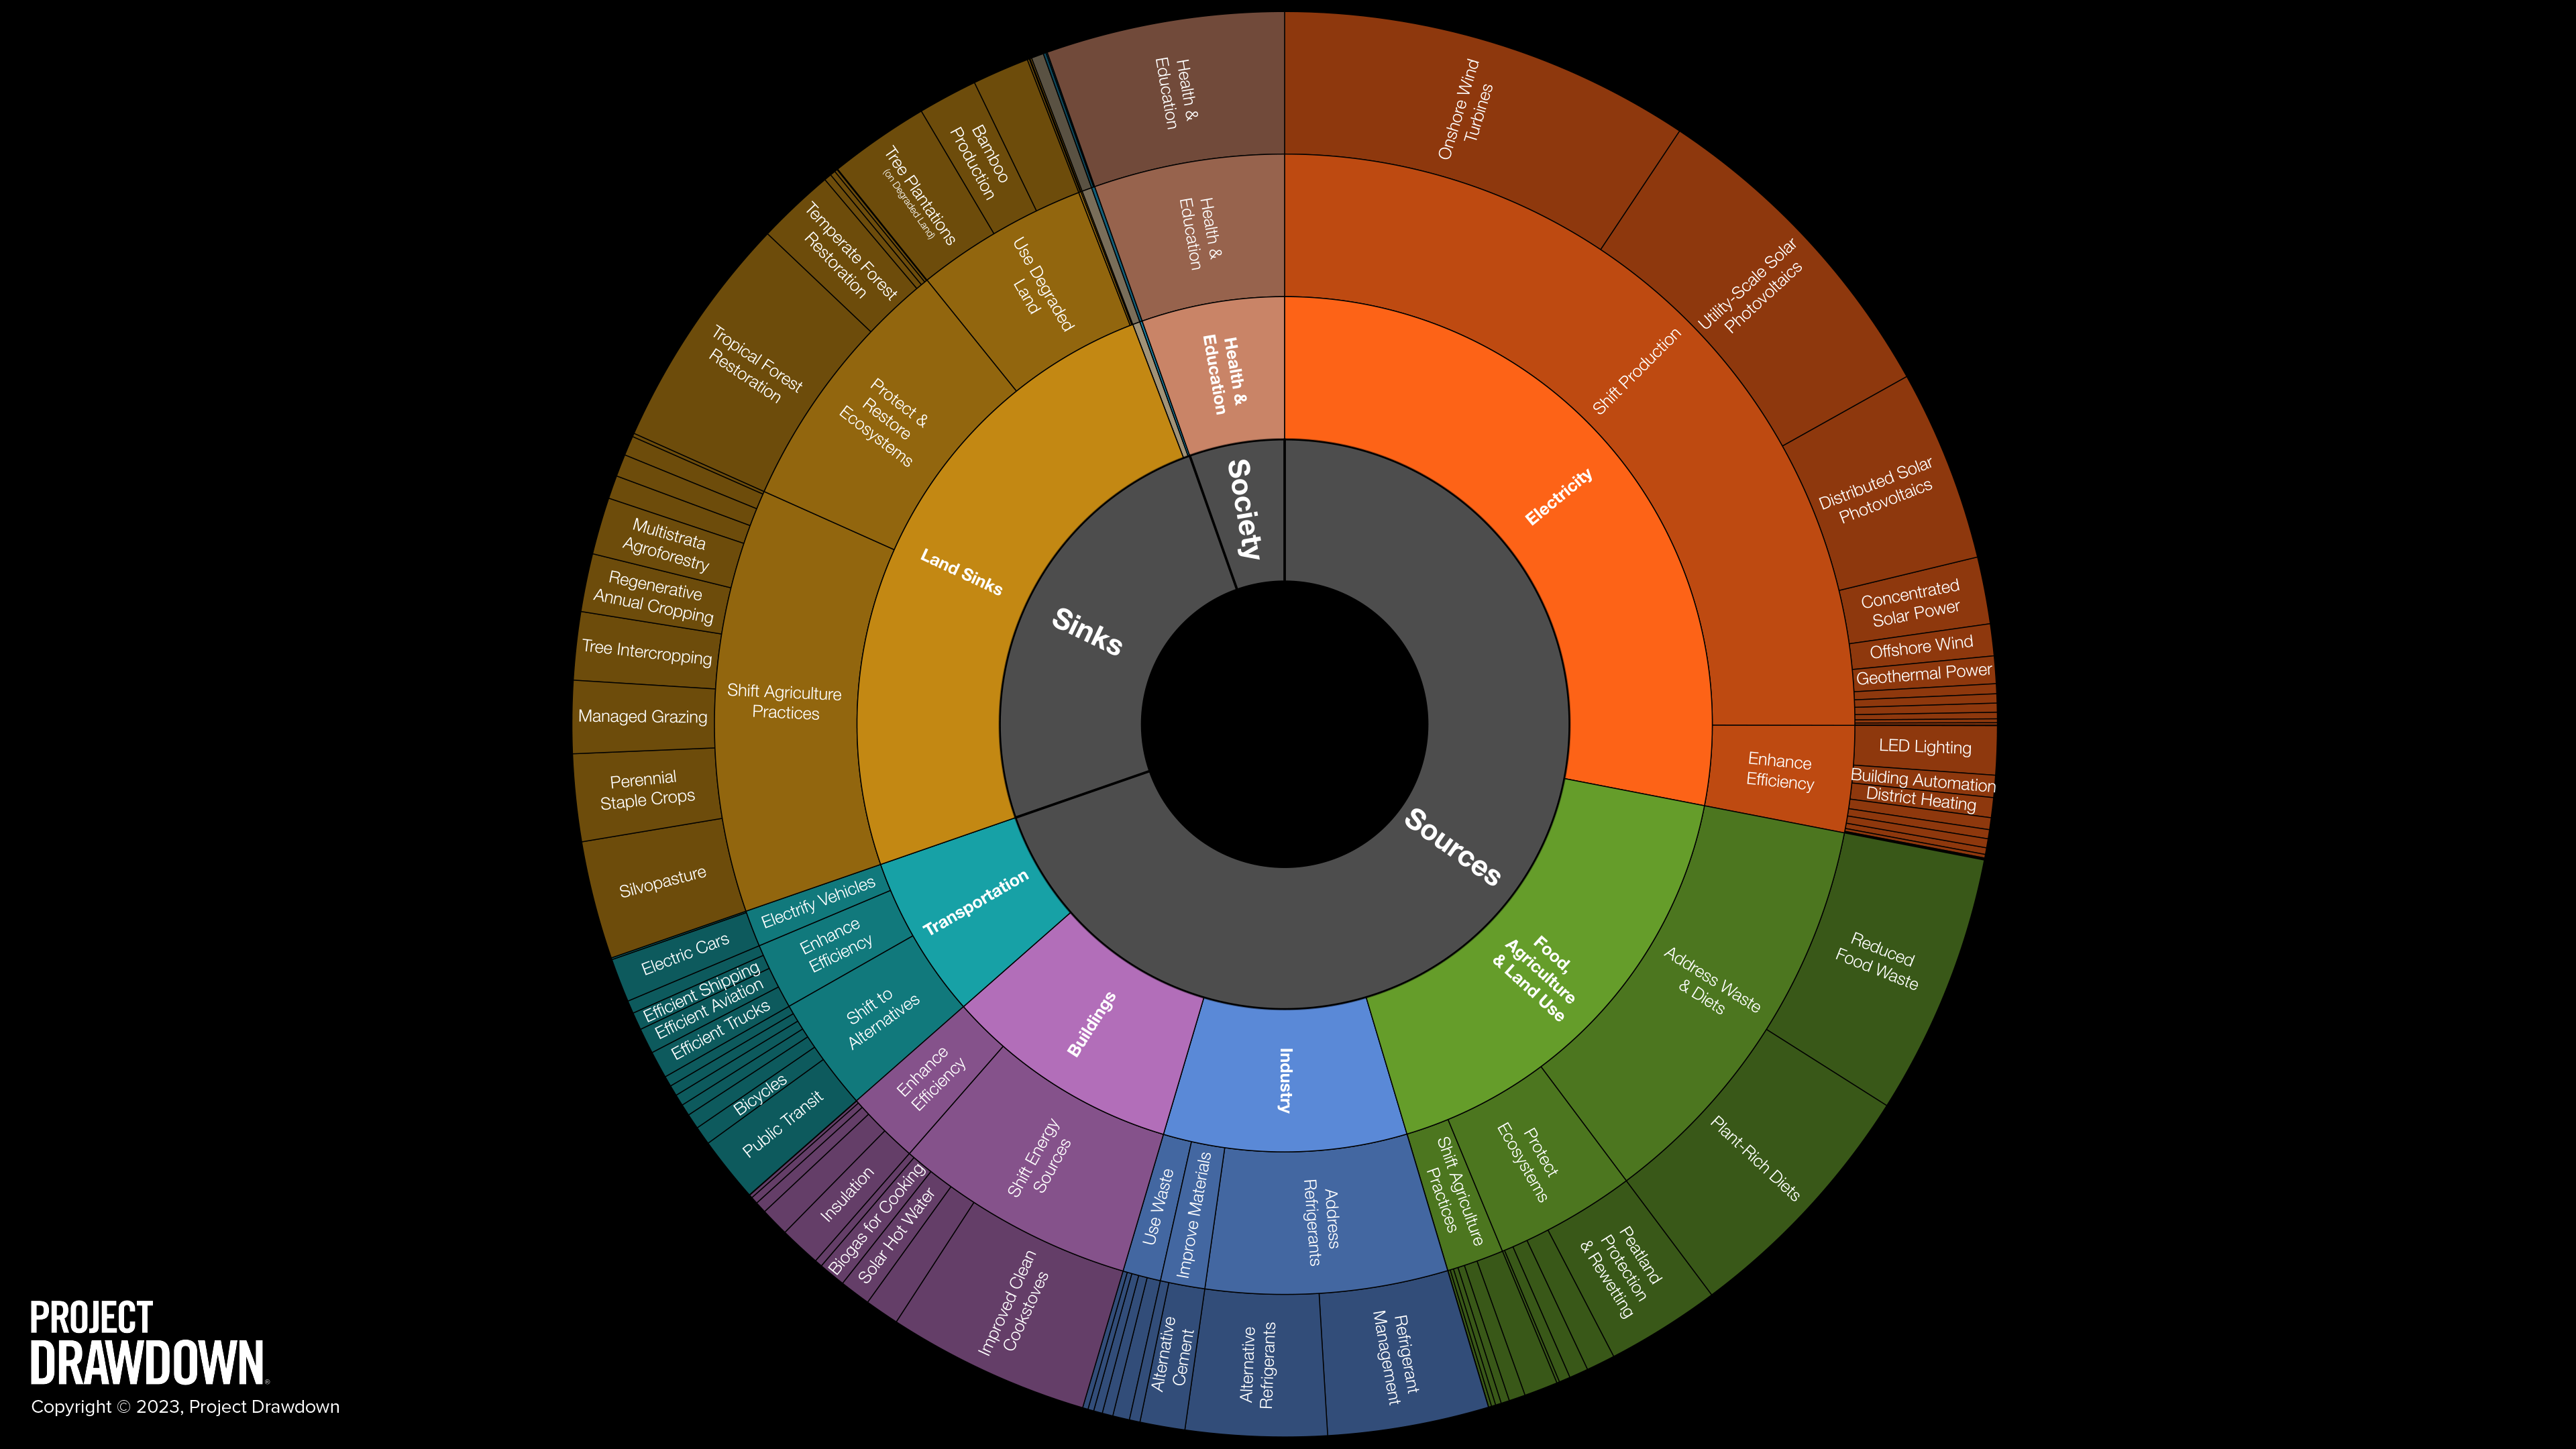
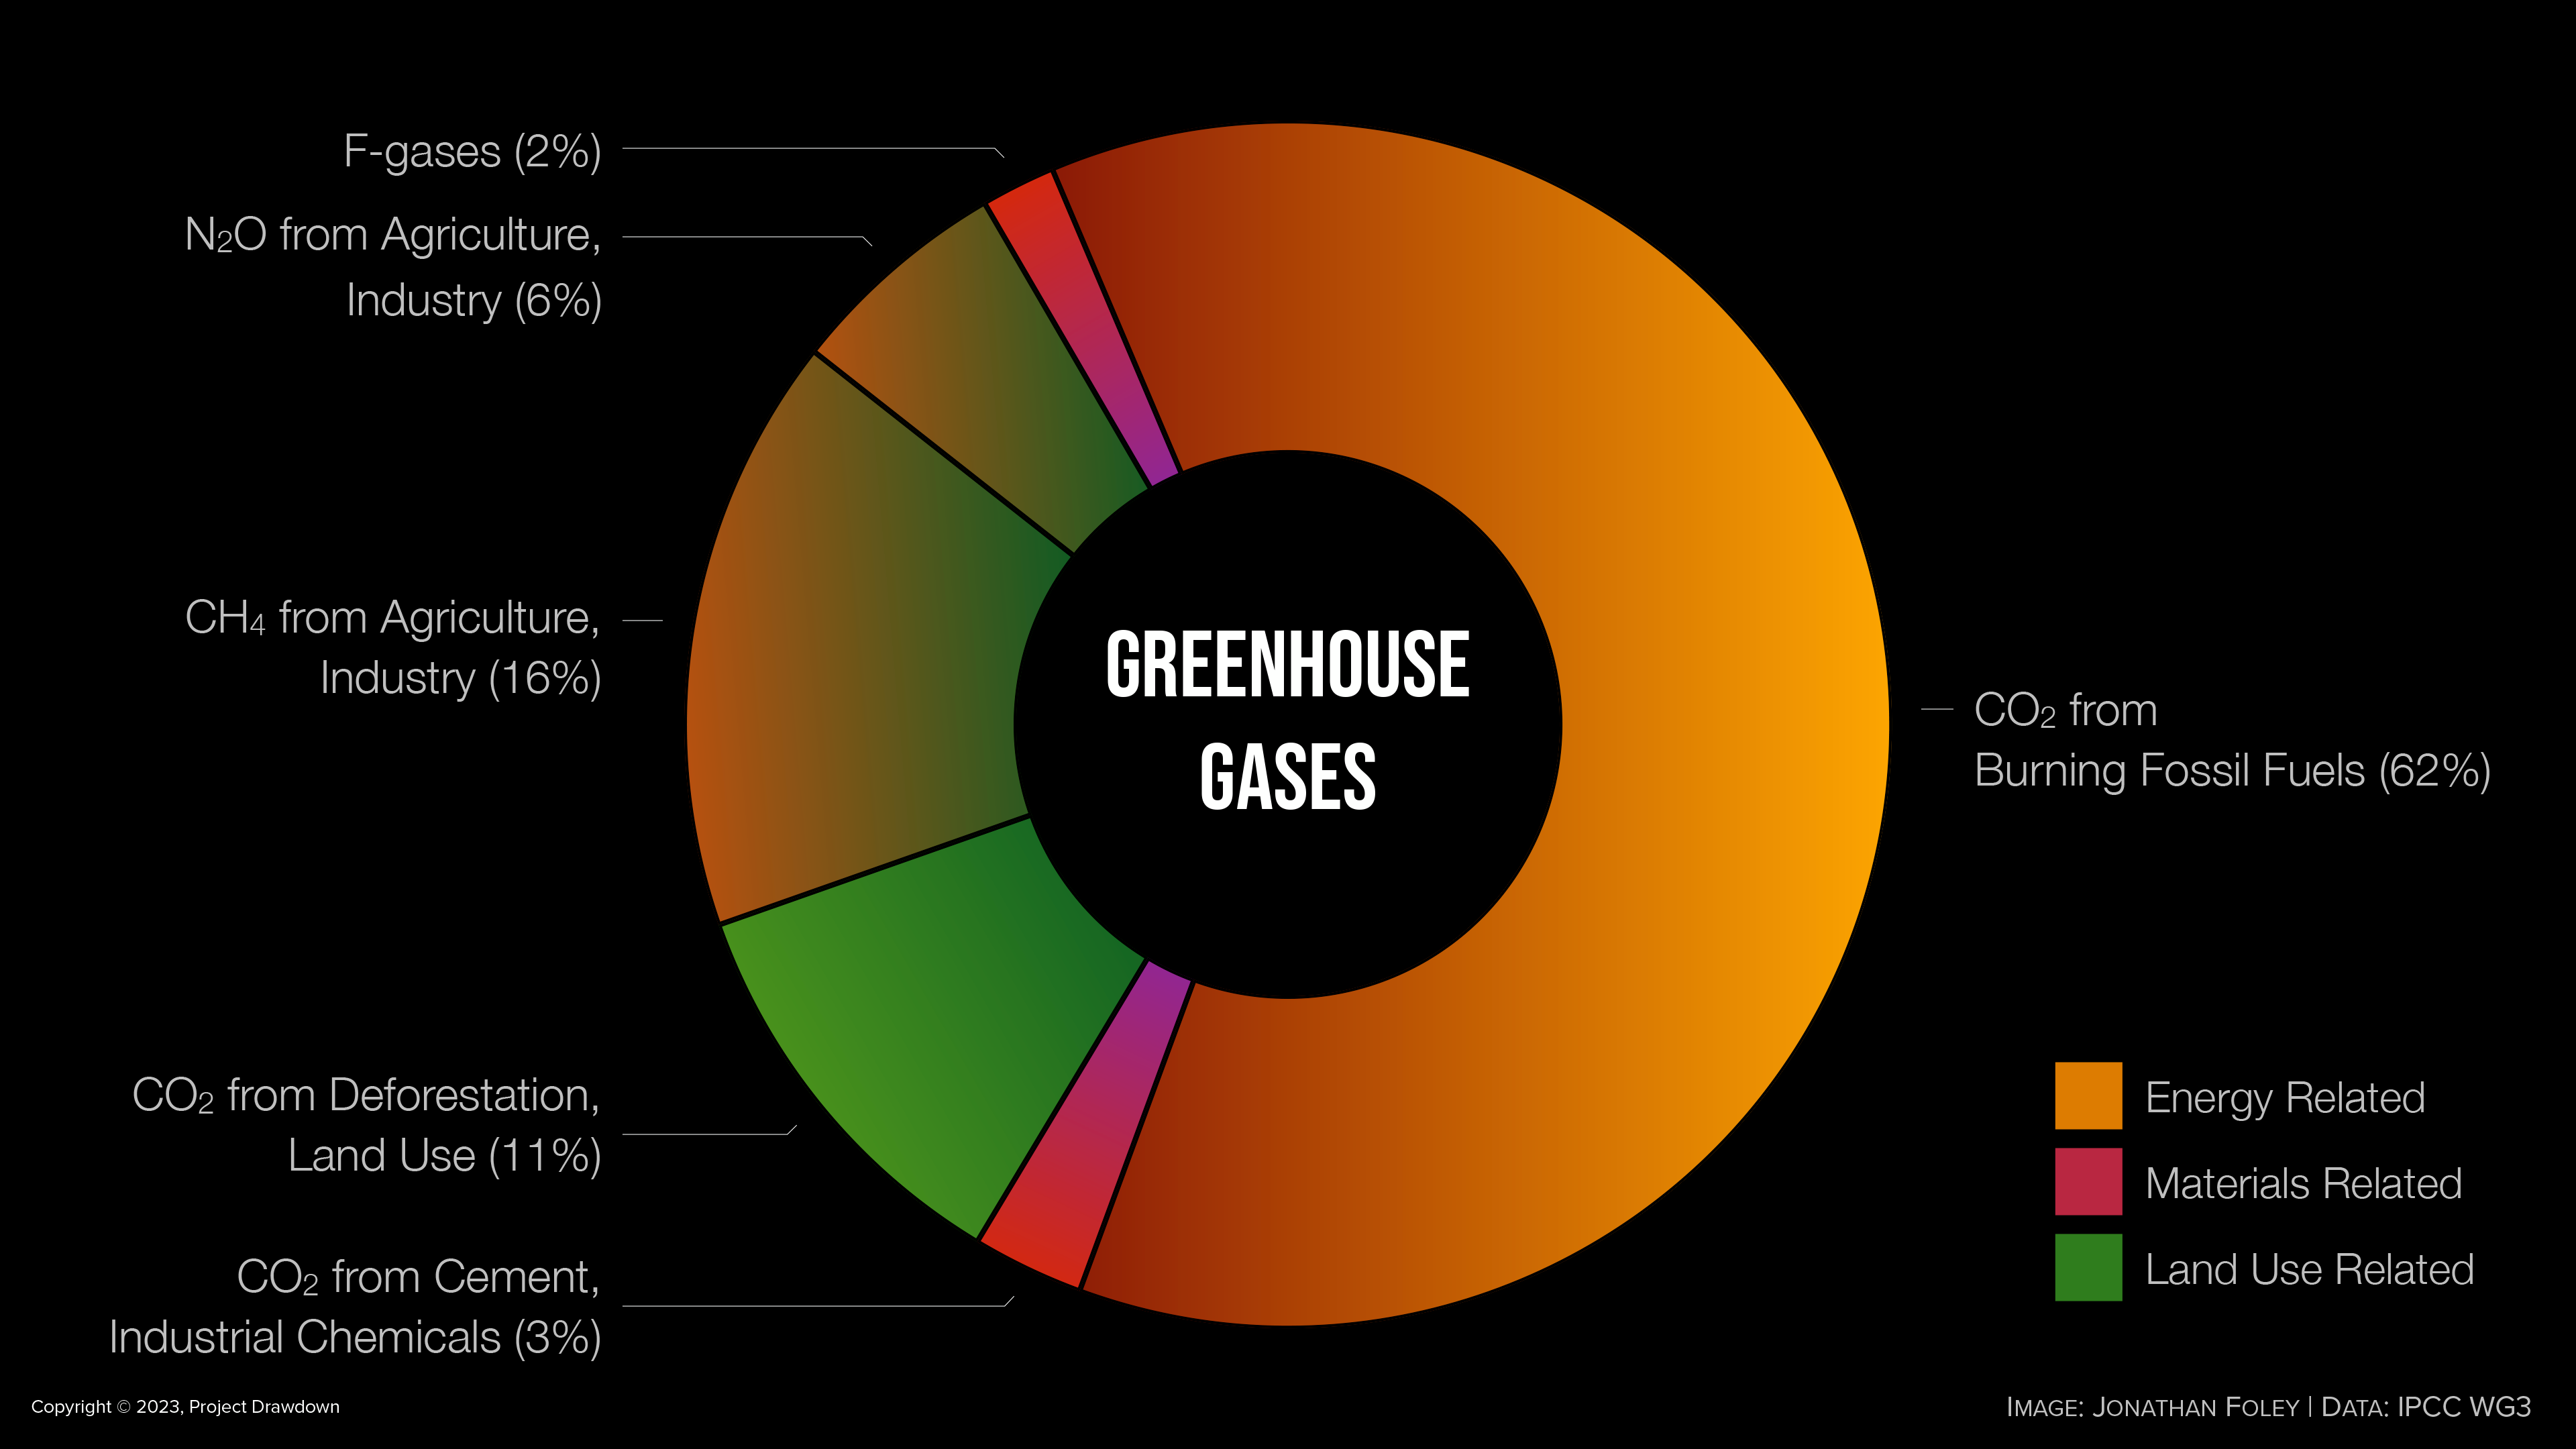
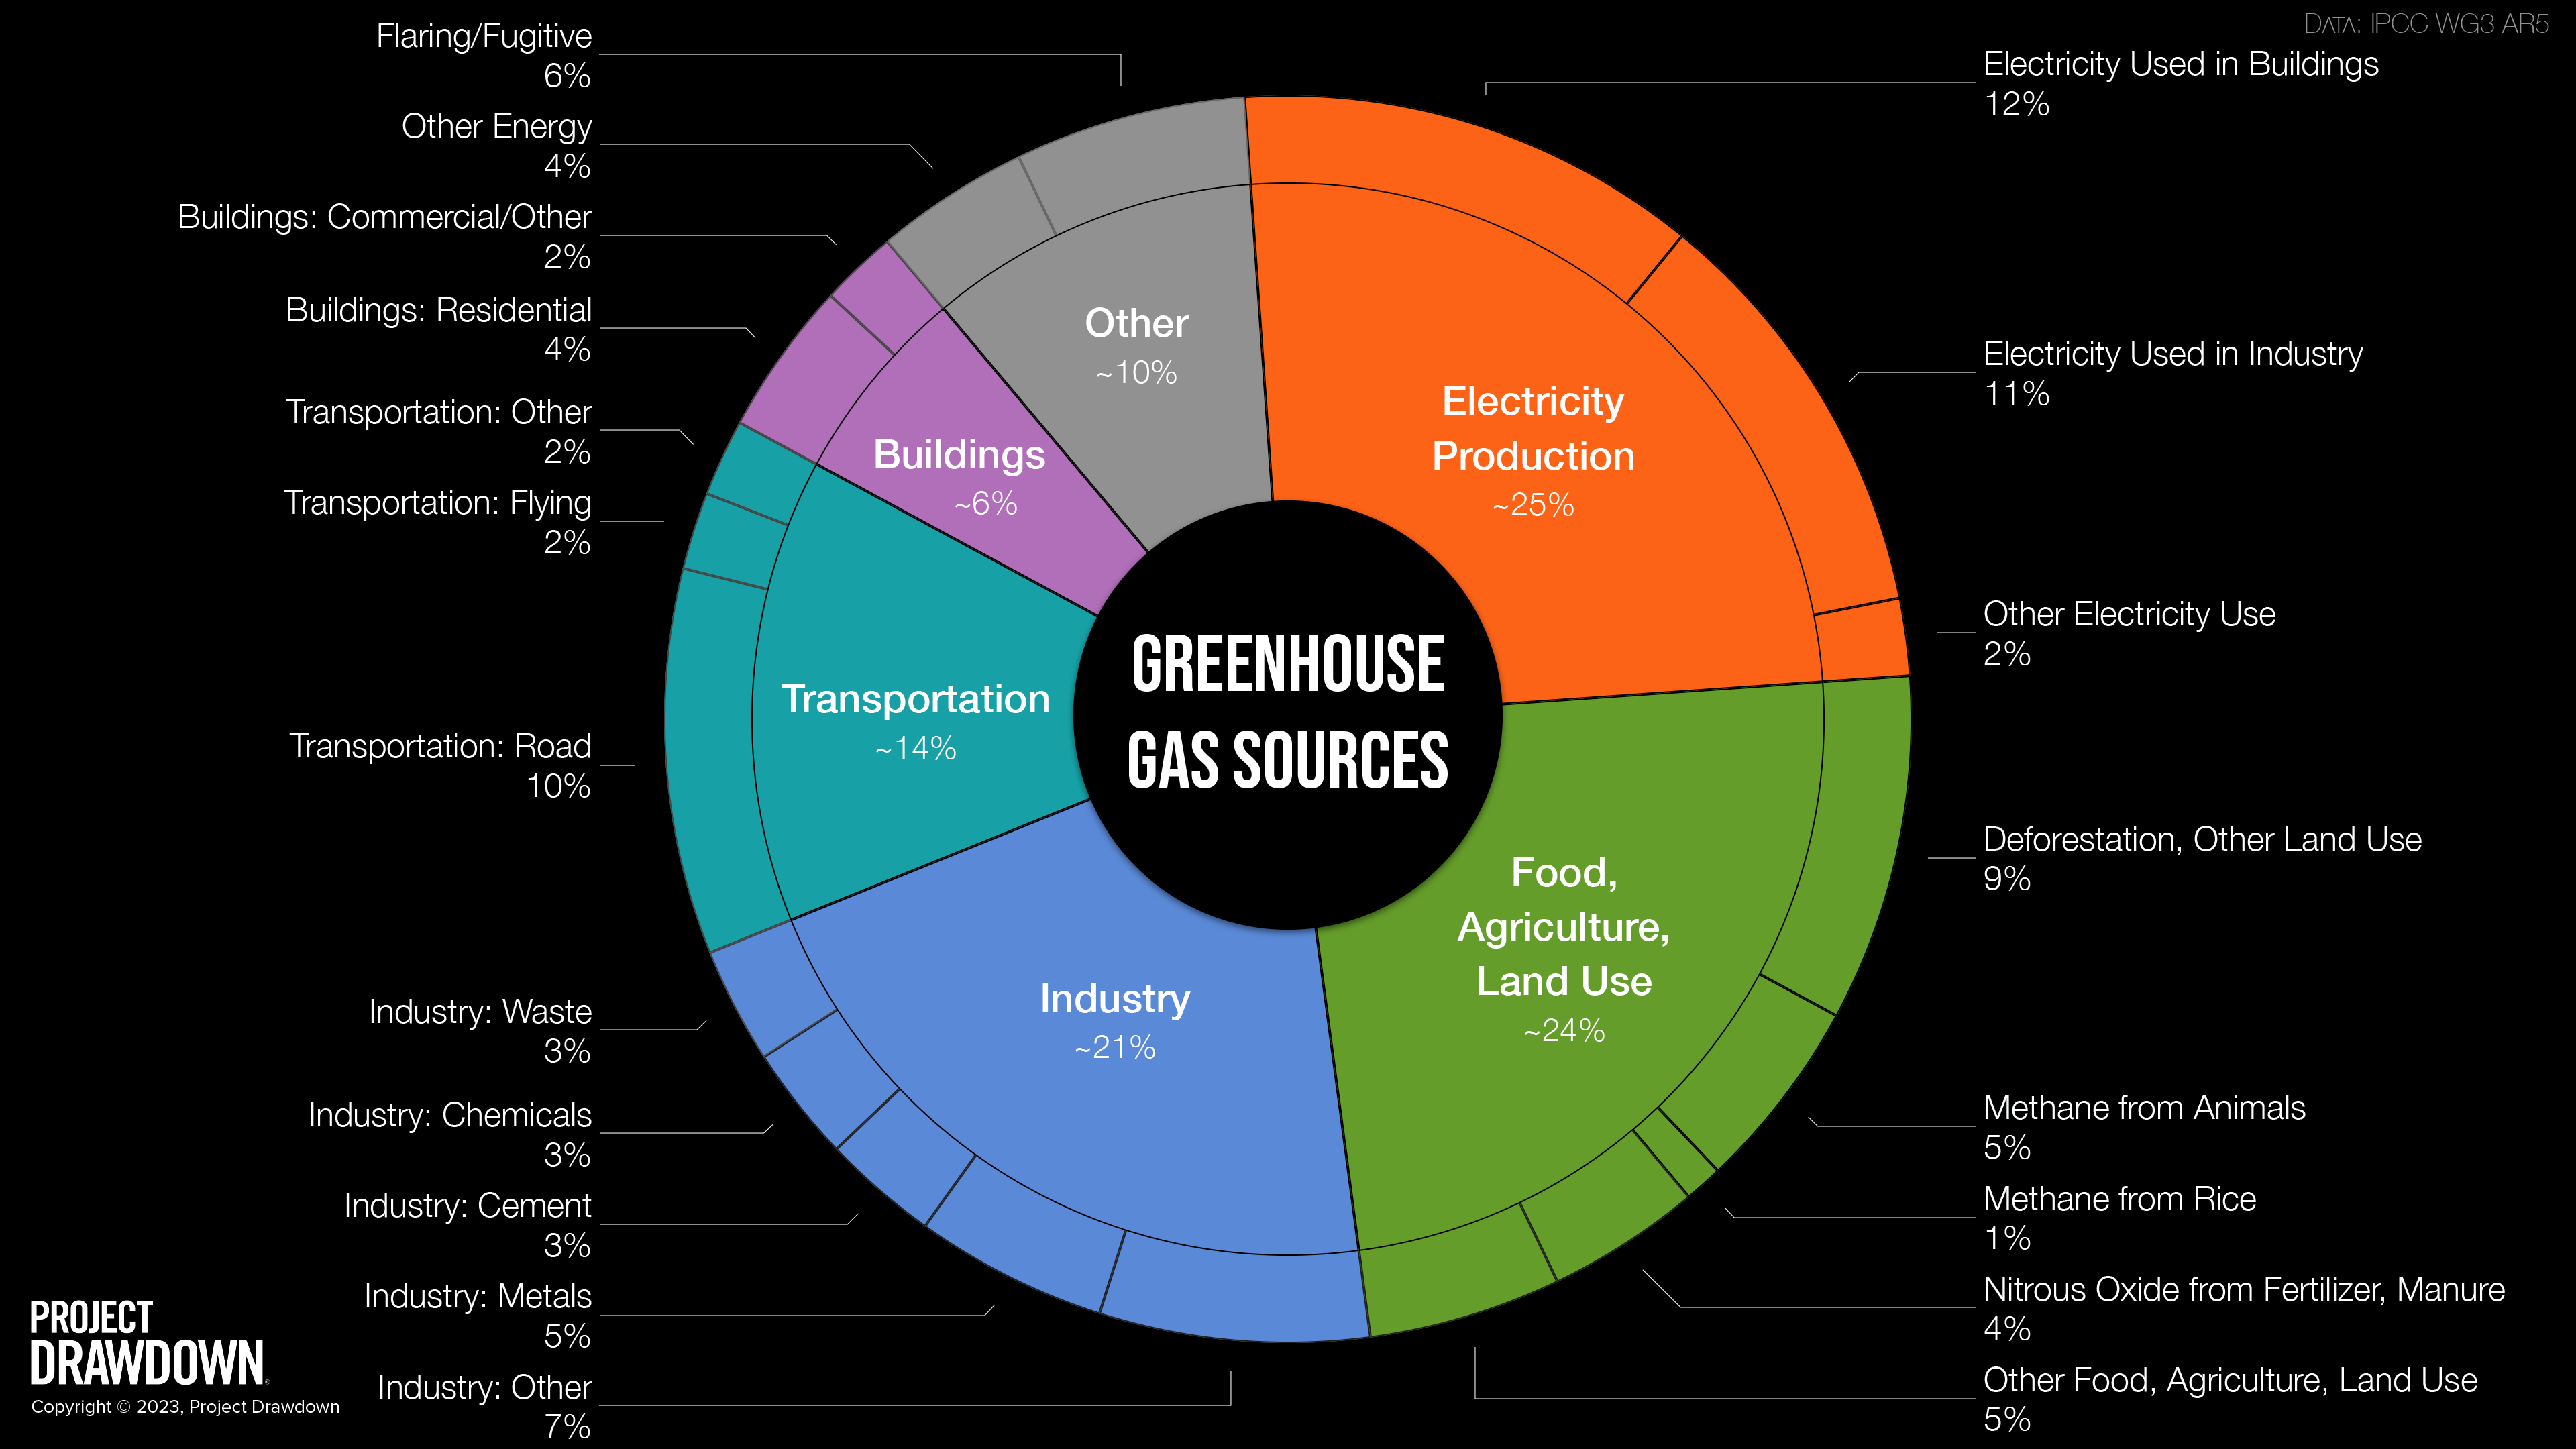
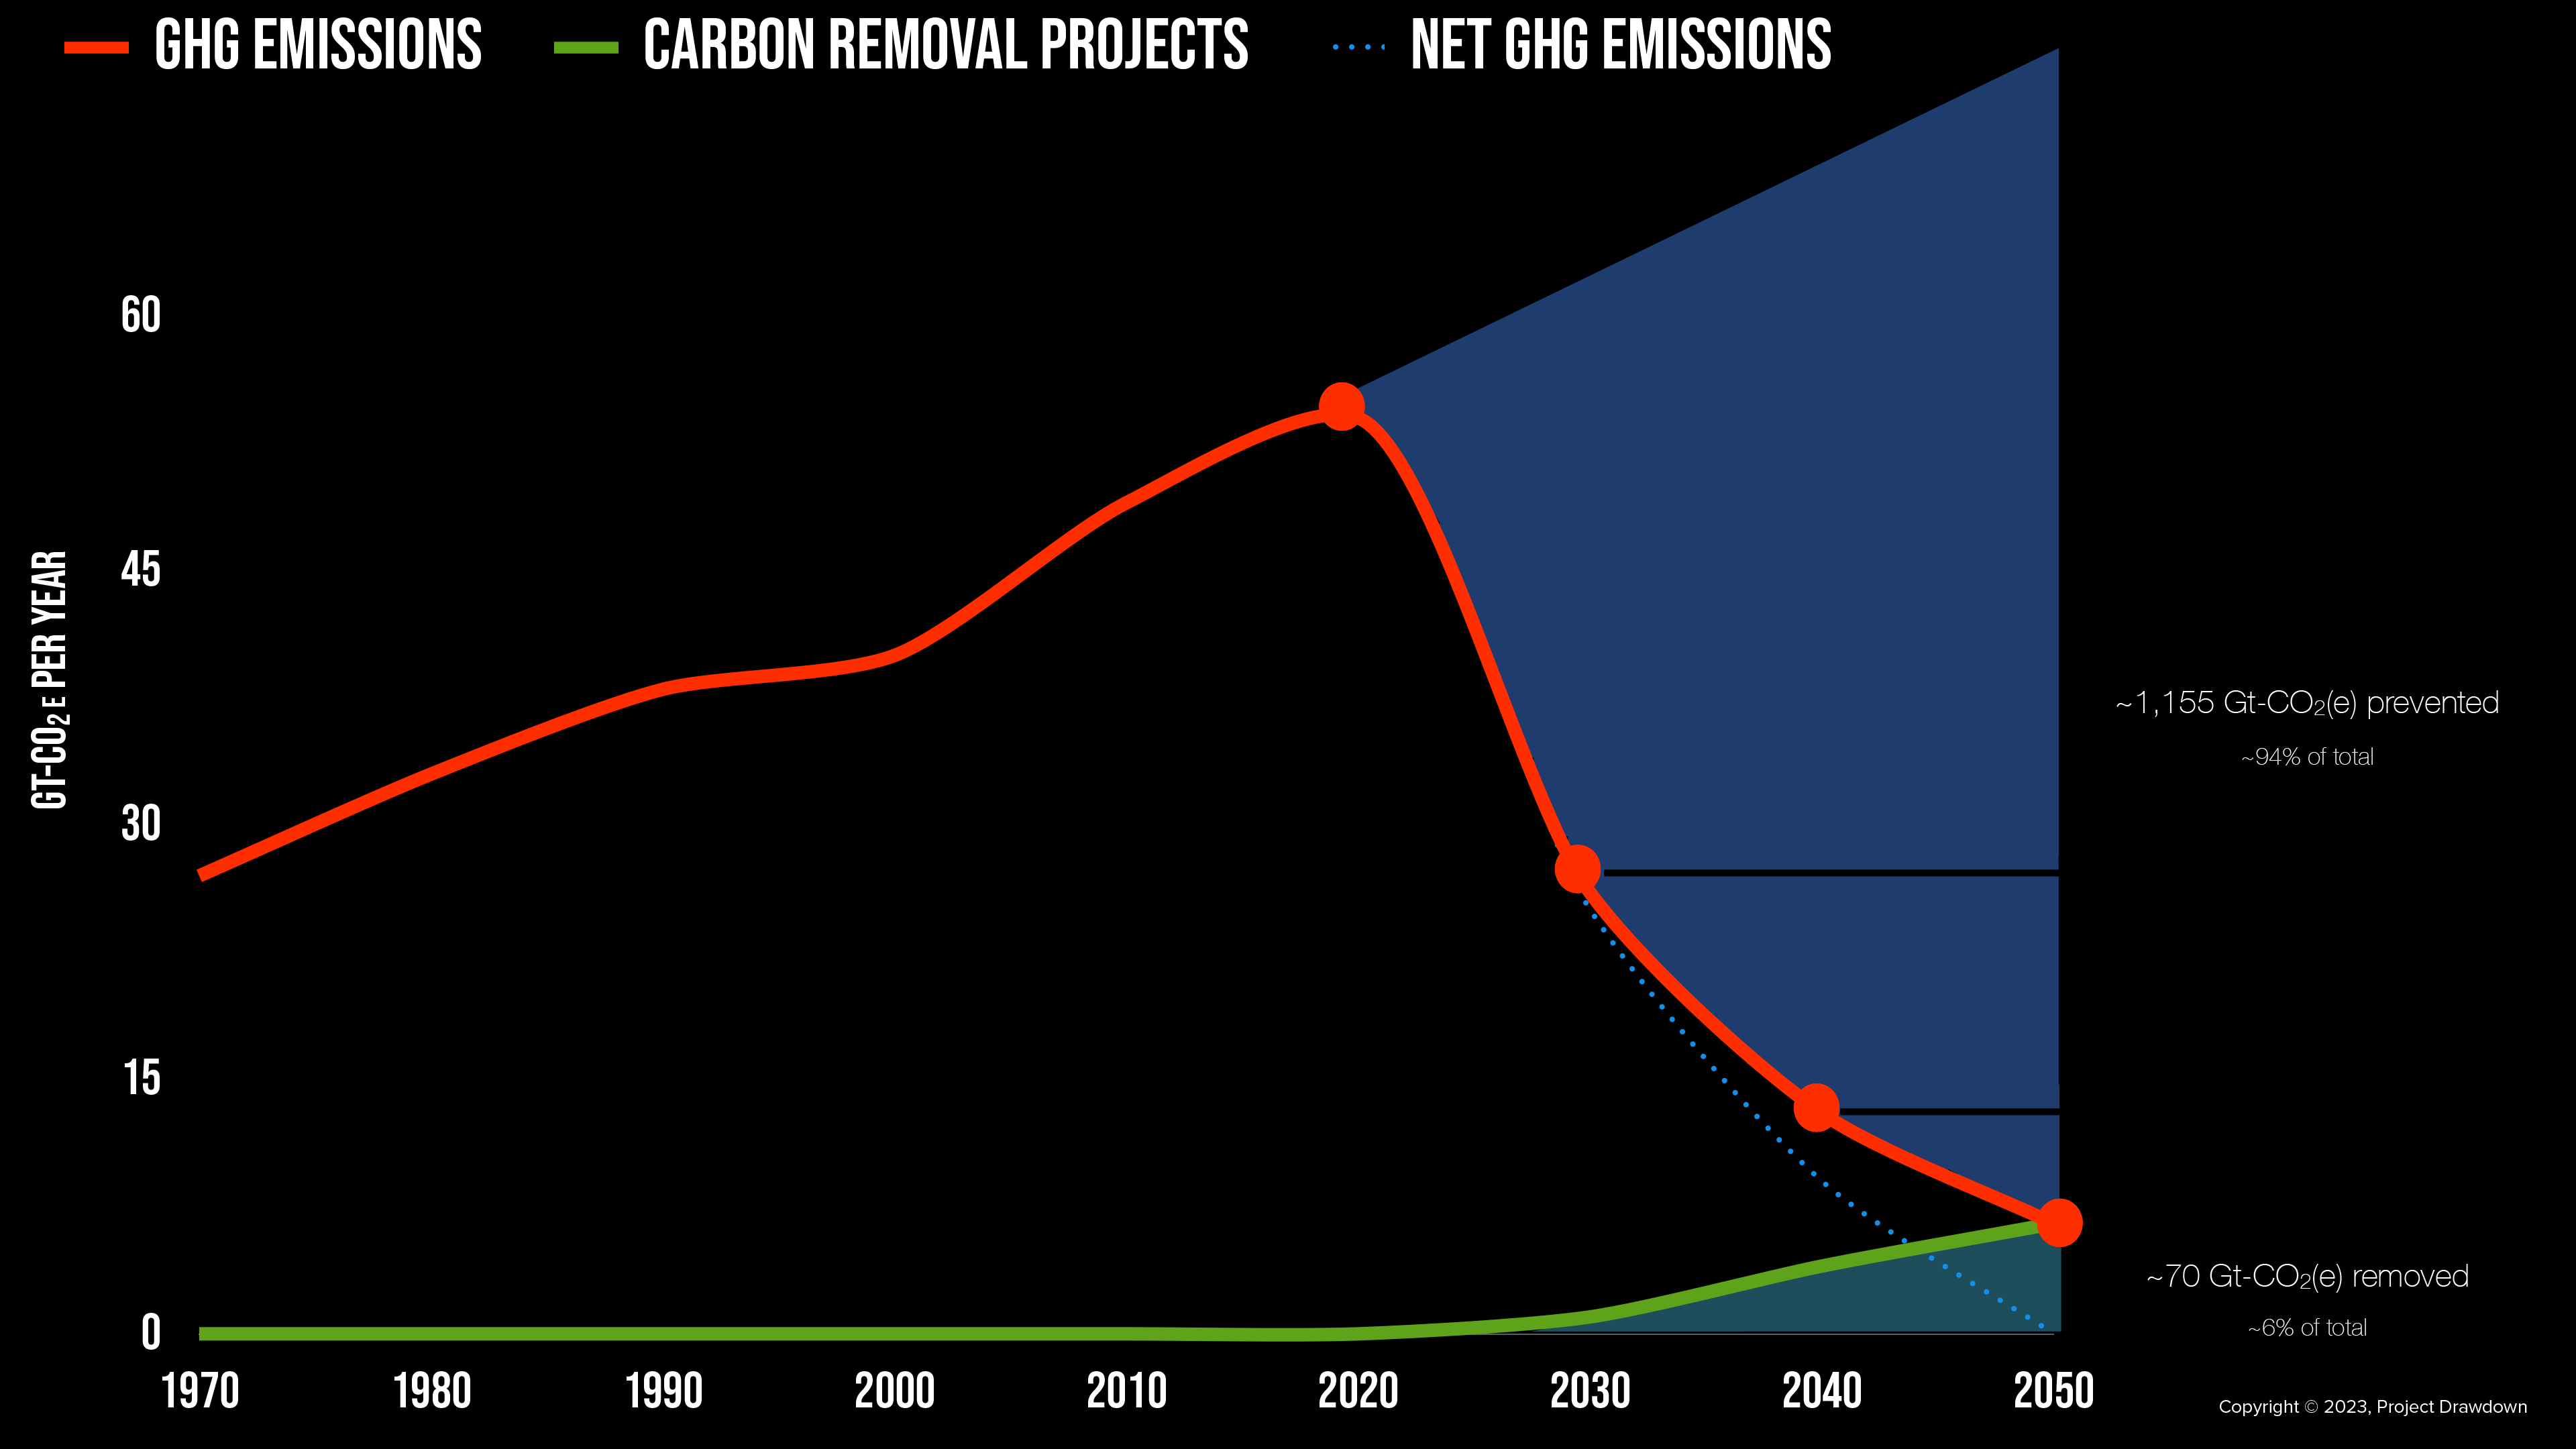
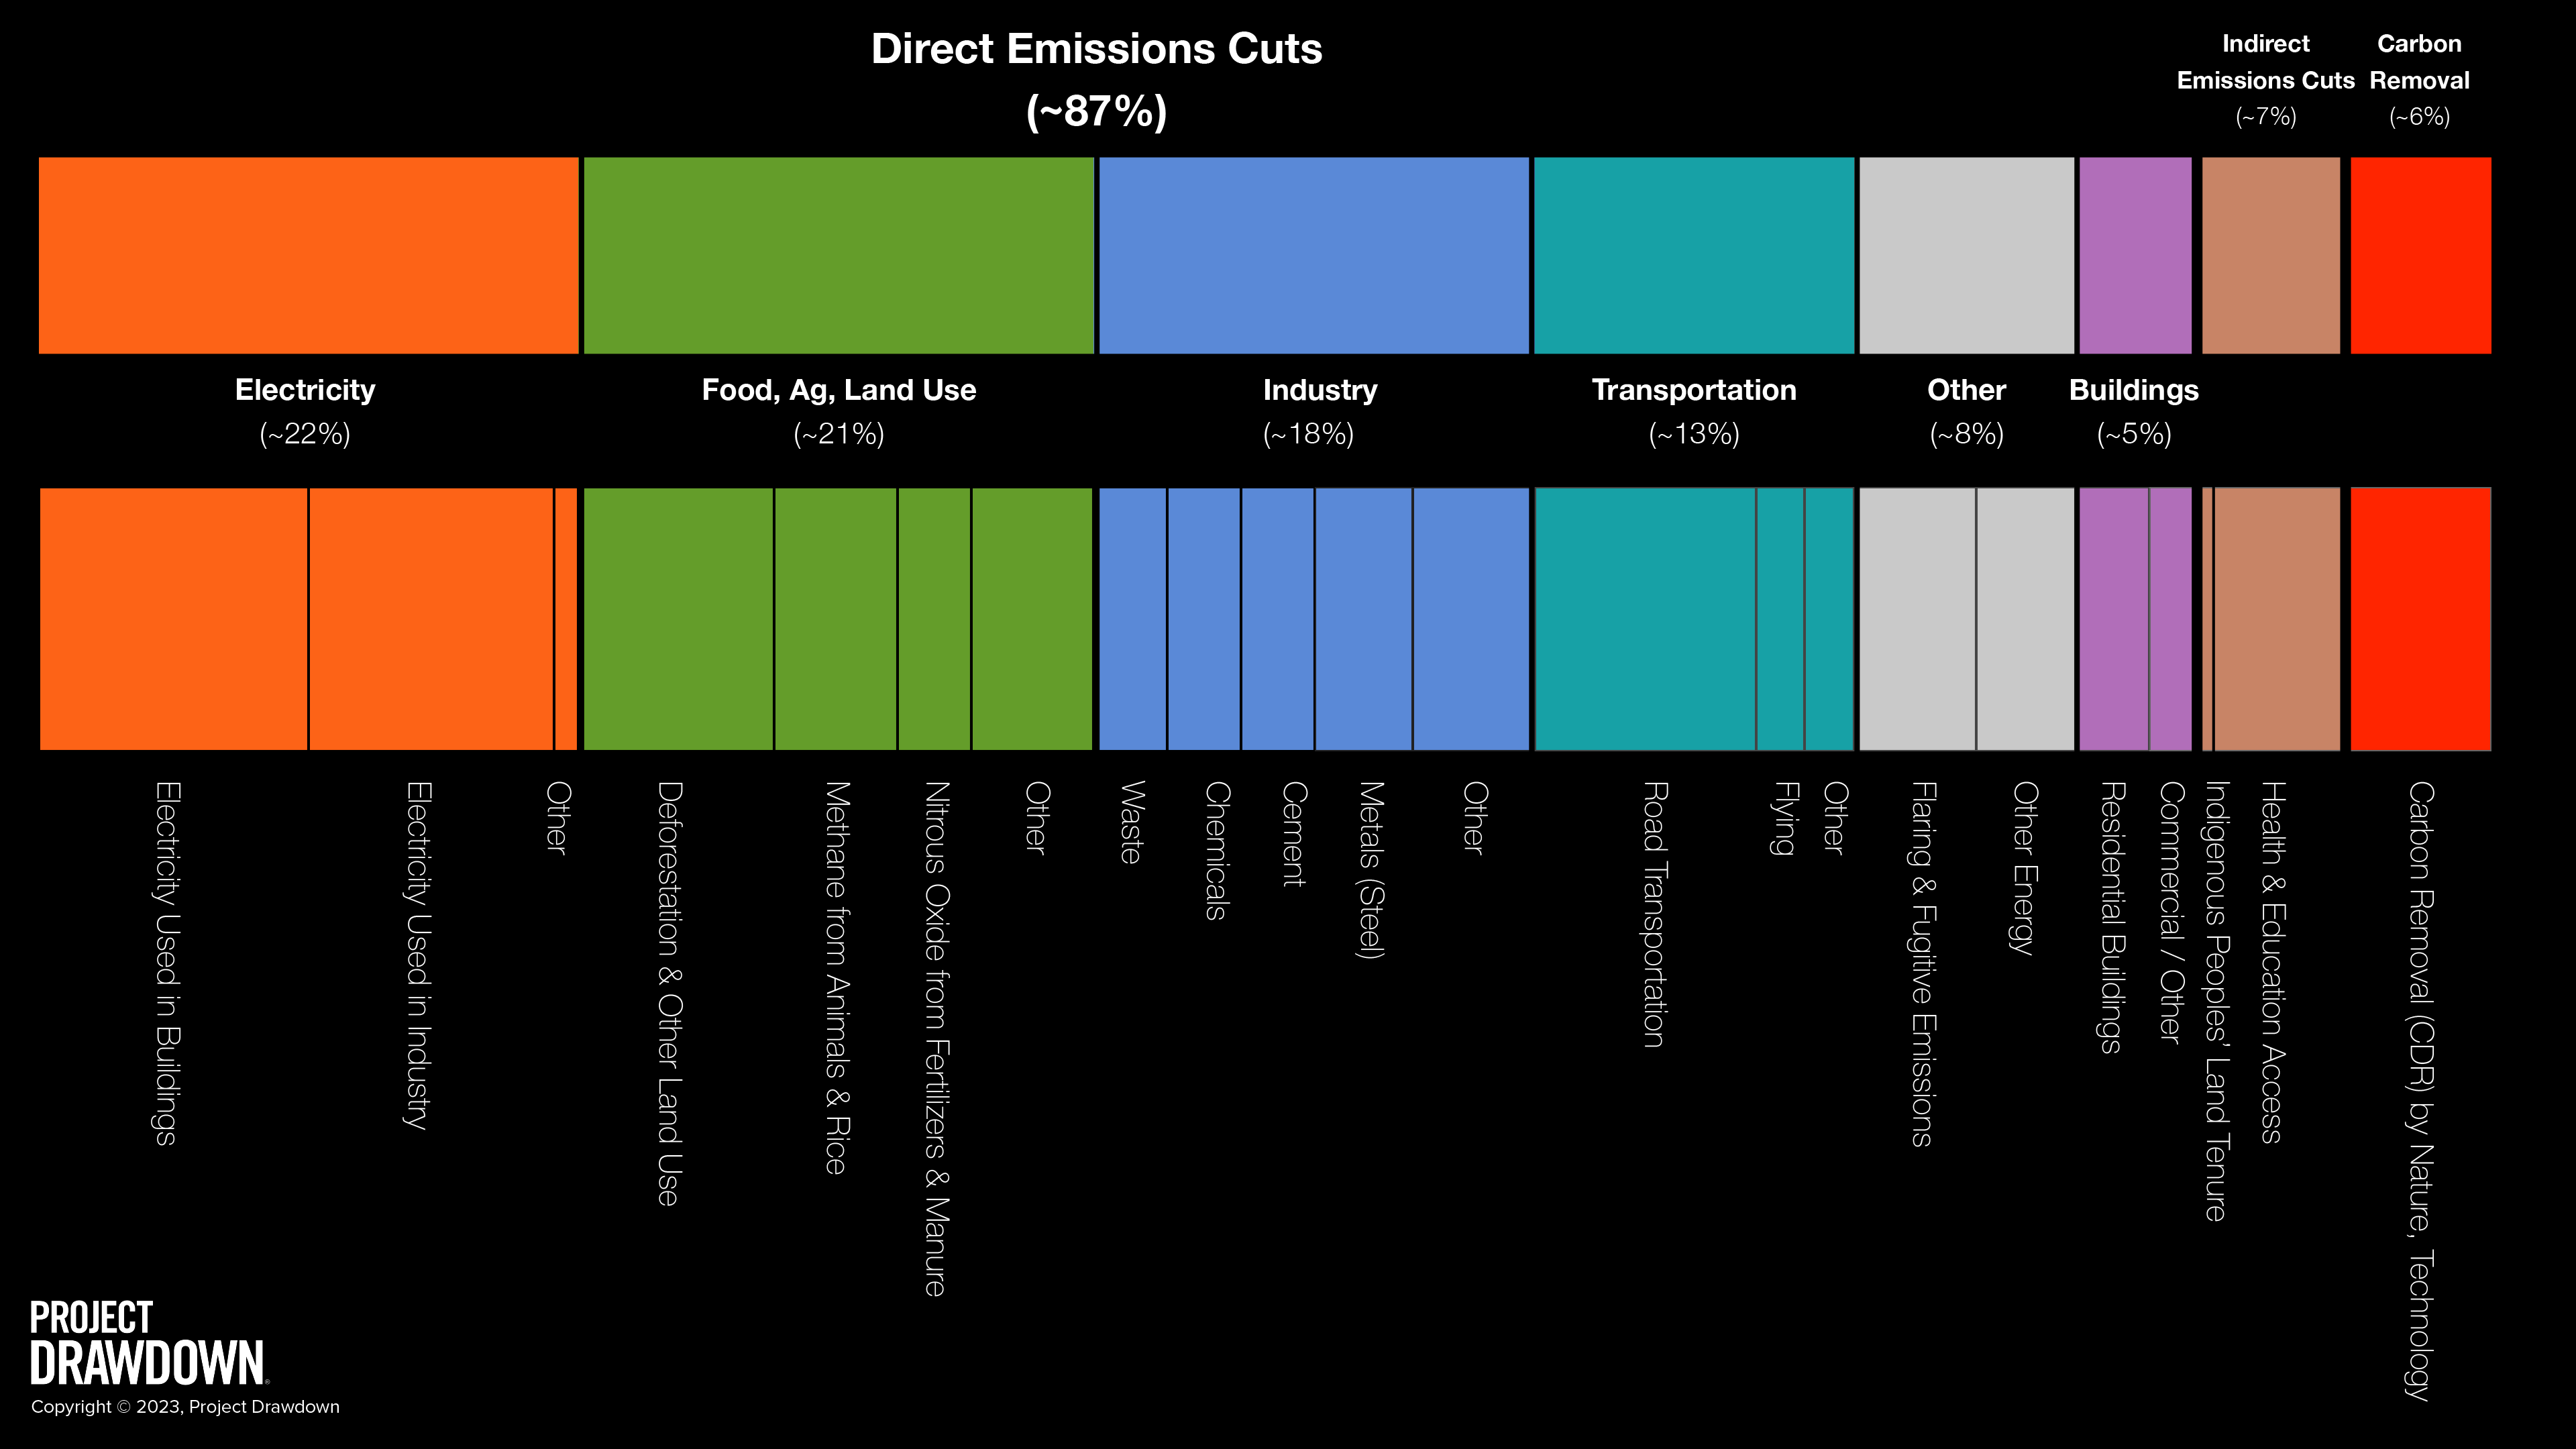
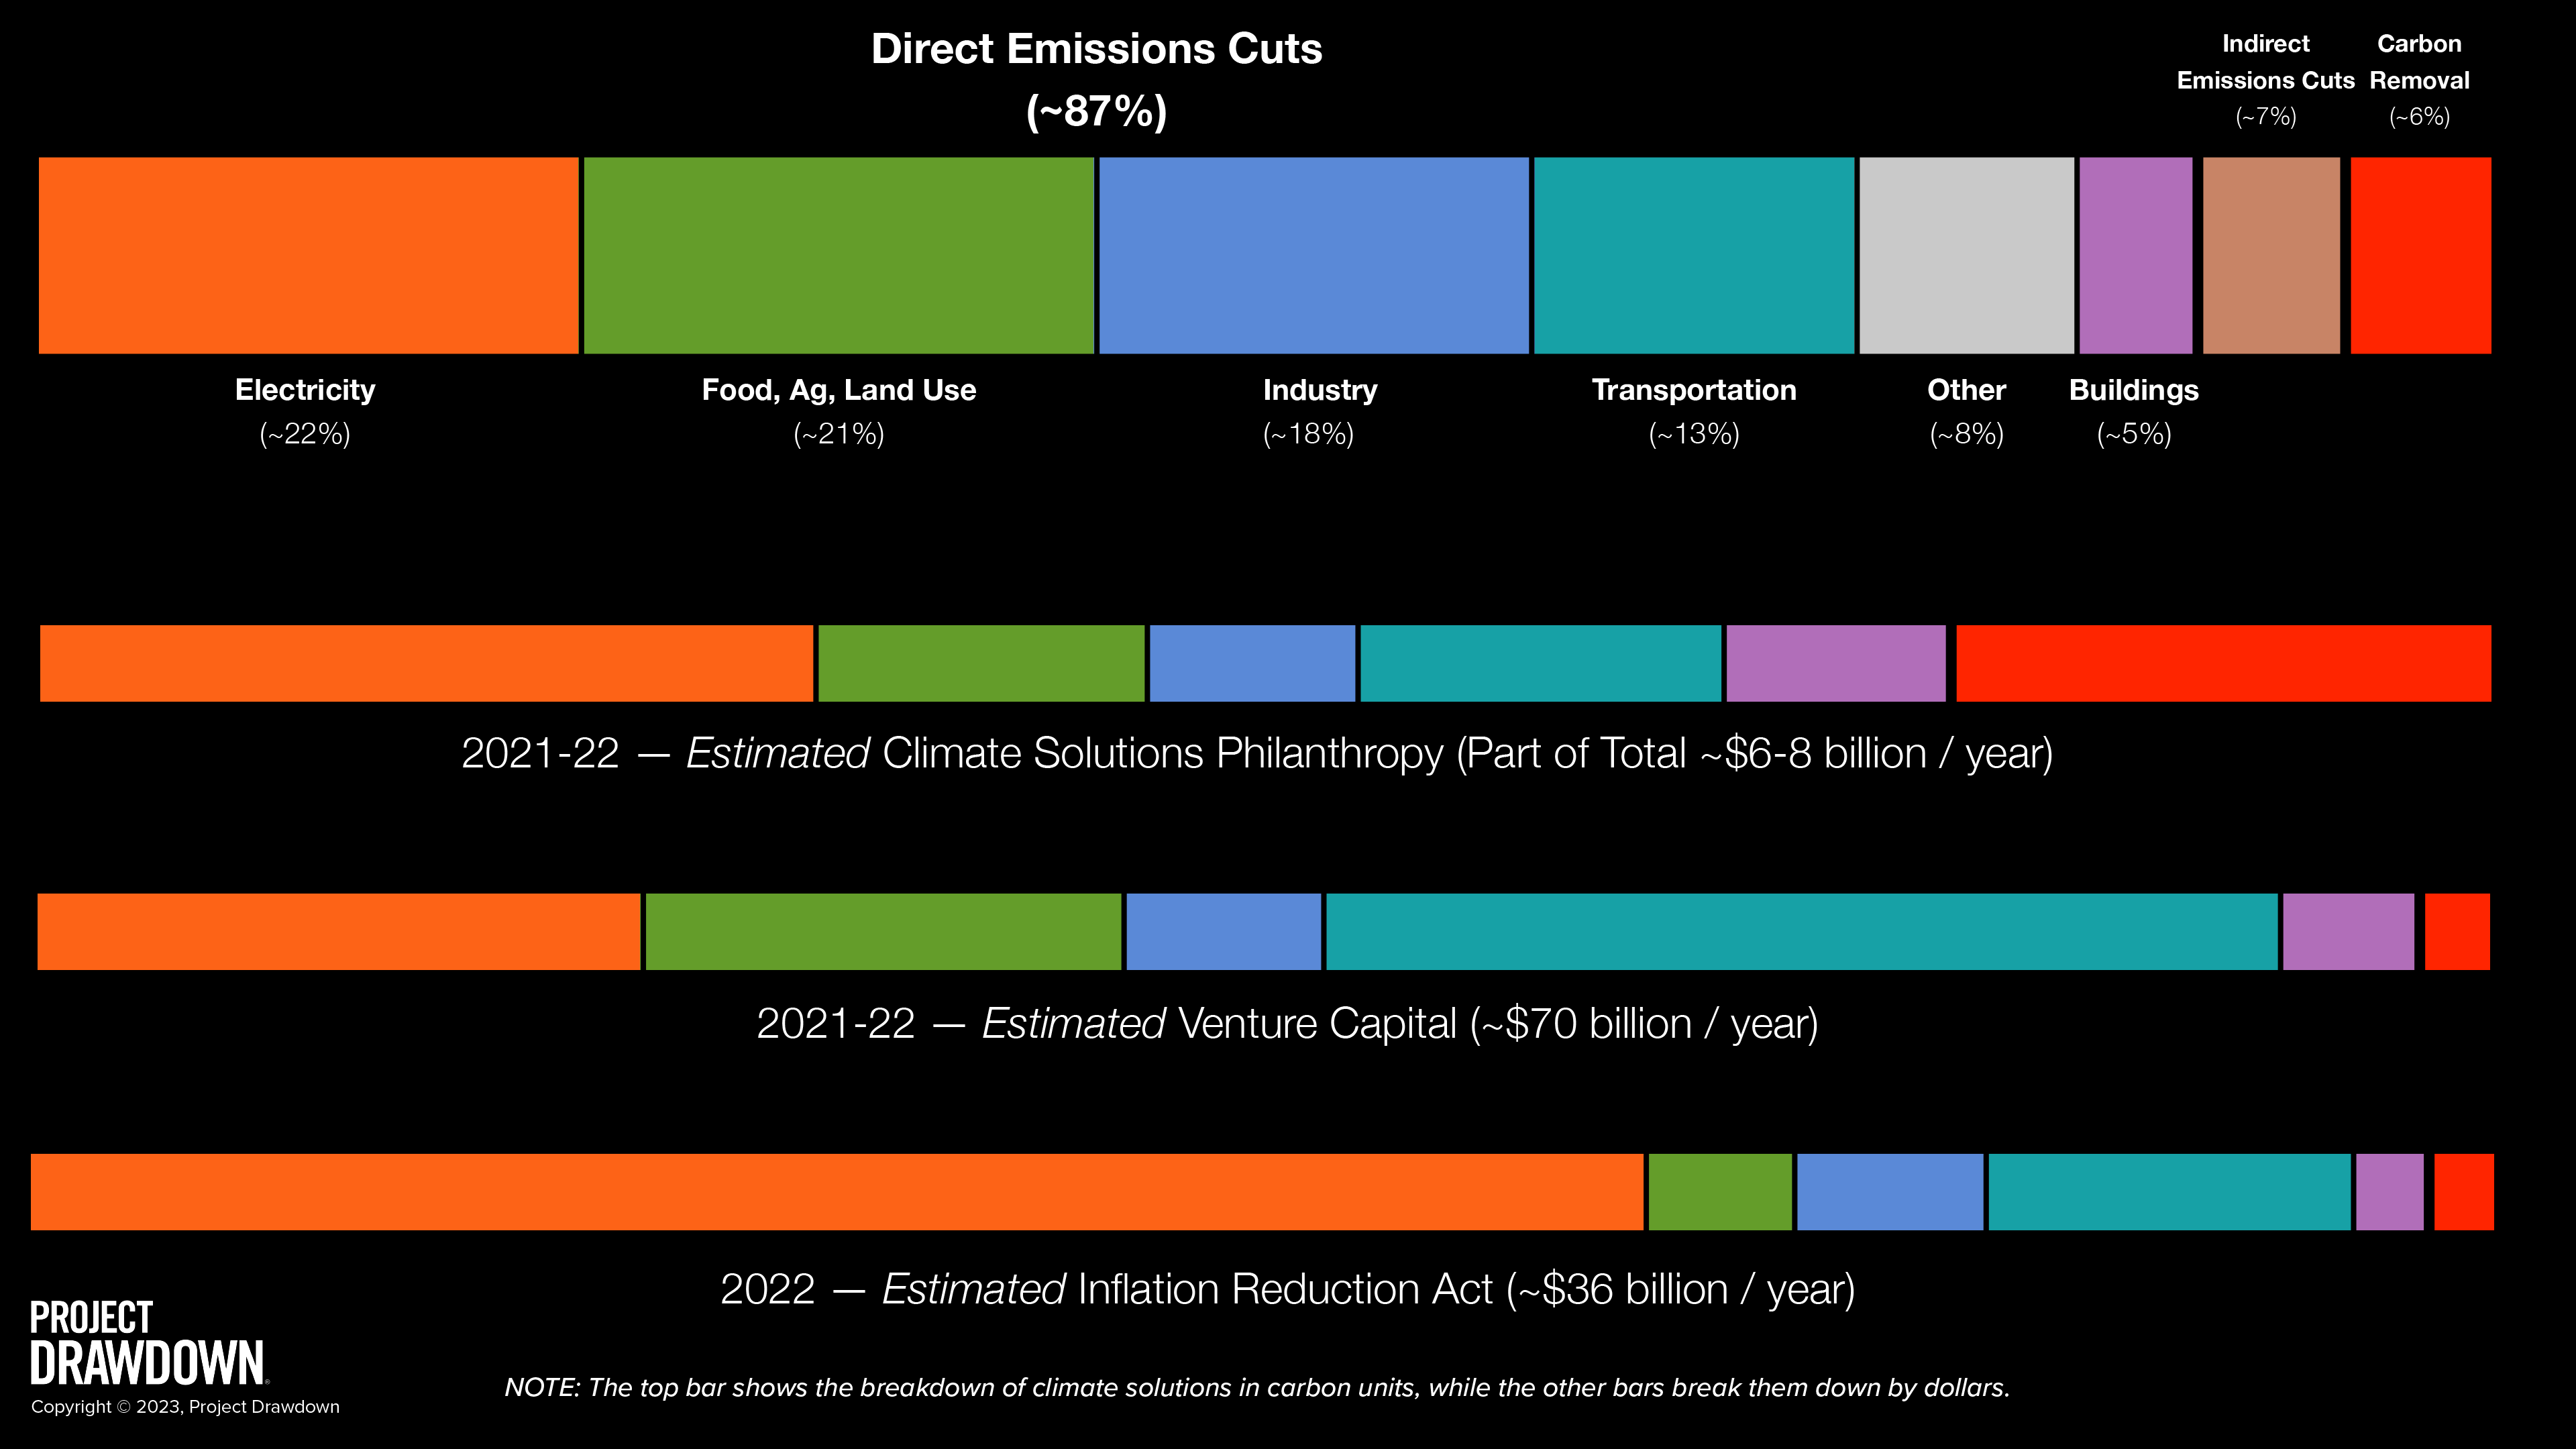
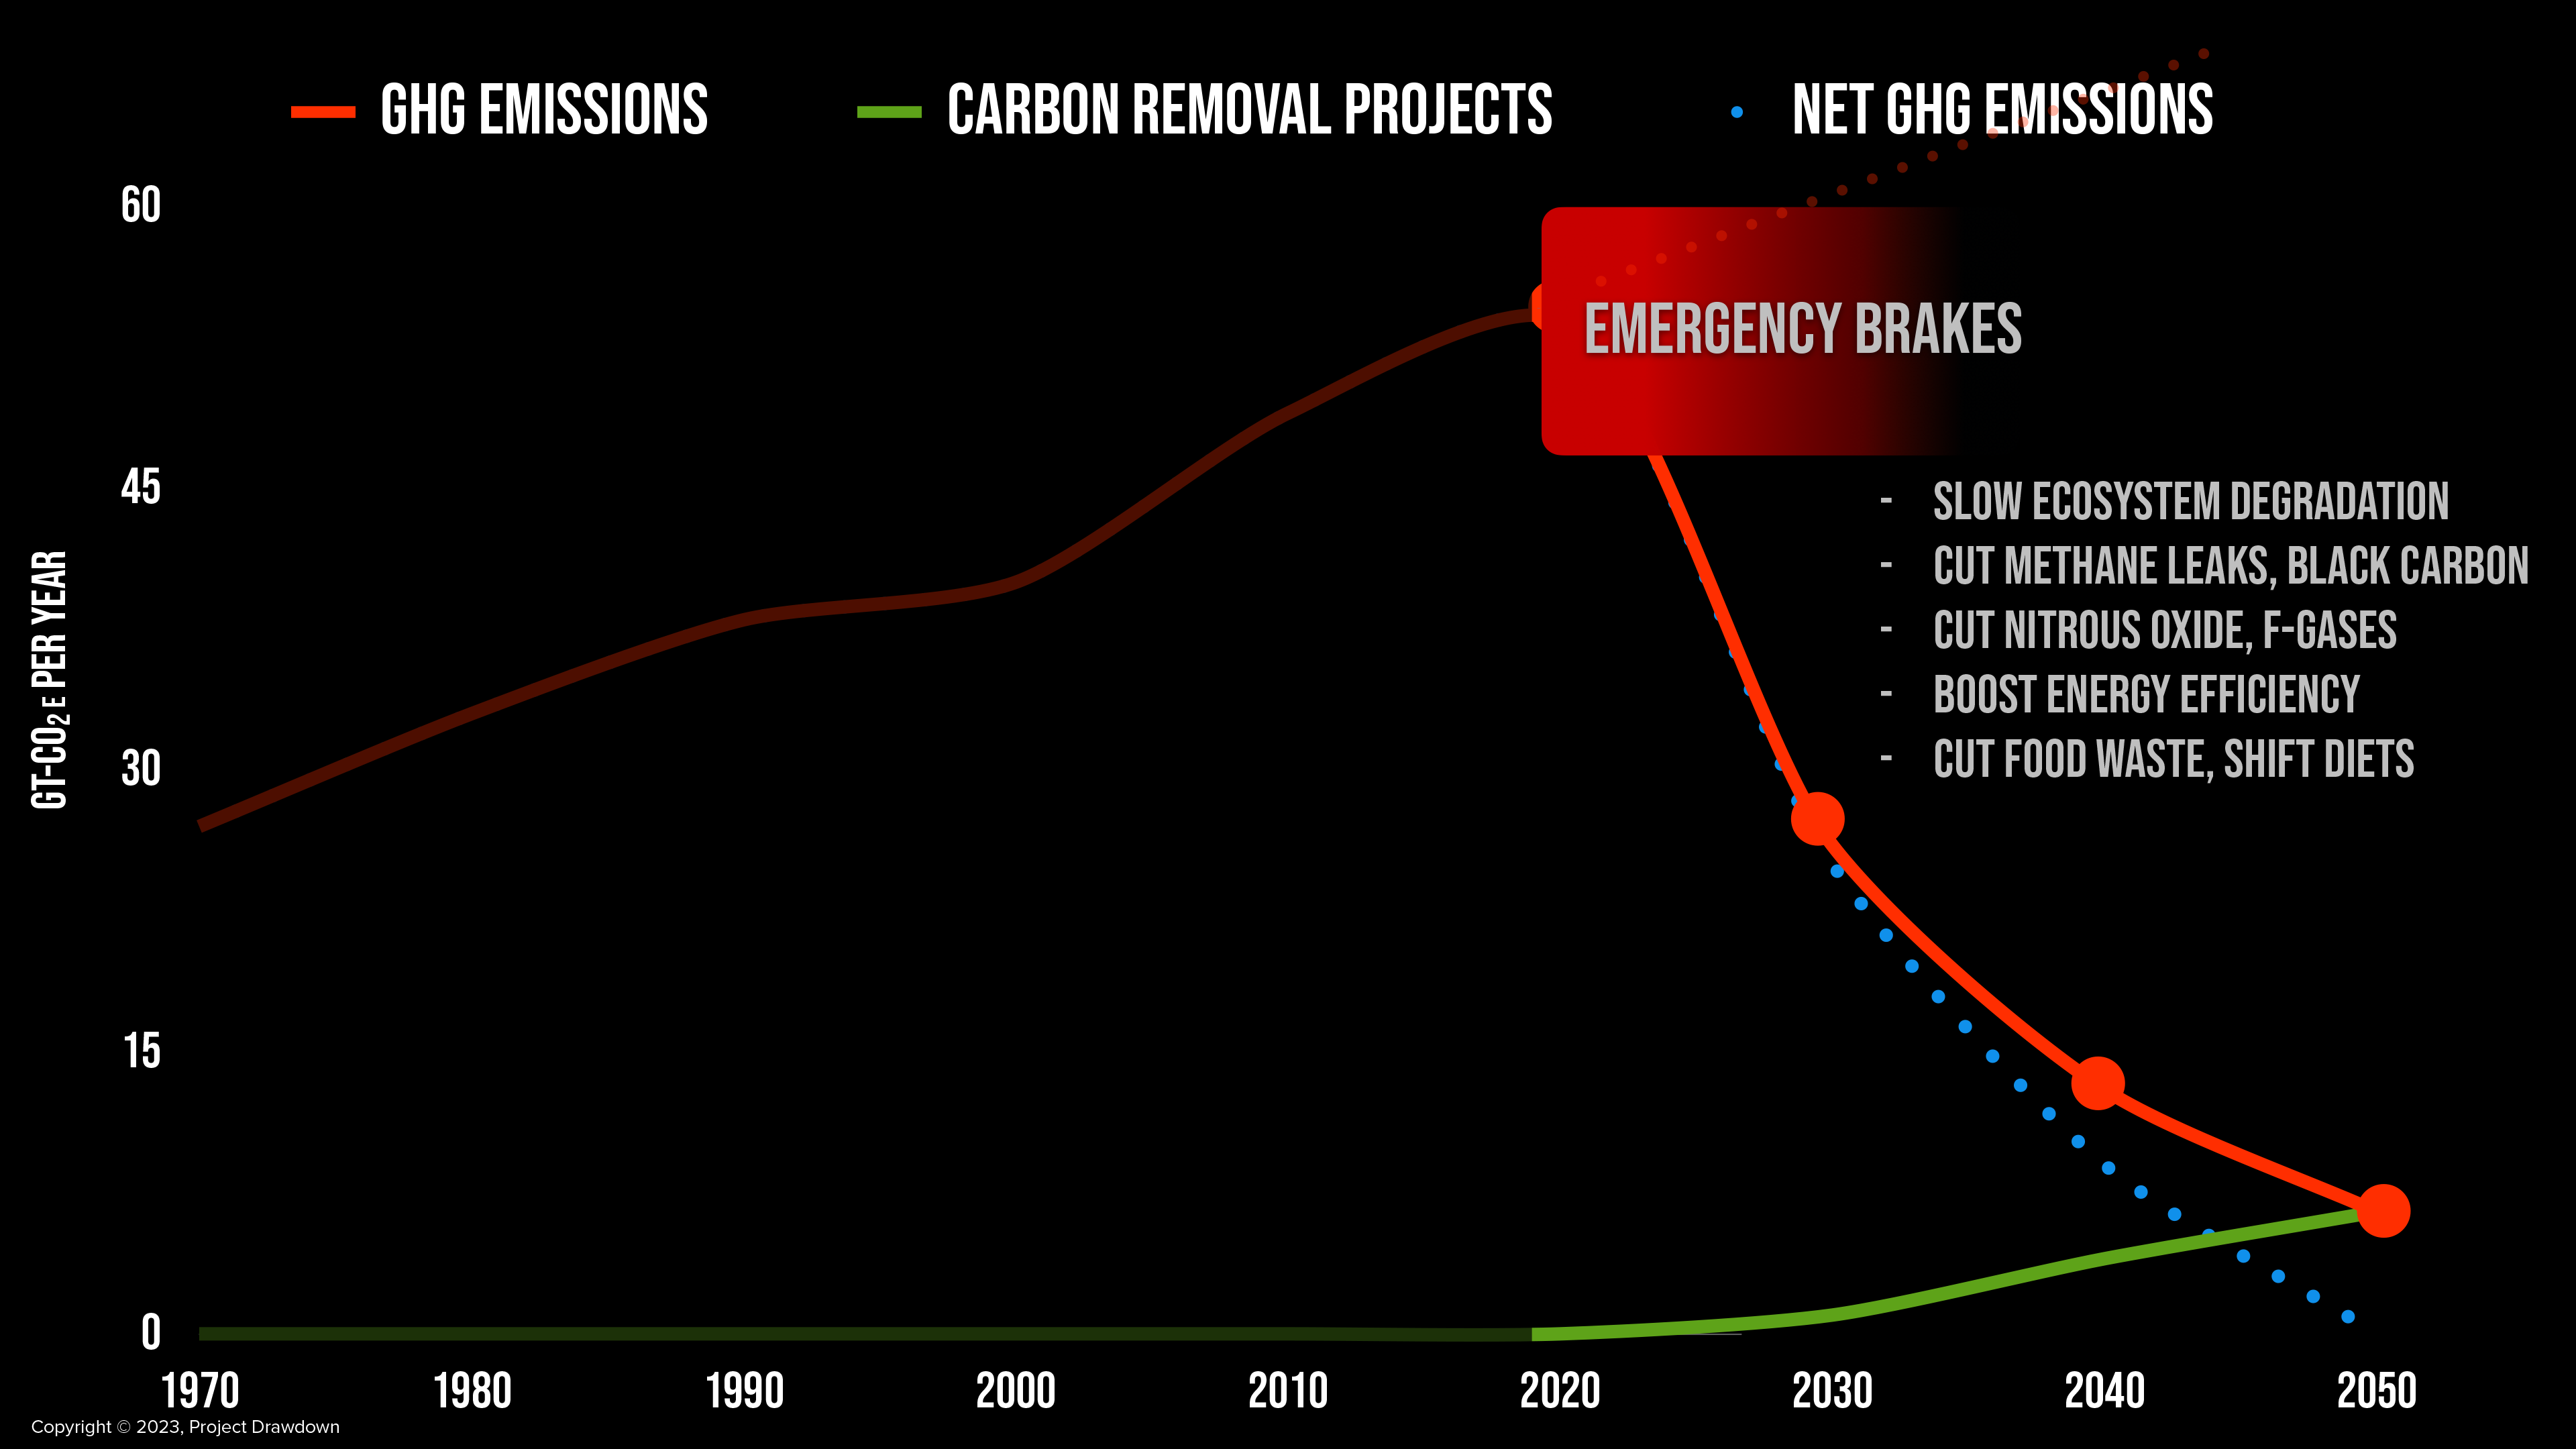
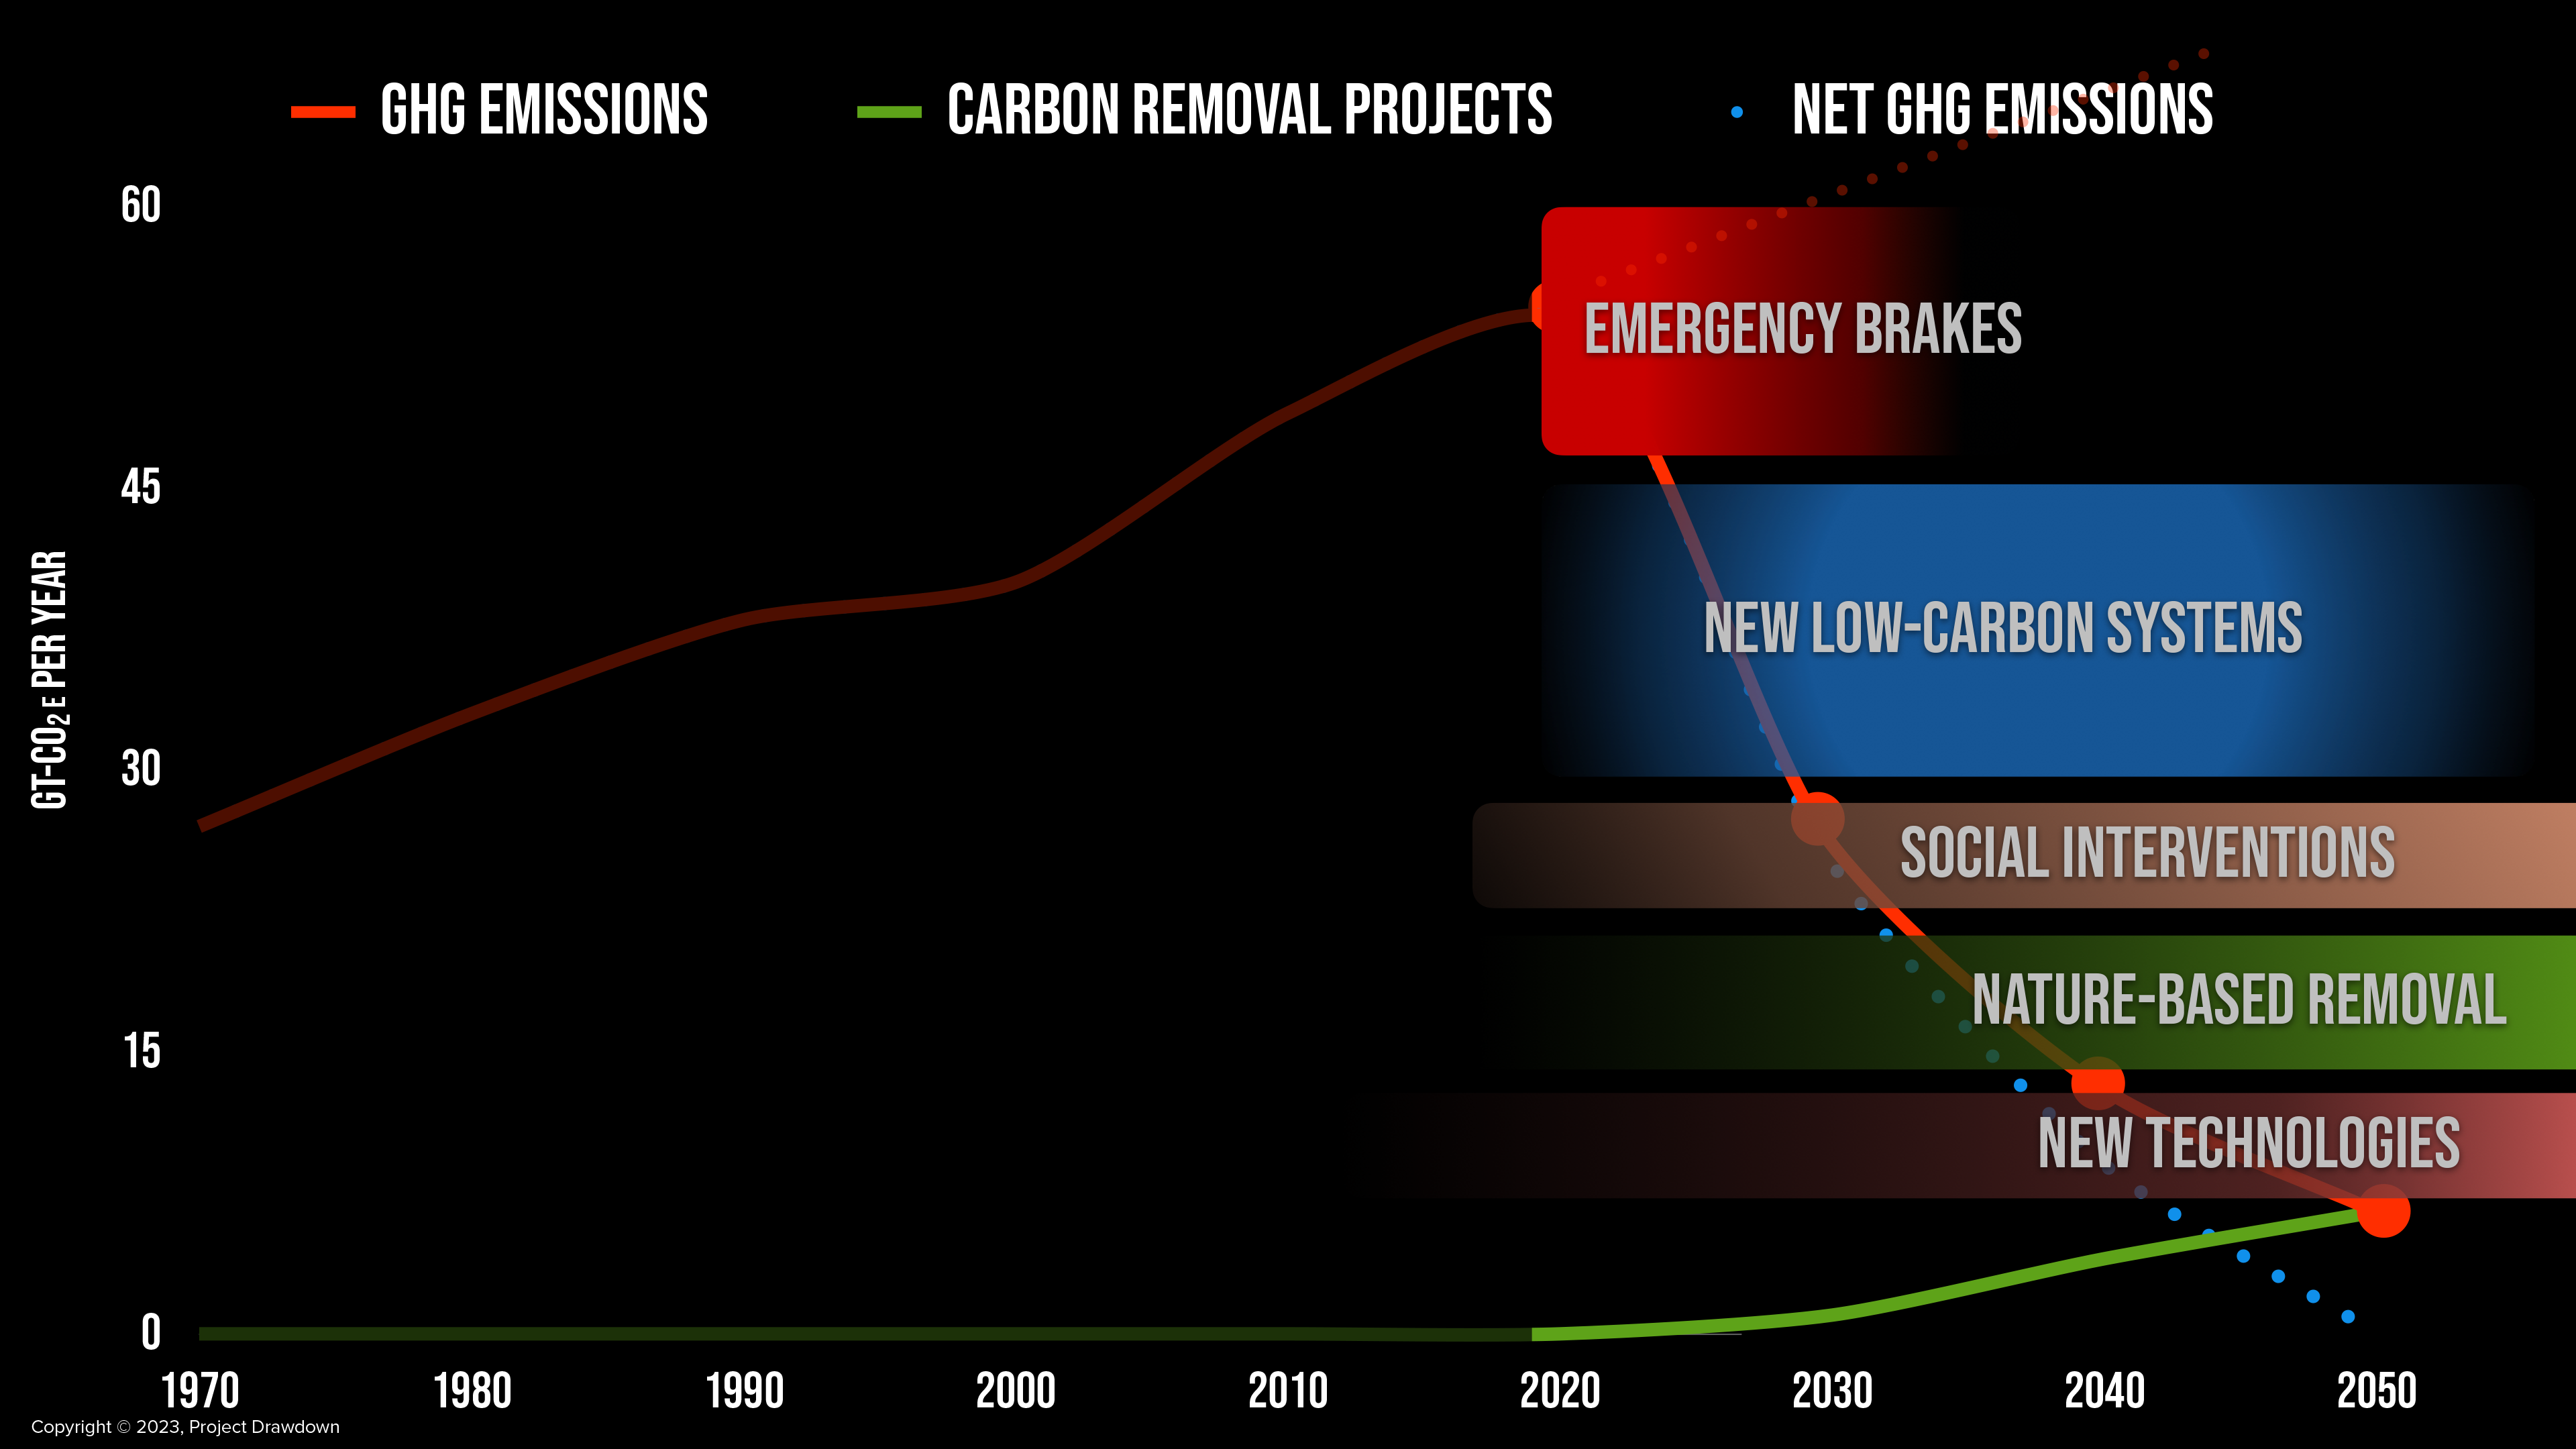
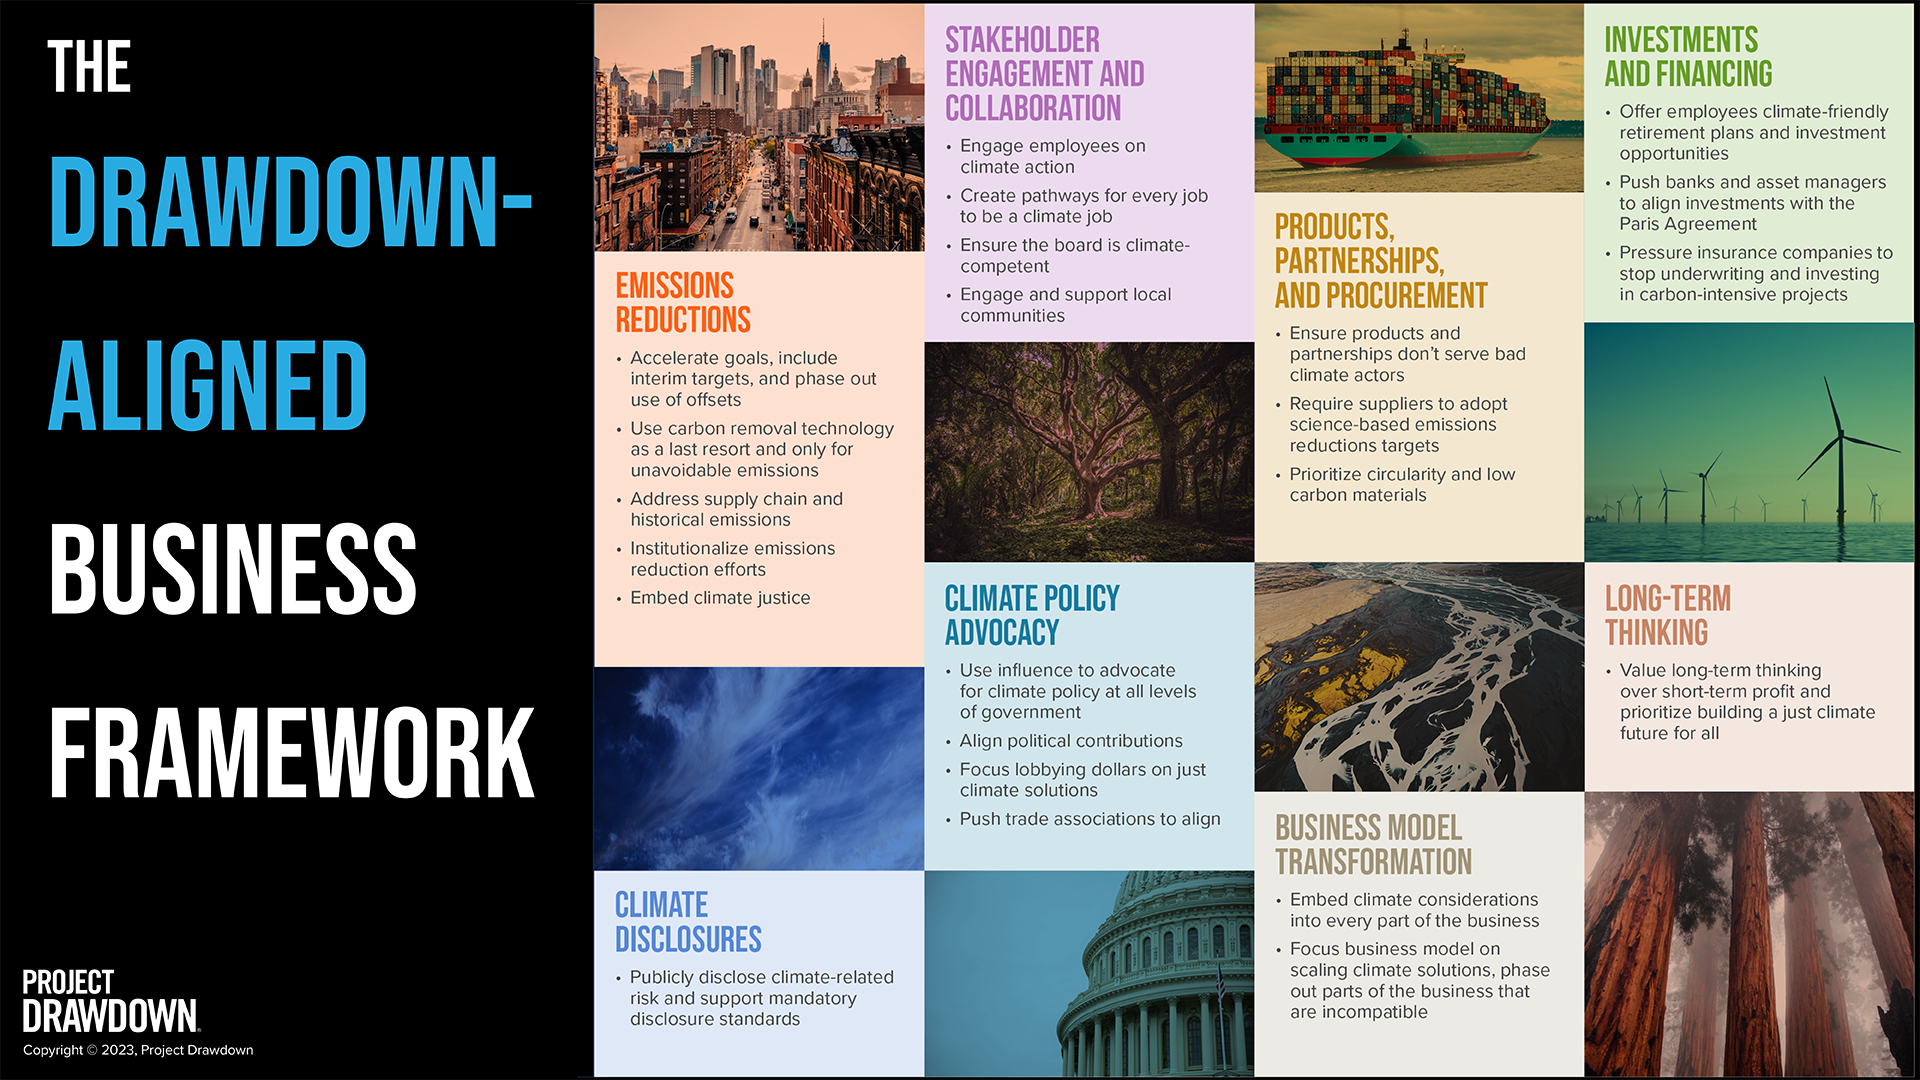
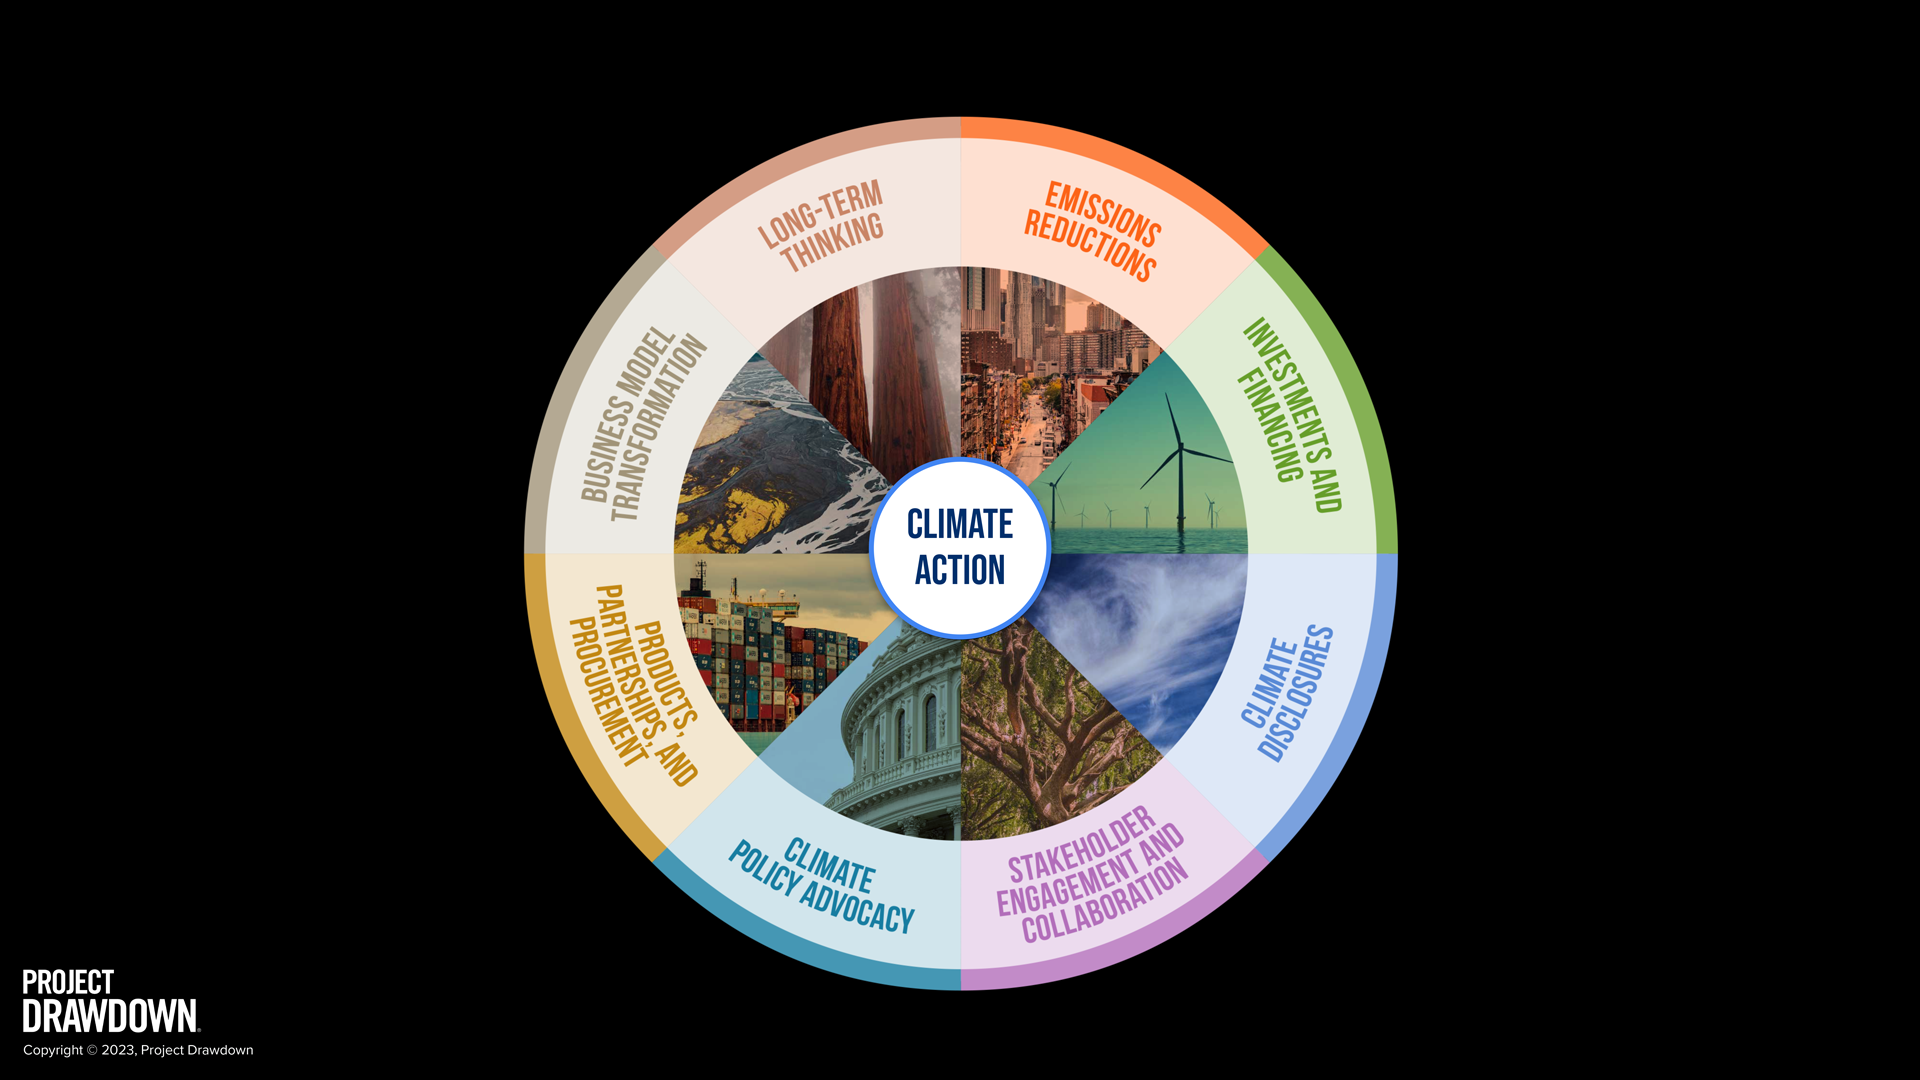
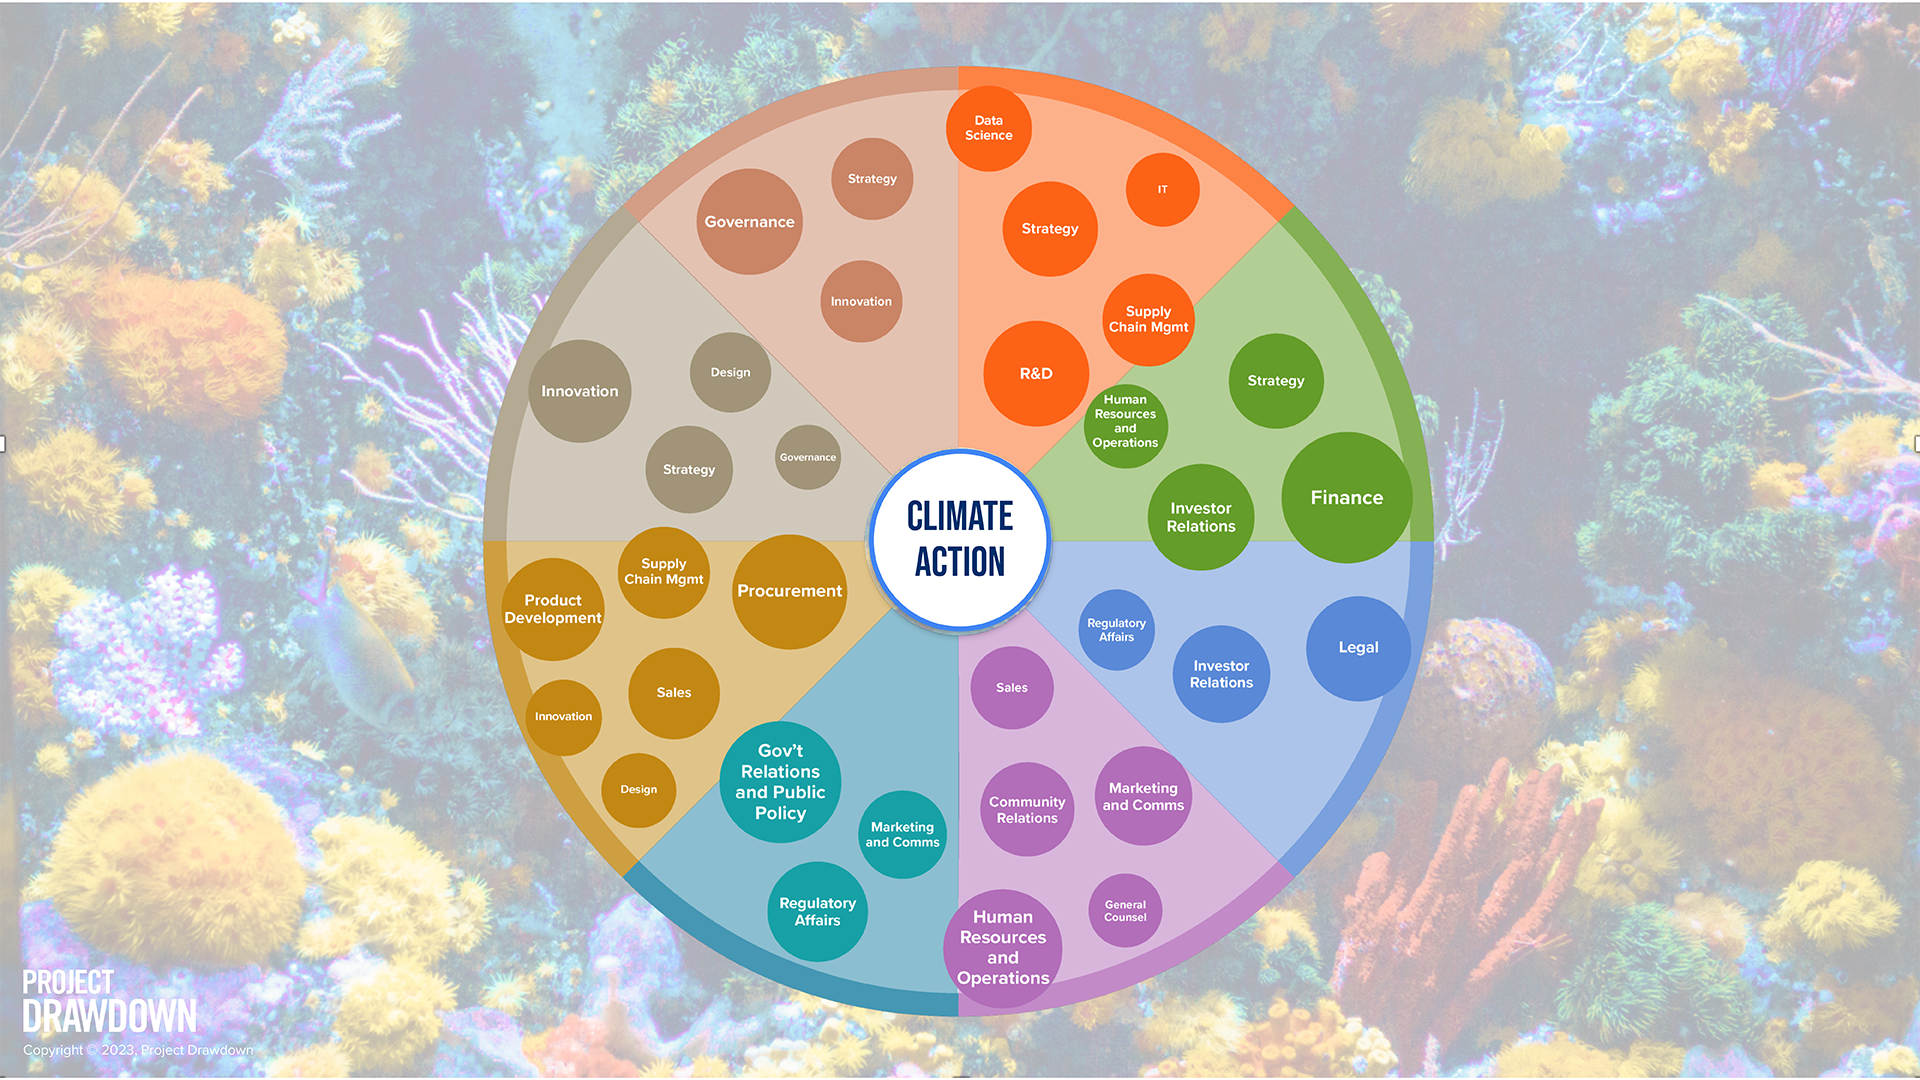
You are welcome to use the following key graphics from The Drawdown Roadmap for non-commercial purposes in presentations, reports, etc., with proper attribution. The Project Drawdown logo and copyright information on each graphic must be retained under all circumstances.

Discover Hero image media
Image
High speed train at night
Audiences

Business

Learn what my company can do

Invest

Decide where to invest

Climate Solutions 101

Your climate solutions journey begins now. Filled with the latest need-to-know science and fascinating insights from global leaders in climate policy, research, investment, and beyond, this video series is a brain-shift toward a brighter climate reality.

Climate Solutions 101 is the world’s first major educational effort focused solely on solutions. Rather than rehashing well-known climate challenges, Project Drawdown centers game-changing climate action based on its own rigorous scientific research and analysis. This course, presented in video units and in-depth conversations, combines Project Drawdown’s trusted resources with the expertise of several inspiring voices from around the world. Climate solutions become attainable with increased access to free, science-based educational resources, elevated public discourse, and tangible examples of real-world action. Continue your climate solutions journey, today.

Climate Solutions 101 Presented by Project Drawdown was generously supported by Trane Technologies, Chris Kohlhardt, and Intuit.

These materials are copyright © 2021 Project Drawdown. All rights reserved.

Project Drawdown welcomes you to use and share unaltered information and materials created by Project Drawdown with proper attribution or citation. By using these materials, you signify your agreement to these terms of use. These materials are intended for educational purposes only.

Ryan Allard, PhD Marcos Heil Costa, PhD Jonathan Foley, Ph.D. Lisa Graumlich, PhD Jessica Hellmann, PhD Tracey Holloway, PhD Ramez Naam Navin Ramankutty, PhD Marshall Shepherd, PhD Leah Stokes, PhD
Presented in six video units and in-depth expert conversations, this free online course centers on game-changing climate action.

Share Your Experience

Sign up to receive updates, provide ideas, and share how you will use Climate Solutions 101 in your classroom or community.

Discover Hero image media
Image
Earth from space

Deploy Ocean Biomass Sinking

Image
Image
placeholder
Coming Soon
On
Page Description for Social
Our mission is to help the world reach “Drawdown" as quickly, safely, and equitably as possible.
Solution in Action
Speed of Action
left_text_column_width
Caveats
left_text_column_width
Risks
left_text_column_width
Consensus
left_text_column_width
Trade-offs
left_text_column_width
Action Word
Deploy
Solution Title
Ocean Biomass Sinking
Classification
Keep Watching
Lawmakers and Policymakers
Practitioners
Business Leaders
Nonprofit Leaders
Investors
Philanthropists and International Aid Agencies
Thought Leaders
Technologists and Researchers
Communities, Households, and Individuals
Updated Date

Climate change increases global farmland area and agricultural emissions, study finds

In a study published today in Nature Geoscience, an international team of researchers from the University of Minnesota, Project Drawdown, and several other institutions elucidate and quantify a worrying climate feedback loop in which global warming hampers crop efficiency, leading to more land use for comparable amounts of food, which then releases yet more greenhouse gas emissions. 

Food and agriculture account for around one-quarter of global greenhouse gas emissions, primarily due to land use. Meanwhile, millions of people around the world live without enough to eat. To feed the planet without destroying it will require remarkable efficiency – growing as much food as possible on as little land as possible. Unfortunately, as the planet warms, global food systems seem to be getting less efficient.

“Agricultural efficiency is the invisible lever that determines how much land we need to feed the world,” says University of Minnesota research scientist Jessica Till, Ph.D., who co-led the study.  “Our study shows that improvements in agricultural efficiency can be a powerful buffer against cropland expansion. But climate change is eroding that buffer, partially reversing the progress that made modern agriculture more sustainable.”

Across the 110 countries analyzed for the study, the researchers found that croplands have expanded by 3.9% over the last three decades. Absent climate change, however, total croplands could have actually shrunk by roughly 2% while maintaining current production levels, as improved farming practices led to greater efficiency. 

This reduced land use and increased efficiency would have spared 88 million hectares – twice the size of California – from being cleared for agriculture worldwide. It would have also prevented 22 gigatons of CO₂ from entering the atmosphere, enough to offset the annual emissions from more than five billion fossil-fueled cars. 

“When climate change slows productivity gains, it pushes more land into cultivation, often at the expense of forests and carbon-rich ecosystems,” says study author and University of Minnesota Associate Professor Zhenong Jin, Ph.D. “Clearing land for cultivation changes the local temperature and rainfall patterns, and also releases carbon, which worsens climate change, creating a runaway feedback loop.” 

To uncover their findings, the researchers applied two models: one looking at how temperature changes between 1992 and 2020 have impacted total factor productivity (TFP), a measure of farming efficiency that compares inputs to outputs, and another that estimates TFP over the same timeframe, but without human-caused warming. They then incorporated land-use responses to international trade patterns to determine how much less land would have been used due to greater efficiency, and finally, how much emissions would have been reduced through undisturbed biomass and soil carbon if that land was still covered with natural vegetation.

Although this feedback loop is likely to continue as long as planet-warming greenhouse gas emissions continue to pollute the atmosphere, the researchers say that solutions in the food and agriculture sectors can help intervene.

“Climate change is hurting farmland productivity, and emissions from clearing natural ecosystems exacerbate that problem,” says study co-author and Project Drawdown Senior Scientist Paul West, Ph.D. “Fortunately, we have everything we need to break out of this downward spiral. By changing our diets, preventing food waste, and improving farming practices, we can start to reduce the demand for land that’s feeding this destructive feedback loop.”

Press Contact
Skylar Knight, skylar.knight@drawdown.org 
Interviews available upon request


About Project Drawdown
Project Drawdown is the world’s leading resource for climate solutions. By advancing science-based climate solutions, fostering bold climate leadership, and promoting new narratives and voices, we are helping the world stop climate change as quickly, safely, and equitably as possible. A 501(c)(3) nonprofit organization, Project Drawdown is funded by individual and institutional donations.

Image
An aerial view of croplands
Off

Farmers require 88 million hectares more land to grow current levels of food than they would have absent global warming

Page Description for Social
Our mission is to help the world reach “Drawdown" as quickly, safely, and equitably as possible.

Deploy Blue Hydrogen

Image
Image
An image of a large, metal hydrogen storage tank that says 'H2 Hydrogen' on the side
Coming Soon
Off
Summary

Blue hydrogen is hydrogen produced from fossil fuel sources, with some of the GHG emissions captured and stored to prevent their release. This hydrogen, considered a low-carbon fuel or feedstock, is an alternative to hydrogen produced from fossil fuels without carbon capture (gray hydrogen). Blue hydrogen production uses available technologies and is less expensive than some other low-carbon hydrogen fuels, such as green hydrogen produced from renewable-powered electrolysis. However, concerns exist about its low adoption, variable effectiveness, and competition with technologies that offer greater climate benefits. Even if implemented effectively, blue hydrogen is higher-emitting than green hydrogen and more expensive than gray hydrogen. Blue hydrogen could be a “less-bad” interim alternative to gray hydrogen, but at the risk of perpetuating fossil fuel use. Blue hydrogen is theoretically an effective climate solution, but there are open questions around whether realistic deployment can meet its potential. Based on our assessment, we will “Keep Watching” this potential solution.

Page Description for Social
Our mission is to help the world reach “Drawdown" as quickly, safely, and equitably as possible.
Overview

What is our assessment?

Based on our analysis, blue hydrogen is ready to deploy and feasible, but there is mixed consensus and limited data on its effectiveness in reducing emissions. Its climate impact has the potential to be high, but only if adopted effectively and at a large scale, both of which are currently unproven. If deployed correctly, this technology could serve as an interim solution to reduce gray hydrogen emissions while progress is made on scaling and reducing the costs of green hydrogen. Based on our assessment, we will “Keep Watching” this potential solution.

Plausible Could it work? Yes
Ready Is it ready? Yes
Evidence Are there data to evaluate it? Limited
Effective Does it consistently work? No
Impact Is it big enough to matter? No
Risk Is it risky or harmful? No
Cost Is it cheap? Yes

What is it?

Hydrogen is a fuel that can be used in place of fossil fuels in industrial, transportation, and energy systems. To deploy hydrogen as an energy source or feedstock, it first needs to be extracted from other compounds. Each “color” is an informal term specifying hydrogen produced through a unique hydrogen production path, each with different associated supply chains, processes, and energy GHG emissions. Gray hydrogen, which uses natural gas as the source of hydrogen atoms and electricity, is the most produced and has high production emissions, estimated at 10–12 t CO-eq/t hydrogen on a 100-yr basis. One way to reduce emissions is by switching to blue hydrogen, which still uses fossil fuels but also uses CCS technologies to prevent the release of some of the CO generated during production. Blue hydrogen has the potential to be a lower-emission source of energy relative to gray hydrogen or direct fossil fuel combustion.

Does it work?

Blue hydrogen is a plausible way to reduce emissions from gray hydrogen production. However, expert opinions are mixed on the magnitude of emissions that can be abated by producing blue hydrogen in place of gray hydrogen. The effectiveness of emissions reduction hinges on two main factors: the rate at which upstream methane leaks and carbon capture rates, both of which are challenging to predict on a global scale. There is uncertainty around these performance metrics and the ability to effectively store and transport captured CO at scale. Due to low current adoption, there is little real-world data to answer these questions. As of 2023, blue hydrogen comprised <1% of worldwide hydrogen production. While adding carbon capture to gray hydrogen production should help prevent emissions, there is limited evidence for both effectiveness and the ability to scale of this technology.

Why are we excited?

Compared to other types of low-carbon hydrogen, including green hydrogen produced from electrolysis powered by renewable energy, blue hydrogen is a technologically developed and lower-cost option. Without a currently viable and cost-effective alternative to gray hydrogen that does not use fossil fuels, blue hydrogen can be a near-term option to facilitate the transition to a global hydrogen economy. Expert estimates of cost per emissions avoided range widely, but the International Energy Agency (IEA) estimates US$60–85/t CO for lower carbon capture rates (55–70%) and US$85–110/t CO for higher carbon capture rates (>90%). However, these costs are uncertain: with lower estimates of effectiveness, the cost could increase to ~US$260/t CO, including the cost to transport and store CO. If implemented with low GHG fugitive emissions and high CCS efficiencies, blue hydrogen can reduce emissions by more than 60% relative to current gray hydrogen production on a 100-yr CO₂‑eq basis. In this case, the climate impact of scaling blue hydrogen could be high. Estimates and targets for blue hydrogen production by 2050 range from ~30–85 Mt hydrogen. At that scale, even modest emissions savings relative to gray hydrogen (3 t CO₂‑eq/t hydrogen, 20-yr basis) would have a climate impact above 0.09 Gt CO-eq/yr by 2050. However, achieving this depends on the quality of the infrastructure and rate of technology scaling, both of which are unproven.

Why are we concerned?

While it has some advantages, blue hydrogen is still a less effective solution than green hydrogen, while costing more than gray hydrogen. Though it could be useful for near-term energy decarbonization, this risks taking resources away from renewable energy and green hydrogen development while perpetuating and increasing fossil fuel use. The infrastructure required to scale hydrogen-based energy is expensive and will require technical advances and policy incentives to be competitive with fossil fuels. There are mixed expert opinions about the realistic level of avoided emissions that blue hydrogen may reach. The theoretical worst-performing blue hydrogen plants (low capture rates, high methane leaks, high-emission electricity sources) have been predicted to lead to more emissions on a near-term basis than direct natural gas combustion. Additionally, there is uncertainty around whether CCS can meet its technical potential at a reasonable cost. While experts predict >95% carbon capture rates are possible, facilities currently in operation capture less than this target, some less than 60% of all emitted carbon. For blue hydrogen to be feasible and scalable, CO transport and storage need to be low-emitting, stable, and available. Only ~8% of CO currently captured from blue hydrogen production is injected in dedicated storage, with the rest used in industry, enhanced oil recovery, and other applications. Finally, an understudied risk is hydrogen leaks. Hydrogen transport and storage require larger volumes than fossil fuels, increasing the risk of leaks. Hydrogen has an indirect planet-warming effect by increasing the levels of other atmospheric GHGs. At scale, the IEA estimates that high hydrogen leak rates could contribute 0.1 Gt CO-eq/yr in emissions, potentially canceling out any positive climate impacts.

Solution in Action
References

Arcos, J. M. M., & Santos, D. M. F. (2023). The hydrogen color spectrum: Techno-economic analysis of the available technologies for hydrogen production. Gases, 3(1), Article 1. https://doi.org/10.3390/gases3010002

Bauer, C., Treyer, K., Antonini, C., Bergerson, J., Gazzani, M., Gencer, E., Gibbins, J., Mazzotti, M., McCoy, S. T., McKenna, R., Pietzcker, R., Ravikumar, A. P., Romano, M. C., Ueckerdt, F., Vente, J., & Spek, M. van der. (2021). On the climate impacts of blue hydrogen production. Sustainable Energy & Fuels, 6(1), 66–75. https://doi.org/10.1039/D1SE01508G

Blank, T. K., Molloy, P., Ramirez, K., Wall, A., & Weiss, T. (2022, April 13). Clean energy 101: The colors of hydrogen. RMI. https://rmi.org/clean-energy-101-hydrogen/

Collodi, G., Azzaro, G., Ferrari, N., & Santos, S. (2017). Techno-economic Evaluation of Deploying CCS in SMR Based Merchant H2 Production with NG as Feedstock and Fuel. Energy Procedia, 114, 2690–2712. https://doi.org/10.1016/j.egypro.2017.03.1533

Gorski, J., Jutt, T., & Wu, K. T. (2021). Carbon intensity of blue hydrogen production. https://www.pembina.org/reports/carbon-intensity-of-blue-hydrogen-revised.pdf

Hossain Bhuiyan, M. M., & Siddique, Z. (2025). Hydrogen as an alternative fuel: A comprehensive review of challenges and opportunities in production, storage, and transportation. International Journal of Hydrogen Energy, 102, 1026–1044. https://doi.org/10.1016/j.ijhydene.2025.01.033

Howarth, R. W., & Jacobson, M. Z. (2021). How green is blue hydrogen? Energy Science & Engineering, 9(10), 1676–1687. https://doi.org/10.1002/ese3.956

IEA. (2023). Hydrogen: Net zero emissions guide. https://www.iea.org/reports/hydrogen-2156#overview

IEA. (2023). Net zero roadmap: A global pathway to keep the 1.5 °C goal in reach. https://www.iea.org/reports/net-zero-roadmap-a-global-pathway-to-keep-the-15-0c-goal-in-reach

IEA. (2024). Global hydrogen review 2024. https://www.iea.org/reports/global-hydrogen-review-2024

Incer-Valverde, J., Korayem, A., Tsatsaronis, G., & Morosuk, T. (2023). “Colors” of hydrogen: Definitions and carbon intensity. Energy Conversion and Management, 291, 117294. https://doi.org/10.1016/j.enconman.2023.117294

Lewis, E., McNaul, S., Jamieson, M., Henriksen, M. S., Matthews, H. S., White, J., Walsh, L., Grove, J., Shultz, T., Skone, T. J., & Stevens, R. (2022). Comparison of commercial, state-of-the-art, fossil-based hydrogen production technologies. https://www.osti.gov/biblio/1862910  

Pettersen, J., Steeneveldt, R., Grainger, D., Scott, T., Holst, L.-M., & Hamborg, E. S. (2022). Blue hydrogen must be done properly. Energy Science & Engineering, 10(9), 3220–3236. https://doi.org/10.1002/ese3.1232

Romano, M. C., Antonini, C., Bardow, A., Bertsch, V., Brandon, N. P., Brouwer, J., Campanari, S., Crema, L., Dodds, P. E., Gardarsdottir, S., Gazzani, M., Jan Kramer, G., Lund, P. D., Mac Dowell, N., Martelli, E., Mastropasqua, L., McKenna, R. C., Monteiro, J. G. M.-S., Paltrinieri, N., … Wiley, D. (2022). Comment on “How green is blue hydrogen?” Energy Science & Engineering, 10(7), 1944–1954. https://doi.org/10.1002/ese3.1126

Sun, T., Shrestha, E., Hamburg, S. P., Kupers, R., & Ocko, I. B. (2024). Climate impacts of hydrogen and methane emissions can considerably reduce the climate benefits across key hydrogen use cases and time scales. Environmental Science & Technology, 58(12), 5299–5309. https://doi.org/10.1021/acs.est.3c09030

Udemu, C., & Font-Palma, C. (2024). Potential cost savings of large-scale blue hydrogen production via sorption-enhanced steam reforming process. Energy Conversion and Management, 302, 118132. https://doi.org/10.1016/j.enconman.2024.118132

Vallejo, V., Nguyen, Q., & Ravikumar, A. P. (2024). Geospatial variation in carbon accounting of hydrogen production and implications for the US Inflation Reduction Act. Nature Energy, 9(12), 1571–1582. https://doi.org/10.1038/s41560-024-01653-0

Wu, W., Zhai, H., & Holubnyak, E. (2024). Technological evolution of large-scale blue hydrogen production toward the U.S. Hydrogen Energy Earthshot. Nature Communications, 15(1), 5684. https://doi.org/10.1038/s41467-024-50090-w 

Credits

Lead Fellow 

  • Sarah Gleeson, Ph.D.

Internal Reviewer

  • Christina Swanson, Ph.D.
Speed of Action
left_text_column_width
Caveats
left_text_column_width
Risks
left_text_column_width
Consensus
left_text_column_width
Trade-offs
left_text_column_width
Action Word
Deploy
Solution Title
Blue Hydrogen
Classification
Keep Watching
Lawmakers and Policymakers
Practitioners
Business Leaders
Nonprofit Leaders
Investors
Philanthropists and International Aid Agencies
Thought Leaders
Technologists and Researchers
Communities, Households, and Individuals
Updated Date
Subscribe to