Figure 3. Conceptual diagram of a general recycling loop for (a) metals, (b) paper & cardboard, (c) plastics, and (d) glass and how technical substitutability determines the maximum share of recycled content due to quality constraints. Graphics for (b), including the MRF and manufacturing plant for (a), (c), and (d), were modified from International Paper (n.d.). BioRender and Canva were used to make the remaining graphics.
Image
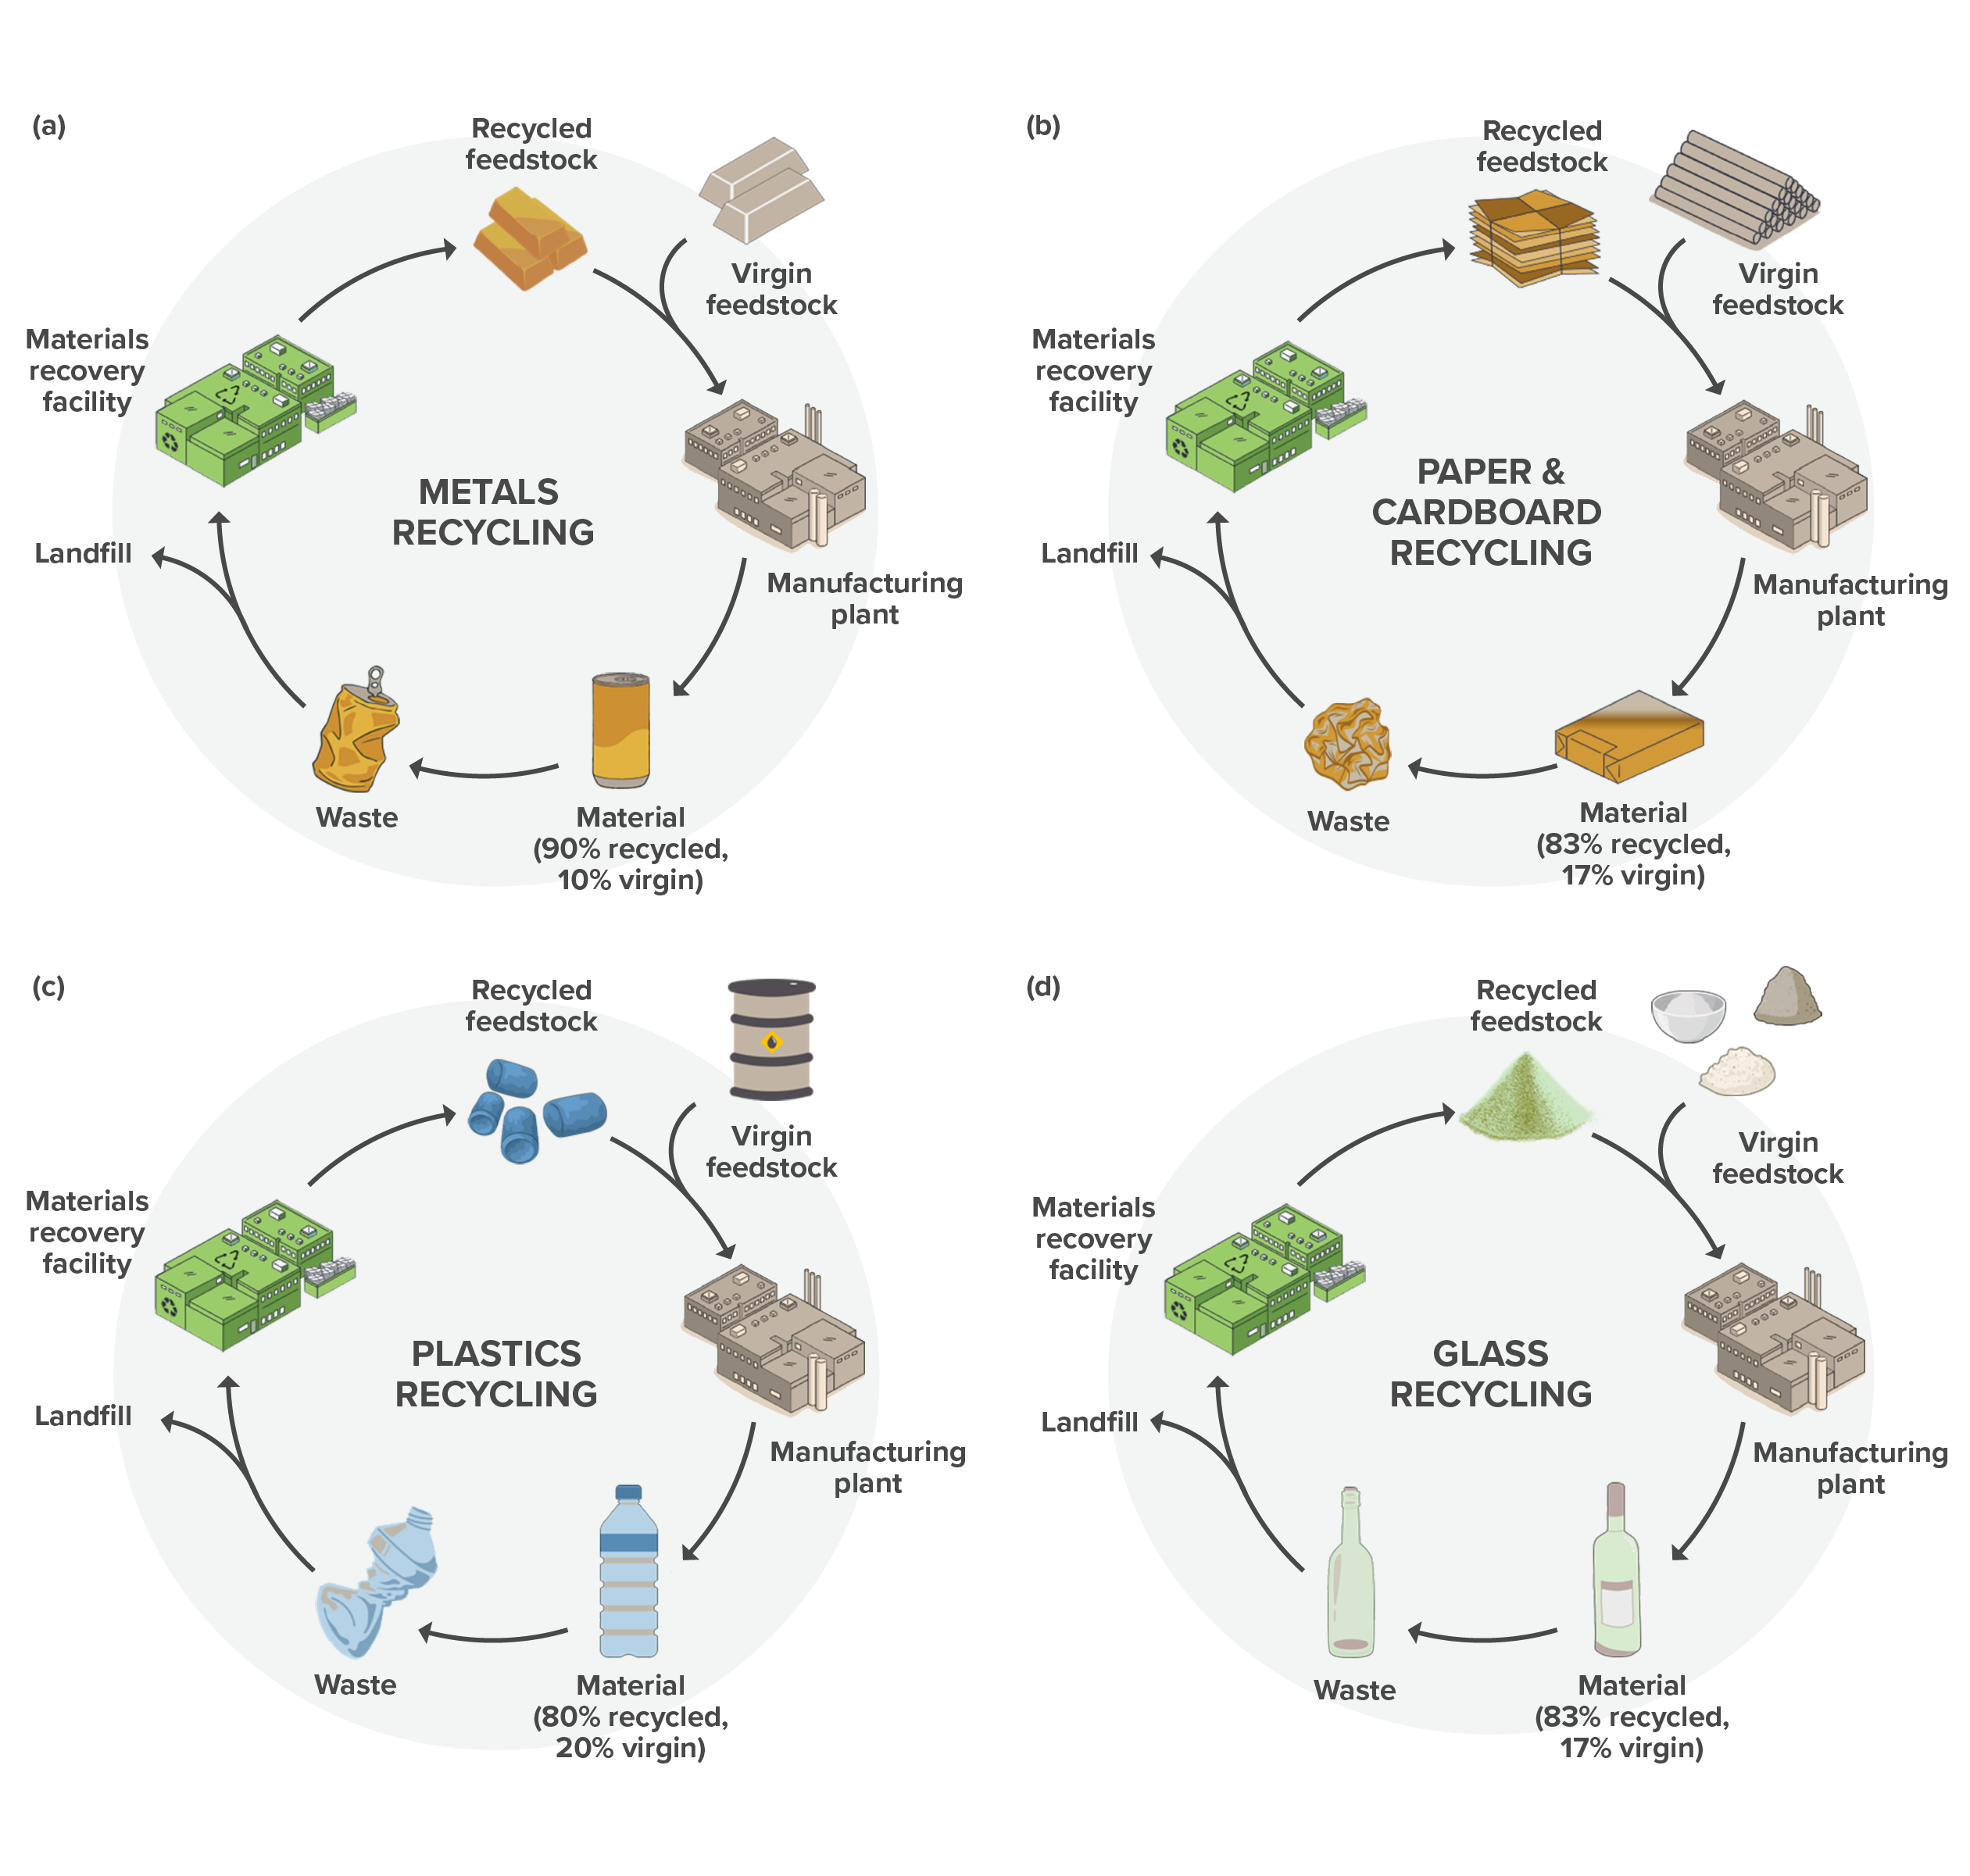
Source: International Paper. (n.d.). Paper’s life cycle: The recycling process [Infographic]. Retrieved June 10, 2025.