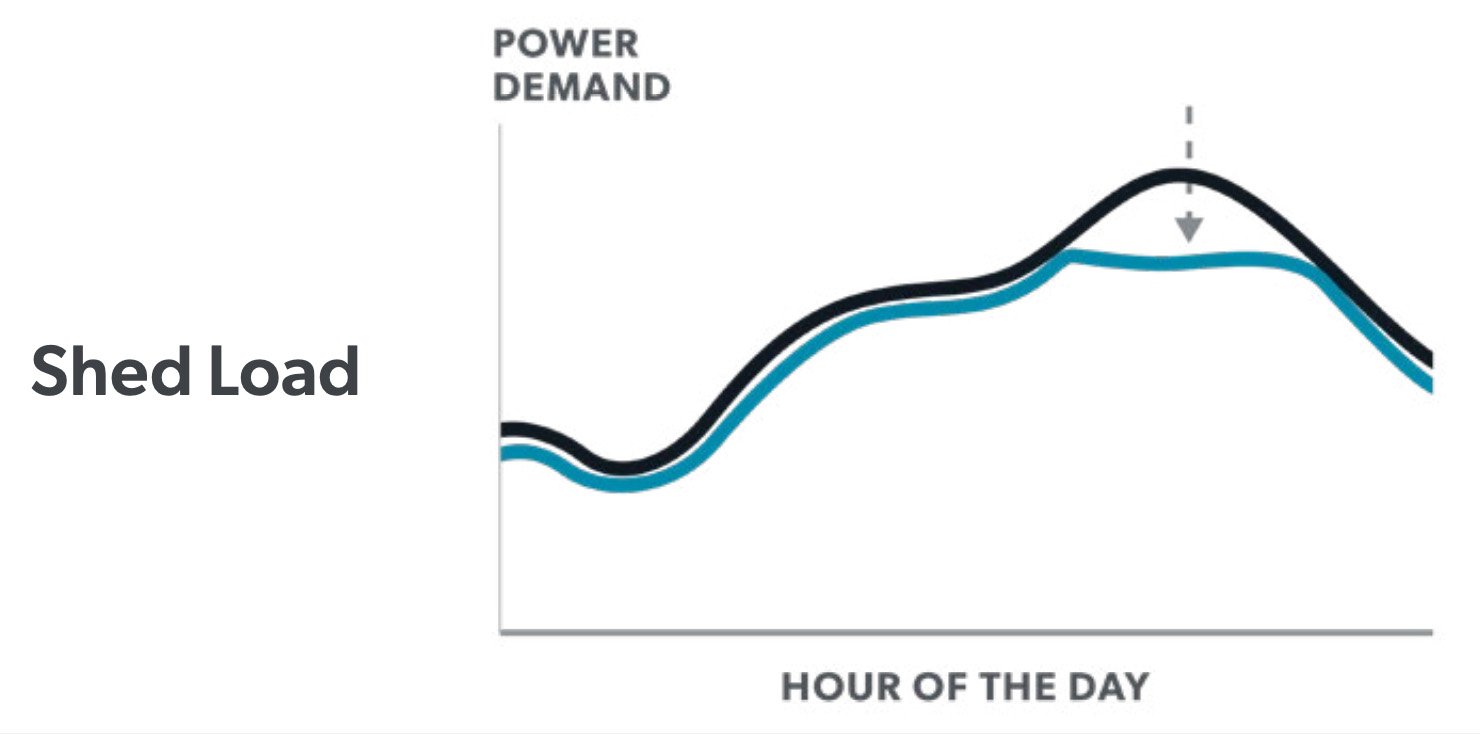
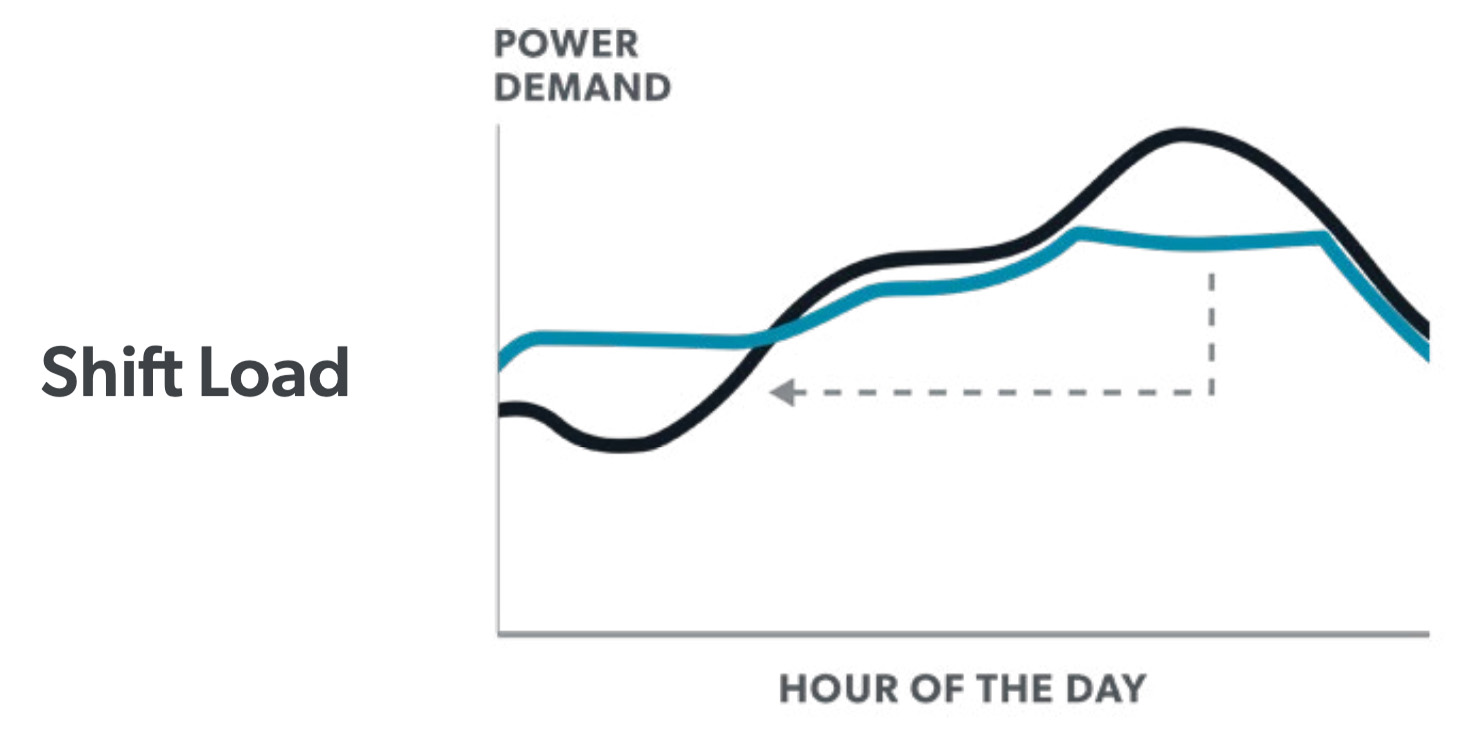
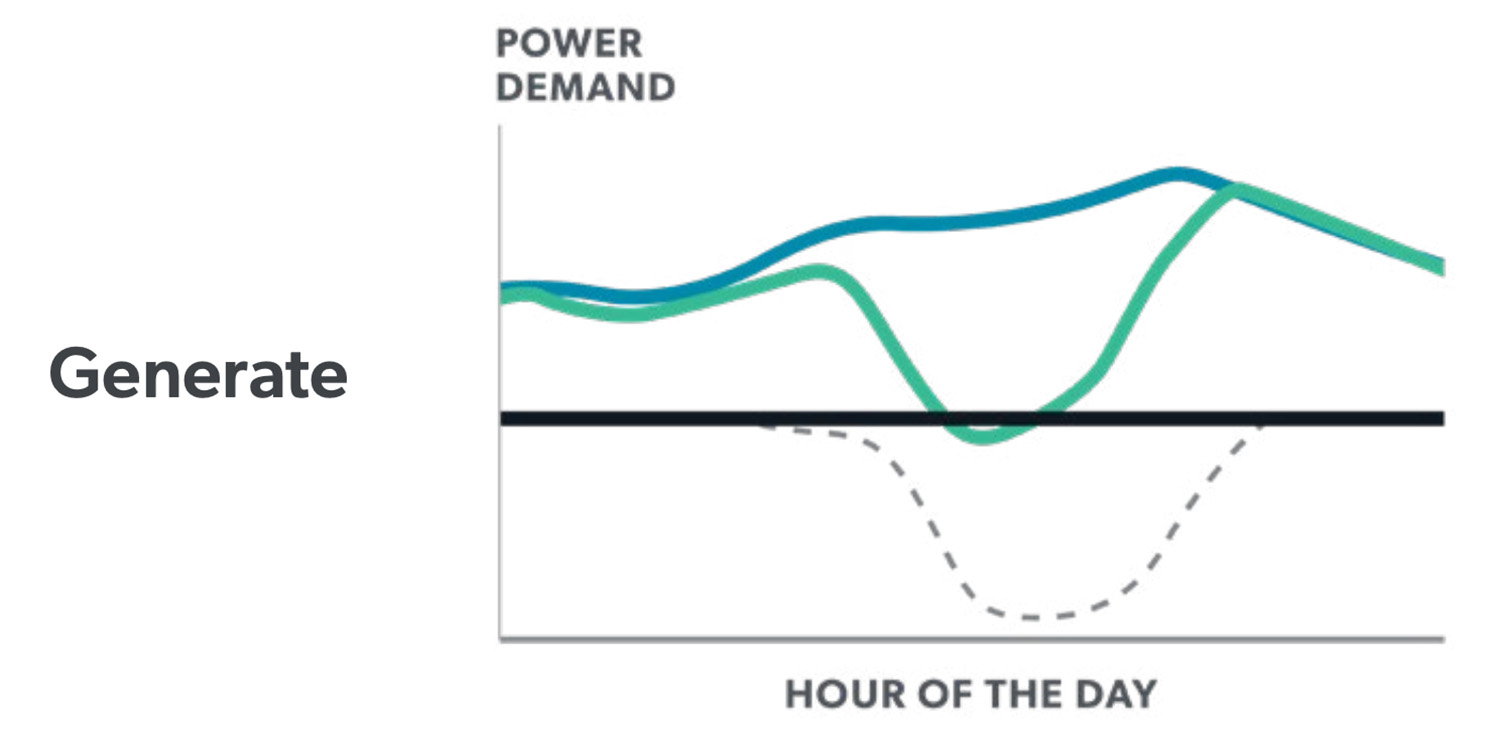
As we work to decarbonize the electricity and buildings sectors worldwide, the timing of electricity generation compared with our electricity use matters more than ever. New, clean sources of electricity generation don’t have the same characteristics as our traditional sources, which have been primarily powered by polluting fossil fuels. If we ask for a single renewable alternative to “replace” a fossil fuel power plant, we’re likely to be disappointed. Traditional power plants driven by fossil fuels or nuclear power have supported grid reliability in a couple of big ways: providing consistent, round-the-clock power or serving as “peaker” plants that can change their output quickly to meet demand. When electricity demand is independent of the power sources that are available, renewable power plants have limited ability to provide those same benefits, although they can pair up with other types of renewable power or with energy storage to provide some of these reliability benefits.
But if we consider the electricity sector as a whole – including different types of power plants, energy storage options, and smaller power generation options like distributed solar PV – along with all the buildings and other facilities consuming electricity, we’ll find many options for reaching a 100% clean power sector. For example, solar PV power and wind power are often a good partnership in locations where wind ramps up at night. The supply of electricity varies over time, and how it varies depends on which source we’re looking at. We aren’t in control of when the sun shines or the wind blows, but we can rely on multiple power sources when their timing is complementary.
If we look even further beyond the power plants and utilities to consider what’s happening in buildings, we see that demand for electricity also varies over time. Understanding when buildings are using electricity and why will point us to more opportunities to shape their power demands. When we have flexibility on the demand side, buildings can ask for more electricity when clean energy is available and less electricity when clean energy is limited.
Let’s look at a recent day, July 14, 2024, in Texas1 to better understand what’s actually happening on the grid and how we can time our electricity usage to maximize clean power.
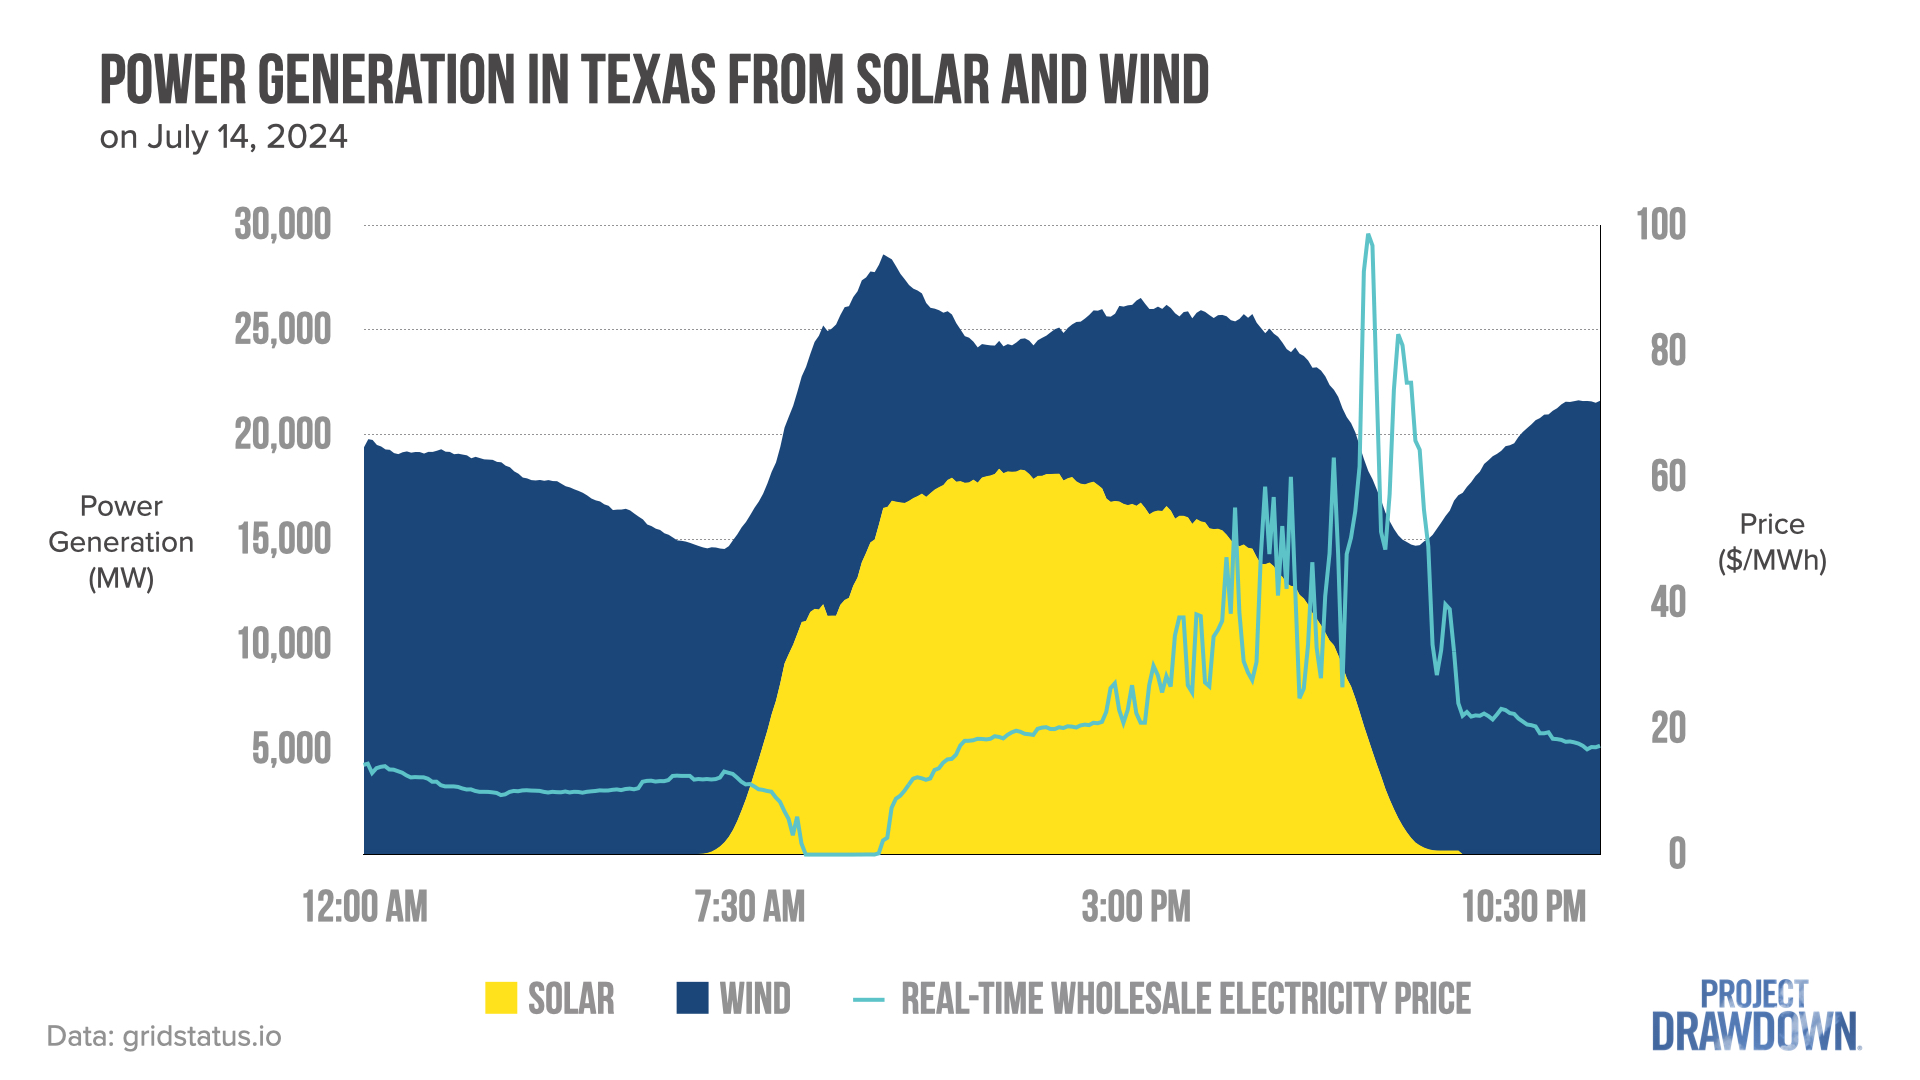
Figure 1. Power generation from solar PV and wind with real-time wholesale electricity price in Texas on July 14, 2024.
In Figure 1, solar power, shown in yellow, is available on the grid mostly between 7 am and 8 pm, as we expect during Daylight Savings time. Wind power, in dark blue, is mostly available during the nighttime hours, but some wind is available during the day, too. The light blue line shows how real-time wholesale prices for electricity2 are changing within this system. Prices vary throughout the grid, but this is an average wholesale price that reflects what a utility might be paying (per megawatt-hour of electrical energy) to acquire electricity that will meet the demand coming from its customers.
Prices for electricity vary throughout the day and throughout the grid. Even if a residential customer pays the same amount of money for a kilowatt-hour (kWh) used at 7:30 am and another kWh used at 7:30 pm, the kWh used in the evening was probably a lot more expensive to provide. Even though you don’t see much price variation on your residential power bill, utilities are selling and purchasing electricity in response to changing conditions throughout the day. Note that around 7 pm, solar power drops off steeply, and prices increase and become more variable. This is a normal pattern.
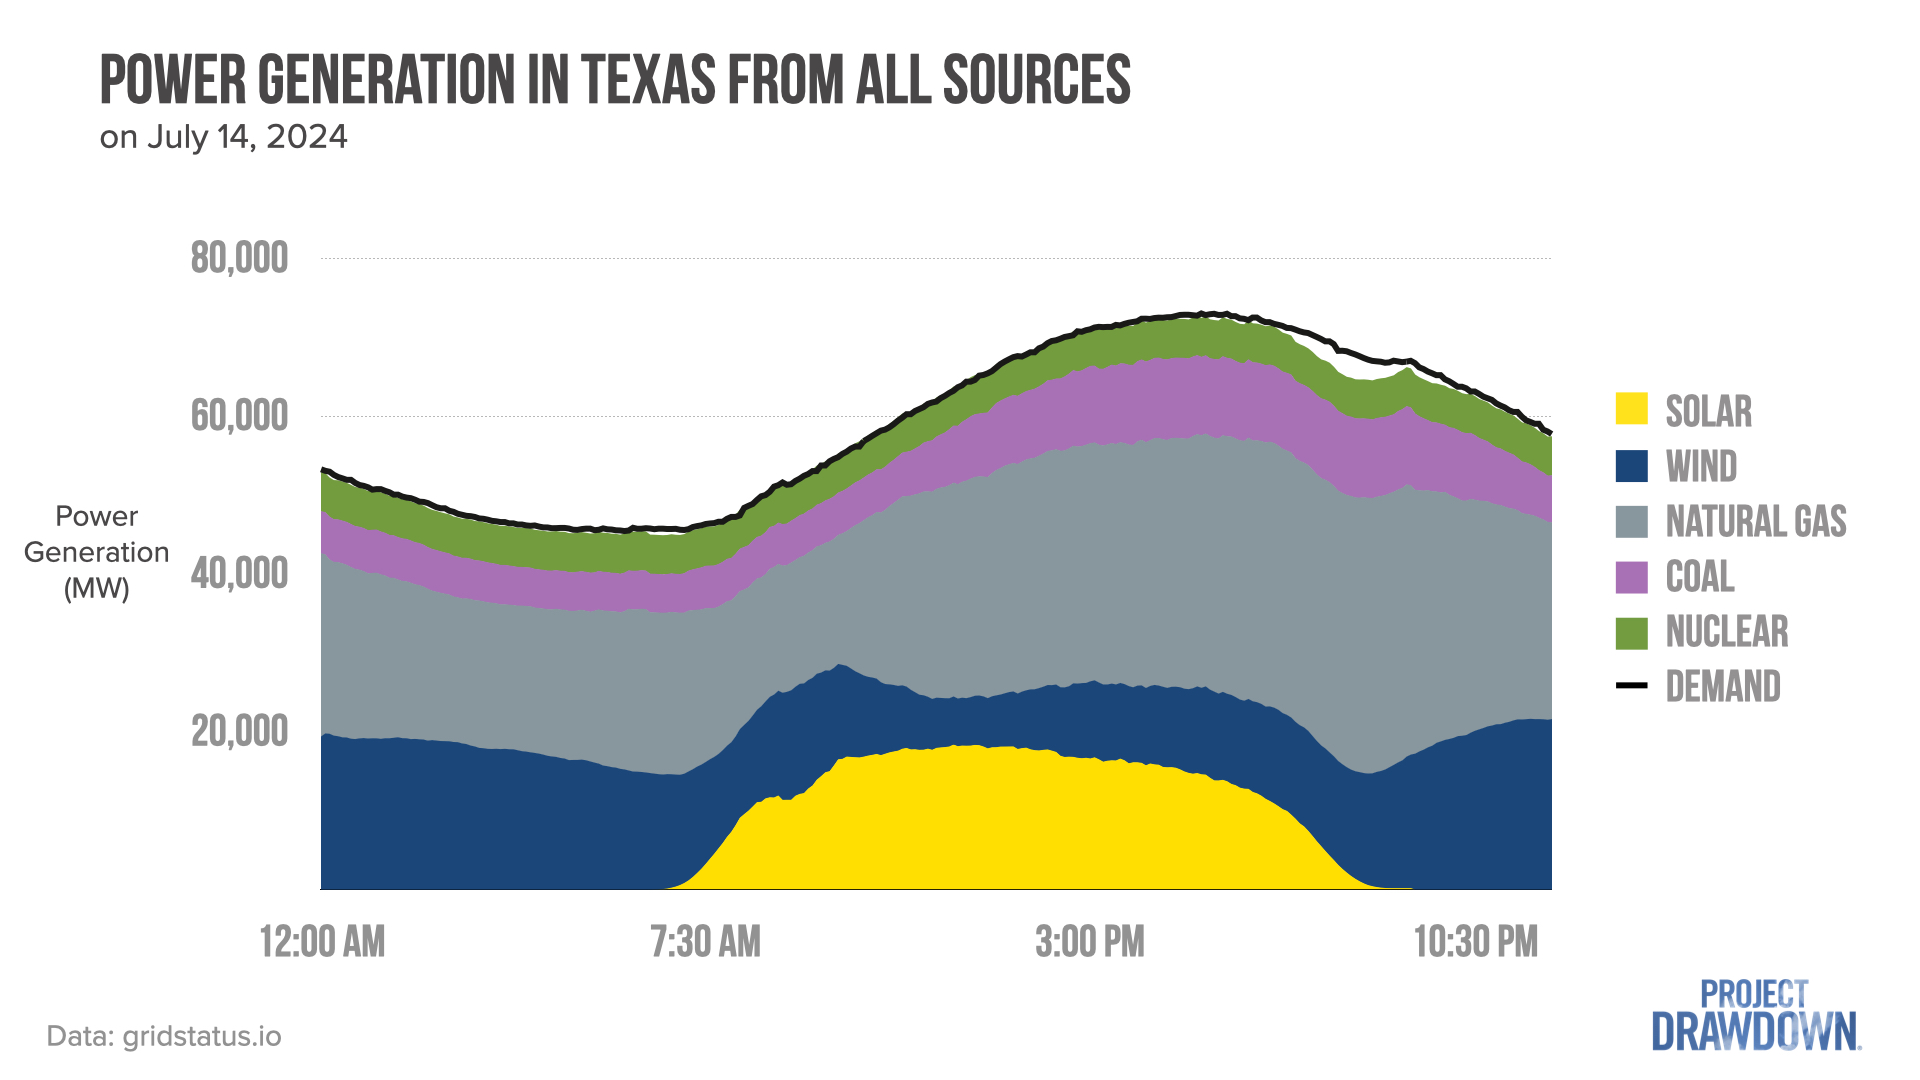
Why are prices so different? Let’s take a big-picture look at the system in Figure 2. At any given time, we have a certain demand for electricity and a certain set of power plants that are either running or have the potential to start up. The demand for electricity, shown as a thick black line, shows how much power is being consumed across the grid at each point in the day. Buildings and other electricity consumers start using more power around sunrise, they use even more throughout the day, and then they use gradually less power after sunset. This is also a normal pattern.
The rest of the power demand is met by other types of power plants: natural gas, coal, and nuclear plants3. But most of the flexibility is provided by natural gas plants – they are ramping up and down to meet changes in the load. Periods of high demand are called peaks, and natural gas plants are commonly used as “peakers” to help out during a peak. As is typical elsewhere, the coal and nuclear plants don’t ramp up or down much during the day.
Figure 2. Power generation from – almost – all sources with real-time electricity demand in Texas on July 14, 2024.
The goal is to remove coal and natural gas from this mix and scale up renewable and clean power while still meeting demand. That means the yellow and blue bands would need to be much taller, and ideally, the combined power from solar and wind would track along with the black demand curve. While we’re not in control of when those resources are available, we are in control of the demand.
As consumers, we don’t see the real costs that utilities are paying to get electricity to us, and we don’t know how to sort out the emissions cost that the planet is paying for our electricity use. We need markets that incentivize clean and reliable electricity, not just cheap electricity. We need smarter grids and buildings to exchange information that can bring the supply and demand curves closer together without calling on fossil fuel generators. That means governments, utilities, electricity market operators and participants, technology developers, and grid researchers all have important roles to play. With everything we’ve learned in the last decade of expansive growth in solar and wind power, along with these key opportunities for buildings to collaborate with the electricity sector, we have an enormous toolbox to draw from when decarbonizing the electricity and buildings sector. It’s high time we use timing to our advantage for a cleaner, healthier planet.
1 Electric Reliability Council of Texas (ERCOT) system. ERCOT covers most, but not all, of the state of Texas. Within the system, multiple utilities are electrically connected together, and their operating frequency is synchronized.
2 Locational Marginal Price (LMP) at aggregate settlement point HB_HUBAVG. An LMP tells us how much it will cost to generate another megawatt-hour of electricity at a particular place in the system. The aggregate LMP shown averages together LMPs from different parts of the ERCOT system.
3 Difference between generators shown and demand is due to: hydropower, other types of power generation, or energy storage charging & discharging. Each of these make little contribution to the overall power profile and have been hidden from the graph for clarity.
Amanda D. Smith, Ph.D., is a senior scientist at Project Drawdown with expertise in building science and distributed energy systems.
This work was published under a Creative Commons CC BY-NC-ND 4.0 license. You are welcome to republish it following the license terms.


