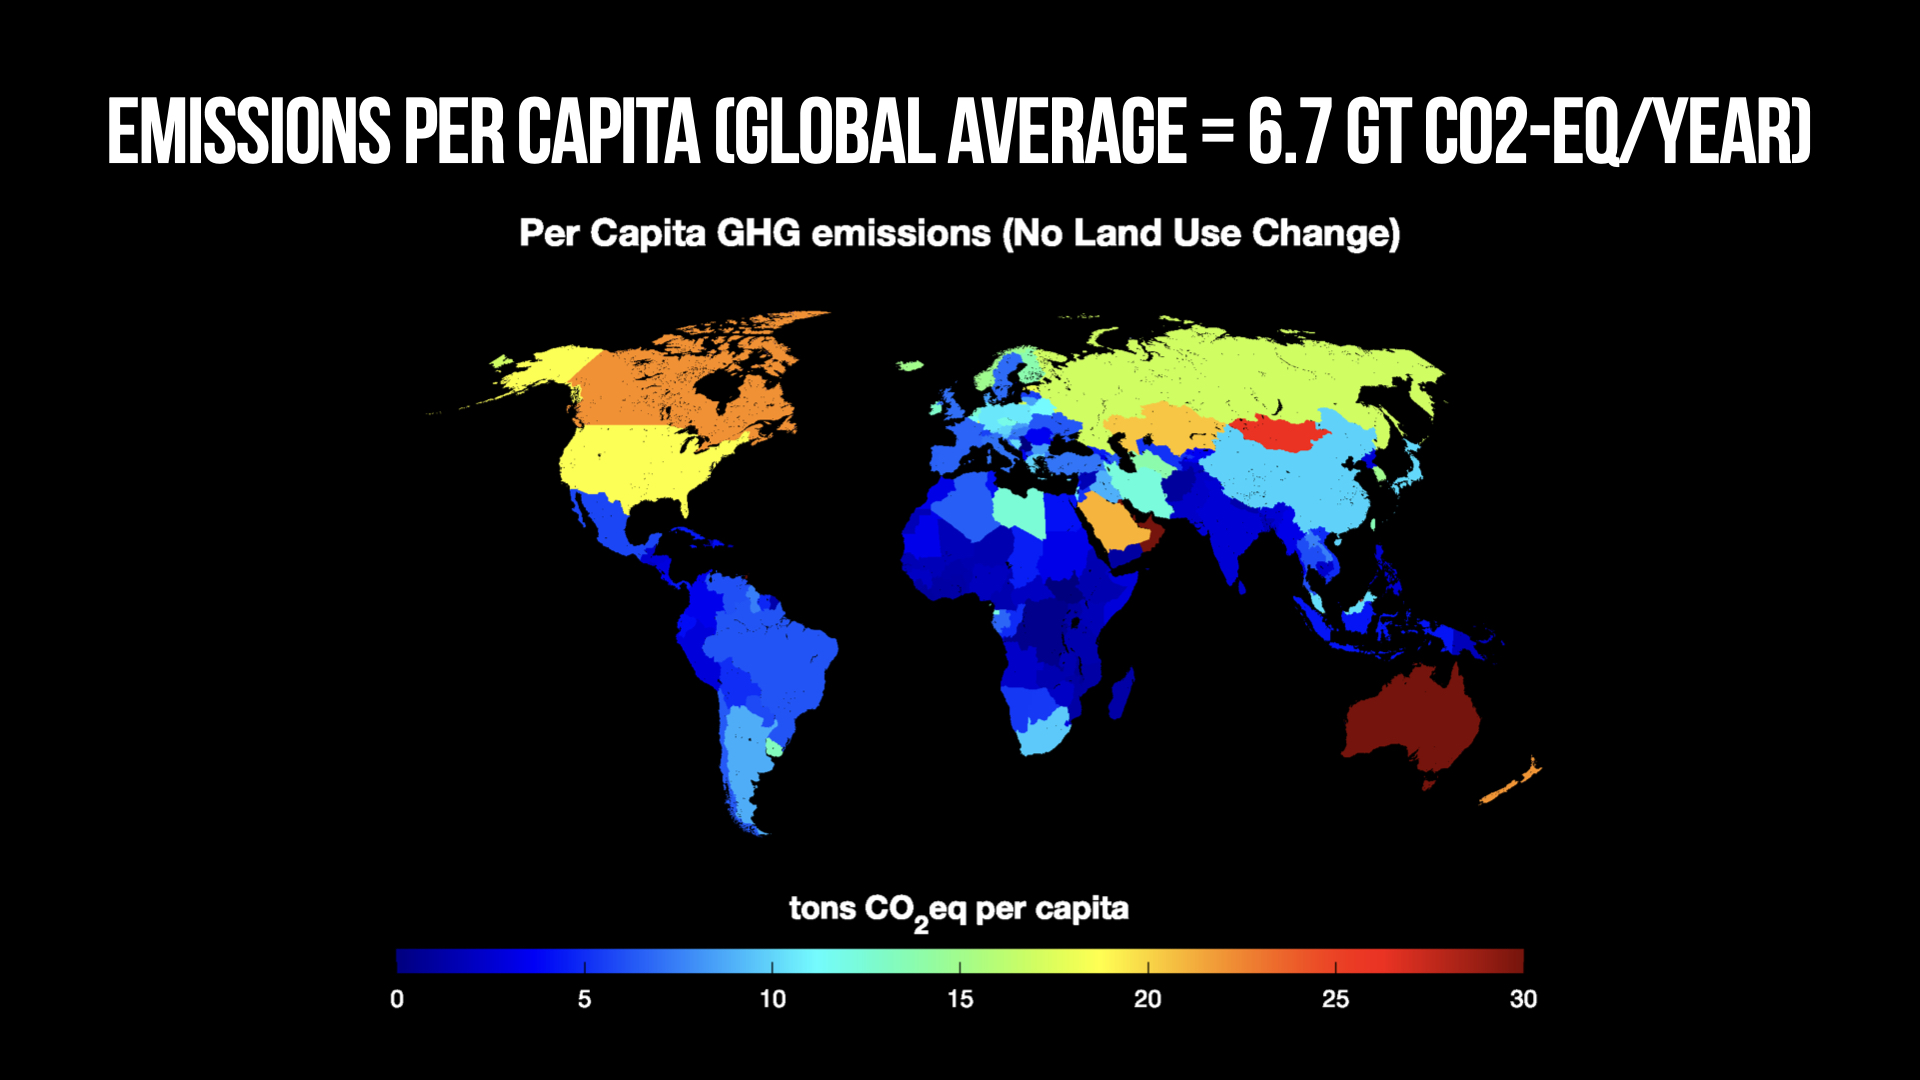
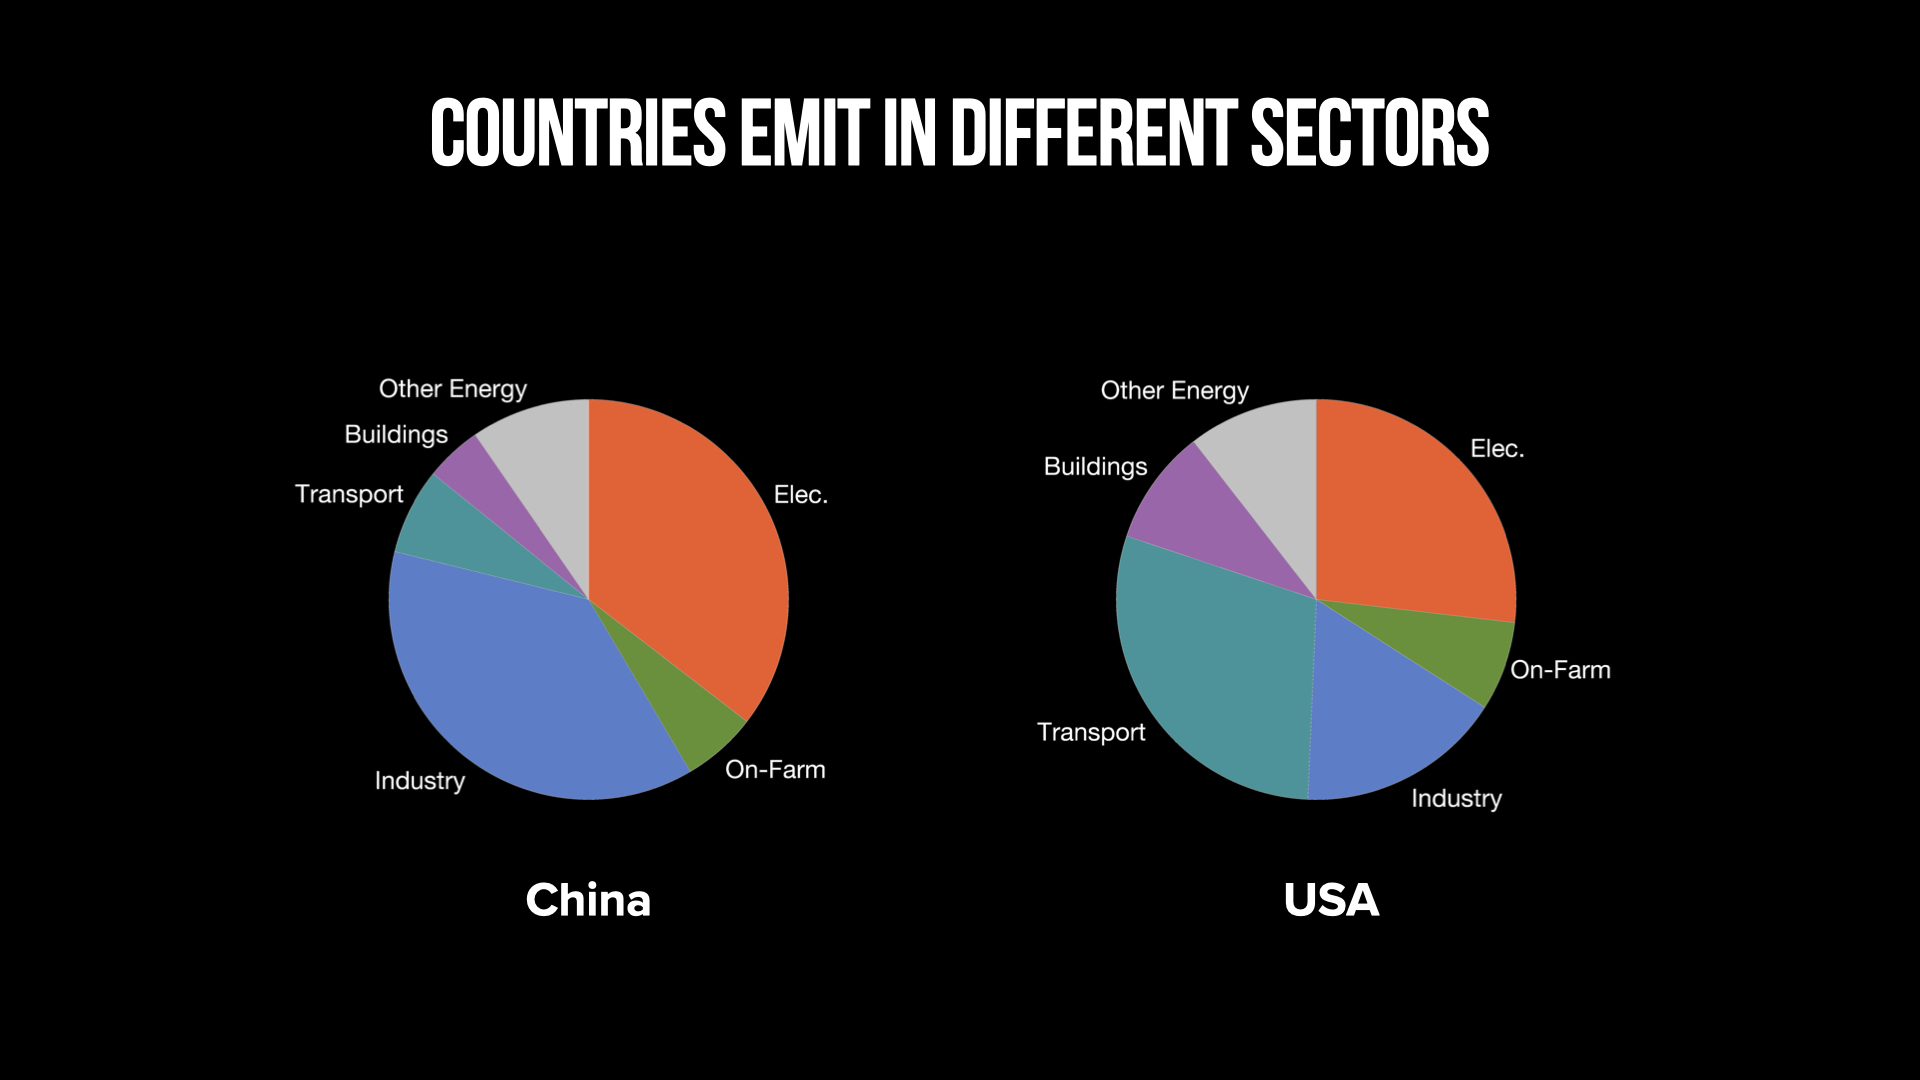
In this Project Drawdown Briefing, James Geber explored how global greenhouse gas emissions are changing – for better and for worse – across countries, sectors, and time.
See below for key takeaways, resources, and downloadable graphics and charts.
In this Project Drawdown Briefing, James Geber explored how global greenhouse gas emissions are changing – for better and for worse – across countries, sectors, and time.
See below for key takeaways, resources, and downloadable graphics and charts.
To download, click the chart or graphic you are interested in then right-click and save the image as a PNG or JPG to your computer. All charts and graphics are freely available to use as long as they are appropriately credited.
Join the 80,000+ subscribers discovering how to drive meaningful climate action around the world! Every other week, you'll get expert insights, cutting-edge research, and inspiring stories.