Sector Color
17A1A6

Enhance Public Transit

Image
Image
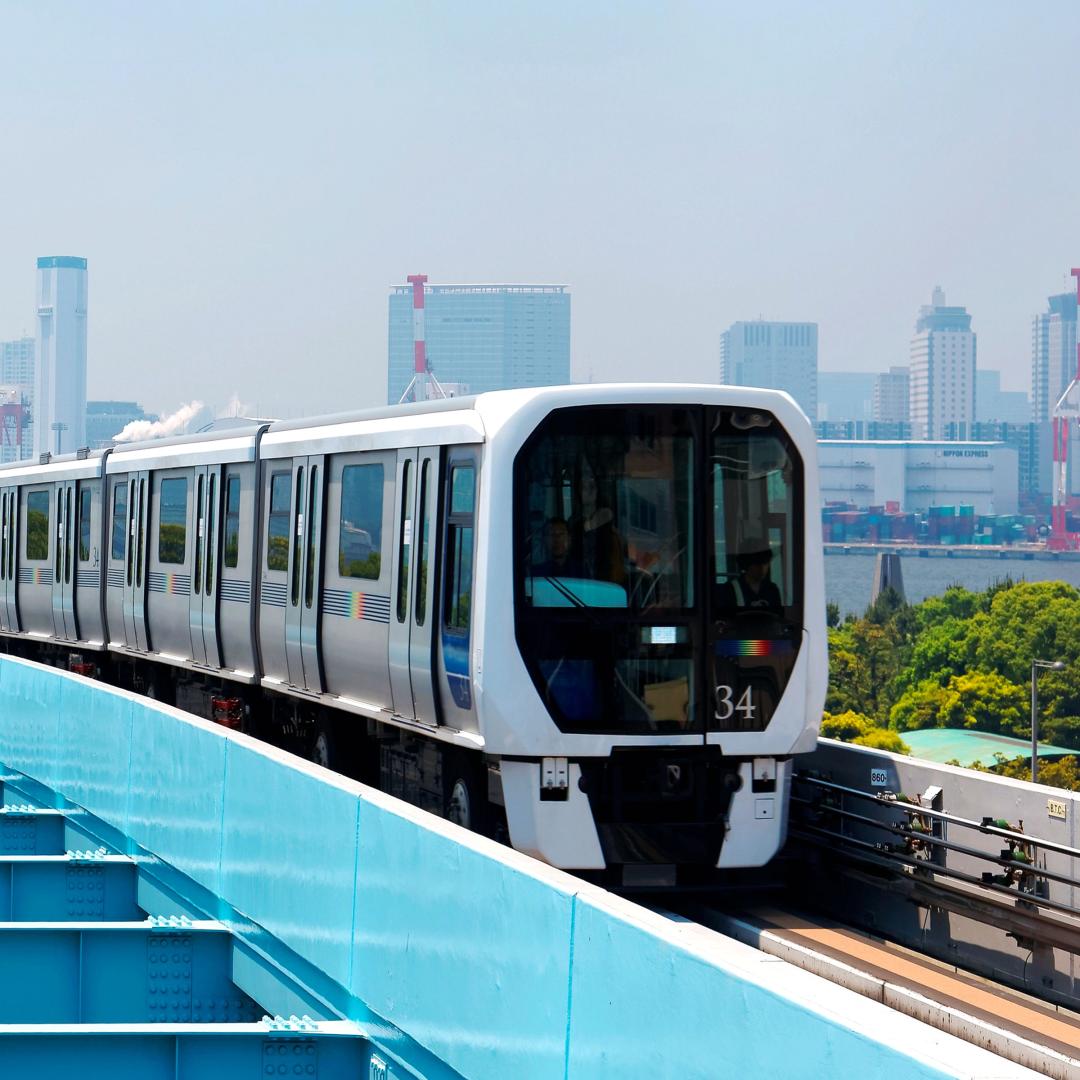
Train with city in the distance
Coming Soon
Off
Summary

We define the Enhance Public Transit solution as increasing the use of any form of passenger transportation that uses publicly available vehicles (e.g., buses, streetcars, subways, commuter trains, and ferries) operating along fixed routes. It does not include increasing the use of publicly available forms of transportation without fixed routes, such as taxis, except when these transport options supplement a larger public transit system (for example, to help passengers with disabilities). It also does not include increasing the use of vehicles traveling over long distances, such as intercity trains, intercity buses, or aircraft. The cost per climate unit is the cost to the transit provider, not the passenger.

Overview

Public transit vehicles are far more fuel-efficient – and thus less GHG-intensive – on a per-pkm basis than fossil fuel–powered cars. Diesel-powered buses emit fewer GHGs/pkm than cars because of their much higher occupancy. Electric buses further reduce GHG emissions (Bloomberg New Energy Finance, 2018), as do forms of public transit that already run on electricity. Finally, a fleet of large, centralized public transit vehicles operating along fixed routes is usually easier to electrify than a fleet of fossil fuel–powered cars. 

Enhancing public transit to reduce emissions from transportation relies on two processes. First is increasing the modal share of existing public transit networks by encouraging people to travel by public transit rather than car. This requires building new public transit capacity while also overcoming political, sociocultural, economic, and technical hurdles. Second is improving the emissions performance of public transit networks through electrification and efficiency improvements. We accommodate the latter in this solution by assuming that all shifted trips to buses are electric buses.

These two processes are linked in complex ways. For example, construction of the new public transit networks needed to accommodate additional demand creates an opportunity to install low-carbon vehicles and infrastructures, and bringing additional passengers onto an underused public transit network generates close to zero additional GHG emissions. However, since these complexities are difficult to calculate, we assume that all increases in public transit ridership are supported by a linear increase in capacity.

Buses, trains, streetcars, subways, and other public-transit vehicles predate cars. During the 19th century, most cities developed complex and efficient networks of streetcars and rail that carried large numbers of passengers (Norton, 2011; Schrag, 2000). As a result, it’s clear that a good public transit network can provide for the basic mobility needs of most people, and can therefore substitute for most – if not all – transportation that fossil fuel–powered cars currently provide. Today, public transit networks worldwide already collectively deliver trillions of pkm, not only in big cities but also in small towns and rural areas. 

We identified several different types of public transit:

Buses

Low-capacity vehicles running on rubber tires on roads. Buses in the baseline are a mix of diesel and electric. For the purposes of this solution, we assume that all buses serving shifted trips are electric.

Trams or streetcars

Mid-capacity vehicles running on steel rails that for at least part of their routes run on roads with traffic, rather than in a dedicated rail corridor or tunnel.

Metros, subways, or light rail

High-capacity urban train systems using their own dedicated right-of-way that may or may not be underground.

Commuter rail

Large trains running mostly on the surface designed to bring large numbers of commuters from the suburbs into the core of a city that often overlap with regional or intercity rail.

Other modes

Ferries, cable cars, funiculars, and other forms of public transit that generally play a marginal role.

We assessed all modes together rather than individually because public transit relies on the interactions among different vehicles to maximize the reach, speed, and efficiency of the system. Public transit reduces emissions of CO₂,  methane, and nitrous oxide to the atmosphere by replacing fuel-powered cars, which emit these gases from their tailpipes. Some diesel-powered buses in regions that have low quality diesel emit black carbon. The black carbon global annual total emissions from transportation is negligible compared with carbon emissions and is therefore not quantified in our study. 

References

American Public Transit Association. (2020). Economic impact of public transportation investment – American Public Transportation Association. https://www.apta.com/research-technical-resources/research-reports/economic-impact-of-public-transportation-investment/

American Public Transit Association. (2021). National Transit Database Tables. American Public Transportation Association. https://www.apta.com/research-technical-resources/transit-statistics/ntd-data-tables/

Beaudoin, J., Farzin, Y. H., & Lin Lawell, C.-Y. C. (2015). Public transit investment and sustainable transportation: A review of studies of transit’s impact on traffic congestion and air quality. Research in Transportation Economics, 52, 15–22. https://doi.org/10.1016/j.retrec.2015.10.004

Bloomberg New Energy Finance. (2018). Electric buses in cities: Driving towards cleaner air and lower CO₂ .

Börjesson, M., Fung, C. M., & Proost, S. (2020). How rural is too rural for transit? Optimal transit subsidies and supply in rural areas. Journal of Transport Geography88, 102859. https://doi.org/10.1016/j.jtrangeo.2020.102859

Borck, R. (2019). Public transport and urban pollution. Regional Science and Urban Economics, 77, 356–366. https://doi.org/10.1016/j.regsciurbeco.2019.06.005

Brown, A. E. (2017). Car-less or car-free? Socioeconomic and mobility differences among zero-car households. Transport Policy, 60, 152–159. https://doi.org/10.1016/j.tranpol.2017.09.016

Brunner, H., Hirz, M., Hirschberg, W., & Fallast, K. (2018). Evaluation of various means of transport for urban areas. Energy, Sustainability and Society8(1), 9. https://doi.org/10.1186/s13705-018-0149-0

Christensen, L., & Vázquez, N. S. (2013). Post-harmonised European National Travel Surveys. Proceedings from the Annual Transport Conference at Aalborg University20(1), Article 1. https://doi.org/10.5278/ojs.td.v1i1.5701

Department for Transport. (2024). Transport Statistics Finder: Interactive Dashboard. Department for Transport. https://app.powerbi.com/view?r=eyJrIjoiMGE2YTQ5YTMtMDkwNC00MjBmLWFkNjUtMjBjZjUzZWU0ZjNmIiwidCI6IjI4Yjc4MmZiLTQxZTEtNDhlYS1iZmMzLWFkNzU1OGNlNzEzNiIsImMiOjh9

Ecke, L. (2023, December 19). German Mobility Panel—Startseite (KIT) [Text]. Lisa Ecke. https://mobilitaetspanel.ifv.kit.edu/english/

Federal Highway Administration. (2022). Summary of Travel Trends: 2022 National Household Travel Survey. US Department of Transportation. https://nhts.ornl.gov/assets/2022/pub/2022_NHTS_Summary_Travel_Trends.pdf

Goel, D., & Gupta, S. (2017). The Effect of Metro Expansions on Air Pollution in Delhi. The World Bank Economic Review, 31(1), 271–294. https://doi.org/10.1093/wber/lhv056

Gouldson, A., Sudmant, A., Khreis, H., & Papargyropoulou, E. (2018). The Economic and Social Benefits of Low-Carbon Cities: A Systematic Review of the Evidence. https://urbantransitions.global/en/publication/the-economic-and-social-benefits-of-low-carbon-cities-a-systematic-review-of-the-evidence/

Guo, S., & Chen, L. (2019). Can urban rail transit systems alleviate air pollution? Empirical evidence from Beijing. Growth and Change, 50(1), 130–144. https://doi.org/10.1111/grow.12266

Health Affairs. (2021). Public Transportation in the U.S. RWJF. https://www.rwjf.org/content/rwjf-web/us/en/insights/our-research/2021/07/public-transportation-in-the-us-a-driver-of-health-and-equity.html

Hemmat, W., Hesam, A. M., & Atifnigar, H. (2023). Exploring noise pollution, causes, effects, and mitigation strategies: A review paper. European Journal of Theoretical and Applied Sciences, 1(5), Article 5. https://doi.org/10.59324/ejtas.2023.1(5).86

Ilie, N., Iurie, N., Alexandr, M., & Vitalie, E. (2014). Rehabilitation of the tram DC traction with modern power converters. 2014 International Conference and Exposition on Electrical and Power Engineering (EPE), 704–709. https://doi.org/10.1109/ICEPE.2014.6970000

International Transport Forum. (2020). Good to Go? Assessing the Environmental Performance of New Mobility (Corporate Partnership Board). OECD. https://www.itf-oecd.org/sites/default/files/docs/environmental-performance-new-mobility.pdf

IPCC. (2023). Renewable Energy Sources and Climate Change Mitigation—IPCChttps://www.ipcc.ch/report/renewable-energy-sources-and-climate-change-mitigation/

Kennedy, C. A. (2002). A comparison of the sustainability of public and private transportation systems: Study of the Greater Toronto Area. Transportation29(4), 459–493. https://doi.org/10.1023/A:1016302913909

Kuminek, T. (2013). Energy Consumption in Tram Transport. Logistics and Transporthttps://www.semanticscholar.org/paper/Energy-Consumption-in-Tram-Transport-Kuminek/2aa2d97130a8e51ea7f64913c2065e8437126774

Lim, L. K., Muis, Z. A., Hashim, H., Ho, W. S., & Idris, M. N. M. (2021). Potential of Electric Bus as a Carbon Mitigation Strategies and Energy Modelling: A Review. Chemical Engineering Transactions89, 529–534. https://doi.org/10.3303/CET2189089

Lovasi, G. S., Treat, C. A., Fry, D., Shah, I., Clougherty, J. E., Berberian, A., Perera, F. P., & Kioumourtzoglou, M.-A. (2023). Clean fleets, different streets: Evaluating the effect of New York City’s clean bus program on changes to estimated ambient air pollution. Journal of Exposure Science & Environmental Epidemiology, 33(3), 332–338. https://doi.org/10.1038/s41370-022-00454-5

Litman, T. (2024). Evaluating Public Transit Benefits and Costs.

Loukaitou-Sideris, A. (2014). Fear and safety in transit environments from the women’s perspective. Security Journal27(2), 242–256. https://doi.org/10.1057/sj.2014.9

Mahmoud, M., Garnett, R., Ferguson, M., & Kanaroglou, P. (2016). Electric buses: A review of alternative powertrains. Renewable and Sustainable Energy Reviews62, 673–684. https://doi.org/10.1016/j.rser.2016.05.019

Martinez, D., Mitnik, O., Salgado, E., Yãnez-Pagans, P., & Scholl, L. (2020). Connecting to Economic Opportunity: The Role of Public Transport in Promoting Women’s Employment in Lima | Journal of Economics, Race, and Policy. https://link.springer.com/article/10.1007/s41996-019-00039-9

Mees, P. (2010). Transport for Suburbia: Beyond the Automobile Age. Earthscan.

Norton, P. D. (2011). Fighting Traffic: The Dawn of the Motor Age in the American City. MIT Press.

Ortiz, F. (2002). Biodiversity, the City, and Sprawl. Boston University Law Review, 82(1), 145–194.

Padeiro, M., Louro, A., & da Costa, N. M. (2019). Transit-oriented development and gentrification: A systematic review. Transport Reviews39(6), 733–754. https://doi.org/10.1080/01441647.2019.1649316

Prieto-Curiel, R., & Ospina, J. P. (2024). The ABC of mobility. Environment International185, 108541. https://doi.org/10.1016/j.envint.2024.108541

Qi, Y., Liu, J., Tao, T., & Zhao, Q. (2023). Impacts of COVID-19 on public transit ridership. International Journal of Transportation Science and Technology, 12(1), 34–45. https://doi.org/10.1016/j.ijtst.2021.11.003

Rodrigues, A. L. P., & Seixas, Sonia. R. C. (2022). Battery-electric buses and their implementation barriers: Analysis and prospects for sustainability. Sustainable Energy Technologies and Assessments51, 101896. https://doi.org/10.1016/j.seta.2021.101896

Rodriguez Mendez, Q., Fuss, S., Lück, S., & Creutzig, F. (2024). Assessing global urban CO₂ removal. Nature Cities1(6), 413–423. https://doi.org/10.1038/s44284-024-00069-x

Serulle, N. U., & Cirillo, C. (2016). Transportation needs of low income population: A policy analysis for the Washington D.C. metropolitan region. Public Transport, 8(1), 103–123. https://doi.org/10.1007/s12469-015-0119-2

Schaller, B. (2017). Unsustainable? The Growth of App-Based Ride Services and Traffic, Travel and the Future of New York City. Schaller Consulting.

Schrag, Z. M. (2000). “The Bus Is Young and Honest”: Transportation Politics, Technical Choice, and the Motorization of Manhattan Surface Transit, 1919-1936. Technology and Culture41(1), 51–79.

Sertsoz, M., Kusdogan, S., & Altuntas, O. (2013). Assessment of Energy Efficiencies and Environmental Impacts of Railway and Bus Transportation Options. In I. Dincer, C. O. Colpan, & F. Kadioglu (Eds.), Causes, Impacts and Solutions to Global Warming (pp. 921–931). Springer. https://doi.org/10.1007/978-1-4614-7588-0_48

Statistics Netherlands. (2024, July 4). Mobility; per person, personal characteristics, modes of travel and regions [Webpagina]. Statistics Netherlands. https://www.cbs.nl/en-gb/figures/detail/84709ENG

Swanstrom, T., Winter, W., & Wiedlocher, L. (2010). The Impact of Increasing Funding for Public Transit. https://librarysearch.adelaide.edu.au/discovery/fulldisplay/alma9928308820601811/61ADELAIDE_INST:UOFA

Tayal, D., & Mehta, A. (2021). Working Women, Delhi Metro and Covid-19: A Case Study in Delhi-NCR | The Indian Journal of Labour Economics. https://link.springer.com/article/10.1007/s41027-021-00313-1?fromPaywallRec=true

UITP. (2024). A global analysis of transit data. CityTransit Data. https://citytransit.uitp.org

US Department of Transportation. (2010). Public transportation’s role in responding to climate change. US Department of Transportation. https://www.transit.dot.gov/sites/fta.dot.gov/files/docs/PublicTransportationsRoleInRespondingToClimateChange2010.pdf

Van Acker, V., & Witlox, F. (2010). Car ownership as a mediating variable in car travel behaviour research using a structural equation modelling approach to identify its dual relationship. Journal of Transport Geography18(1), 65–74. https://doi.org/10.1016/j.jtrangeo.2009.05.006

Venter, C., Jennings, G., Hidalgo, D., & Pineda, A. (2017). The equity impacts of bus rapid transit: A review of the evidence and implications for sustainable transport: International Journal of Sustainable Transportation: Vol 12 , No 2—Get Access. https://www.tandfonline.com/doi/full/10.1080/15568318.2017.1340528

Xiao, C., Goryakin, Y., & Cecchini, M. (2019). Physical Activity Levels and New Public Transit: A Systematic Review and Meta-analysis. American Journal of Preventive Medicine, 56(3), 464–473. https://doi.org/10.1016/j.amepre.2018.10.022

Credits

Lead Fellow

  • Cameron Roberts

Contributors

  • Ruthie Burrows

  • James Gerber

  • Yusuf Jameel 

  • Daniel Jasper

  • Heather Jones

  • Alex Sweeney

Internal Reviewers

  • Aiyana Bodi

  • Hannah Henkin

  • Ted Otte

  • Amanda Smith

  • Tina Swanson

Effectiveness

Our calculations suggest that an efficiently designed public transit system using the best available vehicle technologies (especially battery-electric buses) would save 58.26 t CO₂‑eq /million pkm (0.000058 t CO₂‑eq /pkm) on a 100-yr basis compared with fossil fuel–powered cars, in line with the estimates by other large transportation focused organizations (International Transport Forum, 2020; US Department of Transportation, 2010). This number is highly sensitive to public transit vehicle occupancy, which we estimated using the most recent available data (American Public Transit Association, 2021). Increasing the number of trips taken via public transit would likely increase occupancy, although ideally not to the point of passenger discomfort. This elevated ridership would significantly reduce public transit’s pkm emissions.

To arrive at this figure, we first estimated the emissions of fossil fuel–powered cars as 115 t CO₂‑eq /million pkm (0.000115 t/pkm, 100-yr basis). We then separately calculated the emissions of commuter rail, metros and subways, trams and light rail systems, and electric buses. We used data on the modal share of different vehicles within public transit systems around the world (although much of the available data are biased towards systems in the United States and Europe) to determine what each transit system’s emissions would be per million pkm given our per-million-pkm values for different transit vehicles (UITP, 2024). The median of these city-level values is 58 t CO₂‑eq /pkm (0.000058 t/pkm, 100-yr basis). Subtracting this value from the per-pkm emissions for cars gives us the public transit GHG savings figure cited above. Note that none of these values includes embodied emissions (such as emissions from producing cars, buses, trains, roads, etc.), or upstream emissions (such as those from oil refineries).

Pessimistic assumptions regarding the emissions and occupancy of public transit vehicles, and optimistic assumptions about emissions from cars, can suggest a much more marginal climate benefit from public transit (see the 25th percentile row in Table 1). In most cases, however, well-managed public transit is likely to produce a meaningful climate benefit. Such an outcome will depend on increasing the average occupancy of vehicles, which faces a challenge because transit has seen declining occupancies since the COVID-19 pandemic (Qi et al., 2023). For this reason, encouraging additional use of public transit networks without expanding these networks can have an outsized impact because it will allow the substitution of fossil fuel–powered car trips by trips on public transit vehicles for which emissions would not change meaningfully as a result of adding passengers.

left_text_column_width

Table 1. Effectiveness at reducing emissions.

Unit: t CO₂‑eq/million pkm, 100-yr basis

25th percentile 0.127
mean 61.76
median (50th percentile) 58.27
75th percentile 106.7

The extremely large range of values between the 25th and 75th percentile is the result of 1) the large diversity of public transit systems in the world and 2) multiplying multiple layers of uncertainty (e.g., varying estimates for occupancy, energy consumption per vehicle kilometer (vkm), percent of pkm reliant on buses vs. trains).

Left Text Column Width
Cost

Under present-day public transit costs and revenues, it costs the transit provider US$0.23 to transport a single passenger one kilometer. In comparison, travel by car costs the consumer US$0.42/pkm. On a per passenger basis, for the transit provider, public transit is almost 50% cheaper than car transportation, costing US$0.20/pkm less. Combined with the emissions reductions from using public transit, this means that the emissions reductions from shifting people out of cars onto public transit has a net negative cost, saving US$3,300/t CO₂‑eq mitigated (Table 2). 

This figure includes all relevant direct costs for travel by public transit and by car, including the costs of infrastructure, operations, vehicle purchase, and fuel. It does not include external costs, such as medical costs resulting from car crashes. Capital costs (i.e., the large fixed costs of building public transit infrastructure) are accounted for via the annualized capital costs listed in public transit agencies’ financial reports. 

A very large proportion of the total costs of providing public transit is labor (e.g., wages for bus drivers and station attendants). This cost is unlikely to come down as a result of technological innovations (Bloomberg New Energy Finance, 2018).

For an individual passenger, however, the marginal costs of public transit (i.e., the fares they pay) can sometimes be higher than the marginal costs of driving. This is in large part due to many external costs of driving which are borne by society at large (Litman, 2024). However, increasing the public transit availability would likely increase occupancy, which would in turn drive costs down.

left_text_column_width

Table 2. Cost per unit of climate impact.

Unit: 2023 US$/t CO₂‑eq , 100-yr basis

median -3300

Transit provider cost, not passenger cost.

Left Text Column Width
Learning Curve

Public transit is a largely mature technology with limited opportunities for radical cost-saving innovation. While our research did not find any papers reporting a learning curve in public transit as a whole, battery-electric buses are in fact subject to many of the same experience effects of other battery-electric vehicles. Although there are no studies assessing declines in the cost of electric buses as a whole, there are studies assessing learning curves for their batteries, which is the most costly component. The cost of batteries used in battery-electric buses has declined 19.25% with each doubling of installed capacity (Table 3).

left_text_column_width

Table 3. Learning rate: drop in cost per doubling of the installed solution base.

Unit: %

25th percentile 18.63
mean 19.25
median (50th percentile) 19.25
75th percentile 19.88

This applies only to the cost of batteries in electric buses, not to public transportation as a whole.

Left Text Column Width
Speed of Action

Speed of action refers to how quickly a climate solution physically affects the atmosphere after it is deployed. This is different from speed of deployment, which is the pace at which solutions are adopted.

At Project Drawdown, we define the speed of action for each climate solution as gradualemergency brake, or delayed.

Enhance Public Transit is a GRADUAL climate solution. It has a steady, linear impact on the atmosphere. The cumulative effect over time builds as a straight line.

left_text_column_width
Caveats

Public transit competes for passengers not just with cars, but also with other transportation modes – some of which have lower emissions on average. If an increase in public transit’s modal share comes at the expense of nonmotorized transportation (i.e., pedestrian travel or cycling), or electric bicycles, this will result in a net increase in emissions. Similarly, public transit could generate additional trips that would not have occurred if the public transit network those trips were taken on did not exist. Under this scenario, a net increase in emissions would occur; however, these new trips might bring additional social benefits that would outweigh these new emissions.

Low occupancy could also diminish the climate benefit of enhancing public transit. While it is certainly possible to build effective and efficient public transit networks in suburban and rural areas, there is a risk that such networks could have high per-pkm GHG emissions if they have low average occupancy (Mees, 2010). It is therefore important to efficiently plan public transit networks, ensure vehicles are right-sized and have efficient powertrains, and promote high levels of ridership even in rural areas to maximize the climate benefit of these kinds of networks.

Upscaling public transit networks – and, crucially, convincing more motorists to use them – is an enduring challenge that faces cultural resistance in some countries, issues with cost, and sometimes a lack of political will. Successfully enhancing public transit will require that these hurdles are overcome.

left_text_column_width
Current Adoption

In cities around the world surveyed over the last 15 years, public transit has an average modal share of approximately 26.2% of trips. In comparison, fossil fuel–powered cars account for 51.4% of all trips, while nonmotorized transportation accounts for 22.4% (Prieto-Curiel & Ospina, 2024). The 26.2% of trips taken via public transit corresponds to approximately 16.7 trillion pkm traveled on public transit in cities every year (Table 4).

These numbers are calculated from modal share data (i.e., the percentage of trips in a given city that are taken via various modes of transportation). We estimated total pkm traveled by assuming a global average daily distance traveled, using travel surveys from the United States as well as several European countries (Christensen & Vázquez, 2013; Department for Transport, 2024; Ecke, 2023; Federal Highway Administration, 2022; Statistics Netherlands, 2024). We used Prieto-Curiel and Ospina’s (2024) global population-weighted mean modal share as our global adoption value. The other statistical measures in Table 4 reflect the distribution of estimates drawn from the literature, most of which do not account for population, and therefore give too much weight to small cities, skewing the results. 

We assumed that Prieto-Curiel and Ospina’s data refers only to urban modal share. While the database does include some small towns and rural areas, most of the modal share data we found comes from cities. Public transit can be useful in rural areas (Börjesson et al, 2020), but we did not attempt to estimate rural public transit adoption in this assessment .

left_text_column_width

Table 4. Current (2024) adoption level.

Unit: million pkm/yr 

25th percentile 512,900
Population-weighted mean 16,720,000
median (50th percentile) 5,106,000
75th percentile 15,080,000

We used the population-weighted mean calculated by Prieto-Curiel and Ospina (2024) as our authoritative estimate to carry forward to other calculations.

Left Text Column Width
Adoption Trend

Based on data from Prieto-Curiel and Ospina (2024) and the UITP (2024) for 1,097 cities worldwide, the rate of adoption of public transit has not changed since 2010, with the median annual growth rate equal to 0 (Table 5). This was calculated using all of the cities in Prieto-Curiel and Ospina’s (2024) database for which modal share data exist.

Despite the lack of a global trend in public transit use, some cities, including Amsterdam, Edinburgh, and Leeds, report double-digit growth rates in the use of public transit.

left_text_column_width

Table 5. 2023–2024 adoption trend.

Unit: million pkm/yr

25th percentile -697,100
mean 71,490
median (50th percentile) 0.00
75th percentile 1,791,000
Left Text Column Width
Adoption Ceiling

Public transit could theoretically replace all trips currently undertaken by fossil fuel–powered cars. This would amount to 75 trillion pkm on public transit annually, worldwide (Table 6). This would not be feasible to achieve in practice, as it would require construction of new public transit vehicles and infrastructure on an unfeasibly large scale, and massive changes to living patterns for many people. It would also be much more expensive than we calculated above, because such a change would require extending public transit coverage into areas where it would be highly uneconomic. Public transit is capable of providing a good transportation option in rural areas, but there is a limit to its benefits when population densities are low even by rural standards. Even in cities, this scenario would require a radical redesign of some neighborhoods to prioritize public transit. Such large public transit coverage would also inevitably shift other modes of transportation, such as pedestrian travel and cycling, leading to an even higher pkm total than that suggested by current adoption of fossil fuel–powered cars.

left_text_column_width

Table 6. Adoption ceiling.

Unit: million pkm/yr

median (50th percentile) 75,000,000
Left Text Column Width
Achievable Adoption

The achievable range of public transit adoption is 22.2–41.9 trillion pkm traveled by public transit in cities globally.

To estimate the upper bound of achievable adoption, we assumed that urban trips taken by fossil fuel–powered car (currently 51.4% of trips globally) can be shifted to public transit until public transit increases to 76.6% of trips (the current highest modal share of public transit in any city with a population of more than 1 million) or until car travel decreases to 12.0% of trips (the current lowest modal share of fossil fuel–powered cars in any city with a population of more than 1 million). This equals a shift of 25.2 trillion pkm from fossil fuel–powered car travel to public transit, which, added to present-day public transit trips (16.7 trillion trips/yr), equals 41.9 trillion pkm/yr (Table 7).

To set the lower bound, we performed the same calculation as above, but on a regional basis, adding up all the resultant modal shifts to get a global figure. For example, every northern European city might reach the public transit modal share of London (44.5% of trips), while every South Asian city might reach that of Mumbai (52.0% of trips). Having done that, we then added together the public transit adoption rates from all world regions, apart from three (Polynesia, Micronesia, and Melanesia) for which we did not find any modal share data. This corresponds to a shift of 5.5 trillion pkm/yr from cars to public transit, and a total achievable public transit adoption rate of 22.2 trillion pkm/yr.

Achieving both of these levels of adoption would require not only major investments in expanding public transit networks, but also major changes in how cities are planned so as to allow more areas to be effectively served by transit. These levels of adoption would also require overcoming cultural and political resistance to abandoning cars in favor of public modes. However, unlike the scenario discussed under Adoption Ceiling, these scenarios are feasible, since they are based on real achievements by cities around the world.

left_text_column_width

Table 7. Range of achievable adoption levels.

Unit: million pkm/yr

Current Adoption 16,720,000
Achievable – Low 21,980,000
Achievable – High 41,910,000
Adoption Ceiling 75,000,000
Left Text Column Width

If all public transit trips were taken by fossil fuel–powered cars instead of by public transit, they would result in an additional 0.97 Gt CO₂‑eq/yr of emissions (Table 8).

The global potential climate impact of enhancing public transit, if all car trips were shifted onto public transit systems, is 4.37 Gt. As discussed under Adoption Ceiling, this is an unrealistic scenario.

In a more realistic scenario, if every city in the world shifted car traffic onto public transit until it reached the public transit modal share of Hong Kong (i.e., the high estimate of achievable adoption), it would save 2.44 Gt CO₂‑eq/yr globally. Meanwhile, if every city shifts car trips to public transit until it reaches the car modal share of the region’s least car-dependent city (i.e., the low estimate of achievable adoption), it would save 1.28 Gt CO₂‑eq/yr.

left_text_column_width

Table 8. Climate impact at different levels of adoption.

Unit: Gt CO₂‑eq/yr, 100-yr basis

Current Adoption 0.97
Achievable – Low 1.28
Achievable – High 2.44
Adoption Ceiling 4.37
Left Text Column Width
Additional Benefits

Air Quality

GHG emissions from transportation are often emitted with other harmful air pollutants. Consequently, reducing fuel consumption by replacing transport by fossil fuel–powered cars with public transit can lead to cleaner air. The scale of this benefit varies by location and is influenced by differences in emission levels between private and public transit travels and the relative demand substitutability between modes (Beaudoin et al., 2015). For U.S. cities, significant investment in public transit could cut pollution around 1.7% on average (Borck, 2019). The benefits are more significant in low- and middle-income countries, where fossil fuel–powered cars are more polluting due to lenient air quality regulations (Goel & Gupta, 2017Guo & Chen, 2019).

Health Benefits

Improved air quality due to enhanced public transit has direct health benefits, such as lowering cardiovascular disease risk, and secondary health benefits, such as increased physical activity (Xiao et al., 2019), fewer traffic-related injuries, lower rates of cancer, and enhanced access to health-care facilities and nutritious food (Gouldson et al., 2018; Health Affairs, 2021).

Equality

Limited access to transportation restricts labor participation, particularly for women. Expanding public transit can foster gender equity by improving women’s access to employment opportunities. For example, in Peru expansion of public transit has led to improvements in women’s employment and earnings (Martinez et al., 2020). Similarly, in India, the extension of the light rail system in Delhi has increased women’s willingness to commute for work (Tayal & Mehta, 2021).

Public transit enhances community connectivity by providing accessible transportation options. Expanded mobility allows individuals to reach employment, health-care, education, and recreational sites with greater ease, heightening social inclusion. The social equity benefits of public transit are especially significant for low-income people in terms of time and cost savings and safety and health benefits (Serulle & Cirillo, 2016; Venter et al., 2017)

Income and work

Investment in enhancing public transit can also generate substantial economic returns. The APTA estimated that each US$1 billion invested in transit can create 49,700 jobs and yield a five-to-one economic return (APTA, 2020). According to another study, shifting 50% of highway funds to mass transit systems in 20 U.S. metropolises could generate more than 1 million new transit jobs within five years (Swanstrom et al., 2010)

Nature protection

An indirect benefit of enhanced public transit is its contribution to reducing resource consumption, such as the minerals used in manufacturing personal vehicles. Enhanced public transit can also improve land-use efficiency by curbing urban sprawl, which helps reduce pollution and limit biodiversity loss (Ortiz, 2002). 

left_text_column_width
Risks

If expanded service on high-quality public transit systems replaced journeys from nonmotorized transportation or electric bicycles rather than from cars – or if expanded service on high-quality public transit systems generated journeys that would not have otherwise happened – this will have a net-negative climate impact, since public transit has higher per-pkm GHG emissions than electric bicycles or not traveling (International Transport Forum, 2020). 

There may be cases where public transit networks cannot be implemented efficiently enough to provide a meaningful benefit compared to fossil fuel–powered cars in terms of GHG emissions. This would occur in places where there are so few potential riders that most trips would have a very low occupancy. The result would be a much higher rate of emissions per pkm. However, effective public transit networks can be built in suburban and even rural areas (Börjesson et al., 2020; Mees, 2010).

Finally, expanding public transit networks has proven very difficult in recent years. Entrenched preferences for car travel, reluctance on the part of governments to invest heavily in new transit infrastructure, and local political challenges over land use, noise, gentrification, and similar issues are all obstacles to increased public transit use. Public transit expansion has faced stronger headwinds in recent years in particular, due to both the impact of the COVID-19 pandemic and competition from new (and mostly less sustainable) mobility services, such as app-based ride-hailing (Shaller, 2017).

left_text_column_width
Interactions with Other Solutions

Reinforcing

For people living without cars, public transit provides a crucial service that is hard to replace for certain kinds of trips, such as trips over long distances, with small children, or carrying large objects. As a result, public transit plays a large role in making it more viable for people to live without owning a car (Brown, 2017). Research suggests that the key to a low-carbon mobility system is to reduce the need for people to own cars altogether (Van Acker & Witlox, 2010).

left_text_column_width

Public transit requires a lot less space than cars. Some of this space could be reallocated to ecosystem conservation through revegetation and other land-based methods of GHG sequestration (Rodriguez Mendez et al., 2024).

left_text_column_width

Competing 

Electric cars and public transit compete for pkm. Consequently, increased use of public transit could reduce kilometers traveled using electric cars. 

left_text_column_width
Dashboard

Solution Basics

million passenger kilometers (million pkm)

tCO2-eq/unit/yr
58.27
units/yr
Current 1.67×10⁷2.2×10⁷4.19×10⁷
Achievable (Low to High)

Climate Impact

GtCO2-eq/yr
Current 0.97 1.282.44
US$ per tCO2-eq
-3,300
Gradual

CO₂, CH₄, N₂O

Trade-offs

Public transit vehicles are sometimes unsafe, particularly for vulnerable groups such as women (Loukaitou-Sideris, 2014). In some circumstances – although this remains controversial – new public transit routes can also lead to gentrification of neighborhoods, forcing people to move far away from city centers and use cars for travel (Padeiro et al., 2019). 

Expansion of public transit networks could also have negative consequences in areas directly adjacent to transit infrastructure. Diesel buses create air pollution (Lovasi et al., 2022), and public transit networks of all types can create noise pollution (Hemmat et al., 2023).

left_text_column_width
Population (millions)
1
10
30
Active Mobility
Public Transport
Private Cars

Primary mode of transport

Mapping the primary mode of transportation reveals mobility patterns and opportunities to shift travel toward lower-emitting modes.

Prieto-Curiel, R. and Ospina, Juan P. (2024). The ABC of mobility [Data set]. Environmental International, https://doi.org/10.1016/j.envint.2024.108541. Retrieved May 9, 2025 from https://github.com/rafaelprietocuriel/ModalShare/tree/main

Geographic Guidance Introduction

Public transit is most effective in urban areas with high population density, where buses, subways, trams, and commuter rail can efficiently carry large numbers of passengers. Electrified or low-emission transit modes achieve the greatest climate impact, especially in regions with clean electricity grids (Bloomberg New Energy Finance, 2018). However, even diesel-based public transit systems can outperform fossil fuel-powered cars on a per-pkm basis if they have high ridership and operate efficiently.

Socioeconomic and political factors, including investment capacity, institutional coordination, and public perceptions of reliability, safety, and comfort, highly influence the adoption and effectiveness of public transit. Regions with well-funded public infrastructure, integrated fare systems, and strong governance tend to have the highest adoption and climate benefits. Conversely, underinvestment, informal transit dominance, or poorly maintained systems can undermine public transit’s potential (Börjesson et al., 2020; Mees, 2010).

High public transit adoption is seen in Western and Northern Europe, Post-Soviet countries, East Asia (including Japan, South Korea, and China), and some Latin American cities, like Bogotá and Santiago. In contrast, many developing regions face barriers to public transit expansion, such as inadequate funding, urban sprawl, or a reliance on informal minibus systems. However, these same areas offer some of the highest potential for impact. Rapid urbanization, growing demand for mobility, and severe air quality challenges create strong incentives to expand and modernize transit networks.

Action Word
Enhance
Solution Title
Public Transit
Classification
Highly Recommended
Lawmakers and Policymakers
  • Use public transit and create incentive programs for government employees to use public transit.
  • Improve and invest in local public transit infrastructure, increasing routes and frequency while improving onboard safety, especially for women.
  • Electrify public buses, vans, and other vehicles used in the public transit system.
  • Implement the recommendations of transit-oriented development, such as increasing residential and commercial density, placing development near stations, and ensuring stations are easily accessible.
  • Provide online information, ticketing, and payment services.
  • Implement regional or nationwide public transit ticketing systems.
  • Consider a wide range of policy options that include demand-side options, such as free fare or fare reductions, and that are informed by citizen-centered approaches.
  • Create dedicated coordinating bodies across government agencies, businesses, and the public to develop public transit.
  • Disincentivize car trips in areas serviced by public transit through reduced access, increases in parking fares, congestion charges, taxes, or other means.
  • Incorporate social signaling in public transit information and signage, such as smiley faces and “sustainable transport” labels.
  • Develop public transit awareness campaigns – starting from early childhood – focusing on internally motivating factors such as money saved, health benefits, reduced pollution, free time while traveling, and lifestyle sustainability.

Further information:

Practitioners
  • Use public transit and create incentive programs for government employees to utilize public transit.
  • Increase routes and frequency while also improving onboard safety, especially for women.
  • Electrify public buses, vans, and other vehicles used in the public transit system.
  • Incorporate social signaling in public transit information and signage, such as smiley faces and “sustainable transport” labels.
  • Provide online information, ticketing, and payment services
  • Implement regional or nationwide public transit ticketing systems.
  • Consider a wide range of policy options that include demand-side options, such as free fare or fare reductions, and that are informed through citizen-centered approaches.
  • Create dedicated coordinating bodies across government agencies, businesses, and the public to develop public transit.
  • Develop public transit awareness campaigns – starting from early childhood – focusing on internally motivating factors such as money saved, health benefits, reduced pollution, free time while traveling, and a sustainable lifestyle.

Further information:

Business Leaders
  • Use public transit and encourage employees to do so when feasible.
  • Encourage public transit use for company purposes.
  • Offer employees who agree to forego a free parking space the annualized cash value or cost of that parking space as a salary increase.
  • Incorporate company policies on public transit use into company sustainability and emission reduction initiatives and communicate how they support broader company goals.
  • Ensure your business is accessible via public transit and offer information on nearest access points both online and in person.
  • Offer employees pre-tax commuter benefits to include reimbursement for public transit expenses.
  • Create and distribute educational materials for employees on commuting best practices.
  • Partner with, support, and/or donate to infrastructure investments and public transit awareness campaigns.
  • Advocate for better public transit systems with city officials.

Further information:

Nonprofit Leaders
  • Use public transit and encourage staff to do so when feasible.
  • Offer staff pre-tax commuter benefits to include reimbursement for public transit expenses.
  • Offer employees who agree to forego a free parking space the annualized cash value or cost of that parking space as a salary increase.
  • Expand access to underserved communities by providing fare assistance through microgrants and/or public-private partnerships.
  • Create, support, or partner with existing public transit awareness campaigns that – starting from early childhood – focus on internally motivating factors such as money saved, health benefits, reduced pollution, free time while traveling, and a sustainable lifestyle.
  • Ensure your office is accessible via public transit and offer information – online and in person – on the nearest access points.
  • Advocate to policymakers for improved infrastructure and incentives for riders.
  • Advocate for infrastructure improvements and note specific locations where improvements can be made.
  • Encourage local businesses to create employee incentives.
  • Host or support community participation in local public transit infrastructure design.
  • Join public-private partnerships to encourage, improve, or operate public transit.

Further information:

Investors
  • Use public transit and encourage staff to do so when feasible.
  • Encourage public transit use for company purposes.
  • Invest in electric battery and component suppliers for public buses and vehicle fleets.
  • Deploy capital to efforts that improve public transit comfort, convenience, access, and safety.
  • Seek investment opportunities that reduce material and maintenance costs for public transit.

Further information:

Philanthropists and International Aid Agencies
  • Use public transit and encourage staff to do so when feasible.
  • Award grants to local organizations advocating for improved public transit and services.
  • Expand access to underserved communities by providing fare assistance through microgrants and/or public-private partnerships.
  • Improve and finance local infrastructure and public transit capacity.
  • Build local capacity for infrastructure design, maintenance, and construction.
  • Assist with local policy design or provide means for assessments, data collection, citizen participation, and other steps in the policymaking process.
  • Create, support, or partner with existing public transit awareness campaigns that – starting from early childhood – focus on internally motivating factors such as money saved, health benefits, reduced pollution, free time while traveling, and a sustainable lifestyle.

Further information:

Thought Leaders
  • Lead by example and use public transit regularly.
  • Create, support, or partner with existing public transit awareness campaigns that – starting from early childhood – focus on internally motivating factors such as money saved, health benefits, reduced pollution, free time while traveling, and a sustainable lifestyle.
  • Share detailed information on local public transit routes.
  • Assist with local policy design or provide means for assessments, data collection, citizen participation, and other steps in the policymaking process.
  • Advocate to policymakers for improved infrastructure, noting specific locations that need improvements and incentives for riders.

Further information:

Technologists and Researchers
  • Use public transit and encourage your colleagues to use public transit when feasible.
  • Improve electric batteries and electrification infrastructure for public buses and vehicles.
  • Develop models for policymakers to demonstrate the impact of public transit policies on pollutant emissions, health, and other socioeconomic variables.
  • Conduct randomized control trials and collect longitudinal data on the impacts of interventions to increase public transit usage.
  • Innovate better, faster, and cheaper public transit networks – focusing on infrastructure, operations, and public transit vehicles.

Further information:

Communities, Households, and Individuals
  • Use public transit and encourage your household and neighbors to use public transit when feasible.
  • Share your experiences with public transit, as well as tips and reasons for choosing this mode of transportation.
  • Advocate to local officials for infrastructure improvements and note specific locations where improvements can be made.
  • Advocate to employers and local businesses to provide incentives and start local initiatives.

Further information:

Evidence Base

Consensus of effectiveness in reducing transportation emissions: High

Experts agree that public transit usually produces fewer GHG/pkm than fossil fuel–powered cars (Bloomberg New Energy Finance, 2018; Brunner et al., 2018; Ilie et al., 2014; International Transport Forum, 2020; Kennedy, 2002; Kuminek, 2013; Lim et al., 2021; Mahmoud et al., 2016; Rodrigues & Seixas, 2022; Sertsoz et al., 2013). There is also consensus on two points: First, shifting people from cars to public transit even under status-quo emissions levels will reduce transport emissions overall; second, opportunities exist to decarbonize the highest-emitting parts of public transit systems through electrification, especially buses (Bloomberg New Energy Finance, 2018).

According to the Intergovernmental Panel on Climate Change (IPCC, 2023), public transit can help decrease vehicle travel and lower GHG emissions by reducing both the number and length of trips made in fossil fuel–powered cars (medium confidence). Adjustments to public transportation operations – such as increasing bus stop density, reducing the distance between stops and households, improving trip duration and frequency, and lowering fares – can encourage a shift from fossil fuel–powered car use to public transit.

Bloomberg New Energy Finance (2018) provides a good overview of the state of electric buses – a technology crucial to reduce the public transit fleet’s fossil fuel consumption, and help transition these fleets entirely to electric power. It determined that electric buses have significantly lower operating costs and can be more cost-effective than conventional buses when considering total ownership costs.

Litman (2024) found that “High quality (relatively fast, convenient, comfortable, and integrated) transit can attract discretionary passengers who would otherwise drive, which reduces traffic problems including congestion, parking costs, accidents, and pollution emissions. This provides direct user benefits, since they would not change mode if they did not consider themselves better off overall.”

The results presented in this document summarize findings from 28 reviews and meta-analyses and 23 original studies reflecting current evidence from 32 countries, primarily the American Public Transit Association (APTA, 2020), Bloomberg New Energy Finance (2018), International Transport Forum (2020), and UITP (2024). We recognize this limited geographic scope creates bias, and hope this work inspires research and data sharing on this topic in underrepresented regions.

left_text_column_width
Updated Date

Improve Nonmotorized Transportation

Image
Image
Many people in a crosswalk viewed from above
Coming Soon
Off
Summary

We define Improve Nonmotorized Transportation as increasing any form of travel that does not use a motor or engine. In theory, this includes a huge range of transportation modes, including horses, cross-country skis, sailboats, hand-operated rickshaws, and animal-drawn carriages. In practice, pedestrian travel and cycling account for most nonmotorized utilitarian passenger travel.

Overview

Travel shifted from motorized to nonmotorized transportation saves GHG emissions – mostly CO₂, but also small amounts of nitrous oxide and methane (Center for Sustainable Systems, 2023) – that a fossil fuel-powered car would otherwise emit. Nonmotorized transportation uses human muscle power to move people from place to place. 

We divided nonmotorized transportation into three subcategories: 1) pedestrian travel, including walking and the use of mobility aids such as wheelchairs; 2) private bicycles owned by the user, meaning that they are typically used for both the outgoing and return legs of a trip; and 3) shared bicycles, which are sometimes used for only one leg of a trip and so have to be repositioned by other means.

Pedestrian travel

Pedestrian travel (including both walking and travel using mobility aids such as wheelchairs) has the advantage of being something that most people can do and often does not require special equipment or dedicated infrastructure (although some infrastructure, such as sidewalks, can be helpful). Pedestrian travel is 81.7% of global urban nonmotorized pkm

Private bicycles

Private bicycles cost money and require maintenance but enable travel at much faster speeds and therefore longer distances. Private bicycles are 13% of global urban nonmotorized pkm.

Shared bicycles 

Shared bicycles eliminate the financial overhead of bicycle ownership, but usually only permit travel within specific urban areas and sometimes between established docking stations. Shared bicycles are 5.1% of global urban nonmotorized pkm. 

Note that we did not include electric bicycles in this analysis. Electric bicycles are analyzed as a separate solution.

While improving nonmotorized transportation can be a valuable climate solution virtually anywhere, we limit our analysis to cities due to the high number of relatively short-distance trips and the abundance of available data compared with rural locations.

The fuel for cycling and pedestrian travel is the food the traveler eats. When the traveler metabolizes the food, they produce CO₂. Some studies factor the GHG emissions produced by the additional metabolism required by nonmotorized transportation into its climate impact because of the emissions that come from the food system (Mizdrak et al., 2020). This is controversial, however, because it is unclear whether pedestrians and cyclists have a higher calorie intake than people who travel in other ways (Noussan et al., 2022). Furthermore, additional food eaten to fuel physical labor is not typically counted in life-cycle analyses. This analysis, therefore, does not consider the upstream climate impacts of food calories that fuel cycling, pedestrian travel, driving, or any other activity.

References

AAA. (2024). AAA’s Your driving costs – AAA Exchange. https://exchange.aaa.com/automotive/aaas-your-driving-costs/

Adamos, G., Nathanail, E., Theodoridou, P., & Tsolaki, T. (2020). Investigating the effects of active travel in health and quality of life. Transport and Telecommunication Journal21(3), 221–230. https://doi.org/10.2478/ttj-2020-0018

Autocosts.org. (2024). World statistics of car costs. Autocosts.Info. https://autocosts.info/worldstats

Blondiau, T., van Zeebroeck, B., & Haubold, H. (2016). Economic benefits of increased cycling. Transportation Research Procedia14, 2306–2313. https://doi.org/10.1016/j.trpro.2016.05.247

Bonilla-Alicea, R. J., Watson, B. C., Shen, Z., Tamayo, L., & Telenko, C. (2020). Life cycle assessment to quantify the impact of technology improvements in bike-sharing systems. Journal of Industrial Ecology24(1), 138–148. https://doi.org/10.1111/jiec.12860

Bopp, M., Sims, D., & Piatkowski, D. (2018). Benefits and risks of bicycling. 21–44. https://doi.org/10.1016/B978-0-12-812642-4.00002-7

Brand, C., Dons, E., Anaya-Boig, E., Avila-Palencia, I., Clark, A., de Nazelle, A., Gascon, M., Gaupp-Berghausen, M., Gerike, R., Götschi, T., Iacorossi, F., Kahlmeier, S., Laeremans, M., Nieuwenhuijsen, M. J., Pablo Orjuela, J., Racioppi, F., Raser, E., Rojas-Rueda, D., Standaert, A., … Int Panis, L. (2021). The climate change mitigation effects of daily active travel in cities. Transportation Research Part D: Transport and Environment93, 102764. https://doi.org/10.1016/j.trd.2021.102764

Burnham, A., Gohlke, D., Rush, L., Stephens, T., Zhou, Y., Delucci, M. A., Birky, A., Hunter, C., Lin, Z., Ou, S., Xie, F., Proctor, C., Wiryadinata, S., Liu, N., & Boloor, M. (2021). Comprehensive total cost of ownership quantifications for vehicles with different size classes and powertrains (ANL/ESD-21/4). Argonne National Laoratory. https://publications.anl.gov/anlpubs/2021/05/167399.pdf

Center for Sustainable Systems. (2023). Personal transportation factsheet (CSS01-07). University of Michigan. https://css.umich.edu/publications/factsheets/mobility/personal-transportation-factsheet

Christensen, L., & Vázquez, N. S. (2013). Post-harmonised european national travel surveys. Proceedings from the Annual Transport Conference at Aalborg University20(1), Article 1. https://doi.org/10.5278/ojs.td.v1i1.5701

CityTransit Data. (2025). A global analysis of transit data. CityTransit Data. https://citytransit.uitp.org/ 

DeMaio, P. (2009). Bike-sharing: History, impacts, models of provision, and future. Journal of Public Transportation, 12(4), 41–56. https://doi.org/10.5038/2375-0901.12.4.3

Department for Transport. (2024). Department for transport statistics NTS 0101: Trips, distance travelled, and time taken: England, 1972 onwards [Dataset]. https://app.powerbi.com/view?r=eyJrIjoiMGE2YTQ5YTMtMDkwNC00MjBmLWFkNjUtMjBjZjUzZWU0ZjNmIiwidCI6IjI4Yjc4MmZiLTQxZTEtNDhlYS1iZmMzLWFkNzU1OGNlNzEzNiIsImMiOjh9

European Commission. (2019). Handbook on the external costs of transport. European Commission. https://cedelft.eu/wp-content/uploads/sites/2/2021/03/CE_Delft_4K83_Handbook_on_the_external_costs_of_transport_Final.pdf

Federal Highway Administration. (2022). Summary of travel trends: 2022 National Household Travel Survey. US Department of Transportation. https://nhts.ornl.gov/assets/2022/pub/2022_NHTS_Summary_Travel_Trends.pdf

Fishman, E., & Schepers, P. (2016). Global bike share: What the data tells us about road safety. Journal of Safety Research, 56, 41–45. https://doi.org/10.1016/j.jsr.2015.11.007 

Flanagan, E., Lachapelle, U., & El-Geneidy, A. (2016). Riding tandem: Does cycling infrastructure investment mirror gentrification and privilege in Portland, OR and Chicago, IL? Research in Transportation Economics60, 14–24. https://doi.org/10.1016/j.retrec.2016.07.027

Glazener, A., & Khreis, H. (2019). Transforming our cities: Best practices towards clean air and active transportation. Current Environmental Health Reports6(1), 22–37. https://doi.org/10.1007/s40572-019-0228-1

Gössling, S., Neger, C., Steiger, R., & Bell, R. (2023). Weather, climate change, and transport: A review. Natural Hazards, 118(2), 1341–1360. https://doi.org/10.1007/s11069-023-06054-2

Gössling, S., Choi, A., Dekker, K., & Metzler, D. (2019). The social cost of automobility, cycling and walking in the European Union. Ecological Economics158, 65–74. https://doi.org/10.1016/j.ecolecon.2018.12.016

Günther, M., & Krems, J. (2022). The liveable city—How effective planning for infrastructure and personal mobility can improve people’s experiences of urban life. 13th International Conference on Applied Human Factors and Ergonomics (AHFE 2022). https://doi.org/10.54941/ahfe1002372

International Transport Forum. (2020). Good to go? Assessing the environmental performance of new mobility (Corporate Partnership Board). OECD. https://www.itf-oecd.org/sites/default/files/docs/environmental-performance-new-mobility.pdf

International Transport Forum. (2021). ITF Transport Outlook 2021. OECD. https://www.itf-oecd.org/itf-transport-outlook-2021 

Hymel, K. M., Small, K. A., & Dender, K. V. (2010). Induced demand and rebound effects in road transport. Transportation Research Part B: Methodological, 44(10), 1220–1241. https://doi.org/10.1016/j.trb.2010.02.007

IPCC. (2023). Renewable energy sources and climate change mitigation—IPCChttps://www.ipcc.ch/report/renewable-energy-sources-and-climate-change-mitigation/

Litman, T. (2011). Environmental reviews & case studies: Why and how to reduce the amount of land paved for roads and parking facilities. Environmental Practice, 13(1), 38–46. https://doi.org/10.1017/S1466046610000530

Litman, T. (2024). Evaluating active transport benefits and costs: Guide to valuing walking and cycling improvements and encouragement programs. Victoria Transport Policy Institute. https://www.vtpi.org/nmt-tdm.pdf

Mailloux, N. A., Henegan, C. P., Lsoto, D., Patterson, K. P., West, P. C., Foley, J. A., & Patz, J. A. (2021). Climate solutions double as health interventions. International Journal of Environmental Research and Public Health18(24), Article 24. https://doi.org/10.3390/ijerph182413339

Mizdrak, A., Cobiac, L. J., Cleghorn, C. L., Woodward, A., & Blakely, T. (2020). Fuelling walking and cycling: Human powered locomotion is associated with non-negligible greenhouse gas emissions. Scientific Reports10(1), Article 1. https://doi.org/10.1038/s41598-020-66170-y

Montoya-Torres, J., Akizu-Gardoki, O., & Iturrondobeitia, M. (2023). Measuring life-cycle carbon emissions of private transportation in urban and rural settings. Sustainable Cities and Society96, 104658. https://doi.org/10.1016/j.scs.2023.104658

Mueller, N., Rojas-Rueda, D., Cole-Hunter, T., de Nazelle, A., Dons, E., Gerike, R., Götschi, T., Int Panis, L., Kahlmeier, S., & Nieuwenhuijsen, M. (2015). Health impact assessment of active transportation: A systematic review. Preventive Medicine76, 103–114. https://doi.org/10.1016/j.ypmed.2015.04.010

Münzel, T., Molitor, M., Kuntic, M., Hahad, O., Röösli, M., Engelmann, N., Basner, M., Daiber, A., & Sørensen, M. (2024). Transportation noise pollution and cardiovascular health. Circulation Research, 134(9), 1113–1135. https://doi.org/10.1161/CIRCRESAHA.123.323584

de Nazelle, A., Nieuwenhuijsen, M., Antó, J., Brauer, M., Briggs, D., Charlotte Braun-Fahrlander, C., Cavill, N., Cooper, A., Desqueyroux, H., Fruin, S., Hoek, G., Panis, L., Janssen, N., Jerrett, M., Joffe, M., Andersen, Z., van Kempen, E., Kingham, S., Kubesch, N., Leyden, K., Marshall, J., Matamala, J., Mellios, G., Mendez, M., Nassif, H., Ogilvie, D., Peiró, R., Pérez, K., Rabl, A., Ragettli, M., Rodríguez, D., Rojas, D., Ruiz, P., Sallis, J., Terwoert, J., Toussaint, J., Tuomisto, J., Zuurbier, M., & Lebret, E. (2011). Improving health through policies that promote active travel: A review of evidence to support integrated health impact assessment. Environment International, 37(4), 767-777.

https://doi.org/10.1016/j.envint.2011.02.003 

Noussan, M., Campisi, E., & Jarre, M. (2022). Carbon intensity of passenger transport modes: A review of emission factors, their variability and the main drivers. Sustainability14(17), Article 17. https://doi.org/10.3390/su141710652

Prieto-Curiel, R., & Ospina, J. P. (2024). The ABC of mobility. Environment International185, 108541. https://doi.org/10.1016/j.envint.2024.108541

Pro Cycling Coaching. (2025). Bike Time Calculator: How Long Does It Take to Bike Any Distance. https://www.procyclingcoaching.com/resources/bike-time-calculator 

Rodriguez Mendez, Q., Fuss, S., Lück, S., & Creutzig, F. (2024). Assessing global urban CO₂ removal. Nature Cities, 1(6), 413–423. https://doi.org/10.1038/s44284-024-00069-x

Roser, M. (2024). Data review: How many people die from air pollution? Our World in Datahttps://ourworldindata.org/data-review-air-pollution-deaths

Seum, S., Schulz, A., & Phleps, P. (2020). The future of driving in the BRICS countries (study update 2019). Institute for Mobility Research. https://www.semanticscholar.org/paper/The-Future-of-Driving-in-the-BRICS-Countries-(Study-Seum-Schulz/707da41b03f064dea00e7d35124b1c51bfd78053

Shindell, D. T., Lee, Y., & Faluvegi, G. (2016). Climate and health impacts of US emissions reductions consistent with 2 °C. Nature Climate Change6(5), 503–507. https://doi.org/10.1038/nclimate2935

Staatsen, B., Nijland, H., Kempen, E., van Hollander, A., de Franssen, A., & Kamp, I. (n.d.). Assessment of health impacts and policy options in relation to transport-related noise exposures (815120002).

State of Colorado. (2016). Economic and health benefits of cycling and walking. Colorado Office of Economic Development and International Trade. https://choosecolorado.com/wp-content/uploads/2016/06/Economic-and-Health-Benefits-of-Bicycling-and-Walking-in-Colorado-4.pdf

Statistics Netherlands. (2024, July 4). Mobility; per person, personal characteristics, modes of travel and regions [Webpagina]. Statistics Netherlands. https://www.cbs.nl/en-gb/figures/detail/84709ENG

TNMT. (2021). The environmental impact of today’s transport types. TNMThttps://tnmt.com/infographics/carbon-emissions-by-transport-type/

Van Acker, V., & Witlox, F. (2010). Car ownership as a mediating variable in car travel behaviour research using a structural equation modelling approach to identify its dual relationship. Journal of Transport Geography, 18(1), 65–74. https://doi.org/10.1016/j.jtrangeo.2009.05.006

Verma, S., Dwivedi, G., & Verma, P. (2022). Life cycle assessment of electric vehicles in comparison to combustion engine vehicles: A review. Materials Today: Proceedings49, 217–222. https://doi.org/10.1016/j.matpr.2021.01.666

Volker, J. M. B., & Handy, S. (2021). Economic impacts on local businesses of investments in bicycle and pedestrian infrastructure: A review of the evidence. Transport Reviews41(4), 401–431. https://doi.org/10.1080/01441647.2021.1912849

WHO. (2023). Despite notable progress, road safety remains urgent global issuehttps://www.who.int/news/item/13-12-2023-despite-notable-progress-road-safety-remains-urgent-global-issue

Xia, T., Zhang, Y., Crabb, S., & Shah, P. (2013). Cobenefits of replacing car trips with alternative transportation: A review of evidence and methodological issues. Journal of Environmental and Public Health2013(1), 797312. https://doi.org/10.1155/2013/797312

Credits

Lead Fellows

  • Heather Jones, Ph.D.

  • Cameron Roberts, Ph.D.

Contributors

  • James Gerber, Ph.D.

  • Yusuf Jameel , Ph.D.

  • Daniel Jasper

  • Heather McDiarmid, Ph.D.

  • Alex Sweeney

Internal Reviewers

  • Aiyana Bodi

  • Hannah Henkin

  • Yusuf Jameel, Ph.D. 

  • Heather McDiarmid, Ph.D.

  • Ted Otte

  • Amanda Smith, Ph.D.
Effectiveness

Nonmotorized transportation can save 115.6 t CO₂‑eq /million pkm, compared with fossil fuel–powered cars (Table 1). This makes it a highly effective climate solution. Every trip shifted from a fossil fuel–powered car to cycling or pedestrian travel avoids most, if not all, of the GHG emissions associated with car travel. Nonmotorized transportation effectiveness is calculated by taking the share of each mode and multiplying it by its effectiveness, and adding this value from all three modes. 

Cars produce 116 t CO₂‑eq /million pkm (International Transport Forum, 2020; IPCC, 2023; Montoya-Torres et al., 2023; TNMT, 2021; Verma et al., 2022). Note that this value does not correspond directly to the estimates arrived at in most of these references because it is common practice to include embodied and upstream emissions in life-cycle calculations. Because we do not include embodied and upstream emissions (which are accounted for in other solutions), our estimate for the current emissions from the global vehicle fleet comes from an original calculation using values from these sources and arrives at a lower figure than they do.

Pedestrian travel and private bicycles have negligible direct emissions (Bonilla-Alicea et al., 2020; Brand et al., 2021; International Transport Forum, 2020; Noussan et al., 2022; TNMT, 2021). This means people avoid all direct GHG emissions from driving fossil fuel–powered cars when they use nonmotorized transportation instead. Thus, shifting from cars to nonmotorized transportation saves 116 t CO₂‑eq /million pkm, not including indirect emissions, such as those from manufacturing the equipment and infrastructure necessary for those forms of mobility. Life-cycle emissions from cycling are approximately 12 t CO₂‑eq /million pkm, most of which come from manufacturing bicycles (Bonilla-Alicea et al., 2019; Brand et al., 2021; ITF, 2020; Montoya-Torres et al., 2023; Noussan et al., 2020; TNMT, 2021), while emissions from pedestrian travel are negligible (TNMT, 2021). These life-cycle emissions are not quantified for this analysis, but may be addressed by other solutions in the industrial sector.

Shared bicycles provide fewer emissions savings than privately owned bicycles do. Shared bicycle schemes have direct GHG emissions of 7.49 t CO₂‑eq /million pkm, about 109 fewer than the average fossil fuel-powered car. Because people sometimes use shared bicycles for one-way trips, the bike-sharing system can become unbalanced, with fewer bicycles in places where people start their journeys and more bicycles in places where people end them. This is fixed by driving the shared bicycles from places with surplus to places with shortage, which increases emissions. The total increase in emissions caused by this can be mitigated through measures such as using electric vehicles to reposition the bikes or incentivizing riders to reposition the bicycles themselves without the use of a vehicle. 

left_text_column_width

Table 1. Effectiveness at reducing emissions.

Unit: t CO₂‑eq /million pkm, 100-yr basis

Nonmotorized Transportation
25th percentile 99.33
mean 118.8
median (50th percentile) 115.6
75th percentile 136.9
Left Text Column Width
Cost

Driving a fossil fuel–powered car has private costs (i.e., those that accrue to the motorist themselves) of US$0.25/pkm and public costs (for roads, lights, traffic enforcement, etc.) of US$0.11/pkm. It generates public revenues of US$0.03/pkm from taxes, fees, fines, etc. (AAA, 2024; Autocosts.org, 2024; Burnham et al., 2021; Gössling et al., 2019). This means that its net cost to the passenger is US$0.32/pkm. Cars also have externality costs, such as the cost of health care due to road injuries or air pollution (Litman, 2024). We do not factor these externalities into our cost analysis.

Nonmotorized transportation (costs weighted by mode share) has private costs of US$0.08/pkm and public costs US$0.04/pkm. It produces no revenues to the user. It has a net cost of US$0.12/pkm and saves US$0.21/pkm compared with car travel. This equals a savings of US$1,771/t CO₂‑eq (Table 2).

Pedestrian travel has private costs of US$0.09/pkm (mostly for shoes) and public costs of US$0.1/pkm (for sidewalks, staircases, bridges, etc.). It produces no new revenues. It has a net cost of US$0.10/pkm and saves US$0.23/pkm compared to car travel (Gössling et al., 2019; Litman, 2024). 

Private bicycles have private costs of US$0.06/pkm (for the cost of the bicycle itself, as well as repairs, clothing, etc.) and public costs of US$0.002/pkm (for bike lanes and other infrastructure). They produce no new revenues. They have net costs of US$0.07/pkm and save US$0.26/pkm compared to car travel (Gössling et al., 2019; Litman, 2024). These costs are cheaper than those of pedestrian travel on a per-pkm basis because, while a bicycle costs more than a pair of shoes, it can also travel much farther.

Shared bicycle systems have different cost structures. They can be very expensive (US$9.00/km in London), free (Buenos Aires) and very inexpensive (less than US$0.00 in Tehran) based on what operators charge users. Rides are usually priced by time rather than distance (DeMaio, 2009). Calculations were made as to distance covered by time to arrive at a price per km (CityTransit Data, 2025; Fishman & Schepers, 2016; Pro Cycling Coaching, 2025). Assuming that this roughly covered operating costs, it means that these systems cost US$0.22/pkm more than car travel.

An important consideration for each of these is that we must divide the cost of a bicycle, car, pair of shoes, or piece of infrastructure (road, bike lane, sidewalk) by the pkm of travel it supports over its lifespan. This means that nonmotorized transportation, which is cheaper but slower than cars, can have less of a cost advantage per pkm than might seem intuitive, and is part of the reason why cycling is cheaper per pkm than pedestrian travel. In addition, all of these estimates are based on very limited data and research and should be treated as approximate. Lastly, per-pkm infrastructural costs of cycling and pedestrian travel will decrease as cyclists and pedestrians use the infrastructure more intensively.

left_text_column_width

Table 2. Cost per unit of climate impact.

Unit: 2023 US$/t CO₂‑eq , 100-yr basis

Nonmotorized Transportation
median -1,771
Left Text Column Width
Learning Curve

Walking and cycling are mature technologies, so the concept of a learning rate is not applicable.

There is also limited opportunity for cost reductions in cycling or pedestrian infrastructure built using construction techniques very similar to those used in the road industry. However, while learning effects might not do much to reduce the costs of nonmotorized transportation infrastructure, they could do a great deal to improve its effectiveness. Safe cycling infrastructure, in particular, has improved considerably over the past few decades. This could continue into the future as best practices are further improved.

left_text_column_width
Speed of Action

Speed of action refers to how quickly a climate solution physically affects the atmosphere after it is deployed. This is different from speed of deployment, which is the pace at which solutions are adopted.

At Project Drawdown, we define the speed of action for each climate solution as gradualemergency brake, or delayed.

Improve Nonmotorized Transportation is a GRADUAL climate solution. It has a steady, linear impact on the atmosphere. The cumulative effect over time builds as a straight line.

left_text_column_width
Caveats

Increases to the modal share of nonmotorized transportation only have the benefits discussed here if they replace travel by car. Replacing public transit travel with travel using nonmotorized transportation will have a much smaller climate benefit. The climate benefit of nonmotorized mobility will also diminish if the average emissions of the global car fleet shrink, for example, due to the wider adoption of electric vehicles. 

There are also uncertainties around trip length. A small number of long trips taken by car will not be replaceable by nonmotorized transportation. Replacing the average trip by car with cycling or pedestrian travel will, in many cases, require that trip to be shortened (for example, by placing businesses closer to people’s homes). If this is not possible, increased adoption of nonmotorized transportation will apply to only some trips, reducing the impact on both emissions and costs.

Weather and climate pose significant challenges and risks for nonmotorized transportation. Extreme heat or cold, wind, rain, or storms can make people reluctant to travel without the protection of a vehicle and, in some cases, can make doing so unsafe (Gössling et al., 2023). This will reduce the adoption of nonmotorized transportation in some places, although it can be mitigated through measures such as providing information and subsidies for proper clothing, removing or grooming snow on bicycle paths, and providing indoor/covered paths that allow pedestrians to travel through a city without exposure to the elements.

left_text_column_width
Current Adoption

Analysts most frequently report adoption of nonmotorized transportation as a percentage modal share of all trips taken in a city. Cities around the world have radically different modal shares of bicycle and pedestrian trips. Cities in LMICs often have a high nonmotorized modal share because many people cannot afford cars. Cities in high-income countries are often difficult to navigate without a car, resulting in low modal shares for nonmotorized transportation (Prieto-Curiel & Ospina, 2024). 

Prieto-Curiel and Ospina (2024) estimated that northern North America (the United States and Canada) had the lowest modal share of nonmotorized transportation, at 3.5%. Western Europe reached 29% modal share, while Western and Eastern Africa reached 42.9% and 46%, respectively.

Converting these numbers into vehicle-kilometers traveled on a national level for various countries requires assumptions. A population-weighted average of data available from the United States and several Western European countries finds that people take approximately three 13.2 km trips per day, totaling 39.7 km of daily travel with considerable variation between countries (Christensen & Vázquez, 2013; Department for Transport, 2024; Federal Highway Administration, 2022; Statistics Netherlands, 2024). For example, English people in 2022 traveled an average of 25.5 km/day, while Americans in 2020 traveled 53.5 km/day. The value we use in our analysis comes from a population-weighted average that excludes data from 2020 and 2021 to exclude data skewed by the COVID-19 pandemic. Because the United States has by far the highest population of the countries for which we found data, it skews the average much higher than many of the European countries. World data (ITF, 2021) reports that nonmotorized transportation is 14.4% of all urban pkm.

We assumed that in urban environments, each trip taken by nonmotorized transportation corresponds to one fewer car trip of this average length. This implies that nonmotorized transportation currently shifts approximately 12.9 trillion pkm from cars (Table 3). However, it should be noted that this figure includes low-income countries, where some residents have less access to private vehicles.

left_text_column_width

Table 3. Current (2024) adoption level.

Unit: million pkm/yr*

25th percentile 1,913,000
mean 12,860,000
median (50th percentile) 8,617,000
75th percentile 22,340,000

*These data are extrapolated from a range of individual city estimates from 2010 to 2020 and are limited by the fact that not all cities have accurate data on passenger travel modal share. We used the mean value from Prieto-Curiel and Ospina (2024) as the authoritative estimate of current adoption here and for calculations in future sections.

Left Text Column Width
Adoption Trend

In all cities for which appropriate data exist, nonmotorized transportation showed a growth rate of 0.45% of all passenger trips per year (Prieto-Curiel & Ospina, 2024). This amounts to 114 billion pkm (Table 4) according to our estimation procedure outlined above. In some cities, adoption has grown much more quickly. For example, Hanover, Germany, achieved an average growth of 7.8%/yr in 2011–2017, which amounts to approximately 593 million additional pkm traveled by bicycle every year during that time. However, the rate of adoption is extremely variable. The 25th percentile of estimates shows a global decline in nonmotorized transportation to the tune of 312 billion fewer pkm shifted to nonmotorized modes every year.

Adoption rates of nonmotorized transportation vary widely within a country and between different years within the same city (Prieto-Curiel & Ospina, 2024).

Many people, particularly in LMICs, walk or cycle because they have limited access to a vehicle. When countries become wealthier, travel often shifts from nonmotorized transportation to cars (Seum et al., 2020). If transportation policy in these countries prioritizes car-free mobility, high levels of nonmotorized transportation adoption could potentially be preserved even as living standards increase.

left_text_column_width

Table 4. 2023–2024 adoption trend.

Unit: million pkm/yr

25th percentile -311,800
mean 68,450
median (50th percentile) 114,400
75th percentile 687,200
Left Text Column Width
Adoption Ceiling

We estimated that 20.2% of all trips in cities worldwide, or approximately 12.9 trillion pkm/yr, are traveled by nonmotorized transportation, while 66.2%, or approximately 42.2 trillion pkm/yr, are traveled by fossil fuel–powered car. This suggests that switching all urban trips currently taken by car to nonmotorized transportation would lead to a nonmotorized modal share of 86.4% in cities globally, or 55 trillion pkm/yr (Table 5).

This calculation uses the same assumptions discussed under Current Adoption above. In this case, however, our assumption that every nonmotorized trip is shifted from a car trip of the same length requires further justification. We are not assuming that very long car trips, trips on highways, etc., are replaced directly by bicycle or pedestrian trips. Instead, we assume that shorter nonmotorized trips can substitute for longer car trips with appropriate investment in better urban planning and infrastructure. So, for example, a 10 km drive to a large grocery store could be replaced by a 1 km walk to a neighborhood grocery store. 

This would require replanning many cities so they better accommodate shorter trips. It would also require improving options for people with disabilities or those carrying heavy loads. And it would face climatic and topographic constraints. Furthermore, it is unlikely that all car traffic would ever be substituted by any single alternative mode. Other sustainable modes, particularly public transit, are likely to play a role.

It is also possible for rural trips to be undertaken by nonmotorized transportation. Indeed, this is already very common in low-and middle-income countries. However, rural data are sparse, and discerning how many trips could be shifted to nonmotorized travel in these areas is highly speculative. Therefore, we omit rural areas from our analysis.

left_text_column_width

Table 5. Adoption ceiling.

Unit: million pkm/yr

median (50th percentile) 55,090,000
Left Text Column Width
Achievable Adoption

To estimate the upper bound of feasible adoption, we assumed that urban trips taken by fossil fuel–powered cars can be shifted to nonmotorized transportation until the latter accounts for 65% of trips (the current highest modal share of nonmotorized transportation in any city with a population of more than one million) or until car travel decreases to 7% of trips (the current lowest modal share of fossil fuel–powered cars in any city with a population of more than one million). 

The global modal share of car travel is 51.4% of trips, or 37.6 trillion pkm/yr, and the global modal share of nonmotorized transportation in cities is 22.4% of trips, or 12.9 trillion pkm/yr. If we shift modal share from cars to nonmotorized transportation until it reaches 65% of travel in cities, that leaves the modal share of cars in cities at 8.8%, still higher than the 7% modal share mentioned above. This amounts to a total modal share shift of 42.6% in all global cities. Multiplying this by the global urban population of 4.4 billion and factoring in the average annual travel distance per capita of 16,590 pkm/yr results in a total of 31.2 million pkm/yr shifted from car travel to nonmotorized transportation in cities around the world, for a total of 41.5 trillion pkm/yr (Table 6).

To set the lower bound, we do the same calculation as above, but for each individual region, adding up all the resultant modal shifts to get a global figure. So, for example, every East Asian city might reach the nonmotorized transportation modal share of Singapore (23% of trips), while every northern European city might reach that of Copenhagen, Denmark (41% of trips). This corresponds to a total achievable nonmotorized transportation modal share of 28.6 trillion pkm/yr.

left_text_column_width

Table 6. Range of achievable adoption levels.

Unit: million pkm/yr

Current Adoption 12,860,000
Achievable – Low 28,630,000
Achievable – High 41,490,000
Adoption Ceiling 55,090,000
Left Text Column Width

If all cycling and pedestrian trips undertaken today would otherwise have happened by car, they are currently displacing approximately 1.5 Gt CO₂‑eq/yr emissions (Table 7). This is an overestimate, however, since this figure includes data from places where most people have low access to cars.

Walking and private bicycles have a different effectiveness than shared bicycles. To calculate the climate impacts of different levels of adoption, we applied the effectiveness in the share of each mode of nonmotorized transportation. Walking and private bicycling are 94.4% of nonmotorized pkm and shared bicycling is 5.3%. This gives nonmotorized transportation effectiveness at reducing emissions 115.6 t CO₂‑eq /million pkm.

On the lower end, if every city achieved a pedestrian and cycling modal share equivalent to the least-motorized city in its region, it would save 3.3 Gt CO₂‑eq/yr. On the higher end, if every city shifted enough passenger car traffic to achieve a car modal share as low as Hong Kong, China, it would save 4.8 Gt CO₂‑eq/yr. If all trips taken by car were shifted onto nonmotorized transportation (an unrealistic scenario), it would save 6.4 Gt CO₂‑eq/yr.

left_text_column_width

Table 7. Climate impact at different levels of adoption.

Unit: Gt CO₂‑eq/yr, 100-yr basis

Current Adoption 1.487
Achievable – Low 3.310
Achievable – High 4.797
Adoption Ceiling 6.370
Left Text Column Width
Additional Benefits

Air pollution and health

Air pollution kills approximately 7 million people yearly (Roser, 2024). By reducing vehicle emissions, nonmotorized transportation can alleviate related air pollution (Mailloux et al., 2021) and thereby reduce premature deaths. For example, cutting U.S. transportation emissions by 75% by 2030 could prevent 14,000 premature deaths annually due to decreased exposure to PM2.5 and ozone (Shindell et al., 2016). 

Nonmotorized transportation has other health and safety benefits (Blondiau et al., 2016; European Commission, 2019; Glazener & Khreis, 2019; Gössling et al., 2023; Mueller et al., 2015; State of Colorado, 2016; Xia et al., 2013). Switching from driving to walking or cycling boosts health by promoting physical activity and decreasing risks of cardiovascular issues, diabetes, and mental disorders (Mailloux et al., 2021).

Noise pollution from motorized vehicles has significant impacts on cardiovascular health, mental health, and sleep disturbances, contributing to 1.6 million lost healthy life years in 2004 and up to 1,100 deaths attributable to hypertension in Europe in 2024 (Staatsen et al., 2004; Munzel et al., 2024). Enhancing nonmotorized transportation can reduce the health impacts of traffic noise (de Nazelle et al., 2011).

Finally, nonmotorized transportation improves quality of life. It increases opportunities for human connection, integrates physical activity and fun into daily commutes, and increases the autonomy of less mobile groups such as children and elders. Cities with high modal shares for nonmotorized transportation generally have high quality of life (Adamos et al., 2020; Günther & Krems, 2022; Glazener and Khreis, 2019).

The use of nonmotorized transportation can reduce car crashes, which kill around 1.2 million people annually (WHO, 2023).

Income and work

Nonmotorized transportation infrastructure tends to be good for local businesses. Cyclists and pedestrians are more likely to stop at businesses they pass and therefore spend more money locally, creating more jobs (Volker & Handy, 2021). 

Nature protection

In 2011, roads and associated infrastructure accounted for 10–30% of land in residential areas and 50–70% of land in commercial areas (Litman, 2011). Transforming these lands into green spaces could provide additional habitats and reduce biodiversity loss while increasing the protection of land, soil, and water resources (European Commission, 2019).

left_text_column_width
Risks

Some literature suggested that nonmotorized transportation can lead to gentrification because bike lanes and pleasant walkable streets can increase property values, driving people who used to live in a neighborhood into other places that might still be car-dependent (Flanagan et al., 2016). This risk can be addressed by ensuring that nonmotorized transportation infrastructure is built in an equitable way, connecting different neighborhoods regardless of their social and economic status. Increasing the number of neighborhoods accessible without a car will mean that people do not have to pay a premium to live in those neighborhoods. This will avoid making accessibility without a car a privilege that only the wealthy can afford.

Cycling in a city with lots of traffic and poor cycling infrastructure puts cyclists at risk of injury from collisions with cars. This risk, however, comes mainly from the presence of cars on roads. Reducing the number of cars on the road by shifting trips to other modes can improve safety for cyclists and pedestrians (Bopp et al., 2018).

The positive impacts that nonmotorized transportation have on traffic congestion could be self-defeating if not managed well. This is because less congestion will make driving more appealing, which can, in turn, lead to additional induced demand, increasing car use and congestion (Hymel et al., 2010).

left_text_column_width
Interactions with Other Solutions

Reinforcing

Nonmotorized transportation can help passengers access public transit systems, train stations, and carpool pickup pointsThis is important because research suggests that the key to a low-carbon mobility system is to reduce the need for people to own cars (Van Acker & Witlox, 2010).

left_text_column_width

Electric bicycles use the same infrastructure as nonmotorized transportation – especially conventional bicycles. Building bike lanes, bike paths, mixed-use paths, and similar infrastructure for cyclists and pedestrians can also help with the uptake of electric bicycles. This is even more true for shared electric bicycles, which can and often do use the same sharing systems as shared conventional bicycles.

left_text_column_width

One way to encourage the adoption of electric cars is through electric car–sharing services, in which people can access a communal electric car when they need it. This has the additional benefit of reducing the need for car ownership, which is closely correlated with car use (Van Acker and Witlox, 2010). Good nonmotorized transportation infrastructure can make it easier for users of these services to access shared vehicles parked at central locations.

left_text_column_width

Nonmotorized transportation requires a lot less space than cars. Some of this space could be reallocated to ecosystem conservation and other land-based methods of GHG sequestration. In 2011, roads and parking accounted for 10–30% of land in residential areas and 50–70% of land in commercial areas (Litman, 2011). Transforming 35% of the land area of European cities alone into green spaces could sequester an additional 26 Mt CO₂‑eq/yr. Globally, this kind of effort could sequester 0.1–0.3 Gt CO₂‑eq/yr (Rodriguez Mendez et al., 2024).

left_text_column_width

Competing

Electric cars, hybrid cars, and nonmotorized transportation compete for the same pool of total pkm. Increased use of nonmotorized transportation could reduce kilometers traveled using electric cars. 

left_text_column_width
Consensus

Consensus of effectiveness in decarbonizing the transport sector: High

The large reductions in emissions that come from shifting passenger transportation from fossil fuel-powered cars to nonmotorized modes are not controversial. There is some disagreement, however, over how many pkm traveled by car can be realistically shifted to nonmotorized transportation.

Brand et al. (2021) compared the GHG emissions of active transportation with those of cars. They concluded that “locking in, investing in and promoting active travel should be a cornerstone of sustainability strategies, policies and planning.”

The Intergovernmental Panel on Climate Change (IPCC, 2023) sixth assessment report mentioned nonmotorized transportation as a solution in its transportation chapter. The authors expressed high confidence in the potential of these transportation modes to reduce emissions and recommended policy and infrastructural measures to support them.

Litman’s (2024) study of the costs and benefits of active transportation summarized the direct financial costs as well as externalities associated with pedestrian and bicycle travel compared with travel by fossil fuel–powered car. Litman noted that “active transport can provide relatively large energy savings if it substitutes for short urban trips that have high emission rates per mile due to cold starts (engines are inefficient during the first few minutes of operation) and congestion. As a result, each 1% shift from automobile to active travel typically reduces fuel consumption 2–4%.”

This research is, unfortunately, heavily biased toward richer countries, especially in Europe and North America, even though nonmotorized transportation plays a very important role in low- and middle-income countries (LMICs). The research on this topic is also biased toward cities, even though nonmotorized transportation can be a valuable means of mobility in rural areas. 

The results presented in this document summarize findings from 19 reviews and meta-analyses and 14 original studies reflecting current evidence from 84 countries, primarily the United States, the United Kingdom, and the European Union. We recognize this limited geographic scope creates bias, and hope this work inspires research and data sharing on this topic in underrepresented regions.

left_text_column_width
Dashboard

Solution Basics

one million passenger-kilometers (pkm)

tCO2-eq/unit
115.6
units/yr
Current 1.29×10⁷2.86×10⁷4.15×10⁷
Achievable (Low to High)

Climate Impact

GtCO2-eq/yr
Current 1.49 3.314.8
US$ per tCO2-eq
-1,771
Gradual

CO₂, CH₄, N₂O

Trade-offs

Production of equipment (such as bicycles) and infrastructure (such as sidewalks) creates some emissions, but these are small when divided by the total distance traveled by pedestrians and cyclists. On a per-pkm basis, this makes little difference in the emissions saved by nonmotorized transportation. 

left_text_column_width
% population
0–20
20–40
40–60
60–80
> 80

Percentage of city population living near protected bikeways, 2023

Proximity to related infrastructure, such as protected bikeways, facilitates the safe and convenient use of nonmotorized modes of transportation.

Reich, D. T. & Braga, K. (2024). Atlas of Sustainable City Transport [Data set]. Institute for Transportation and Development Policy. Retrieved June 2, 2025 from atlas.itdp.org

Geographic Guidance Introduction

Nonmotorized transportation effectiveness is high across all geographic regions, though the built environment, safety, and socio-cultural norms heavily shape its adoption and impact. Key determinants of effectiveness include the extent of safe and connected infrastructure (e.g., sidewalks, bike lanes, protected intersections), land-use patterns supporting short trips, and public policies prioritizing nonmotorized transportation.

Overall, effectiveness depends on adoption. In many cities across Europe and Asia, walking and cycling remain integral to daily travel. Cities like Amsterdam, Copenhagen, and Tokyo have successfully integrated nonmotorized modes into their broader transport systems through dedicated infrastructure and supportive urban design. In contrast, cities in North America, Sub-Saharan Africa, and parts of Latin America often lack safe, accessible infrastructure, which limits adoption.

Socioeconomic factors, including income levels, urban design, and perceptions of status, also influence the adoption of nonmotorized transport. In wealthier regions, cycling may be viewed as a lifestyle choice or an environmental statement, whereas in lower-income settings, it may be perceived as a necessity or even a sign of economic disadvantage, influencing user behavior and policy support (Seum et al., 2020).

Although shared bicycles have a lower effectiveness than walking or private bicycles, they are much more effective than cars. Increasing the number of shared bicycle systems in any geographic area can increase adoption and, therefore, make them more effective. This is particularly effective in lower-income areas where owning a private bicycle might be cost-prohibitive (Litman, 2024). Increasing shared systems in less urban and more suburban areas can be more effective, as they often replace trips made by car (Brand et al., 2021).

Nonmotorized modes are generally resilient and functional in a wide range of climates. Extreme weather conditions, including high heat, heavy rainfall, or snow, can reduce walking and cycling, although these can be mitigated through appropriate infrastructure (e.g., shaded or covered walkways, snow clearing, bike shelters).

Action Word
Improve
Solution Title
Nonmotorized Transportation
Classification
Highly Recommended
Lawmakers and Policymakers
  • Use nonmotorized transportation.
  • Reduce the associated time, distance, risk, and risk perception of nonmotorized transportation.
  • Improve infrastructure such as sidewalks, footpaths, and bike lanes.
  • Implement traffic-calming methods such as speed bumps.
  • Increase residential and commercial density.
  • Use a citizen-centered approach when designing infrastructure.
  • Enact infrastructure standards for nonmotorized transportation, such as curb ramp designs, and train contractors to implement them.
  • Establish public bike-sharing programs.
  • Create dedicated coordinating bodies across government agencies, businesses, and the public to develop nonmotorized infrastructure.
  • Disincentivize car ownership through reduced access, increases in parking fares, taxes, or other means. 

Further information:

Practitioners
  • Use nonmotorized transportation.
  • Share your experiences, tips, and reasons for choosing your modes of transportation.
  • Participate in local bike groups, public events, and volunteer opportunities.
  • Advocate to local officials for infrastructure improvements and note specific locations for improvements.
  • Encourage local businesses to create employee incentives.
  • Create “bike buses” or “walking buses” for the community and local schools.

Further information:

Business Leaders
  • Use nonmotorized transportation.
  • Ensure your business is accessible via nonmotorized transportation.
  • Advocate for better infrastructure for nonmotorized transportation.
  • Educate customers about the local infrastructure.
  • Partner with other businesses to encourage employees to cycle or walk.
  • Encourage employees to walk or cycle to and from work as their circumstances allow.
  • Create educational materials for employees on commuting best practices.
  • Offer employees pre-tax commuter benefits to include reimbursement for nonmotorized travel expenses.
  • Organize staff bike rides to increase familiarity and comfort with bicycling.
  • Install adequate bike storage, such as locking posts.
  • Emphasize walking and biking as part of company-wide sustainability initiatives and communicate how walking and biking support broader GHG emission reduction efforts.

Further information:

Nonprofit Leaders
  • Use nonmotorized transportation.
  • Ensure your office is accessible to nonmotorized transportation.
  • Advocate for infrastructure improvements and note specific locations where improvements can be made.
  • Encourage local businesses to create employee incentives.
  • Create “bike buses” or “walking buses” for the community and/or local schools.
  • Offer free classes on subjects such as bike maintenance, local bike routes, or what to know before purchasing a bike.
  • Host or support community participation in local infrastructure design.
  • Join public-private partnerships to encourage biking and walking, emphasizing the health and savings benefits.
Investors
  • Use nonmotorized transportation.
  • Deploy capital to efforts that improve bicycle and walking comfort, convenience, access, and safety.
  • Invest in public or private bike-sharing systems.
  • Invest in local supply chains for bicycles and other forms of nonmotorized transportation.
  • Seek investment opportunities that reduce material and maintenance costs for bicycles.
  • Finance bicycle purchases via low-interest loans.
  • Consider investments in nonmotorized transportation start-ups.

Further information:

Philanthropists and International Aid Agencies
  • Use nonmotorized transportation.
  • Award grants to local organizations advocating for improved walking and bicycle infrastructure.
  • Build capacity for walking and bicycle infrastructure design and construction.
  • Support organizations that distribute, refurbish, and/or donate bikes in your community.
  • Facilitate access to bicycle maintenance and supplies.
  • Host or support community education or participation efforts.
  • Donate fixtures such as street lights, guardrails, and road signs.
  • Educate the public and policymakers on the benefits and best practices of nonmotorized transportation.
Thought Leaders
  • Use nonmotorized transportation.
  • Focus messages on key decision factors for nonmotorized commuters, such as the associated health benefits and importance of fitness, climate and environmental benefits, weather forecasts, and traffic information.
  • Highlight principles of safe urban design and point out dangerous areas.
  • Share information on local bike and walking routes, general bike maintenance tips, items to consider when purchasing a bike, and related educational information.
  • Collaborate with schools on bicycle instruction, including safe riding habits and maintenance.

Further information:

Technologists and Researchers
  • Use nonmotorized transportation.
  • Examine and improve elements of infrastructure design.
  • Improve circularity, repairability, and ease of disassembly for bikes.
  • Increase the physical carrying capacities (storage) for walkers and bicyclists to facilitate shopping and transporting children, pets, and materials.
  • Identify and encourage the deployment of messaging that enhances nonmotorized transportation use.

Further information:

Communities, Households, and Individuals
  • Use nonmotorized transportation.
  • Share your experiences, tips, and reasons for choosing nonmotorized transportation.
  • Participate in local bike groups, public events, and volunteer opportunities.
  • Advocate to local officials for infrastructure improvements and note specific locations where improvements can be made.
  • Encourage local businesses to create employee incentives for using nonmotorized transportation.
  • Create “bike buses” or “walking buses” for the community and local schools.

Further information:

Sources
Updated Date
Subscribe to Transportation