Deploy Sustainable Aviation Fuel

Cluster
Fuel Switching
Image
Image
Airline jet engine
Coming Soon
Off
Summary

Sustainable aviation fuel (SAF) is a low-carbon alternative to conventional jet fuel. It is made from renewable feedstocks, including waste oils, agricultural residues, and renewable electricity. However, when combustion emissions are considered, SAF does not consistently reduce emissions when compared to conventional fuels. SAF is already in use in commercial flights at low blending levels. Advantages of SAF include its compatibility with existing aircraft and fueling infrastructure. Disadvantages include limited feedstock availability, high costs, variable climate benefits depending on production methods, and challenges in scaling up supply to meet global demand. We will “Keep Watching” SAF as part of a broader portfolio of aviation decarbonization strategies.

Description for Social and Search
Sustainable aviation fuel (SAF) is a low-carbon alternative to conventional jet fuel. It is made from renewable feedstocks, including waste oils, agricultural residues, and renewable electricity.
Overview

What is our assessment?

Based on our analysis, sustainable aviation fuel (SAF) has the potential to reduce emissions in the aviation sector, particularly for long-haul flights where few alternatives exist. However, pathways with the lowest emissions are not yet cost-effective and face significant challenges to scaling production due to feedstock constraints, land conversion pressure, and the need to meet robust sustainability standards. Based on our assessment, SAF is a climate solution to “Keep Watching.”

Plausible Could it work? Yes
Ready Is it ready? Yes
Evidence Are there data to evaluate it? Yes
Effective Does it consistently work? No
Impact Is it big enough to matter? ?
Risk Is it risky or harmful? No
Cost Is it cheap? No

What is it?

Sustainable aviation fuel (SAF) is a low-carbon alternative to conventional jet fuel that uses non-petroleum feedstocks such as waste oils, agricultural residues, and municipal solid waste. SAF is produced through chemical processes that convert these feedstocks into fuels that meet the same technical standards as fossil-based jet fuel, allowing them to be blended and used in existing aircraft engines and fueling infrastructure without modification. As of 2025, existing SAFs are only approved for use in blends; no SAF is yet certified for 100% use in commercial aircraft (also known as “neat SAF”) for passenger flights.

Does it work?

Life-cycle emissions vary widely depending on the feedstock and production pathway. Multiple SAF production pathways – such as hydroprocessed esters and fatty acids (HEFA), Fischer-Tropsch synthesis (FT), and alcohol-to-jet (ATJ) – have been approved by international aviation standards bodies. However, as of 2025, the HEFA pathway (which uses vegetable oils, waste oils, or fats) is the only commercially deployed method to produce significant amounts of SAF. 

While some SAFs could achieve low emissions, others, especially those using food crops or poorly regulated waste streams, deliver uncertain climate benefits or can even increase emissions compared to conventional fuels. (We include emissions from burning biomass and biofuels, using default Intergovernmental Panel on Climate Change [IPCC] stationary combustion emission factors for each feedstock. See the Drawdown Explorer primer on effectiveness of solutions.) Others, such as FT pathways, which use municipal solid waste or agricultural waste and residues, have the greatest potential for emissions reduction.

Real-world use of SAF is already underway: over 450,000 commercial flights have flown using SAF blends as of early 2025. SAF is currently being supplied at major airports in Europe, the United States, and Asia, with dozens of airlines integrating SAF into operations or entering offtake agreements. However, SAF supplies less than 0.5% of global jet fuel use. 

Why are we excited?

Sustainable aviation fuels may reduce contrails, potentially significantly reducing aviation’s climate impact. SAF can be used in existing aircraft and fueling systems without requiring new infrastructure or major redesigns. This makes it one of the few ready-to-deploy solutions for long-haul and international flights, which are difficult to electrify or replace. SAF production from waste oils and residues can deliver additional benefits, such as reduced methane emissions from organic waste streams and improved waste management. Growing policy support, rising carbon prices, and airline demand are accelerating development. 

Why are we concerned?

Despite its promise, SAF faces significant limitations and challenges that could constrain its impact and scalability. In the United States, soybean oil is one of the most commonly used feedstocks for HEFA SAF, and its production faces similar land use and ecological risks and constraints as corn ethanol. Whereas in Europe, waste oils and fats are more commonly used. Measurement, reporting, and verification of actual emissions reductions can be complex, especially when land-use change, indirect emissions, or supply chain impacts are involved. 

Due to limited feedstock availability, SAF is highly unlikely to meet the ambitious 2050 goals set by industry organizations and government institutions. Effective SAFs must be combined with other strategies, like demand reduction and new aircraft technologies, to achieve substantial emissions reductions. 

Another major concern is cost. Current SAF prices are substantially higher than fossil jet fuel, ranging from US$300 to over US$1,500/t CO₂ avoided, depending on the pathway. Without strong policy support, this cost premium poses a barrier to widespread adoption.

Solution in Action

References

Alternative Fuels Data Center. (n.d.). Sustainable Aviation Fuel. https://afdc.energy.gov/fuels/sustainable-aviation-fuel

Bardon, P., & Massol, O. (2025). Decarbonizing aviation with sustainable aviation fuels: Myths and realities of the roadmaps to net zero by 2050. Renewable and Sustainable Energy Reviews, 211, 115279. https://doi.org/10.1016/j.rser.2024.115279

Boyles, H. (2022). Climate-Tech to Watch: Sustainable Aviation Fuel. https://itif.org/publications/2022/10/17/climate-tech-to-watch-sustainable-aviation-fuel

Buchholz, N., Fehrm, B., Kaestner, L., Uhrenbacher, S., & Vesco, M. (2023). Study: How To Accelerate Aviation’s CO2 Reduction | Aviation Week Network. Link to source: https://aviationweek.com/air-transport/aircraft-propulsion/study-how-accelerate-aviations-co2-reduction 

Bullerdiek, N., Neuling, U., & Kaltschmitt, M. (2021). A GHG reduction obligation for sustainable aviation fuels (SAF) in the EU and in Germany. Journal of Air Transport Management, 92, 102020. https://doi.org/10.1016/j.jairtraman.2021.102020

EASA. (2025). Sustainable Aviation Fuels | EASA. https://www.easa.europa.eu/en/domains/environment/eaer/sustainable-aviation-fuels

European Commission. (n.d.). ReFuelEU Aviation. ReFuelEU Aviation - European Commission

ICAO. (n.d.). LTAG Costs and Investments. ICAO. Link to source: https://www.icao.int/environmental-protection/LTAG/Pages/LTAG-and-Fuels.aspx

ICAO. (n.d.). Sustainable Aviation Fuels. Link to source: https://www.icao.int/environmental-protection/pages/SAF.aspx

IEA. (2025). Aviation. IEA. https://www.iea.org/energy-system/transport/aviation

IATA. (2024). IATA - Disappointingly Slow Growth in SAF Production. Link to source: https://www.iata.org/en/pressroom/2024-releases/2024-12-10-03/

IATA. (2025). IATA Releases SAF Accounting and Reporting Methodology. https://www.iata.org/en/pressroom/2025-releases/2025-01-31-01/

Michaga, M. F. R., Michailos, S., Hughes, K. J., Ingham, D., & Pourkashanian, M. (2021). 10—Techno-economic and life cycle assessment review of sustainable aviation fuel produced via biomass gasification. In R. C. Ray (Ed.), Sustainable Biofuels (pp. 269–303). Academic Press. https://doi.org/10.1016/B978-0-12-820297-5.00012-8

O’Malley, J., & Baldino, C. (2024). Availability of biomass feedstocks in the European Union to meet the 2035 ReFuelEU Aviation SAF target. International Council on Clean Transportation. https://theicct.org/publication/low-risk-biomass-feedstocks-eu-refueleu-aug24/

Prussi, M., Lee, U., Wang, M., Malina, R., Valin, H., Taheripour, F., Velarde, C., Staples, M. D., Lonza, L., & Hileman, J. I. (2021). CORSIA: The first internationally adopted approach to calculate life-cycle GHG emissions for aviation fuels. Renewable and Sustainable Energy Reviews, 150, 111398. https://doi.org/10.1016/j.rser.2021.111398

Rojas-Michaga, M. F., Michailos, S., Cardozo, E., Akram, M., Hughes, K. J., Ingham, D., & Pourkashanian, M. (2023). Sustainable aviation fuel (SAF) production through power-to-liquid (PtL): A combined techno-economic and life cycle assessment. Energy Conversion and Management, 292, 117427. https://doi.org/10.1016/j.enconman.2023.117427

Rosales Calderon, O., Tao, L., Abdullah, Z., Talmadge, M., Milbrandt, A., Smolinski, S., Moriarty, K., et al. (2024). Sustainable Aviation Fuel State-of-Industry Report: Hydroprocessed Esters and Fatty Acids Pathway. Golden, CO: National Renewable Energy Laboratory. NREL/TP-5100-87803. Link to source: https://doi.org/10.2172/2426563.

Shahriar, M. F., & Khanal, A. (2022). The current techno-economic, environmental, policy status and perspectives of sustainable aviation fuel (SAF). Fuel, 325, 124905. https://doi.org/10.1016/j.fuel.2022.124905 

Voigt, C., Kleine, J., Sauer, D., Moore, R. H., Bräuer, T., Le Clercq, P., Kaufmann, S., Scheibe, M., Jurkat-Witschas, T., Aigner, M., Bauder, U., Boose, Y., Borrmann, S., Crosbie, E., Diskin, G. S., DiGangi, J., Hahn, V., Heckl, C., Huber, F., … Anderson, B. E. (2021). Cleaner burning aviation fuels can reduce contrail cloudiness. Communications Earth & Environment, 2(1), 1–10. https://doi.org/10.1038/s43247-021-00174-y

Watson, M. J., Machado, P. G., da Silva, A. V., Saltar, Y., Ribeiro, C. O., Nascimento, C. A. O., & Dowling, A. W. (2024). Sustainable aviation fuel technologies, costs, emissions, policies, and markets: A critical review. Journal of Cleaner Production, 449, 141472. https://doi.org/10.1016/j.jclepro.2024.141472

World Economic Forum. (2021). Clean Skies for Tomorrow: Sustainable Aviation Fuels as a Pathway to Net-Zero Aviation. World Economic Forum. https://www3.weforum.org/docs/WEF_Clean_Skies_Tomorrow_SAF_Analytics_2020.pdf

Yoo, E., Lee, U., & Wang, M. (2022). Life-Cycle Greenhouse Gas Emissions of Sustainable Aviation Fuel through a Net-Zero Carbon Biofuel Plant Design. ACS Sustainable Chemistry & Engineering, 10(27), 8725–8732. https://doi.org/10.1021/acssuschemeng.2c00977

Zahid, I., Nazir, M. H., Chiang, K., Christo, F., & Ameen, M. (2024). Current outlook on sustainable feedstocks and processes for sustainable aviation fuel production. Current Opinion in Green and Sustainable Chemistry, 49, 100959. https://doi.org/10.1016/j.cogsc.2024.100959

Credits

Lead Fellows

  • Emily Cassidy
  • Heather Jones, Ph.D.

Internal Reviewer

  • Christina Swanson, Ph.D.
Speed of Action
Caveats
Additional Benefits
Risks
Consensus
Trade-offs
Action Word
Deploy
Solution Title
Sustainable Aviation Fuel
Classification
Keep Watching
Updated Date
Coming Soon Label
Coming Soon

Deploy Plastic Alternatives / Bioplastics

Image
Image
Colorful smoothies in plastic cups with label 100% biodegradable
Coming Soon
Off

Key Takeaways

  • Bioplastics are alternatives to traditional plastics that use plants instead of fossil fuels as feedstocks.
  • Deploying bioplastics can reduce fossil fuel use and GHG emissions if the bioplastics are produced sustainably and properly managed at the end of their life.
  • Inconsistent GHG emission savings, high costs, land use concerns, and limited end-of-life infrastructure prevent deploying bioplastics from being a highly recommended climate solution.
  • Consistent emissions reductions, sustainable farming, and demonstration that bioplastics can significantly scale without land use changes outweighing their climate benefits could help advance the climate benefits of deploying bioplastics.
Summary

Bioplastics are renewable, plant-based alternatives to conventional plastics that can reduce emissions by replacing fossil-based feedstocks with biogenic carbon feedstocks. These feedstocks are biomass materials that absorb atmospheric CO₂ during growth and serve as the carbon source for plastic production. The chemical and biological properties of bioplastics are well understood, commercially validated, and can reduce emissions when produced sustainably and managed properly at their end-of-life. Benefits include reducing fossil fuel reliance, alleviating plastic pollution, and, in targeted uses, supporting circularity. However, these are counterbalanced by their inconsistent emissions savings, high costs, and scalability constraints. We conclude that deploying bioplastics as plastic alternatives remains a climate solution to “Keep Watching”, but would require changes in feedstock and appropriate end-of-life infrastructure to achieve reliable emissions reductions.

Description for Social and Search
Bioplastics are renewable, plant-based alternatives to conventional plastics that can reduce emissions by replacing fossil-based feedstocks with biogenic carbon feedstocks. These feedstocks are biomass materials that absorb atmospheric CO₂ during growth and serve as the carbon source for plastic production.
Overview

What is our assessment?

Based on our analysis, the widespread use of bioplastics is challenged by their potential ecological risks and currently high costs. While bioplastics offer some environmental benefits in niche applications, their climate impact is inconsistent and hinges on feedstock type, manufacturing practices, and waste management. Therefore, we conclude that Deploy Bioplastics is a solution to “Keep Watching.”

Plausible Could it work? Yes
Ready Is it ready? Yes
Evidence Are there data to evaluate it? Yes
Effective Does it consistently work? No
Impact Is it big enough to matter? No
Risk Is it risky or harmful? No
Cost Is it cheap? No

What is it?

Bioplastics (also called biopolymers) are plastic alternatives made from renewable biological sources, such as corn, sugarcane, crop residues, or other plants, instead of fossil fuels. Bioplastics are produced by extracting sugars or starches from plants and converting them through chemical or biological processes into chemical building blocks that form the basic structure of plastics  (Di Bartolo et al., 2021; Rosenboom et al., 2022; Zhao et al., 2023). Because plants absorb atmospheric CO₂ through photosynthesis, the carbon stored in bioplastics is considered biogenic, as it is already part of the natural carbon cycle. In contrast, petrochemical plastics are made by extracting and refining oil or natural gas, which releases new (formerly buried) carbon into the atmosphere (Bauer et al., 2022; Karali et al., 2024; Walker & Rothman, 2020). Bioplastics cut emissions by replacing fossil carbon feedstocks with biomass-based feedstocks (Rosenboom et al., 2022). Some bioplastics are durable, non-biodegradable, chemically identical to traditional plastics (i.e., “drop-in” bioplastics), and recyclable. Others are biodegradable and can be designed to break down in compost (Di Bartolo et al., 2021; Rosenboom et al., 2022; Zhao et al., 2023). Emissions from bioplastics come from growing and processing biomass (which requires energy and land use), manufacturing the plastics, and managing their end-of-life waste (Ita-Nagy et al., 2020; Islam et al., 2024; Walker & Rothman, 2020). Bioplastics can achieve climate benefits when the emissions from production and end of life are kept low enough to realize the advantages of biogenic carbon (Bishop et al., 2022).

Does it work?

The basic idea of bioplastics is scientifically and chemically sound, with their development and commercialization ongoing since the 1990s. Numerous studies support the effectiveness of bioplastics in reducing atmospheric CO₂ emissions from feedstock production and manufacturing stages compared to fossil-based plastics, particularly when made from sustainably sourced biomass under energy-efficient conditions and properly composted or recycled (Chen et al., 2024; Islam et al., 2024; Singh et al., 2022; Spierling et al., 2018). However, other studies show bioplastics have inconsistent emissions reduction performance (Islam et al., 2024; Patria et al., 2024; Walker & Rothman, 2020; Zanon-Zotin et al., 2023; Zhao et al., 2020). Global adoption also remains limited, representing only about 0.5% of total plastics production (approximately 2–2.5 Mt out of 414 Mt) (European Bioplastics, 2023, 2024; Meng et al., 2024; Plastics Europe, 2024). 

Why are we excited?

Bioplastics, particularly biologically derived and biodegradable polymers, have functional advantages in reducing fossil fuel dependence and mitigating plastic pollution. By sourcing raw materials from renewable biomass instead of petroleum (e.g., oil, natural gas), bioplastics can lower CO₂ emissions in the production stage, especially when accounting for biogenic carbon uptake during plant cultivation (Bauer et al., 2022; Benavides et al., 2020; Ferreira-Filipe et al., 2021). Some types of bioplastics are interchangeable with traditional plastics and can be produced with existing plastic manufacturing systems, easing the transition (Di Bartolo et al., 2021; Rosenboom et al., 2022; "The Multifaceted Challenges," 2024). Compostable plastics simplify disposal in applications where contamination with food or organic waste occurs, enabling organic recycling and returning carbon and other nutrients to soil (Di Bartolo et al., 2021; Ferreira-Filipe et al., 2021). Biodegradable bioplastics are also advantageous for products that are often discarded and may leak into the environment, assuming complete bioplastic breakdown without uncontrolled side effects (Barbu, 2024; Rosenboom et al., 2022). Studies show that two widely used commercial bioplastics, polylactic acid (PLA) and polyhydroxybutyrate (PHB), biodegrade 60–80% in composting conditions within 28–30 days, while cellulose-based and starch-based plastics can fully degrade in soil and marine environments in 180 days and 50 days, respectively (Zhao et al., 2020). These functional benefits, combined with potential additional benefits, such as soil enrichment and waste stream simplification, make bioplastics appealing in specific, targeted use cases. More broadly, they can significantly contribute to emissions reduction efforts in materials production when designed for circularity and supported by infrastructure that facilitates appropriate end-of-life waste treatment (Bauer et al., 2022; Bishop et al., 2022; Di Bartolo et al., 2021; Rosenboom et al., 2022). 

Why are we concerned?

Despite their promise, bioplastics have several limitations as a viable climate solution, including relatively low emissions reduction potential and possible risks and adverse impacts from their large-scale deployment. Current production is low. To reach a meaningful 20–30% marketplace share by 2040, bioplastics would need to expand manufacturing by approximately 30% per year, nearly double the current pace. This could put pressure on land and food systems, since current bioplastics rely on food-based crops for industrial-level production (Bishop et al., 2022; Dokl et al., 2024; Escobar & Britz, 2021; Helm et al., 2025; Zhao et al., 2023). This raises sustainability concerns around food security and could potentially drive unintended land-use changes such as deforestation or cropland conversion (Bishop et al., 2022; Dokl et al., 2024; Escobar & Britz, 2021; Helm et al., 2025; Piemonte & Gironi, 2011; Zanon-Zotin et al., 2023). Furthermore, the effectiveness of reducing emissions by replacing conventional plastics with bioplastics is low and inconsistent (Islam et al., 2024; Walker & Rothman, 2020; Zanon-Zotin et al., 2023). Some bioplastics produce more life cycle emissions than conventional plastics (Benavides et al., 2020; Islam et al., 2024; Vanderreydt et al., 2021; Walker & Rothman, 2020). The likely climate impact of replacing 20–30% of traditional plastics with bioplastics is <0.1 Gt CO₂‑eq/yr. End-of-life treatment is also a major challenge (“The Multifaceted Challenges,” 2024). Many bioplastics are incompatible with home composting and current recycling streams, and improperly composted or landfilled biodegradable bioplastics can emit methane (Cotterill, 2020; Di Bartolo et al., 2021). Finally, bioplastics remain 2–3 times more expensive than conventional plastics (Chen et al., 2024; Zhao et al., 2023).

Solution in Action

References

Barbu, B. (2024). Can biodegradable polymers make microplastics? C&EN Global Enterprise, 102(37), 21–22. Link to source: https://doi.org/10.1021/cen-10237-cover4‌ 

Bauer, F., Nielsen, T. D., Nilsson, L. J., Palm, E., Ericsson, K., Fråne, A., & Cullen, J. (2022). Plastics and climate change—Breaking carbon lock-ins through three mitigation pathways. One Earth, 5(4), 361–376.‌ Link to source: https://doi.org/10.1016/j.oneear.2022.03.007 

Benavides, P. T., Lee, U., & Zarè-Mehrjerdi, O. (2020). Life cycle greenhouse gas emissions and energy use of polylactic acid, bio-derived polyethylene, and fossil-derived polyethylene. Journal of Cleaner Production, 277, Article 124010. Link to source: https://doi.org/10.1016/j.jclepro.2020.124010

Bishop, G., Styles, D., & Lens, P. N. L. (2022). Land-use change and valorisation of feedstock side-streams determine the climate mitigation potential of bioplastics. Resources, Conservation and Recycling, 180, Article 106185. Link to source: https://doi.org/10.1016/j.resconrec.2022.106185‌

Chen, G., Li, J., Sun, Y., Wang, Z., Leeke, G. A., Moretti, C., Cheng, Z., Wang, Y., Li, N., Mu, L., Li, J., Tao, J., Yan, B., & Hou, L. (2024). Replacing traditional plastics with biodegradable plastics: Impact on carbon emissions. Engineering, 32, 152–162. Link to source: https://doi.org/10.1016/j.eng.2023.10.002 
‌
Cotterill, M. (2020, August 5). Bioplastics: Don’t let the label fool you. Canadian Geographic.
Link to source: https://canadiangeographic.ca/articles/bioplastics-dont-let-the-label-fool-you/ 

Di Bartolo, A., Infurna, G., & Dintcheva, N. T. (2021). A Review of Bioplastics and Their Adoption in the Circular Economy. Polymers, 13(8), Article 1229. Link to source: https://doi.org/10.3390/polym13081229 

Dokl, M., Copot, A., Krajnc, D., Fan, Y. V., Vujanović, A., Aviso, K. B., Tan, R. R., Kravanja, Z., & Čuček, L. (2024). Global projections of plastic use, end-of-life fate and potential changes in consumption, reduction, recycling and replacement with bioplastics to 2050. Sustainable Production and Consumption, 51, 498–518. Link to source: https://doi.org/10.1016/j.spc.2024.09.025 

Escobar, N., & Britz, W. (2021). Metrics on the sustainability of region-specific bioplastics production, considering global land use change effects. Resources, Conservation and Recycling, 167, Article 105345. Link to source: https://doi.org/10.1016/j.resconrec.2020.105345 

‌‌European Bioplastics. (2023). Bioplastics market development update 2023. European Bioplastics e.V. Link to source: https://docs.european-bioplastics.org/publications/market_data/2023/EUBP_Market_Data_Report_2023.pdf 

‌‌‌‌European Bioplastics. (2024). Bioplastics market development update 2024. European Bioplastics e.V. Link to source: https://www.european-bioplastics.org/market/ 

Ferreira-Filipe, D. A., Paço, A., Duarte, A. C., Rocha-Santos, T., & Patrício Silva, A. L. (2021). Are biobased plastics green alternatives?—A critical review. International Journal of Environmental Research and Public Health, 18(15), Article 7729. Link to source: https://doi.org/10.3390/ijerph18157729 

Helm, L. T., Venier-Cambron, C., & Verburg, P. H. (2025). The potential land-use impacts of bio-based plastics and plastic alternatives. Nature Sustainability, 8, 190–201. Link to source: https://doi.org/10.1038/s41893-024-01492-7 

Islam, M., Xayachak, T., Haque, N., Lau, D., Bhuiyan, M., & Pramanik, B. K. (2024). Impact of bioplastics on environment from its production to end-of-life. Process Safety and Environmental Protection, 188, 151–166. Link to source: https://doi.org/10.1016/j.psep.2024.05.113‌ 

Ita-Nagy, D., Vázquez-Rowe, I., Kahhat, R., Chinga-Carrasco, G., & Quispe, I. (2020). Reviewing environmental life cycle impacts of biobased polymers: current trends and methodological challenges. The International Journal of Life Cycle Assessment, 25(11), 2169–2189. Link to source: https://doi.org/10.1007/s11367-020-01829-2‌ 

Karali, N., Khanna, N., & Shah, N. (2024). Climate impact of primary plastic production [Report]. Lawrence Berkeley National Laboratory. Link to source: https://escholarship.org/uc/item/6cc1g99q‌ 

Meng, F., Brandão, M., & Cullen, J. M. (2024). Replacing plastics with alternatives is worse for greenhouse gas emissions in most cases. Environmental Science & Technology, 58(6), 2716–2727. Link to source: https://doi.org/10.1021/acs.est.3c05191‌ 

Patria, R. D., Rehman, S., Yuen, C.-B., Lee, D.-J., Vuppaladadiyam, A. K., & Leu, S. (2024). Energy-environment-economic (3E) hub for sustainable plastic management – Upgraded recycling, chemical valorization, and bioplastics. Applied Energy, 357, Article 122543. Link to source: https://doi.org/10.1016/j.apenergy.2023.122543‌ 

Piemonte, V., & Gironi, F. (2011). Land-use change emissions: How green are the bioplastics? Environmental Progress & Sustainable Energy, 30(4), 685–691. Link to source: https://doi.org/10.1002/ep.10518 

Plastics Europe. (2024, November 18). Plastics – the fast Facts 2024 • Plastics Europe. Link to source: https://plasticseurope.org/knowledge-hub/plastics-the-fast-facts-2024/ 

Rosenboom, J.-G., Langer, R., & Traverso, G. (2022). Bioplastics for a circular economy. Nature Reviews Materials, 7, 117–137. Link to source: https://doi.org/10.1038/s41578-021-00407-8 

‌‌Singh, N., Ogunseitan, O. A., Wong, M. H., & Tang, Y. (2022). Sustainable materials alternative to petrochemical plastics pollution: A review analysis. Sustainable Horizons, 2, Article 100016. Link to source: https://doi.org/10.1016/j.horiz.2022.100016

Spierling, S., Knüpffer, E., Behnsen, H., Mudersbach, M., Krieg, H., Springer, S., Albrecht, S., Herrmann, C., & Endres, H.-J. (2018). Bio-based plastics—A review of environmental, social and economic impact assessments. Journal of Cleaner Production, 185, 476–491. Link to source: https://doi.org/10.1016/j.jclepro.2018.03.014

The multifaceted challenges of bioplastics [Editorial note]. (2024). Nature Reviews Bioengineering, 2(4), 279–279. Link to source: https://doi.org/10.1038/s44222-024-00181-6 

Vanderreydt, I., Rommens, T., Tenhunen, A., Mortensen, L. F., & Tange, I. (2021). Greenhouse gas emissions and natural capital implications of plastics (including biobased plastics). (Eionet Report No. ETC/WMGE 2021/3). European Environment Agency / Eionet.
Link to source: https://www.eionet.europa.eu/etcs/etc-wmge/products/etc-wmge-reports/greenhouse-gas-emissions-and-natural-capital-implications-of-plastics-including-biobased-plastics 

‌Walker, S., & Rothman, R. (2020). Life cycle assessment of bio-based and fossil-based plastic: A review. Journal of Cleaner Production, 261, Article 121158. Link to source: https://doi.org/10.1016/j.jclepro.2020.121158 

Zanon-Zotin, M., Bergman-Fonte, C., Nogueira Morais, T., Barbosa Maia, P. L., Carvalho, L., Angelkorte, G., Oliveira Fiorini, A. C., Rua Rodriguez Rochedo, P., Portugal-Pereira, J., Szklo, A., & Schaeffer, R. (2023). Unpacking bio-based alternatives to ethylene production in Brazil, Europe, and the United States: A comparative life cycle assessment. Journal of Cleaner Production, 428, Article 139376. Link to source: https://doi.org/10.1016/j.jclepro.2023.139376

Zhao, X., Cornish, K., & Vodovotz, Y. (2020). Narrowing the gap for bioplastic use in food packaging: An update. Environmental Science & Technology, 54(8), 4712–4732. Link to source: https://doi.org/10.1021/acs.est.9b03755 

‌Zhao, X., Wang, Y., Chen, X., Yu, X., Li, W., Zhang, S., Meng, X., Zhao, Z.-M., Dong, T., Anderson, A., Aiyedun, A., Li, Y., Webb, E., Wu, Z., Kunc, V., Ragauskas, A., Ozcan, S., & Zhu, H. (2023). Sustainable bioplastics derived from renewable natural resources for food packaging. Matter, 6(1), 97–127. Link to source: https://doi.org/10.1016/j.matt.2022.11.006 

Credits

Lead Fellow

  • Nina-Francesca Farac, Ph.D.

Contributors

  • Amanda Smith, Ph.D.
  • Sarah Gleeson, Ph.D.

Internal Reviewer

  • Christina Swanson, Ph.D.
Speed of Action
Caveats
Additional Benefits
Risks
Consensus
Trade-offs
Action Word
Deploy
Solution Title
Plastic Alternatives / Bioplastics
Classification
Keep Watching
Updated Date
Coming Soon Label
Coming Soon

Deploy Small Modular Nuclear Reactors

Sector
Electricity
Image
Image
Exterior of a small modular nuclear facility
Coming Soon
Off
Summary

Small modular nuclear reactors (SMRs) are advanced reactors designed to produce low-carbon electricity using smaller units that are factory-fabricated. SMRs aim to overcome the safety, cost, and scalability challenges of traditional large-scale nuclear power. They offer benefits such as passive safety systems, lower capital investment, and the potential to be deployed flexibly in remote or underserved regions. However, commercial deployment is limited, the costs remain uncertain, and long-term nuclear waste and proliferation concerns persist. We “Keep Watching” SMRs as a promising climate solution still in development that has not yet proven its readiness for large-scale implementation.

Description for Social and Search
Small modular nuclear reactors (SMRs) are advanced reactors designed to produce low-carbon electricity using smaller units that are factory-fabricated. SMRs aim to overcome the safety, cost, and scalability challenges of traditional large-scale nuclear power.
Overview

What is our assessment?

Based on our analysis, SMRs are a plausible and potentially impactful climate solution, but they are not yet ready for widespread deployment. The core technology is credible and carries significant potential for reducing GHG emissions. However, readiness, cost certainty, and deployment evidence are still lacking. For now, we will “Keep Watching” SMRs.

Plausible Could it work? Yes
Ready Is it ready? No
Evidence Are there data to evaluate it? No
Effective Does it consistently work? Yes
Impact Is it big enough to matter? Yes
Risk Is it risky or harmful? No
Cost Is it cheap? No

What is it?

Small modular nuclear reactors (SMRs) are advanced reactors that produce low-carbon electricity by harnessing the heat from nuclear fission, an established and well-understood physical process. The innovation of SMRs lies primarily in their design. Typically smaller than traditional reactors, with a capacity of less than 300 megawatts (MW), SMRs are factory-built for enhanced quality control. This design allows them to be delivered to installation sites more quickly and potentially at a lower cost compared to conventional reactors, which typically range in capacity from about 700 MW to over 1,600 MW. While SMRs are generally considered "utility-scale" in their capacity, their smaller size makes them a viable option for smaller-scale applications, such as large micro-grids. These reactors can be assembled in a modular fashion, allowing incremental capacity additions. Additionally, some SMR designs boast enhanced safety features, including passive cooling systems that can function without external power sources, reducing the risks associated with reactor overheating or meltdowns. Currently, several countries are planning the deployment of SMRs, particularly China and the United States. Given their modular nature, several African countries, such as Ghana, are also looking toward SMRs to address their energy access deficits. Based on current plans, the International Energy Agency expects several countries to have multiple SMRs installed and operational by around 2030.

Does it work?

The physics behind SMRs is sound, and their potential as low-carbon energy sources is also scientifically valid, as they do not emit GHG emissions during operation. Several pilot SMR projects have also been launched. SMRs have yet to move beyond the demonstration phase to widespread commercial adoption. No SMR is currently deployed at the scale necessary to reduce global emissions measurably. Furthermore, independent, peer-reviewed empirical data on long-term operational performance, scalability, and cost remain sparse. While several countries, including the United States, Hungary, China, and Ghana, have announced plans or are discussing deploying SMRs within the next decade, those plans are still in the preparatory stages.

Why are we excited?

SMRs have several features that make them appealing as a potential climate solution. If scaled appropriately, they could displace fossil-fuel-based power generation and reduce carbon emissions significantly. Projected deployment scenarios by the Nuclear Energy Agency suggest that by 2050, the global SMR market could reach 375 gigawatts of installed capacity, avoiding up to 15 Gt of cumulative CO₂ emissions. Their smaller size and modular nature reduce financial risk, making them potentially more accessible to developing countries or smaller utilities. They are also flexible in siting and can complement variable renewable energy sources like solar and wind by providing reliable baseload or backup power. Additionally, SMRs could help decarbonize hard-to-electrify sectors like process heat in industry or remote energy systems. These attributes have prompted excitement among proponents who see SMRs as a scalable, flexible, and resilient solution for emissions-free power. 

Why are we concerned?

Despite their promise, SMRs face several challenges that limit their readiness for large-scale deployment. Safety remains a concern – not necessarily because of design flaws, but because any nuclear reactor carries inherent risks. Waste disposal and the potential for proliferation of nuclear materials remain persistent issues. Regulatory hurdles are also significant, as existing frameworks are often geared toward conventional reactors and may slow the licensing of newer designs. The cost of SMRs is another outstanding question. Recent analyses by Wood Mackenzie suggest that SMRs could cost US$6,000 to US$8,000 per kilowatt of capacity, which is well above the costs of utility-scale solar (US$1,448) or onshore wind (US$2,098). Deployment timelines also pose a challenge. Given the urgency of climate action, technologies that cannot be deployed at scale within the next 10–15 years may offer limited near-term benefits. A recent study by the Institute for Energy Economics and Financial Analysis opines that SMRs are still too costly, too time-consuming to construct, and too risky to significantly impact the transition away from fossil fuels in the next decade. While peer-reviewed academic studies have been conducted, a comprehensive, independent evaluation of large-scale deployment remains absent.

Solution in Action

References

Asuega, A., Limb, B. J., & Quinn, J. C. (2023). Techno-economic analysis of advanced small modular nuclear reactors. Applied Energy, 334, 120669. Link to source: https://doi.org/10.1016/J.APENERGY.2023.120669

Hussein, E. M. A. (2020). Emerging small modular nuclear power reactors: A critical review. Physics Open, 5, 100038. Link to source: https://doi.org/10.1016/J.PHYSO.2020.100038

IEA. (2025). The Path to a New Era for Nuclear Energy. Link to source: https://www.iea.org/reports/the-path-to-a-new-era-for-nuclear-energy

Midgley, E. (2023). Decarbonizing Industries with the Help of Small and Micro Nuclear Reactors | IAEA. Link to source: https://www.iaea.org/bulletin/decarbonizing-industries-with-the-help-of-small-and-micro-nuclear-reactors

Sam, R., Sainati, T., Hanson, B., & Kay, R. (2023). Licensing small modular reactors: A state-of-the-art review of the challenges and barriers. Progress in Nuclear Energy, 164, 104859. Link to source: https://doi.org/10.1016/J.PNUCENE.2023.104859

Sovacool, B. K., Andersen, R., Sorensen, S., Sorensen, K., Tienda, V., Vainorius, A., Schirach, O. M., & Bjørn-Thygesen, F. (2016). Balancing safety with sustainability: assessing the risk of accidents for modern low-carbon energy systems. Journal of Cleaner Production, 112, 3952–3965. Link to source: https://doi.org/10.1016/J.JCLEPRO.2015.07.059

Van Hee, N., Peremans, H., & Nimmegeers, P. (2024). Economic potential and barriers of small modular reactors in Europe. Renewable and Sustainable Energy Reviews, 203. Link to source: https://doi.org/10.1016/j.rser.2024.114743

Vanatta, M., Patel, D., Allen, T., Cooper, D., & Craig, M. T. (2023). Technoeconomic analysis of small modular reactors decarbonizing industrial process heat. Joule, 7(4), 713–737. Link to source: https://doi.org/10.1016/J.JOULE.2023.03.009

World Nuclear Association. (2024). Small Nuclear Power Reactors. Link to source: https://world-nuclear.org/information-library/nuclear-fuel-cycle/nuclear-power-reactors/small-nuclear-power-reactors 

Credits

Lead Fellow 

  • Michael Dioha, Ph.D.

Internal Reviewer

  • Christina Swanson, Ph.D.
Speed of Action
Caveats
Additional Benefits
Risks
Consensus
Trade-offs
Action Word
Deploy
Solution Title
Small Modular Nuclear Reactors
Classification
Keep Watching
Updated Date
Coming Soon Label
Coming Soon

Deploy Nuclear Fusion

Sector
Electricity
Image
Image
A graphic showing the inside of a nuclear fusion reactor
Coming Soon
Off
Summary

Nuclear fusion combines two elements in a nuclear reaction to form a larger element and release energy that can be used to generate electricity. Nuclear fusion has been researched since the 1950s, but there have been no nuclear fusion plants built to date. Globally, electricity production mainly relies on fossil fuels, with an increasing portion being generated by renewable sources such as wind and solar. However, wind and solar alone are unable to provide baseload electricity (the minimum amount of electric power delivered to an electrical grid) due to their intermittent nature, and energy storage is required for grid reliability. Advantages of nuclear fusion include reducing reliance on fossil fuels for electricity generation, producing emission-free electricity during operation, being inherently safer than nuclear fission, generating minimal nuclear waste, and providing baseload power. Disadvantages include technical challenges, high costs, and uncertainty around regulations. We will “Keep Watching” nuclear fusion, but it is currently unproven and extremely expensive.

Description for Social and Search
Nuclear fusion combines two elements in a nuclear reaction to form a larger element and release energy that can be used to generate electricity. Nuclear fusion has been researched since the 1950s, but there have been no nuclear fusion plants built to date.
Overview

What is our assessment?

Based on our analysis, nuclear fusion is a promising alternative form of electricity generation, but it is still at a theoretical stage and will not be ready for large-scale deployment within the next 10–15 years, when it could have the most impact on meeting global climate targets. We will “Keep Watching” this potential climate solution.

Plausible Could it work? Yes
Ready Is it ready? No
Evidence Are there data to evaluate it? Limited
Effective Does it consistently work? No
Impact Is it big enough to matter? Yes
Risk Is it risky or harmful? No
Cost Is it cheap? No

What is it?

Nuclear fusion is the process by which two individual elements are fused together into a single larger element using high pressure and temperature; this reaction releases large amounts of energy. This is the same reaction that happens in stars such as the sun. The energy from the fusion reaction can then be harnessed to produce electricity without emitting GHGs. Nuclear fusion power plants are best suited for centralized, large-scale generation (500 MW–1.2 GW of electricity output).

Does it work?

Nuclear fusion experiments have been carried out that prove the scientific principle is sound. However, only in recent years have experiments succeeded in producing more energy than was needed to initiate and sustain the fusion reaction. There have been no nuclear fusion power plants built to date, and it is unlikely that nuclear fusion–powered electricity generation will be ready for deployment before 2050.

Why are we excited?

Nuclear fusion energy offers several advantages as a solution to climate change, including high power density, the ability to deliver “firm” power (i.e., power that can be relied upon to meet demand when needed), and no GHG emissions. In addition, the most commonly used fuel for nuclear fusion – hydrogen – is readily accessible, there is no risk of a nuclear meltdown, and the process produces relatively little nuclear waste, meaning the risk of nuclear proliferation is almost nonexistent. Some research suggests that nuclear fusion could provide up to 15% of total electricity production either by replacing existing centralized power plants (e.g., oil and gas, coal, nuclear fission) that have reached end-of-life or to satisfy growing demand for electricity as access and electrification increase.

Why are we concerned?

Nuclear fusion is not considered remotely close to being ready to deploy as a climate solution. It faces many technical challenges, including uncertainties related to fusion reactor design and optimal fuel types. The costs for nuclear fusion–produced electricity are highly uncertain and are expected to grow compared to existing estimates. Current estimates for nuclear fusion energy costs exceed US$150/MWh, nearly double the 2020 price per MWh for other energy sources. There are also large uncertainties about the policy environment for nuclear fusion plants, which could hinder both development and deployment. Currently, projections suggest that nuclear fusion reactors could be introduced between 2050 and 2060. This means that even under optimistic conditions, nuclear fusion is unlikely to make a significant contribution to meeting 2050 emissions reduction targets. 

Solution in Action

References

Barbarino, M. (2020). A brief history of nuclear fusion. Nature Physics, 16, 890–893. Link to source: https://www.nature.com/articles/s41567-020-0940-7 

Barbarino, M. (2023, August 3). What is nuclear fusion? IAEA. Link to source: https://www.iaea.org/newscenter/news/what-is-nuclear-fusion 

Foster, J., Lux, H., Knight, S., Wolff, D., & Muldrew, S. I. (2024). Extrapolating costs to commercial fusion power plants. IEEE, 52(9), 3772–3777. Link to source: https://doi.org/10.1109/TPS.2024.3362428 

Kembleton, R. (2019). Nuclear fusion: What of the future. Managing Global Warming, 199–220. Link to source: https://www.sciencedirect.com/science/article/abs/pii/B9780128141045000053 

Lerede, D., Nicoli, M., Savoldi, L., & Trotta, A. (2023). Analysis of the possible contribution of different nuclear fusion technologies to the global energy transition. Energy Strategy Reviews, 49. Link to source: https://www.sciencedirect.com/science/article/pii/S2211467X23000949 

Lindley, B. Roulstone, T., Locatelli, G., & Rooney, M. (2023). Can fusion energy be cost-competitive and commercially viable? An analysis of magnetically confined reactors. Energy Policy, 177. Link to source: https://www.sciencedirect.com/science/article/abs/pii/S0301421523000964 

Lopes Cardozo, N. J., Lange, A. G. G., & Kramer, G. J. (2016). Fusion: Expensive and taking forever? Journal of Fusion Energy, 35, 94–101. Link to source: https://link.springer.com/article/10.1007/s10894-015-0012-7 

Meschini, S., Laviano, F., Ledda, F., Pettinari, D., Testoni, R., Torsello, D., & Panella, B. (2023). Frontiers, 11. Link to source: https://www.frontiersin.org/journals/energy-research/articles/10.3389/fenrg.2023.1157394/full 

MIT Energy Initiative. (2024). The role of fusion energy in a decarbonized electricity system. Massachusetts Institute of Technology. Link to source: https://energy.mit.edu/wp-content/uploads/2024/09/MITEI_FusionReport_091124_final_COMPLETE-REPORT_fordistribution.pdf 

Tokimatsu, K., Fujino, J., Konishi, S., Ogawa, Y., & Yamaji, K. (2003). Role of nuclear fusion in future energy systems and the environment under future uncertainties. Energy Policy, 31(8), 775–797. Link to source: https://www.sciencedirect.com/science/article/abs/pii/S0301421502001271 

Credits

Lead Fellow

  • Jason Lam

Contributor

  • James Gerber, Ph.D.

Internal Reviewer

  • Christina Swanson, Ph.D.
Speed of Action
Caveats
Additional Benefits
Risks
Consensus
Trade-offs
Action Word
Deploy
Solution Title
Nuclear Fusion
Classification
Keep Watching
Updated Date
Coming Soon Label
Coming Soon

Deploy Agrivoltaics

Sector
Electricity
Image
Image
Peatland
Coming Soon
On

Key Takeaways

  • Deploying agrivoltaics on just 1% of global agricultural land could offset 21 PWh/yr of electricity demand, equivalent to total global electricity consumption in 2019.
  • Agrivoltaics systems generate clean, renewable electricity without displacing agricultural activities, potentially increasing overall land use efficiency up to 200%.
  • By shading crops and livestock, solar panels installed as part of an agrivoltaics system moderate soil temperatures and reduce evapotranspiration, improving agricultural water-use efficiency by 150–300% compared with conventional farming.
  • Agrivoltaics can diversify income sources for farmers and expand rural employment opportunities.
  • Agrivoltaic systems have the greatest adoption potential in arid, dry, and land-constrained regions – particularly Africa, the Asia-Pacific, and South and Central America – where solar resources are abundant and the crop-protection benefits of shading are most pronounced.
Summary

Agrivoltaics is the dual use of land for simultaneous solar photovoltaic (PV) power generation and agricultural production. It reduces GHG emissions by shifting electricity production from fossil fuels to renewables. Agrivoltaic systems can be categorized by system type, PV configuration, module tilt, and agricultural activity. These systems operate at both utility and distributed scales. We consider all combinations of system type, PV structure, module tilt, and agricultural activity in this solution.

Description for Social and Search
​​Agrivoltaics makes it possible to grow food and generate clean solar power on the same land. It can improve land-use efficiency, stabilize crop yields in suitable climates, and add new revenue for farmers.
Overview

Electricity generation accounts for an estimated 23% of GHG emissions on a 100-year basis (Clarke et al., 2022), with fossil fuel–based sources supplying more than 60% of electricity generated in 2023 (International Energy Agency [IEA], 2024b). Since solar PV is a clean and renewable resource, agrivoltaics produces electricity without contributing to GHG emissions or air pollution during operation. Unlike conventional utility-scale solar PV, which often competes with agriculture for space, agrivoltaics combines solar PV electricity generation and agricultural production without requiring additional land use change or sacrificing arable land (Trommsdorff et al., 2025).

The primary climate benefit is the reduction of CO₂ emissions and smaller amounts of methane and nitrous oxide from displacing fossil fuel–based electricity from the grid. This solution quantifies only emissions avoided through electricity generation and does not include emissions from agricultural activities beneath or between the solar panels.

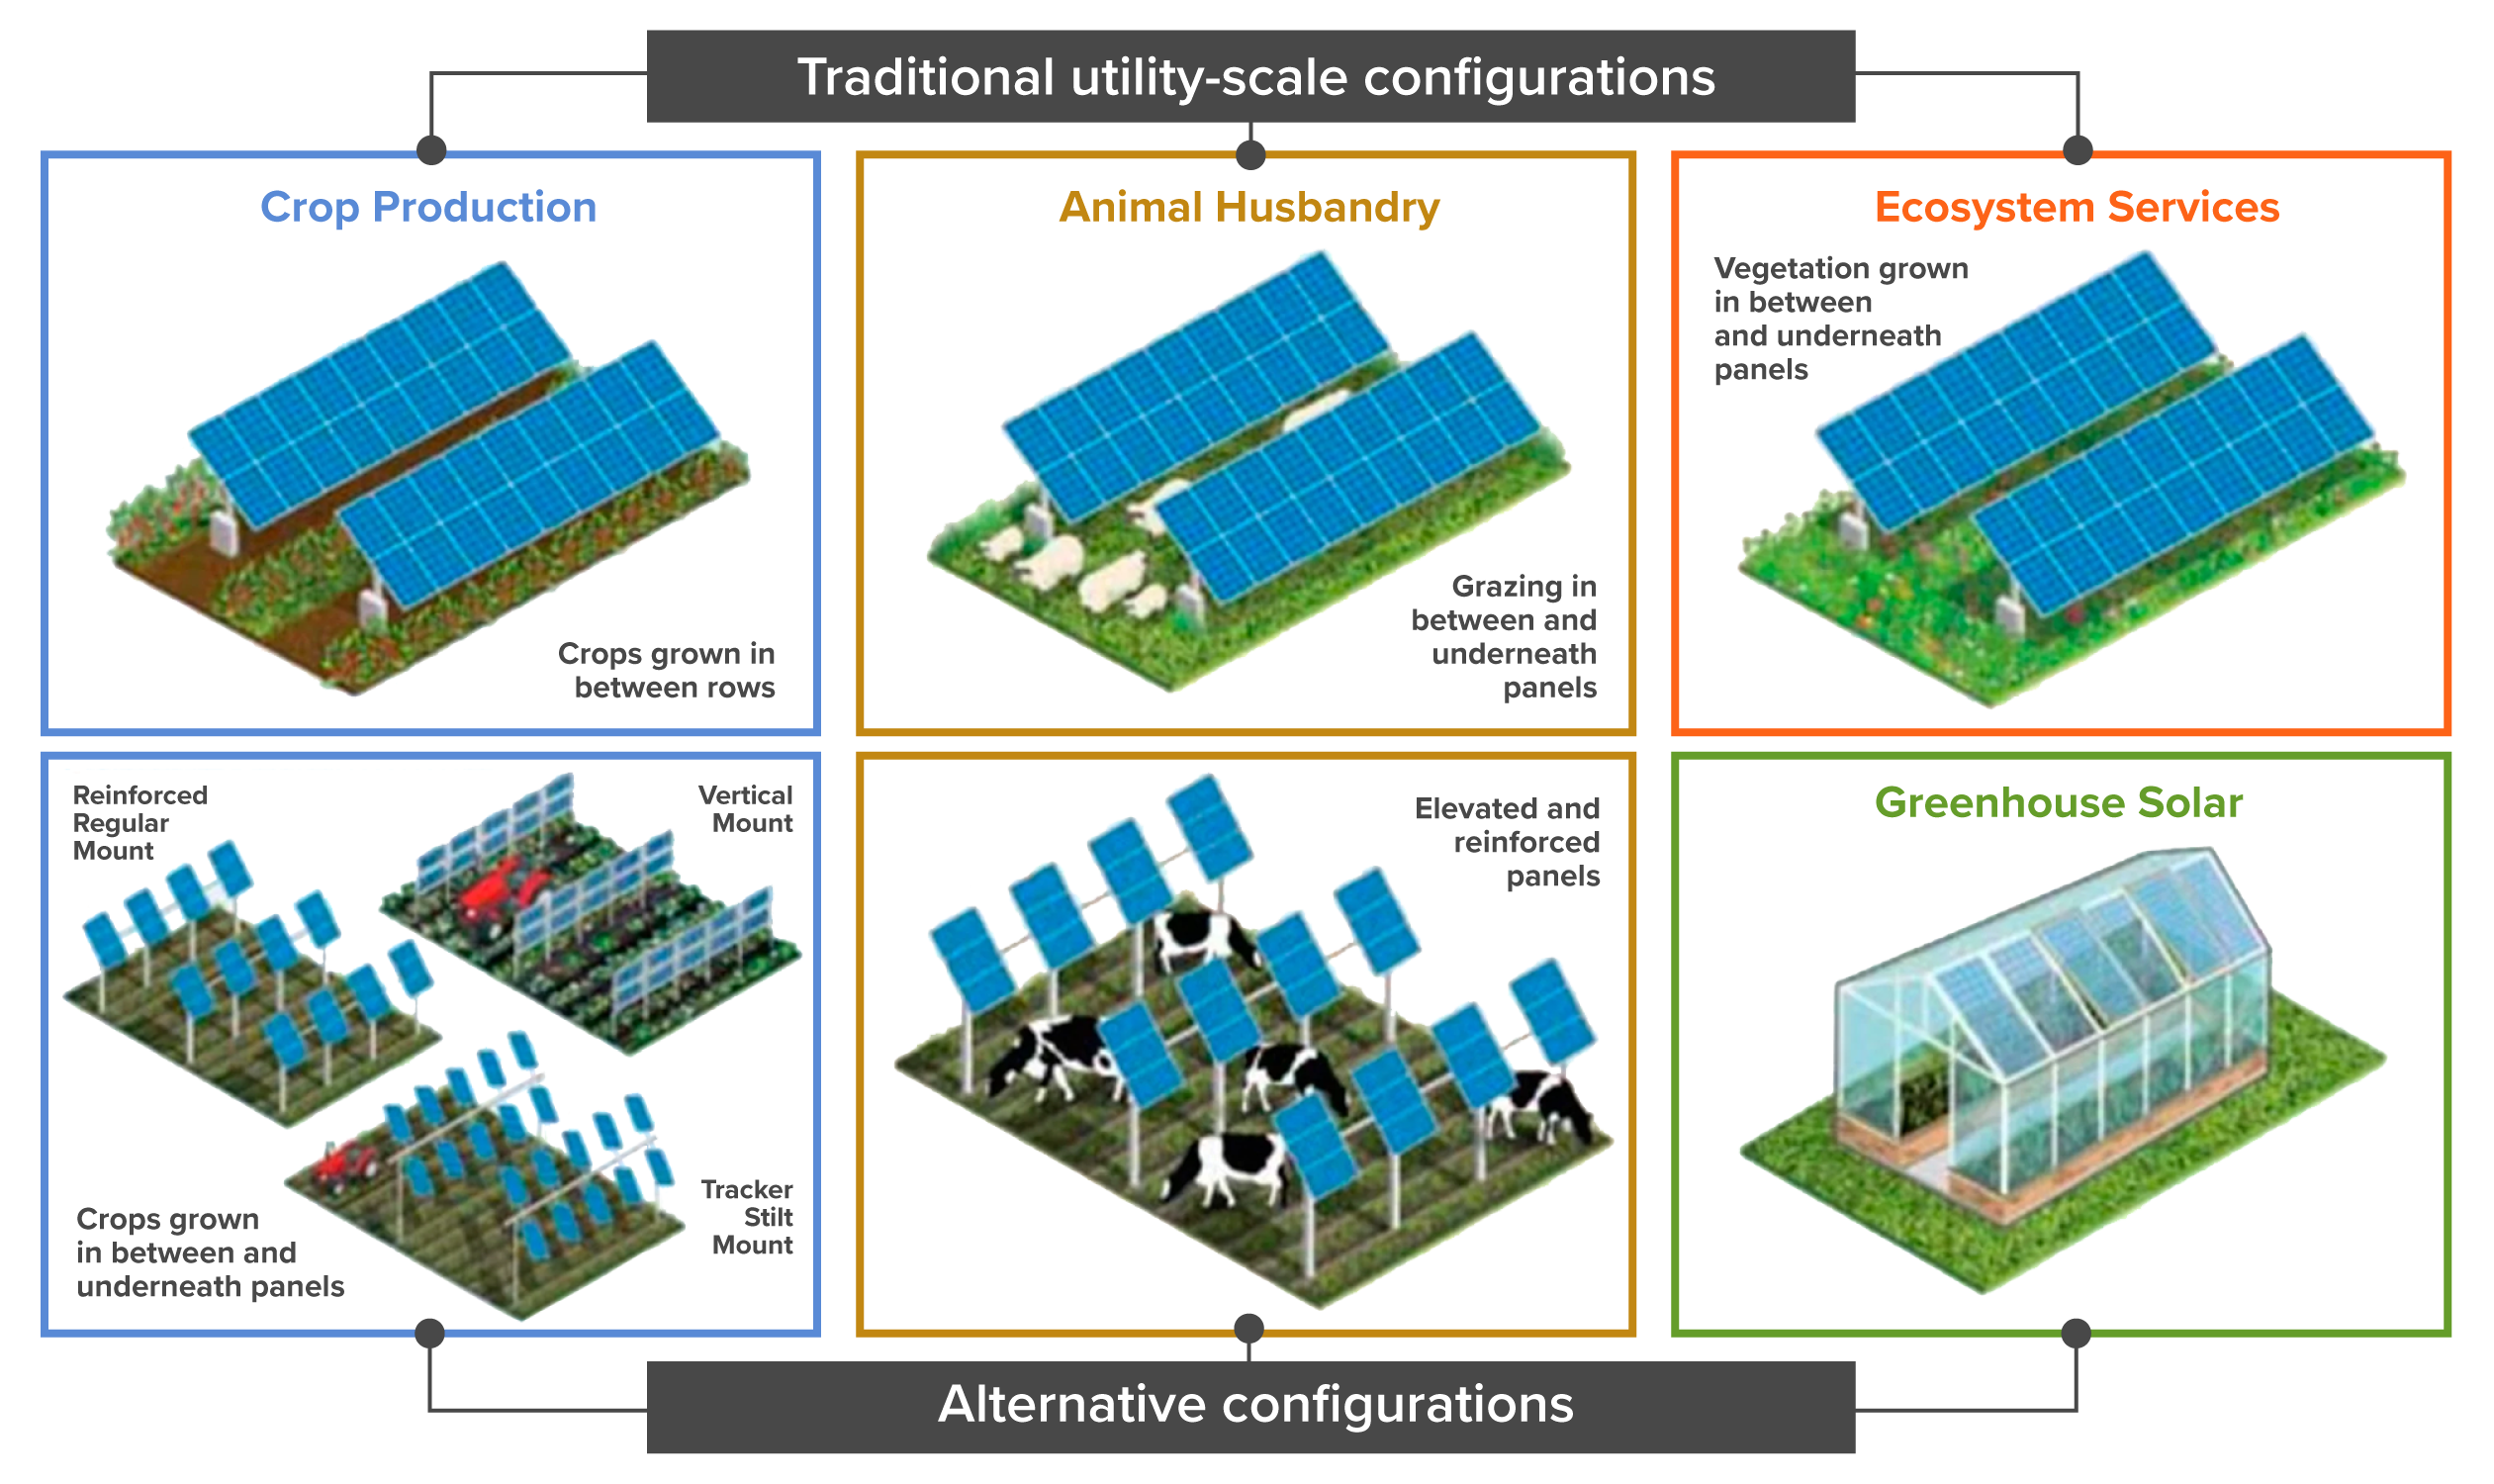
Agrivoltaic systems come in several configurations to coexist with different agricultural activities, including crop production, animal husbandry or grazing, ecosystem services, aquaculture, and pollinator habitat (Macknick et al., 2022). As shown in Figure 1, these systems range from standard ground-mounted arrangements – with crops growing between rows or livestock grazing underneath – to more specialized alternative designs such as elevated panels, vertical bifacial mounts, stilt-mounted trackers, and solar-integrated greenhouses. Overhead configurations elevate panels 2–6 meters above ground to allow standard farm operations while providing shade and weather protection for crops or livestock. Interspace (or interrow) configurations leave wide alleys between ground-mounted PV arrays for vegetation. Rooftop and structure-mounted configurations place panels on greenhouses, barns, or other farm infrastructure, using rigid or flexible panels (Campana et al., 2025; Macknick et al., 2022; Solar Power Europe, 2024a; Trommsdorff et al., 2021).

Each configuration involves different trade-offs between energy output, crop performance, land compatibility, and cost (Campana et al., 2025; Horowitz et al., 2020; Trommsdorff et al., 2025). Well-designed systems often achieve higher overall productivity with a land equivalent ratio exceeding 1 (Trommsdorff et al., 2025). Successful implementation typically requires partnerships among farmers, agricultural cooperatives, solar developers, and utilities, supported by government policies such as subsidies, tax credits, or zoning support (Trommsdorff et al., 2025). 

Figure 1. Agrivoltaic configurations range from standard ground-mounted arrangements (top row) to more specialized alternative designs (bottom row), including elevated overhead systems, vertical mounts, stilt-mounted trackers, and solar-integrated greenhouses. These systems can support agricultural activities—including crop production, grazing, ecosystem services, and habitats—on the same land. 

Image
Diagram demonstrating Agrivoltaic configurations

Copyright: Macknick, J., et al. (2022). The 5 Cs of agrivoltaic success factors in the United States: Lessons from the InSPIRE research study (No. NREL/TP-6A20-83566). National Renewable Energy Laboratory (NREL), Golden, CO (United States).

Solution in Action

References

Abel, D., Holloway, T., Harkey, M., Rrushaj, A., Brinkman, G., Duran, P., Janssen, M., & Denholm, P. (2018). Potential air quality benefits from increased solar photovoltaic electricity generation in the Eastern United States. Atmospheric Environment, 175, 65–74. Link to source: https://doi.org/10.1016/j.atmosenv.2017.11.049

Adeh, E. H., Good, S. P., Calaf, M., & Higgins, C. W. (2019). Solar PV power potential is greatest over croplands. Scientific Reports, 9, Article 11442. Link to source: https://doi.org/10.1038/s41598-019-47803-3

Agostini, A., Colauzzi, M., & Amaducci, S. (2021). Innovative agrivoltaic systems to produce sustainable energy: An economic and environmental assessment. Applied Energy, 281, 116102. Link to source: https://doi.org/10.1016/j.apenergy.2020.116102

Agrivoltaics Map (National Laboratory of the Rockies). (n.d.). [Dataset]. InSPIRE. Retrieved April 13, 2026, from Link to source: https://openei.org/wiki/InSPIRE/Agrivoltaics_Map

Ahmad, M., Zeeshan, M., & Khan, J. A. (2023). Life cycle multi-objective (geospatial, techno-economic, and environmental) feasibility and potential assessment of utility scale photovoltaic power plants. Energy Conversion and Management, 291. https://doi.org/10.1016/j.enconman.2023.117260

Amaducci, S., Yin, X., & Colauzzi, M. (2018). Agrivoltaic systems to optimise land use for electric energy production. Applied Energy, 220, 545–561. Link to source: https://doi.org/10.1016/j.apenergy.2018.03.081

Andrew, A. C., Higgins, C. W., Smallman, M. A., Graham, M., & Ates, S. (2021). Herbage yield, lamb growth and foraging behavior in agrivoltaic production system. Frontiers in Sustainable Food Systems, Volume 5-2021. Link to source: https://www.frontiersin.org/journals/sustainable-food-systems/articles/10.3389/fsufs.2021.659175

Asa’a, S., Reher, T., Rongé, J., Diels, J., Poortmans, J., Radhakrishnan, H. S., van der Heide, A., Van de Poel, B., & Daenen, M. (2024). A multidisciplinary view on agrivoltaics: Future of energy and agriculture. Renewable and Sustainable Energy Reviews, 200, 114515. Link to source: https://doi.org/10.1016/j.rser.2024.114515

Badza, K., Soro, Y. M., & Sawadogo, M. (2023). Life cycle assessment of a 33.7 MW solar photovoltaic power plant in the context of a developing country. Sustainable Environment Research, 33(1), 1–15. https://doi.org/10.1186/S42834-023-00201-X

Baik, E., Chawla, K. P., Jenkins, J. D., Kolster, C., Patankar, N. S., Olson, A., Benson, S. M., & Long, J. C. S. (2021). What is different about different net-zero carbon electricity systems? Energy and Climate Change, 2, Article 100046. Link to source: https://doi.org/10.1016/j.egycc.2021.100046 

Barron-Gafford, G. A., Pavao-Zuckerman, M. A., Minor, R. L., Sutter, L. F., Barnett-Moreno, I., Blackett, D. T., Thompson, M., Dimond, K., Gerlak, A. K., Nabhan, G. P., & Macknick, J. E. (2019). Agrivoltaics provide mutual benefits across the food–energy–water nexus in drylands. Nature Sustainability, 2(9), 848–855. Link to source: https://doi.org/10.1038/s41893-019-0364-5

Beck, M., Bopp, G., Goetzberger, A., Obergfell, T., Reise, C., & Schindele, S. (2012). Combining PV and food crops to agrophotovoltaic – optimization of orientation and harvest [PDF]. 27th European Photovoltaic Solar Energy Conference and Exhibition; 4096-4100, 5 pages, 6000 kb. Link to source: https://doi.org/10.4229/27THEUPVSEC2012-5AV.2.25

Bhatta, G., Lohani, S. P., Kc, M., Bhandari, R., Palit, D., & Anderson, T. (2025). Harnessing solar PV potential for decarbonization in Nepal: A GIS based assessment of ground-mounted, rooftop, and agrivoltaic solar systems for Nepal. Energy for Sustainable Development, 85, 101618. Link to source: https://doi.org/10.1016/j.esd.2024.101618

Biswas, A., Qiu, M., Braun, D., Dominici, F., & Mork, D. (2025). Quantifying effects of solar power adoption on CO2 emissions reduction. Science Advances, 11, Article eadq5660. https://doi.org/10.1126/sciadv.adq5660

Brown, T. & Reichenberg, L. (2021). Decreasing market value of variable renewables can be avoided by policy action. Energy Economics, 100, Article 105354. Link to source: https://doi.org/10.1016/j.eneco.2021.105354 

Buonocore, J. J., Hughes, E. J., Michanowicz, D. R., Heo, J., Allen, J. G., & Williams, A. (2019). Climate and health benefits of increasing renewable energy deployment in the United States*. Environmental Research Letters, 14(11), 114010. Link to source: https://doi.org/10.1088/1748-9326/ab49bc

Busch, C., & Wydra, K. (2023). Life cycle assessment of an agrivoltaic system with conventional potato production. Journal of Renewable and Sustainable Energy, 15(4), 043501. Link to source: https://doi.org/10.1063/5.0156779

Campana, P. E., Macknick, J., Croci, M., Elkadeem, M. R., Gorjian, S., Pascaris, A., Cuppari, R. I., Amaducci, S., Liu, W., Trommsdorff, M., Sturchio, M. A., Muller, O., Agostini, A., Chatzipanagi, A., Scognamiglio, A., & Zhang, J. (2025). Scientific frontiers of agrivoltaic cropping systems. Nature Reviews Clean Technology, 1(11), 801–821. Link to source: https://doi.org/10.1038/s44359-025-00110-9

Carvalho Fonsêca, V. D. F., De Andrade Culhari, E., Moura, G. A. B., Nascimento, S. T., Milan, H. M., Neto, M. C., & Maia, A. S. C. (2023). Shade of solar panels relieves heat load of sheep. Applied Animal Behaviour Science, 265, 105998. Link to source: https://doi.org/10.1016/j.applanim.2023.105998

Chirinda, N., Leonard, S. A., Bierbaum, R., & Whaley, C. (2024). Agrivoltaics. STAP. Link to source: http://www.stapgef.org/resources/advisory-documents/agrivoltaics

Christ, M., & Wagner, M. (2025). Integrating solar energy into German vineyards: A geospatial framework for identifying agrivoltaic potential. Agronomy, 15(9), 2174. Link to source: https://doi.org/10.3390/agronomy15092174

Clarke, L., Wei, Y.-M., De La Vega Navarro, A., Garg, A., Hahmann, A. N., Khennas, S., Azevedo, I. M. L., Löschel, A., Singh, A. K., Steg, L., Strbac, G., & Wada, K. (2022). Energy systems. In P. R. Shukla, J. Skea, R. Slade, A. Al Khourdajie, R. van Diemen, D. McCollum, M. Pathak, S. Some, P. Vyas, R. Fradera, M. Belkacemi, A. Hasija, G. Lisboa, S. Luz, & J. Malley (Eds.), Climate change 2022: Mitigation of climate change. Contribution of Working Group III to the Sixth Assessment Report of the Intergovernmental Panel on Climate Change (pp. 613–746). Cambridge University Press. Link to source: https://doi.org/10.1017/9781009157926.008

Cuppari, R. I., Branscomb, A., Graham, M., Negash, F., Smith, A. K., Proctor, K., Rupp, D., Tilahun Ayalew, A., Getaneh Tilaye, G., Higgins, C. W., & Najm, M. A. (2024). Agrivoltaics: Synergies and trade-offs in achieving the sustainable development goals at the global and local scale. Applied Energy, 362, 122970. Link to source: https://doi.org/10.1016/j.apenergy.2024.122970

Daniels, T. L. (2023). The development of utility-scale solar projects on US agricultural land: Opportunities and obstacles. Socio-Ecological Practice Research, 5(2), 205–213. Link to source: https://doi.org/10.1007/s42532-023-00139-9

de Falco, M., Sarrica, M., Scognamiglio, A., & Fasanelli, R. (2025). What does agrivoltaics mean? A study on social representations shared by experts and the press in Italy. Energy Research & Social Science, 119, 103918. Link to source: https://doi.org/10.1016/j.erss.2024.103918

Dinesh, H., & Pearce, J. M. (2016). The potential of agrivoltaic systems. Renewable and Sustainable Energy Reviews, 54, 299–308. Link to source: https://doi.org/10.1016/j.rser.2015.10.02

DNV. (2024). Energy transition outlook 2024. Link to source: https://brandcentral.dnv.com/original/gallery/10651/files/original/5c2470ac-597c-43f9-87dd-4e6b238d7845.pdf

Dupraz, C., Marrou, H., Talbot, G., Dufour, L., Nogier, A., & Ferard, Y. (2011). Combining solar photovoltaic panels and food crops for optimising land use: Towards new agrivoltaic schemes. Renewable Energy, Renewable Energy: Generation & Application, 36(10), 2725–2732. Link to source: https://doi.org/10.1016/j.renene.2011.03.005

Ember. (n.d.). Global electricity trends. In Global Electricity Review 2024. Link to source: https://ember-energy.org/latest-insights/global-electricity-review-2024/global-electricity-trends/

Ember. (2024, August 29). Empowering farmers in Central Europe: The case for agri-PV. Link to source: https://ember-energy.org/latest-insights/empowering-farmers-in-central-europe-the-case-for-agri-pv

Fan, T., Trommsdorff, M., Gölz, S., & He, J. (2022, June 17). Agrivoltaics in China: A Study of the Current State of Agrivoltaics Development, Governmental Support Schemes, and Stakeholder Groups’ Perspectives and Acceptance based on Expert Interviews. 3rd Agrivoltaics Conference & Exhibition 2022. Agrivoltaics Conference 2022. Link to source: https://publica.fraunhofer.de/entities/publication/afa41072-9cc3-4ee1-97c9-f2027d6c7a2b

FAO. (2023). Land statistics and indicators 2000–2021 (Brief No. 71). Link to source: https://openknowledge.fao.org/server/api/core/bitstreams/5c8b2707-1bcf-4c29-90e2-3487e583f71e/content#:~:text=Page%203,over%20the%20past%20two%20decades.

Firoozi, A. A., Firoozi, A. A., & Maghami, M. R. (2025). Harnessing photovoltaic innovation: Advancements, challenges, and strategic pathways for sustainable global development. Energy Conversion and Management: X, 27, 101058. Link to source: https://doi.org/10.1016/J.ECMX.2025.101058 

Ferreira Junior, R. A., Torres, I. C., De Souza, L. F. L., Dos Santos, M. A., Cavalcante, M. A. A., Tiba, C., & De Souza, J. L. (2025). Agrophotovoltaic systems in sugarcane crop − A Brazilian case study. Energy Conversion and Management, 344, 120307. Link to source: https://doi.org/10.1016/j.enconman.2025.120307

Fraunhofer Institute of Solar Energy ISE. (2024, July). Study: Levelized cost of electricity - Renewable energy technologies [PDF]. Link to source: https://www.ise.fraunhofer.de/en/publications/studies/cost-of-electricity.html

Gadhiya, G. A., & Chakraborty, S. (2025). Agrivoltaics in the Andaman and Nicobar Islands: Assessing the geo-spatial potential for sustainable development. Energy for Sustainable Development, 88, 101807. Link to source: https://doi.org/10.1016/j.esd.2025.101807

Gagnon, P., & O’Shaughnessy, E. (2024). Consequential analysis of the greenhouse gas emissions impacts of actions that influence the electric grid: The theory and practice of using marginal emissions rates (Report No. TP-6A40-91580). National Renewable Energy Laboratory. Link to source: https://doi.org/10.2172/24816

Gallagher, C. L., & Holloway, T. (2020). Integrating air quality and public health benefits in U.S. decarbonization strategies. Frontiers in Public Health, Volume 8-2020. Link to source: https://www.frontiersin.org/journals/public-health/articles/10.3389/fpubh.2020.563358

Horowitz, K., Ramasamy, V., Macknick, J., & Margolis, R. (2020). Capital costs for dual-use photovoltaic installations: 2020 benchmark for ground-mounted PV systems with pollinator-friendly vegetation, grazing, and crops (Report No. TP-6A20-77811). National Renewable Energy Laboratory. Link to source: https://doi.org/10.2172/1756713

Hwang, K.-W., & Lee, C.-Y. (2024). Estimating the deterministic and stochastic levelized cost of the energy of fence-type agrivoltaics. Energies, 17(8), 1932. Link to source: https://doi.org/10.3390/en17081932

International Energy Agency. (2024a). World Energy Outlook 2024. Link to source: https://www.iea.org/reports/world-energy-outlook-2024

International Energy Agency. (2024b). World energy balances—Data product. Link to source: https://www.iea.org/data-and-statistics/data-product/world-energy-balance

International Renewable Energy Agency. (2025). Renewable power generation costs in 2024. Link to source: https://www.irena.org/-/media/Files/IRENA/Agency/Publication/2025/Jul/IRENA_TEC_RPGC_in_2024_2025.pdf 

International Renewable Energy Agency. (2026). Renewable power generation costs in 2025. Link to source: https://www.irena.org/-/media/Files/IRENA/Agency/Publication/2026/Jul/IRENA_TEC_RPGC_in_2025_2026.pdf

Intergovernmental Panel on Climate Change. (2023). Climate change 2023: Synthesis report. Contribution of Working Groups I, II and III to the Sixth Assessment Report of the Intergovernmental Panel on Climate Change (Core Writing Team, H. Lee, & J. Romero, Eds.). Link to source: https://doi.org/10.59327/IPCC/AR6-9789291691647. 

Jung, D., Gareis, G. H., Staiger, A., & Salmon, A. (2022). Effects of soiling on agrivoltaic systems: Results of a case study in Chile. AIP Conference Proceedings, 2635(1), 020001. Link to source: https://doi.org/10.1063/5.0107943

Keiner, D., Walter, L., Bogdanov, D., Peters, I. M., & Breyer, C. (2025). Assessing the impact of bifacial solar photovoltaics on future power systems based on capacity-density-optimised power plant yield modelling. Solar Energy, 295, 113543. Link to source: https://doi.org/10.1016/j.solener.2025.113543

Laub, M., Pataczek, L., Feuerbacher, A., Zikeli, S., & Högy, P. (2022). Contrasting yield responses at varying levels of shade suggest different suitability of crops for dual land-use systems: A meta-analysis. Agronomy for Sustainable Development, 42(3), 51. Link to source: https://doi.org/10.1007/s13593-022-00783-7

Lytle, W., Meyer, T. K., Tanikella, N. G., Burnham, L., Engel, J., Schelly, C., & Pearce, J. M. (2021). Conceptual design and rationale for a new agrivoltaics concept: Pasture-raised rabbits and solar farming. Journal of Cleaner Production, 282, 124476. Link to source: https://doi.org/10.1016/j.jclepro.2020.124476

Mamun, M. A. A., Dargusch, P., Wadley, D., Zulkarnain, N. A., & Aziz, A. A. (2022). A review of research on agrivoltaic systems. Renewable and Sustainable Energy Reviews, 161, 112351. Link to source: https://doi.org/10.1016/j.rser.2022.112351

Macknick, J., Hartmann, H., Barron-Gafford, G., Beatty, B., Burton, R., Seok-Choi, C., Davis, M., Davis, R., Figueroa, J., Garrett, A., Hain, L., Herbert, S., Janski, J., Kinzer, A., Knapp, A., Lehan, M., Losey, J., Marley, J., MacDonald, J., … Walston, L. (2022). The 5 Cs of agrivoltaic success factors in the United States: Lessons from the InSPIRE research study (Report No. TP-6A20-83566). National Renewable Energy Laboratory. Link to source: https://doi.org/10.2172/1882930

Mahim, T. M., Rahman, M. M., & Huda, A. S. N. (2026). Review of the challenges and prospects in agrivoltaics. Advanced Energy and Sustainability Research, 7(1), e202500227. Link to source: https://doi.org/10.1002/aesr.202500227

Maia, A. S. C., Culhari, E. D. A., Fonsêca, V. D. F. C., Milan, H. F. M., & Gebremedhin, K. G. (2020). Photovoltaic panels as shading resources for livestock. Journal of Cleaner Production, 258, 120551. Link to source: https://doi.org/10.1016/j.jclepro.2020.120551

Malu, P. R., Sharma, U. S., & Pearce, J. M. (2017). Agrivoltaic potential on grape farms in India. Sustainable Energy Technologies and Assessments, 23, 104–110. Link to source: https://doi.org/10.1016/j.seta.2017.08.004

Masson, G., l’Epine, M. de, & Kaizuka, I. (2024). Trends in PV applications 2024. IEA PVPS. Link to source: https://iea-pvps.org/trends_reports/trends-in-pv-applications-2024/

McCall, J., Staie, B., Carron, W., & Jamison, J. (2024). Initial feasibility assessment of agrivoltaics in Jackson County, IL (Report No. TP-6A20-88816). National Renewable Energy Laboratory. Link to source: https://doi.org/10.2172/2335896

Mehedi, T. H., Gemechu, E., & Kumar, A. (2022). Life cycle greenhouse gas emissions and energy footprints of utility-scale solar energy systems. Applied Energy, 314, 118918. Link to source: https://doi.org/10.1016/J.APENERGY.2022.118918

Millstein, D., Wiser, R., Bolinger, M., & Barbose, G. (2017). The climate and air-quality benefits of wind and solar power in the United States. Nature Energy, 2(9), Article 17134. Report #: ARTN 17134. Link to source: http://dx.doi.org/10.1038/nenergy.2017.134

Millstein, D., O’Shaughnessy, E., & Wiser, R. (2024). Climate and air quality benefits of wind and solar generation in the United States from 2019 to 2022. Cell Reports Sustainability, 1(6), 100105. Link to source: https://doi.org/10.1016/j.crsus.2024.100105

Montedonico, M., Pando, D., Santillán, V. A., Guevara, M. Á., Salazar, K. P., Mezzomo, W., Butrón, N., Solís, N., & Díaz, A. (2026). Perspectivas De La Energía Agrivoltaica En América Latina. Link to source: https://ideathinktank.org.mx/wp-content/uploads/2026/03/DocumentoTecnico_PerspectivasDeLaAgrovoltaicaEnAmericaLatina.pdf

 Morash, J. D., & Pavao-Zuckerman, M. (2026). Regional dynamics of agrivoltaics adoption: Stakeholder perceptions and barriers in Maryland, USA. Energy Policy, 210, 115066. Link to source: https://doi.org/10.1016/j.enpol.2025.115066

National Renewable Energy Laboratory. (2021). Life Cycle Greenhouse Gas Emissions from Electricity Generation: Update. Link to source: https://docs.nlr.gov/docs/fy21osti/80580.pdf

National Laboratory of the Rockies. (2024, November 21). Lighting the Way for Agrivoltaics: How NREL Empowers Communities To Capture the Benefits of Solar Energy, Agriculture, and Ecosystems | NLR. Link to source: https://www.nlr.gov/news/feature/2024/lighting-the-way-for-agrivoltaics

Pandey, G., Lyden, S., Franklin, E., Millar, B., & Harrison, M. T. (2025). A systematic review of agrivoltaics: Productivity, profitability, and environmental co-benefits. Sustainable Production and Consumption, 56, 13–36. Link to source: https://doi.org/10.1016/j.spc.2025.03.006

Pascaris, A. S., Schelly, C., Burnham, L., & Pearce, J. M. (2021). Integrating solar energy with agriculture: Industry perspectives on the market, community, and socio-political dimensions of agrivoltaics. Energy Research & Social Science, 75, 102023. Link to source: https://doi.org/10.1016/j.erss.2021.102023

Patel, U., Gadhiya, G., & Chauhan, P. (2023). Case Study on Power Generation from Agrivoltaic System in India. International Journal of Environment and Climate Change, 13, 1447–1454. Link to source: https://doi.org/10.9734/IJECC/2023/v13i92375

Pehl, M., Arvesen, A., Humpenöder, F., Popp, A., Hertwich, E. G., & Luderer, G. (2017). Understanding future emissions from low-carbon power systems by integration of life-cycle assessment and integrated energy modelling. Nature Energy 2017 2:12, 2(12), 939–945. Link to source: https://doi.org/10.1038/s41560-017-0032-9

Pincelli, I. P., Hinkley, J., & Brent, A. (2024). Carbon, materials and energy footprint of a utility-scale solar plant in Aotearoa New Zealand. Solar Energy, 273, 112535. Link to source: https://doi.org/10.1016/J.SOLENER.2024.112535

Scarano, A., Curci, L. M., Semeraro, T., Calisi, A., Lenucci, M. S., Santino, A., Basset, A., & De Caroli, M. (2025). Agrivoltaics as a sustainable strategy to enhance food security under water scarcity. Horticulturae, 11(4), 401. Link to source: https://doi.org/10.3390/horticulturae11040401 

Seay-Fleming, C., Swanson, T., Gerlak, A. K., Pavao-Zuckerman, M. A., Andrews, H., Moore, K., & Barron-Gafford, G. A. (2025). Cultivating engagement: Public participation in agrivoltaics planning and design. Energy Research & Social Science, 127, 104273. Link to source: https://doi.org/10.1016/j.erss.2025.104273

Smith, B. L., Sekar, A., Mirletz, H., Heath, G., & Margolis, R. (2024). An updated life cycle assessment of utility-scale solar photovoltaic systems installed in the United States. Link to source: https://www.nrel.gov/docs/fy24osti/87372.pdf

Smith, M. (2024). Dual-use solar photovoltaics: Emerging applications and issues for congress (No. R48197). Congressional Research Service. Link to source: https://www.congress.gov/crs-product/R48197

Sojib Ahmed, M., Rezwan Khan, M., Haque, A., & Ryyan Khan, M. (2022). Agrivoltaics analysis in a techno-economic framework: Understanding why agrivoltaics on rice will always be profitable. Applied Energy, 323, 119560. Link to source: https://doi.org/10.1016/j.apenergy.2022.119560

Solar Power Europe. (2024a). Agrisolar handbook. Link to source: https://www.solarpowereurope.org/insights/thematic-reports/agrisolar-handbook-1

Solar Power Europe. (2024b). New agrisolar digital map presents over 200 projects across Europe—SolarPower Europe. Link to source: https://www.solarpowereurope.org/press-releases/new-agrisolar-digital-map-presents-over-200-projects-across-europe

Sorensen, A., Nogeire, T., & Hunter, M. (2022). Potential placement of utility-scale solar installations on agricultural lands in the U.S. to 2040. American Farmland Trust. Link to source: https://farmlandinfo.org/wp-content/uploads/sites/2/2023/03/AFT_FUT2040-solar-white-paper.pdf

Suri, D., de Chalendar, J. & Azevedo, I.M.L. (2025). Assessing the real implications for CO2 as generation from renewables increases. Nature Communications, 16, Article 7124. Link to source: https://doi.org/10.1038/s41467-025-59800-4

Swanson, T., Seay-Fleming, C., Gerlak, A. K., & Barron-Gafford, G. A. (2025). “Enough is enough, we like our farms”: The role of landscape ideology in shaping perceptions of solar energy and agrivoltaics in the rural American Southwest. Journal of Rural Studies, 114, 103572. Link to source: https://doi.org/10.1016/j.jrurstud.2025.103572

Trommsdorff, M., Kang, J., Reise, C., Schindele, S., Bopp, G., Ehmann, A., Weselek, A., Högy, P., & Obergfell, T. (2021). Combining food and energy production: Design of an agrivoltaic system applied in arable and vegetable farming in Germany. Renewable and Sustainable Energy Reviews, 140, 110694. Link to source: https://doi.org/10.1016/j.rser.2020.110694

Trommsdorff, M., Campana, P. E., Macknick, J., Fernández Solas, A., Gorjian, S., & Tsanakas, I. (2025). Dual Land Use for Agriculture and Solar Power Production: Overview and Performance of Agrivoltaic Systems. International Energy Agency Photovoltaic Power Systems Programme. Link to source: https://doi.org/10.69766/XAEU5008

United Nations Conference on Trade and Development UNCTAD. (2023, October 4). Italy—Adopts €2.61 billion schemes to support agrivoltaic energy production and agro-industrial development | Investment Policy Monitor | UNCTAD Investment Policy Hub. Link to source: https://investmentpolicy.unctad.org/investment-policy-monitor/measures/4543/italy-adopts-2-61-billion-schemes-to-support-agrivoltaic-energy-production-and-agro-industrial-development

U.S. Department of Energy. (n.d.). Solar photovoltaic system cost benchmarks. Energy.Gov. Retrieved March 11, 2026, from  Link to source: https://www.energy.gov/eere/solar/solar-photovoltaic-system-cost-benchmarks

Walsh, K. B., Stedman, R., & Kay, D. (2026). Imagining agrivoltaics: Farmer expectations for co-locating solar energy and agricultural production in Western New York. Energy Research & Social Science, 137, 104789. Link to source: https://doi.org/10.1016/j.erss.2026.104789

Walston, L. J., Mishra, S. K., Hartmann, H. M., Hlohowskyj, I., McCall, J., & Macknick, J. (2018). Examining the potential for agricultural benefits from pollinator habitat at solar facilities in the United States. Environmental Science & Technology, 52(13), 7566–7576. Link to source: https://doi.org/10.1021/acs.est.8b00020

Williams, H. J., Wang, Y., Yuan, B., Wang, H., & Zhang, K. M. (2025). Rethinking agrivoltaic incentive programs: A science-based approach to encourage practical design solutions. Applied Energy, 377, 124272. Link to source: https://doi.org/10.1016/j.apenergy.2024.124272

Williams, H. J., Wang, Y., & Zhang, K. M. (2024, June). Advantages and disadvantages of vertical solar racking for agrivoltaic systems. World Agrivoltaics Conference. Link to source: https://www.osti.gov/biblio/25305

Yeligeti, M., Hu, W., Scholz, Y., Stegen, R., & von Krbek, K. (2023). Cropland and rooftops: The global undertapped potential for solar photovoltaics. Environmental Research Letters, 18(5), 054027. Link to source: https://doi.org/10.1088/1748-9326/accc47

Zhang, X., & Ma, X. (2026). Vectorized agrivoltaics dataset in China from 2010 to 2022. Scientific Data, 13(1), 116. Link to source: https://doi.org/10.1038/s41597-025-06305-w

Zubi, G., Parag, Y., & Wald, S. (2024). Implications of large-scale PV integration on grid operation, costs, and emissions: Challenges and proposed solutions. Energies 2025, Vol. 18, Page 130, 18(1), 130. Link to source: https://doi.org/10.3390/EN18010130 

Credits

Lead Fellow

  • Al-Amin Bugaje, Ph.D.

Contributors

  • Ruthie Burrows, Ph.D.

  • James Gerber, Ph.D.

  • Daniel Jasper

  • Alex Sweeney

Internal Reviewers

  • Amanda D. Smith, Ph.D.

  • Christina Swanson, Ph.D.

  • Megan Matthews, Ph.D.

Effectiveness

We estimate that agrivoltaics reduces GHG emissions by 720 t CO₂‑eq /MW/yr (730 t CO₂‑eq /MW/yr, 20-year basis) (Table 1). This assumes that newly installed agrivoltaics displace an equivalent MWh of the 2023 global electricity grid mix (estimated at 530 kg CO₂‑eq /MWh (540 kg CO₂‑eq /MWh, 20-year basis; IEA, 2024b; see Methodology: Appendix A for calculation details). We used a median capacity factor of 15% based on country-level estimates (Ember, 2024; Ferreira Junior et al., 2025; McCall et al., 2024; Patel et al., 2023; Williams et al., 2024) to convert annual emissions reductions from per MWh to per MW installed capacity. 

Actual avoided emissions will depend on local grid conditions and the specific power sources displaced (see Methodology: Appendix A). Studies in the U.S. show that from 2007–2015, solar deployment avoided approximately 0.5 t CO₂ /MWh (613 t CO₂ /MW/yr; Millstein et al., 2017) emissions, and a 15% increase in deployment avoided 8.54 Mt CO₂ /yr (Biswas et al., 2025). 

Although solar PV emits negligible GHGs during operations, emissions arise during manufacturing, transportation, installation, maintenance, and decommissioning. However, these embodied emissions are paid back in approximately 1–2 yr (Badza et al., 2023; M. Ahmad et al., 2023; Mehedi et al., 2022; Pincelli et al., 2024; Smith et al., 2024). While total life-cycle emissions remain far below those of fossil fuels (National Renewable Energy Laboratory [NREL], 2021; Smith et al., 2024), decarbonizing industrial supply chains is essential to maximize climate impact (Pehl et al., 2017). In our analysis, we focused solely on emissions avoided during electricity generation. Carbon payback time, embodied life-cycle emissions, and on-farm agricultural emissions from ruminant grazing were excluded from the effectiveness and climate impact estimates. 

Table 1. Effectiveness at reducing emissions. 

Unit: t CO₂‑eq /MW/yr, 100-yr basis

Estimate 720
Left Text Column Width
Cost

We estimated a mean levelized cost of electricity (LCOE) for agrivoltaics of US$69/MWh based on industry reports and journal articles (Bhatta et al., 2025; Fraunhofer ISE, 2024; Gadhiya & Chakraborty, 2025; Hwang & Lee, 2024; Sojib Ahmed et al., 2022; U.S. Department of Energy [U.S. DOE], n.d.; see Methodology: Appendix A for details). LCOE values represent the average cost of producing one MWh of electricity over the operational lifetime of a power plant, allowing investors to compare their expected revenue to a standard set of costs. This cost metric has been used by international agencies for cost comparison across generation technologies, incorporating installed capital costs, operation and maintenance, project lifespan, and energy output. The agrivoltaics LCOE describes costs to utility-scale generators and does not include agricultural output.

The LCOE for agrivoltaics is generally higher than that for utility-scale solar PV (Trommsdorff et al., 2025), due to higher capital expenditure requirements for overhead configurations and specialized partially see-through PV modules. However, agrivoltaics has a lower LCOE than distributed solar PV. For instance, a study conducted by the U.S. DOE (n.d.) showed that the LCOE of distributed solar PV was US$142/MWh (0.006 MWdc system) compared to agrivoltaics’ US$75/MWh (3 MWdc system). In the same study, a 100 MWdc utility-scale solar PV had an LCOE of US$47/MWh. These costs do not consider any subsidies or revenue. 

In practice, revenues and costs will vary based on the ownership model structure. In developer-owned models, farmers receive fixed lease payments of US$250–2,500 per acre, while the solar provider bears the up-front cost (Daniels, 2022; Trommsdorff et al., 2025). In farmer-owned models, the farmers incur the initial investment burden and generate revenue by selling power to the grid or reducing their on-farm energy bills (Pandey et al., 2025).

Methods and Supporting Data

Learning Curve

Agrivoltaics does not have an empirically derived learning rate. The technology has only scaled meaningfully since the early 2010s, and its configurations vary too widely for a clean cost reduction curve to be fitted to the data. However, agrivoltaics is built from several existing technologies with well-understood learning dynamics. 

We estimated the current global learning rate for module costs at about 34% (DNV, 2024; Masson, 2024). This high rate is heavily influenced by the accelerated growth of solar PV from 2012–2022; however, this number comes down over a longer period of time. Projections suggest it will slow to around 17% by 2050 as cost components stabilize and the largest gains from scaling are realized (DNV, 2024). Because agrivoltaic systems draw their modules from the same global supply chain as any other solar PV project, we expect that they inherit this curve directly.

What distinguishes agrivoltaics economically from utility-scale solar PV is the cost premium of its elevated or specialized mounting structures, more complex permitting, dual-use legal frameworks, and crop-specific engineering (Trommsdorff et al., 2025). These components follow slower learning curves than electronics, constrained by manufacturing scale-up and standardization of elevated racking/tracking systems. However, hardware innovations such as vertical bifacial or open-source designs, module reuse from decommissioned plants, and policy incentives (feed-in tariffs, grants, regulatory clarity) have potential to accelerate deployment and cross-sector learning (Pandey et al., 2025). 

Speed of Action

Speed of action refers to how quickly a climate solution physically affects the atmosphere after it is deployed. This is different from speed of deployment, which is the pace at which solutions are adopted.

At Project Drawdown, we define the speed of action for each climate solution as emergency brake, gradual, or delayed.

Deploy Agrivoltaics is a GRADUAL climate solution. It has a steady, linear impact on the atmosphere. As installed capacity of agrivoltaics increases over time, emissions from electricity generation are expected to decrease assuming solar PV displaces fossil fuel sources.

Caveats

Implementing agrivoltaics requires careful site and crop selection to avoid unintended consequences. In temperate climates, excessive shading can reduce yields of shade-intolerant crops such as wheat, corn, and tomatoes (Pandey et al., 2025). Significant yield declines may displace food production to other land, triggering land conversion and emissions that offset climate gains (Agostini et al., 2021; Wagner et al., 2023). The greatest benefits occur when agrivoltaics is deployed on marginal or low-productivity farmland, where dual-use systems can improve efficiency up to 200% without compromising high yield agriculture (Pandey et al., 2025). 

Farming activities also increase panel soiling from dust, pollen, or harvest residue, necessitating frequent maintenance to prevent energy losses, especially in arid or high-wind regions (Campana et al., 2025; Chirinda et al., 2024; Jung et al., 2022).

We acknowledge the partial overlap of agrivoltaics with utility-scale and distributed solar PV estimates; to avoid double-counting capacity, we treat it as a complementary pathway that expands solar adoption while mitigating land-use competition (Sorensen et al., 2022; Smith, 2024). Policy frameworks that differentiate dual-use systems through incentives, performance standards, or land-use regulations will determine the extent of overlap (Pandey et al., 2025). While proximity to the grid is essential, deployment is limited by transmission capacity and interconnection queue delays (Campana et al., 2025). Large utility-scale projects often face multi-year queues to connect to regional grids, with transmission costs sometimes approaching 50–100% of total project costs (Daniels, 2023; Macknick et al., 2022)

Our assessment assumed that each additional MWh from agrivoltaics displaces an equivalent MWh of the existing grid mix. In reality, avoided emissions vary by regional grid dynamics, marginal generation sources, and the timing and location of production. New solar generation can sometimes displace other renewables rather than fossil-based sources, especially in grids with high existing renewable, nuclear, or geothermal capacity (Baik et al., 2021; Suri et al., 2025). Because agrivoltaics is constrained to agriculturally suitable land – which is unevenly distributed globally – the degree to which these dynamics affect emissions reductions will vary by region. 

Current Adoption

As of 2023, the global installed capacity for agrivoltaics reached approximately 140,000 MW (Table 2). China leads global adoption, accounting for roughly 91% of this estimated total. The U.S. represents 8.4%, while Europe accounts for the remainder (Masson et al., 2024; Solar Power Europe, 2024b; Zhang & Ma, 2026). 

Table 2. Current adoption level (2023).

Unit: MW installed capacity

Estimate 140,000
Left Text Column Width

We estimated this global capacity by aggregating data from industry reports, journal papers, and public datasets across these three regions. However, tracking remains challenging because agrivoltaics deployment estimates partially overlap with utility-scale and distributed solar PV totals. Existing databases often count dual-use projects within broader solar capacity figures, particularly when configurations resemble conventional solar PV systems (Daniels, 2023; Smith, 2024; Sorensen et al., 2022; Trommsdorff et al., 2025). The precise degree of overlap cannot yet be quantified, but developers increasingly adopt dual-use designs to minimize land-use conflict (Campana et al., 2025; Masson et al., 2024; Trommsdorff et al., 2025). While agrivoltaics adoption is present in other regions (e.g., Japan, South Korea, and India), consistent and credible datasets to estimate accurate current adoption and growth trends are limited. Consequently, this estimate likely underestimates current global adoption. 

Adoption Trend

Figure 2: Estimated global adoption of agrivoltaics, 2010–2023 (Zhang & Ma, 2026; Agrivoltaics Map, n.d.)

Enable Download
On

We estimated the median global adoption trend for agrivoltaics at 9,800 MW/yr of additional installed capacity (Table 3) by summing regional adoption values for each year from 2010–2023 and taking the year-to-year difference. Because this analysis relied primarily on data from China and the U.S., the results reflect a geographic distribution skewed toward these leading markets. 

Table 3. Adoption trend (2010–2023).

Unit: MW installed capacity/yr

25th percentile 2300
Mean 9400
Median (50th percentile) 9800
75th percentile 15000
Left Text Column Width

Estimated global agrivoltaics capacity grew roughly 200-fold from 580 MW in 2010 to approximately 140,000 MW in 2023 (Figure 2). While agrivoltaics adoption is still in its early stages – with global installed capacity roughly five times lower than distributed solar PV and seven times lower than utility-scale solar PV – growth is expected to accelerate. Supportive policies in pioneer regions such as Europe, China, Japan, and Korea have driven recent expansion. These policies address both the need for clean energy and the rising climate stresses on farmlands, including heat and drought (Trommsdorff et al., 2025). 

Market momentum has also strengthened over the past decade. From 2010–2015, global agrivoltaics added an average of about 4,100 MW/yr. Post 2015, that rate jumped to around 14,000 MW/yr, fueled by targeted incentives. For instance, agrivoltaics capacity in the United States. more than doubled from 2020–2024 (National Laboratory of the Rockies [NLR], 2024). In Italy, the government launched a competitive bidding process in 2023 to award contracts and funding for 500 MW of agrivoltaics projects (Masson et al., 2024); the country aims to reach 1,000 MW of capacity by 2026 (United Nations Conference on Trade and Development [UNCTAD], 2023). We expect that continued cost declines of elevated structures and bifacial modules and improved profitability (Pandey et al., 2025; Keiner et al., 2025) will drive future adoption.

Adoption Ceiling

We estimated the median technical potential for agrivoltaics to arrive at an adoption ceiling of 250 million MW of installed capacity (Table 4). We determined the adoption ceiling for agrivoltaics by considering the global technical potential of solar PV and the availability of cropland or grazing land suited to shading (Yeligeti et al., 2023).

Table 4. Adoption ceiling.

Unit: MW installed capacity

25th percentile 230,000,000
Mean 250,000,000
Median (50th percentile) 250,000,000
75th percentile 270,000,000
Left Text Column Width

Cropland accounts for only one-third of total agricultural land (Food and Agricultural Organization [FAO], 2023) and global estimates for agrivoltaics across cropland vary depending on assumptions about crop suitability, panel density, and grid access. A global suitability assessment of 18 major crops found approximately 4.64 million km² (464 million ha) of cropland suitable for agrivoltaics in an optimistic scenario, corresponding to a maximum installable capacity of around 217 million MW (Yeligeti et al., 2023). This technological ceiling aligns closely with the analysis of Campana et al. (2025), which projects annual electricity output of 385 PWh (≈ 284 million MW/yr). These optimistic figures assume favorable policy environments, technological advancement in panel design, financing, grid proximity and availability, and adoption of shade-tolerant crop varieties.

Despite the abundant 1.6 billion ha of global arable land (Chirinda et al., 2024), the adoption ceiling is unlikely to be reached due to other constraints (Yeligeti et al., 2023). Considerations for technoeconomic, political, and social effects, including land use changes, economic value of land, and shading effect, determine the actual upper limit for adoption. 

Achievable Adoption

In the low achievable scenario, agrivoltaics is projected to grow more than 20-fold, from 140,000 MW in 2023 to 2.5 million MW in 2050 (Table 5). This scenario accounts for real-world constraints, including fragmented land tenure, uneven grid access, regulatory barriers, and high up-front costs.

Table 5. Range of achievable adoption levels.

Unit: MW installed capacity

Current adoption 140,000
Achievable – low 2,500,000
Achievable – high 5,600,000
Adoption ceiling 250,000,000
Left Text Column Width

In the high achievable scenario, agrivoltaics is projected to grow more than 40-fold, from 140,000 MW in 2023 to 5.6 million MW in 2050 (Table 5). This scenario assumes the continuation of supportive government policies, with adoption primarily constrained by transmission availability. 

We estimated the achievable adoption ranges from scenarios reflecting technical limits (Campana et al., 2025; Yeligeti et al., 2023). These scenarios combine crop suitability and geospatial analysis to estimate annual potential electricity supply from agrivoltaics, constrained by electricity infrastructure. We then applied a mean scaling factor of 9.2% from previous work (Beck et al., 2012; Christ & Wagner, 2025; Trommsdorff et al., 2024) to convert these potential estimates to realizable scenarios. This scaling aligns with historical patterns and complementary international assessments.

Our low and high achievable scenarios fall within the observed market trends, reflecting a still nascent industry with significant but unevenly distributed growth potential.

Beyond the technical and financial considerations, achievable adoption is shaped and often superseded by non-quantitative social forces, where cultural norms, agricultural heritage, and local traditions fundamentally shape stakeholder acceptance (Asa’a et al., 2024; Walsh et al., 2026). Rural residents can perceive solar infrastructure as an industrial intrusion that is incompatible with the pastoral identity and landscape ideology of their communities (de Falco et al., 2025; Mahim et al., 2026; Morash & Pavao-Zuckerman, 2026; Swanson et al., 2025;). If agrivoltaics is framed merely as a technological fix without regard for these cultural values, it can lead to a social gap where broad societal approval for renewables fails to translate into local project success (Pascaris et al., 2021; Walsh et al., 2026).

The achievable adoption range of 2.5–5.6 million MW represents approximately 1–2.3% of the adoption ceiling of 250 million MW. The current adoption is roughly 0.06% of that ceiling. 

The current estimated climate impact of agrivoltaics is approximately 0.1 Gt CO₂‑eq/yr of reduced emissions (Table 6), based on 140,000 MW of global installed capacity and effectiveness of 720 t CO₂‑eq /MW/yr.

Table 6. Climate impact at different levels of adoption.

Unit: Gt CO₂‑eq/yr, 100-yr basis

Current adoption 0.1
Achievable – low 1.80
Achievable – high 4.10
Adoption ceiling 180
Left Text Column Width

Under the low achievable adoption scenario (2.5 million MW), annual emissions reductions could grow to about 1.8 Gt CO₂‑eq/yr.  

In the high achievable scenario (5.6 million MW), reductions could reach approximately 4.1 Gt CO₂‑eq/yr.  

We based the adoption ceiling solely on the technical potential of agrivoltaics, while neglecting social and economic constraints and realistic scenarios of future power demand. The electricity sector in 2023 emitted 15.6 Gt CO₂ ‑eq (International Energy Agency [IEA], 2024b); therefore, even if agrivoltaics could meet all current electricity demand, emissions reductions could not surpass this value without increased demand. Consequently, agrivoltaic systems are unlikely to reach 250 million MW of installed capacity in the next 100 years. But if current grid emissions were to remain constant while capacity increases, GHG emission reductions would be approximately 180 Gt CO₂ ‑eq/yr. This maximum is unrealistic as a forward-looking climate impact because it treats grid carbon intensity as permanently fixed at 2023 levels and ignores future decarbonization and corresponding decreases in marginal avoided emissions. Real-world climate impacts will depend on not only grid decarbonization and policy support, but also on system design choices and regional agricultural contexts.

By using only 1% of global agricultural land, agrivoltaics could offset 21 PWh/yr of electricity demand, equivalent to global electricity consumption in 2019 (Adeh et al., 2019). Even as demand grows, reaching ~29 PWh in 2023 (Ember, n.d.), the opportunity remains massive. 

Additional Benefits

Heat Stress

Daytime air temperatures surrounding agrivoltaics are lower than traditional utility PV systems that are usually installed over gravel (Pandey et al., 2025). This cooling effect is mostly attributed to evapotranspiration from the crops underneath PV panels (Barron-Gafford et al., 2019). 

Income and Work

Agrivoltaics can diversify income sources for farmers (Campana et al., 2025) by allowing them to export excess power to the grid to generate revenue (Dinesh & Pearce, 2016; Trommsdorff et al., 2025). PV revenue often outweighs revenue from agriculture (Malu et al., 2017; Lytle et al., 2021). Because agrivoltaics are more expensive to install than traditional PV systems, they are often installed at larger scales on larger farms (Campana et al., 2025). In these cases, the income and revenue benefits may be shared between the farmer and a third-party investor. 

New roles in installation, maintenance, and agrivoltaics management also create rural employment opportunities, particularly in regions where energy poverty and food insecurity overlap (Chirinda et al., 2024).

Food Security

Because agrivoltaics lower daytime temperatures, they can increase yields of crops that are sensitive to high temperatures, such as fruits and seed-bearing vegetables (Scarano et al., 2025). This is especially pertinent to drought-prone areas, where agrivoltaics have been shown to increase crop yields in water-stressed systems. For example, a study of crop yields in semi-arid southwestern United States found that yields of peppers and cherry tomatoes were double in agrivoltaic systems relative to those under traditional agriculture (Barron-Gafford, 2019). In addition to shade, agrivoltaic systems can protect crops from weather events such as hail and wind (Pandey et al., 2025). Agrivoltaic fields can also be used for livestock grazing, such as cattle and sheep, maintaining meat and dairy production on solar land while panel shading relieves animal heat stress and improves forage digestibility (Andrew et al., 2021).

Energy Availability

The efficiency of PV panels starts to decrease as cell temperatures rise above 25 °C (Chirinda et al., 2024). The cooler temperatures surrounding agrivoltaic systems can increase electricity production per panel (Adeh et al., 2019). In many environments, vegetation below the PV panels provides a cooling effect that boosts annual electricity output by 1–3% (Barron-Gafford et al., 2019).

Health

Solar PV reduces the emission of pollutants such as nitrogen oxides, sulfur dioxide, and PM2.5 from fossil-fuel energy generation (Abel et al., 2018; Millstein et al., 2024; Millstein et al., 2017; Wiser et al., 2016). This offers health benefits, including reduced premature mortality. The magnitude and distribution of these benefits depend on the local electricity grid mix, the fuels used to generate electricity, and atmospheric conditions that determine how far pollutants travel (Buonocore et al., 2019). Regions with a higher proportion of coal-powered electricity generation will often see more health benefits (Buonocore et al., 2019). Pollutants can travel long distances after they are emitted, so air pollution benefits can be widespread (Millstein et al., 2024).

These health benefits often translate into cost savings associated with reductions in hospital admissions, improved respiratory and cardiovascular conditions, and work and school days that might have otherwise been missed due to illness (Millstein et al., 2017; Wiser et al., 2016).

Nature Protection

Agrivoltaic systems that integrate pollinator-friendly habitats can increase pollination and may even increase crop yields in surrounding farmland (Macknick 2022; Walston et al., 2018).

Animal Well-being

Shade from the panels can relieve heat stress for livestock when temperatures are high (Maia et al., 2020; Carvalho Fonsêca et al., 2023) 

Land Resources

Agrivoltaics can help avoid land use conflicts because the PV panels are placed on land already used for agriculture (Swanson et a., 2025). 

Water Resources

Agrivoltaics may reduce water use up to 50% compared to traditional agricultural systems (Scarano et al., 2025). Reduced solar radiation from shading can reduce soil evaporation rates and enhance water savings for crops (Amaducci et al., 2018). Additionally, water used to clean panels and suppress dust can be reused for irrigation (Patel et al., 2019 ).

Air Quality

For air quality benefits, please refer to the “health” section. 

Risks

Large-scale rollout of agrivoltaics carries several risks. Rapid deployment without adequate storage, grid flexibility, or transmission can elevate curtailment rates. This undermines financial returns and emissions reductions, creating financial risks from high solar deployment and integration (Firoozi et al., 2025; Zubi et al., 2024). Higher up-front capital requirements also expose farmers and developers to revenue risk if crop yields decrease or electricity prices fluctuate (Campana et al., 2025). These financial risks can be mitigated with policy levers, including carbon taxes, though different levers are needed at different adoption levels (Brown & Reichenberg, 2021). 

Lack of regulatory clarity regarding dual-use land may stall adoption (Campana et al., 2025). This lack of legal status often leads to reclassification of agricultural land to energy or industrial use, creating ambiguity over property-tax rates and potentially triggering farmland occupation taxes (Chirinda et al., 2024). Furthermore, reclassification can result in the loss of agricultural subsidies, such as the European Union’s Common Agricultural Policy (CAP) payments, and jeopardize eligibility for crop insurance programs (Smith, 2024; Trommsdorff et al., 2025). Without a clear regulatory framework to differentiate agrivoltaics from standard ground-mounted solar, conflicting goals between energy and agricultural ministries can cause substantial administrative delays and financial uncertainty (Chirinda et al., 2024). 

Agricultural and environmental risks include soil compaction from construction and machinery traffic, reducing infiltration, root growth, and long-term soil fertility. This effect is amplified where heavy equipment must navigate under elevated panels (Campana et al., 2025; Chirinda et al., 2024). Poorly managed end-of-life PV components also risk chemical pollution (Chirinda et al., 2024). 

Finally, social and distributive justice risks can impede adoption. Visual landscape impacts and inequitable benefit-sharing between energy developers and tenant farmers can spark opposition and erode community support. The potential displacement of tenant farmers is a major socioeconomic risk (Campana et al., 2025; Chirinda et al., 2024). Because solar developers offer lease rates that significantly outbid traditional agricultural rents, landowners are increasingly incentivized to prioritize energy production over farming (Morash & Pavao-Zuckerman, 2026 Sorensen et al., 2022; Swanson et al., 2025). Furthermore, high solar leases can drive up overall land prices, making it difficult for new or disadvantaged farmers to access land (Morash & Pavao-Zuckerman, 2026). Without inclusive participatory processes and clear land use agreements, agrivoltaics expansion risks eroding social cohesion and economic viability of the farming communities it is intended to sustain (Campana et al., 2025; Trommsdorff et al., 2025). Ensuring that projects reflect local values, such as community stewardship over simple ownership, is crucial to mitigating the risk of eroding social cohesion of agricultural communities (Seay-Fleming et al., 2025; Trommsdorff et al., 2025).

Interactions with Other Solutions

Reinforcing

The microclimate effects of agrivoltaics can reduce the volume of water required to achieve equivalent crop yields, amplifying the impact of farm-level irrigation efficiency improvements. Electricity generated by solar PV can power irrigation pumps.

By reducing evapotranspiration and moderating temperate and water stress on crops, agrivoltaic systems can reduce agricultural water demand. In water-stressed and arid regions, this interaction can improve food system resilience.

Increased availability of renewable energy from agrivoltaics helps reduce emissions from the electricity grid as a whole. Reduced emissions from the electricity grid lead to lower downstream emissions for solutions that rely on electricity use. Deploying agrivoltaics also supports increased integration of wind power technologies by diversifying the renewable energy mix and reducing exposure to wind variability.

Electrification of transportation systems will be more beneficial in reducing global emissions if the underlying grid includes a higher proportion of non-emitting power sources. Electric transportation systems can also reduce curtailment of solar energy through controlled-time charging and other load-shifting technologies.

Competing

Since wind and solar can generate electricity at the same times of day, deploying agrivoltaics could create competition for grid connections, lower daytime electricity revenues, and suppress adoption of additional wind power.

Use of agricultural land for dedicated bioenergy crop production represents a competing land use, albeit agrivoltaics may offer higher combined energy and food productivity per hectare.

Widespread agrivoltaic deployment on high irradiance agricultural land could reduce the land base available for utility-scale concentrated solar in regions where both are technically viable, albeit the two solutions target different land type and scales.

Consensus
Dashboard

Solution Basics

MW installed capacity

t CO₂-eq (100-yr)/unit/yr
720
units
Current 140,000 02.5×10⁶5.6×10⁶
Achievable (Low to High)

Climate Impact

Gt CO₂-eq (100-yr)/yr
Current 0.1 1.84.1
Gradual

CO₂ , CH₄, N₂O

Trade-offs

Agrivoltaics may involve an inherent trade-off between agricultural productivity and energy conversion efficiency. Well-sited and properly designed systems typically cause no significant declines in agricultural productivity and can even stabilize or increase biomass production in certain conditions (Pandey et al., 2025). Poorly designed systems, however, can underperform both stand-alone agriculture and stand-alone PV on key sustainability metrics (Campana et al., 2025; Trommsdorff et al., 2025).

Elevated panels require extra steel and aluminum, increasing embodied emissions by roughly 20% compared with utility-scale solar PV (Busch & Wydra, 2023). These embodied emissions are modest, up to 100 times lower than the operational savings from displacing fossil fuel–based electricity (Pandey et al., 2025). 

The net climate benefit is greatest in carbon-intensive grids. It diminishes, however, where grid decarbonization is already rapid or where yield losses on prime farmland shift food production to other land, triggering indirect land use change emissions (Agostini et al., 2021; Campana et al., 2025). Water-use efficiency and microclimate cooling can partially offset yield penalties in hot, dry climates, but gains may be small or negative in temperate or wet climates (Campana et al., 2025; Pandey et al., 2025). Overall benefits depend on careful siting, crop selection, and policies that offset higher installation costs while avoiding land-use competition.

Action Word
Deploy
Solution Title
Agrivoltaics
Classification
Highly Recommended

Lawmakers and Policymakers

  • Set ambitious long-term renewable energy goals in national climate plans and multilateral agreements; incorporate agrivoltaics into national climate, energy, and agriculture plans. 
  • Create clear and easy-to-understand regulations that support agrivoltaics deployment and attract investment; use flexible definitions to encourage innovation; ground policies in scientific evidence, incorporating the latest data on the impacts to grid stability, microgrids development, soil carbon, biodiversity, and water management; avoid rigid annual yield requirements; allow flexibility in subsidy programs and regulations to give farmers using agrivoltaics greater choice in crop selection.
  • Create clear guidelines for installing and operating agrivoltaics to optimize land productivity while minimizing soil compaction and other environmental impacts.
  • Coordinate agrivoltaic policies horizontally (e.g., across agencies) and vertically (e.g., across subnational, national, and international efforts); align social and environmental safeguards with agrivoltaic policies.
  • Provide financial incentives to developers and farmers, such as subsidies (especially to reduce up-front cost), feed-in tariffs, tax credits, grants, green bonds, waived grid connection fees, and forgivable or concessional loans; gradually reduce subsidies as markets mature; offer farmers increased incentives for farmer-owned systems; prioritize smallholder and low- to middle-income farmers.
  • Streamline permitting procedures for agrivoltaic projects; standardize documents such as templates for power purchase agreements (PPAs).
  • Develop long-term, flexible partnership frameworks with industry, including adaptable or aggregated PPAs, aligned with national decarbonization targets and timelines.
  • Implement or strengthen renewable portfolio standards, clean energy standards, or other similar policy mechanisms with carve-outs for agrivoltaics.
  • Implement carbon taxes and redirect fossil-fuel subsidy savings into agrivoltaics and renewables.
  • Invest in grid-enhancing technologies, flexibility, storage, and transmission infrastructure to manage variable generation.
  • Work with industry to diversify solar panel supply chains; design incentives and policies to stimulate local or regional production, and advance R&D for solar and related equipment, such as batteries.
  • Strengthen labor and human rights laws and standards around solar PV supply chains; invest in enforcement mechanisms – particularly for the extraction and use of critical minerals and panel manufacturing.
  • Strengthen land tenure rights; clarify rules allowing agrivoltaics on agricultural land; differentiate agrivoltaics from conventional ground-mounted solar panels; create supportive policies to deploy agrivoltaic systems for restoring abandoned or contaminated land.
  • Require environmental and health impact assessments before installation and during operation.
  • Co-design agrivoltaic projects with relevant stakeholders; ensure the stakeholder engagement process starts early and is transparent, inclusive, and ongoing; solicit feedback from the local community on location, design, and finance; ensure finalized projects address relevant sociological, agriculture, and ecological considerations.
  • Ensure regulations support diverse development and ownership models (e.g., build-own-operate, public-private partnerships, energy communities, and cooperatives).
  • Establish strong quality control requirements for all stages of deployment, including resource extraction, manufacturing, installation, maintenance, and end-of-life service for solar panels used in agrivoltaics; create certification programs for each stage of the process.
  • Require or encourage manufacturers to provide minimum warranties; establish independent grievance mechanisms to resolve customer disputes and help foster trust in the industry.
  • Work with the private sector on workforce training programs, professional certifications, and capacity development for all project phases.
  • Partner with insurance agencies to develop tailored products for farmers adopting agrivoltaics.
  • Implement strong end-of-life regulations for solar panels, including extended producer responsibility (EPR) for manufacturers; support markets for reuse, refurbishment, and recycling.
  • Join, create, or participate in public-private partnerships dedicated to de-risking markets, deployment, technology transfers, education, and other relevant areas.
  • Expand extension services with agrivoltaics-specific guidance, demonstration projects, and peer learning; work with energy agencies to raise awareness; create accessible one-stop-shop educational programs (online and in-person) on regulations, benefits, and best practices, tailored to local contexts. 

Further information:

Practitioners

  • Farmer / Solar Provider: Take advantage of government incentives such as subsidies, grants, tax credits, or waived-connection fees; as the market matures, gradually reduce reliance on these incentives to create long-term market stability.
  • Solar Provider: Conduct careful planning and thorough consultation with farmers to determine the best installation practices; minimize disruption to farming operations and customize configurations to each farmer’s needs and planting schedules.
  • Farmer / Solar Provider: AMinimize soil compaction during installation and servicing with techniques such as scheduling installations during farming off seasons or using specialized equipment.
  • Solar Provider: Use a variety of panel systems, including vertical, single-axis, and dual-axis tracking systems in addition to fixed-tilt systems; improve optimization strategies for single-axis and dual-axis systems and integrate sun-tracking with agricultural strategies, crop selectivity, and soil and weather monitoring systems.
  • Solar Provider: Offer tools or services to help farmers navigate solar arrays more easily, such as geospatial navigation systems, remote sensors, and vision-assisted navigation systems.
  • Solar Provider: Avoid the use of concrete and permanent structures when installing PV systems on farmland.
  • Solar Provider: Offer a variety of business arrangements for farmers, such as pay-as-you-go build-own-operate models, revenue-sharing agreements, and flat lease payments.
  • Solar Provider: Provide options and guidance to improve visual attractiveness of agrivoltaic systems, such as hedges, strategic spacing, and panel coloring.
  • Solar Provider: Standardize agrivoltaic system designs for different geographies and agriculture applications.
  • Farmer / Solar Provider: Consult on maintenance and cleaning protocols, accounting for food safety, the need to reduce soil compaction, and other relevant environmental or health regulations.
  • Solar Provider: Use geospatial and satellite data to assess landscape, market dynamics, and potential customer base.
  • Solar Provider: Design agrivoltaic minigrid systems for compatibility with the main grid to enable future connection. 
  • Solar Provider: Reduce customer acquisition costs using machine learning models to identify potential customers and eligible sites.
  • Solar Provider / Regulator: Collaborate with the public sector to diversify solar panel supply chains; leverage incentives and policies that stimulate local or regional production and advance R&D.
  • Solar Provider: Ensure supply chains comply with international labor and human rights laws and standards, particularly for the extraction of critical minerals and panel manufacturing.
  • Solar Provider: Work to decarbonize the full life cycle, including supply chains, production, installation, recycling, and disposal.
  • Solar Provider / Regulator: Partner with the public sector and private organizations to develop workforce training programs; ensure capacity development for all stages of deployment, including installation best practices and end-of-life services.
  • Farmer / Solar Provider: Stay abreast of and engage with changing policies, regulations, zoning laws, tax incentives, and related developments to help remove commercial barriers.
  • Farmer / Solar Provider: Join, create, or participate in public-private partnerships dedicated to de-risking markets, deployment, technology transfers, education, and other relevant areas.
  • [Farmer / Solar Provider] Help expand extension services and create educational opportunities, including demonstration projects and peer-to-peer learning, in agrivoltaics; work with energy agencies to raise awareness.

Further information:

Business Leaders

  • Set ambitious long-term renewable energy goals; incorporate agrivoltaics, where feasible, into corporate net-zero strategies.
  • Support long-term, stable contracts (e.g., PPAs) that de-risk investment in agrivoltaic technologies and incentivize local supply chain development.
  • Invest in companies that produce, deploy, or provide end-of-life servicing for solar panels used for agrivoltaic systems; seek to diversify and localize supply chains.
  • Invest in R&D and related technology, such as batteries, navigation systems for farmers, and software to manage agrivoltaic systems.
  • Support workforce development programs, offer employee scholarships, and/or sponsor training for careers in agrivoltaics; help ensure capacity development for all stages of deployment, including installation and end-of-life services.
  • Offer pro bono business advice or general support for community and cooperative agrivoltaic projects.
  • Join, create, or participate in public-private partnerships dedicated to de-risking markets, deployment, technology transfers, education, and other relevant areas.

Further information:

Nonprofit Leaders

  • Advocate for ambitious long-term renewable energy goals in national climate plans and multilateral agreements; help incorporate agrivoltaics into national climate, energy, and agriculture plans. 
  • Operate or support agrivoltaic demonstration projects, equipment testing, certification, market information disclosures, and onsite supervision.
  • Conduct open-access research to improve the performance of solar PVs in agrivoltaic systems; research optimal crops and panel arrangements, forecasting, and related technologies; help standardize models across geographies and agricultural applications. 
  • Advocate for clear and easy-to-understand regulations that enable agrivoltaics deployment and investment; promote flexible definitions to allow for innovation; provide scientific evidence on the impacts to grid stability, microgrids, soil carbon, biodiversity, and water management; recommend avoiding rigid annual yield requirements and allowing farmers flexibility in crop selection in subsidy and insurance programs.
  • Contribute to clear guidelines for installing and operating agrivoltaics to optimize land productivity while minimizing soil compaction and other environmental impacts.
  • Urge governments to coordinate agrivoltaic policies horizontally (e.g., across agencies) and vertically (e.g., across subnational, national, and international efforts); help align social and environmental safeguards with agrivoltaic policies.
  • Advocate for streamlined permitting procedures and standardize documents such as templates for PPAs.
  • Offer financial assistance to farmers, cooperatives, or communities seeking to deploy agrivoltaics; advocate for targeted incentives to developers and farmers, such as subsidies (especially to reduce up-front cost), feed-in tariffs, tax credits, grants, green bonds, waived grid connection fees, and forgivable or concessional loans; recommend subsidies be gradually reduced as the market stabilizes; earmark funds and/or urge governments to earmark incentives for smallholder and low- and middle-income farmers.
  • Advocate for carbon taxes and redirection of fossil fuel subsidies into agrivoltaics and renewables.
  • Urge policymakers to invest in and subsidize grid-enhancing technologies, flexibility, storage, and transmission infrastructure to manage variable generation.
  • Work with policymakers and industry to diversify solar panel supply chains; help design incentives and policies to stimulate local or regional production; urge policymakers to invest in R&D for solar panels and related equipment such as batteries.
  • Help strengthen labor and human rights laws and standards around solar PV supply chains; invest in enforcement mechanisms – particularly for the extraction and use of critical minerals and panel manufacturing.
  • Help strengthen land tenure rights through documentation and advocacy; help policymakers clarify and allow agrivoltaics on agricultural land; differentiate agrivoltaics from conventional ground-mounted solar panels; create supportive policies to deploy agrivoltaic systems for restoring abandoned or contaminated land.
  • Offer services to conduct environmental and health impact assessments before installation and during operations of agrivoltaics.
  • Participate in community feedback sessions and co-design agrivoltaic projects with farmers, developers, and other relevant stakeholders.
  • Help create or support community agrivoltaics using a variety of development models and benefit-sharing arrangements (e.g., build-own-operate, publicly owned businesses, developer-owned businesses, public-private partnerships, energy communities, and cooperatives).
  • Create certification programs for all stages of deployment, including resource extraction, manufacturing, installation, maintenance, and end-of-life service for solar panels used in agrivoltaic systems.
  • Work with policymakers and the private sector to develop workforce training programs; ensure capacity development for all stages of deployment, including end-of-life services; create professional certifications for the full spectrum of roles.
  • Help create strong regulations for end-of-life services for solar panels; advocate for EPR for manufacturers; work with industry to foster a market for used, refurbished, and recycled panels.
  • Join, create, or participate in public-private partnerships dedicated to de-risking markets, deployment, technology transfers, education, and other relevant areas.
  • Help expand extension services and create educational opportunities, including demonstration projects and peer-to-peer learning in agrivoltaics; work with energy agencies to raise awareness.

Further information:

Investors

  • Offer low-interest loans and concessional financing to farmers, panel manufacturers, developers, operators, recyclers, and others involved in agrivoltaics.
  • Invest directly in agrivoltaics projects.
  • Invest in companies that produce, deploy, or provide end-of-life servicing for solar panels used in agrivoltaics; support supply chain localization and diversification.
  • Invest in supportive infrastructures, such as utility companies and grid development.
  • Invest in green bonds and/or explore blended finance structures to mobilize capital for agrivoltaics and enabling infrastructure.
  • Invest in solar panel recycling infrastructure and circular supply chains.
  • Invest in R&D for component technology and related equipment, such as batteries.
  • Help de-risk agrivoltaics adoption in low- and middle-income communities through low-interest loans, concessional financing, and/or favorable terms.
  • Align investments with existing public-private partnerships, voluntary agreements, or voluntary guidance that may apply in the location of the investment.

Further information:

Philanthropists and International Aid Agencies

  • Advocate for ambitious long-term renewable energy goals in national climate plans and multilateral agreements; help incorporate agrivoltaics into national climate, energy, and agriculture plans. 
  • Operate agrivoltaic demonstration projects, equipment testing, certification systems, market information disclosures, and onsite supervision.
  • Offer low-interest loans and concessional financing for farmers, panel manufacturers, developers, operators, recyclers, and others involved in agrivoltaics.
  • Award grants for the development of agrivoltaics projects and/or adjacent areas such as mini-grids.
  • Award grants to or invest in companies that produce, deploy, or provide end-of-life servicing for solar panels used in agrivoltaics; seek to diversify and localize supply chains.
  • Provide financing for supportive infrastructures, such as utility companies and grid development.
  • Invest in green bonds and/or explore blended finance structures to mobilize capital for companies developing or deploying agrivoltaics and supportive infrastructure.
  • Finance recycling infrastructure for solar panels and circular supply chains.
  • Help de-risk transitions to agrivoltaic systems in low- and middle-income communities by earmarking a percentage of grant funds and/or offering low-interest loans, concessional financing, and/or favorable terms.
  • Conduct open-access research to improve the performance of solar PVs in agrivoltaic systems; research optimal crops and panel arrangements, forecasting, and related technologies; help standardize models across geographies and agricultural applications. 
  • Help create clear and easy-to-understand regulations that enable agrivoltaics deployment and investment; promote flexible definitions to allow for innovation; provide scientific evidence for the impacts to grid stability, microgrids, soil carbon, biodiversity, and water management; recommend avoiding rigid annual yield requirements and allowing farmers flexibility in crop selection in subsidy and insurance programs.
  • Contribute to clear guidelines for installing and operating agrivoltaics to optimize land productivity while minimizing soil compaction and other environmental impacts.
  • Urge governments to coordinate agrivoltaic policies horizontally (e.g., across agencies) and vertically (e.g., across subnational, national, and international efforts); help align social and environmental safeguards with agrivoltaic policies.
  • Advocate for streamlined permitting procedures and standardize documents such as templates for PPAs.
  • Call on governments to provide financial incentives to developers and farmers, such as subsidies (especially to reduce up-front cost), feed-in tariffs, tax credits, grants, green bonds, waived grid connection fees, and forgivable or concessional loans; recommend subsidies be gradually reduced as the market stabilizes; urge governments to earmark incentives for smallholder, low- and middle-income farmers.
  • Advocate for carbon taxes and redirection of fossil fuel subsidies into agrivoltaics and renewables.
  • Urge policymakers to invest in and subsidize grid enhancing technologies, flexibility, storage, and transmission infrastructure to manage variable generation.
  • Work with policymakers and industry to diversify solar panel supply chains; help design incentives and policies to stimulate local or regional production and advance R&D for solar panels and related equipment such as batteries.
  • Help strengthen labor and human rights laws and standards around solar PV supply chains; invest in enforcement mechanisms – particularly for the extraction and use of critical minerals and panel manufacturing.
  • Help strengthen land tenure rights through documentation and advocacy; help policymakers clarify and allow agrivoltaics on agricultural land; differentiate agrivoltaics from conventional ground-mounted solar panels; create supportive policies to deploy agrivoltaic systems for restoring abandoned or contaminated land.
  • Offer or support services to conduct environmental and health impact assessments before installation and during operations of agrivoltaics.
  • Participate in community feedback sessions and co-design agrivoltaic projects with farmers, developers, and other relevant stakeholders.
  • Help create or support community agrivoltaics using a variety of development models and benefit-sharing arrangements (e.g., build-own-operate, publicly owned businesses, developer-owned businesses, public-private partnerships, energy communities, and cooperatives).
  • Finance or create certification programs for all stages of deployment, including resource extraction, manufacturing, installation, maintenance, and end-of-life service for agrivoltaic systems. 
  • Work with policymakers and the private sector to develop workforce training programs; ensure capacity development for all stages of deployment, including end-of-life services; create professional certifications for the full spectrum of roles.
  • Help create strong regulations for end-of-life services for solar panels; advocate for EPR for manufacturers; work with industry to foster a market for used, refurbished, and recycled panels.
  • Join, create, or participate in public-private partnerships dedicated to de-risking markets, deployment, technology transfers, education, and other relevant areas.
  • Help expand extension services or create educational opportunities that offer options for deployment, technical guidance, demonstration projects, and peer-to-peer learning opportunities in agrivoltaics; work with energy agencies to raise awareness.

Further information:

Thought Leaders

  • Advocate for ambitious long-term renewable energy goals in national climate plans and multilateral agreements; help incorporate agrivoltaics into national climate, energy, and agriculture plans. 
  • Operate agrivoltaic demonstration projects, equipment testing, certification systems, market information disclosures, and onsite supervision.
  • Conduct open-access research to improve the performance of solar PV in agrivoltaic systems; research optimal crops and panel arrangements, forecasting, and related technologies; help standardize models across geographies and agricultural applications. 
  • Help create clear and easy-to-understand regulations that enable agrivoltaics deployment and investment; promote flexible definitions to allow for innovation; provide scientific evidence on the impacts to grid stability, microgrids, soil carbon, biodiversity, and water management; recommend avoiding rigid annual yield requirements and allowing farmers flexibility in crop selection in subsidy and insurance programs. 
  • Contribute to clear guidelines for installing and operating agrivoltaics to optimize land productivity while minimizing soil compaction and other environmental impacts.
  • Urge governments to coordinate agrivoltaic policies horizontally (e.g., across agencies) and vertically (e.g., across subnational, national, and international efforts); help align social and environmental safeguards with agrivoltaic policies.
  • Advocate for streamlined permitting procedures and standardize documents such as templates for PPAs.
  • Call on governments to provide financial incentives to developers and farmers, such as subsidies (especially to reduce up-front cost), feed-in tariffs, tax credits, grants, green bonds, waived grid connection fees, and forgivable or concessional loans; recommend subsidies be gradually reduced as the market stabilizes; urge policymakers to earmark incentives for smallholder, low- and middle-income farmers.
  • Advocate for carbon taxes and redirection of fossil fuel subsidies into agrivoltaics and renewables.
  • Urge policymakers to invest in and subsidize grid-enhancing technologies, flexibility, storage, and transmission infrastructure to manage variable generation.
  • Help strengthen labor and human rights laws and standards around solar PV supply chains; invest in enforcement mechanisms –particularly, for the extraction and use of critical minerals and panel manufacturing.
  • Help strengthen land tenure rights through documentation and advocacy; help policymakers clarify and allow agrivoltaics on agricultural land; differentiate agrivoltaics from conventional ground-mounted solar panels; create supportive policies to deploy agrivoltaic systems for restoring abandoned or contaminated land.
  • Offer services to conduct environmental and health impact assessments before installation and during operations of agrivoltaics.
  • Participate in community feedback sessions and co-design agrivoltaic projects with farmers, developers, and other relevant stakeholders.
  • Help create certification programs for all stages of deployment, including resource extraction, manufacturing, installation, maintenance, and end-of-life service for agrivoltaic systems.
  • Work with policymakers and the private sector to develop workforce training programs; ensure capacity development for all stages of deployment, including end-of-life services; create professional certifications for the full spectrum of roles.
  • Help create strong regulations for end-of-life services for solar panels; advocate for EPR for manufacturers; work with industry to foster a market for used, refurbished, and recycled panels.
  • Join, create, or participate in public-private partnerships dedicated to de-risking markets, deployment, technology transfers, education, and other relevant areas.
  • Help expand extension services or create educational opportunities that offer options for deployment, technical guidance, demonstration projects, and peer-to-peer learning opportunities in agrivoltaics; work with energy agencies to raise awareness.

Further information:

Technologists and Researchers

  • Design solar panels and mounting systems that reduce material requirements and overall system weight.
  • Research lighter-weight materials for agrivoltaic systems and evaluate their technical, economic, and environmental feasibility. 
  • Advance scientific understanding of optimal crop selection for agrivoltaic systems; improve solar panel wavelength selectivity; develop standardized system configurations for specific geographies and agricultural applications; identify optimal spacing requirements for various arrangements.
  • Research soil compaction impacts in agrivoltaic systems, ways to prevent or minimize it during site preparation and installation, and ways to alleviate or reverse it post-installation – with priority on approaches compatible with ongoing PV operations and long-term soil health.
  • Identify ways to reduce the impact of agrivoltaic systems on satellite signals to improve navigation technology.
  • Improve semi-transparent photovoltaic panels to increase efficiency and reduce costs for agrivoltaic systems.
  • Examine the impacts of agrivoltaics on soil health, water management, biodiversity, and other environmental factors.
  • Create publicly accessible databases of agrivoltaic models, performance data, and best practices.
  • Assess policy frameworks and regulations that enable or inhibit agrivoltaics adoption. 
  • Identify barriers to adoption for farmers; research impacts of agrivoltaics on property value and land classification.
  • Improve and update spatial data on power grid locations and available transmission capacities, especially in rural and underserved areas.
  • Examine the impacts of agrivoltaics on food security, energy access, and rural communities.
  • Advance the use of AI or other technological tools for predictive analytics, yield forecasting, and power system control.
  • Improve recycling infrastructure and scalable technologies to repair, reuse, or recover materials from solar panels.
  • Improve related mining technologies for critical minerals, making the extraction process safer, less disruptive to local communities and ecosystems, and less energy intensive.
  • Develop ways of eliminating, reducing, reusing, and/or safely disposing of hazardous by-products of PV manufacturing.
  • Research social factors that drive community acceptance and the role of agrivoltaics in a fair and just energy transition. 

Further information:

Communities, Households, and Individuals

  • Help create or support community agrivoltaic projects using models such as build-own-operate, public-private partnerships, energy communities, and cooperatives.
  • Take advantage of available government incentives such as subsidies, tax breaks, and forgivable or concessional loans for community agrivoltaic projects.
  • Advocate for ambitious long-term renewable energy goals in national climate plans and multilateral agreements.
  • Call on governments to provide financial incentives to developers and farmers, such as subsidies (especially to reduce up-front cost), feed-in tariffs, tax credits, grants, green bonds, waived grid connection fees, and forgivable or concessional loans; recommend subsidies be gradually reduced as the market stabilizes; urge policymakers to earmark incentives for smallholder, low- and middle-income farmers.
  • Advocate for carbon taxes and the redirection of fossil fuel subsidies into agrivoltaics and renewables.
  • Urge policymakers to invest in and subsidize improvements to grid integration and flexibility, storage, and infrastructure to manage variable generation.
  • Participate in community feedback sessions and co-design agrivoltaic projects with farmers, developers, and other relevant stakeholders.
  • Join, create, or participate in public-private partnerships dedicated to de-risking markets, deployment, technology transfers, education, and other relevant areas.
  • Volunteer with community agrivoltaic projects; participate in public awareness campaigns; share information with your community and networks regarding the benefits of agrivoltaic systems.

Further information:

Evidence Base

Consensus of overall effectiveness of agrivoltaics: High

A wide range of peer-reviewed studies, meta-analyses, and life-cycle assessments provide strong evidence that agrivoltaics reduce GHG emissions. International organizations such as the Intergovernmental Panel on Climate Change (IPCC) and IEA identify rapid solar PV deployment as a critical component in mitigation pathways and net-zero scenarios. Life-cycle assessments show that, despite 20% higher embodied emissions from elevated structures compared with conventional solar PV, agrivoltaic systems deliver significant net emissions reductions by displacing fossil generation while maintaining agricultural output on the same footprint (Agostini et al., 2021; Barron-Gafford et al., 2019; Campana et al., 2025).

There is sufficient evidence that well-sited agrivoltaic systems increase land-use efficiency, and can provide additional benefits including reduced water stress, avoided land-use conflict, and improved solar PV performance in suitable climates (Barron-Gafford et al., 2019; Campana et al., 2025; Dupraz et al., 2011; Trommsdorff et al., 2025). Meta-analyses show manageable yield responses for shade-tolerant or neutral crops, especially in arid and semi-arid regions (Chirinda et al., 2024; Mamun et al., 2022); however yields for shade-intolerant crops or in temperate and humid climates are less consistent. Higher capital costs, site-specific challenges, and limited long-term data beyond two to three growing seasons create economic uncertainty. 

Consensus is mixed regarding net emissions savings of solar PV, given the diurnal nature of solar energy and the need for storage or other energy resources to meet peak evening demand. There is also a lack of global scientific or regulatory consensus regarding the definition of agrivoltaics, with qualification thresholds for which agricultural activities and what level of activity constitutes dual-use land varying substantially across jurisdictions (Trommsdorff et al., 2025).

This summary draws from 5 reviews and meta-analyses, 25 institutional reports, 6 market reports, and 32 original studies covering more than 25 countries, with strongest evidence from Europe, North America, East Asia, and select arid regions. We recognize this limited geographic scope creates bias toward higher-income and temperate-to-arid settings. Further research and data sharing in underrepresented low-income regions is required, where land, water, and energy pressures makes agrivoltaic systems potentially most impactful.

Updated Date
Coming Soon Label
Coming Soon

Improve Ruminant Breeding

Image
Image
Rancher holding a tablet device walks among grazing cattle
Coming Soon
Off
Summary

Ruminant livestock, such as cattle, goats, and sheep, can be selectively bred for reduced enteric methane production. Some experimental breeding programs have reduced methane production by 4-45% over multiple generations of animals. An advantage of improved ruminant breeding is that it could reduce methane emissions from the majority of ruminants that are managed on pasture or rangelands. However, intentionally breeding ruminants for reduced methane production is in its early stages, and deploying this solution across multiple species and breeds will take decades. Furthermore, reducing enteric methane emissions per kilogram of milk or meat may not necessarily reduce total emissions if ruminant numbers increase, or if it diverts efforts to reduce consumption and waste of ruminant meat and milk products in wealthy countries. As a climate solution, improved ruminant breeding is not yet ready for large-scale deployment, and it will not yield quick results, but it is probably a wise mid- to long-term climate investment that we will “Keep Watching.”

Description for Social and Search
Ruminant livestock, such as cattle, goats, and sheep, can be selectively bred for reduced enteric methane production. Some experimental breeding programs have reduced methane production by 4-45% over multiple generations of animals.
Overview

What is our assessment?

Based on our analysis, improved ruminant breeding is one of the few promising solutions for reducing enteric methane production from the many millions of ruminants, including those managed on pasture and rangeland. However, it is not a climate solution that will yield quick results, nor is it ready for large-scale deployment at this time. Instead, it should be considered a wise mid- to long-term climate investment that we will “Keep Watching.”

Plausible Could it work? Yes
Ready Is it ready? No
Evidence Are there data to evaluate it? Limited
Effective Does it consistently work? No
Impact Is it big enough to matter? Yes
Risk Is it risky or harmful? No
Cost Is it cheap? No

What is it?

Selective breeding can produce ruminant livestock, such as cattle, goats, and sheep, that produce less enteric methane during digestion. Enteric methane represents 21% of humanity’s methane emissions, equivalent to 2.9 Gt CO₂‑eq/yr. Enteric methane is produced by microbes in the digestive system – primarily in the rumen, which is the first stomach compartment – and not by ruminants themselves, but its production is a symptom of inefficient digestion by the animal. Therefore, breeding for more efficient use of food by ruminants can reduce enteric methane emissions, while also potentially increasing meat and milk production. 

Does it work? 

Selective breeding of ruminants for reduced enteric methane production has been shown to be effective. One 10-year pilot breeding program resulted in a 12% methane reduction in animals born in the last generation. Other studies have reported emissions reductions ranging from 4 to 45 percent. The effect can be cumulative, with greater reductions in enteric methane production with every selected generation of ruminants. 

Why are we excited?

Despite their disproportionate climate impact, ruminant meat and dairy products are in high demand. Any strategy that can reduce methane emissions per kilogram of meat or milk could, if broadly adopted, yield globally meaningful reductions in methane emissions (>0.1 Gt CO₂‑eq per year). A major advantage of this selective breeding approach is that it is suitable for both confined and grazing ruminants. The vast majority of ruminant animals spend all or part of their lives on pasture or rangeland. In contrast, feed additives, which can also reduce enteric methane production, are only suitable for confined animals. In addition, there is some evidence that this solution could increase the meat and milk productivity of ruminants by capturing energy from feed and forages that would otherwise have been lost as enteric methane.

Why are we concerned?

Breeding ruminants to reduce enteric methane production is not a climate solution that will show quick results. It will require prolonged testing using expensive measurement equipment on thousands of animals and selective breeding for each breed of each ruminant livestock species over many generations. Some researchers say that decade-long breeding programs will be required. Other than a few research projects, however, the current adoption of selective breeding for methane reduction is very low. Furthermore, selective breeding focused only on methane reduction could result in the loss of other desirable traits, such as productivity or adaptation to local conditions and farming systems. It is also possible that reducing enteric methane emissions per kilogram of milk or meat may not necessarily reduce total emissions if, for example, farmers or ranchers increase their herd sizes. Finally, there is the concern that improved ruminant breeding could be used as a smokescreen to divert attention from the importance of reducing consumption of ruminant meat and milk products in the diets of wealthy countries and reducing food waste of ruminant products.

Solution in Action

References

Arndt, C., Hristov, A. N., Price, W. J., McClelland, S. C., Pelaez, A. M., Cueva, S. F., ... & Yu, Z. (2022). Full adoption of the most effective strategies to mitigate methane emissions by ruminants can help meet the 1.5 C target by 2030 but not 2050. Proceedings of the National Academy of Sciences, 119(20), e2111294119.

Beauchemin, K. A., Ungerfeld, E. M., Abdalla, A. L., Alvarez, C., Arndt, C., Becquet, P., ... & Kebreab, E. (2022). Invited review: Current enteric methane mitigation options. Journal of Dairy Science, 105(12), 9297-9326.

Black, J. L., Davison, T. M., & Box, I. (2021). Methane emissions from ruminants in Australia: Mitigation potential and applicability of mitigation strategies. Animals, 11(4), 951.

de Souza Congio, G. F., Bannink, A., Mogollón, O. L. M., Jaurena, G., Gonda, H., Gere, J. I., ... & Hristov, A. N. (2021). Enteric methane mitigation strategies for ruminant livestock systems in the Latin America and Caribbean region: A meta-analysis. Journal of Cleaner Production, 312, 127693.

FAO (2023) Pathways towards lower emissions: A global assessment of the greenhouse gas emissions and mitigation options from livestock agrifood systems. FAO, Rome, 2023.

Kelliher, M., Bogueva, D., & Marinova, D. (2024). Meta-Analysis and Ranking of the Most Effective Methane Reduction Strategies for Australia’s Beef and Dairy Sector. Climate, 12(4), 50.

Króliczewska, B., Pecka-Kiełb, E., & Bujok, J. (2023). Strategies used to reduce methane emissions from ruminants: Controversies and issues. Agriculture, 13(3), 602.

Lassen, J., & Difford, G. F. (2020). Review: Genetic and genomic selection as a methane mitigation strategy in dairy cattle. Animal 14: s473–s483.

Manzanilla-Pech, C. I. V., Stephansen, R. B., Difford, G. F., Løvendahl, P., & Lassen, J. (2022). Selecting for feed efficient cows will help to reduce methane gas emissions. Frontiers in Genetics, 13, 885932.

Nabuurs, G-J., R. Mrabet, A. Abu Hatab, M. Bustamante, H. Clark, P. Havlík, J. House, C. Mbow, K.N. Ninan, A. Popp, S. Roe, B. Sohngen, S. Towprayoon, 2022: Agriculture, Forestry and Other Land Uses (AFOLU). In IPCC, 2022: Climate Change 2022: Mitigation of Climate Change. Contribution of Working Group III to the Sixth Assessment Report of the Intergovernmental Panel on Climate Change[P.R. Shukla, J. Skea, R. Slade, A. Al Khourdajie, R. van Diemen, D. McCollum, M. Pathak, S. Some, P. Vyas, R. Fradera, M. Belkacemi, A. Hasija, G. Lisboa, S. Luz, J. Malley, (eds.)]. Cambridge University Press, Cambridge, UK and New York, NY, USA. doi: 10.1017/9781009157926.009

Roques, S., Martinez-Fernandez, G., Ramayo-Caldas, Y., Popova, M., Denman, S., Meale, S. J., & Morgavi, D. P. (2024). Recent advances in enteric methane mitigation and the long road to sustainable ruminant production. Annual Review of Animal Biosciences, 12(1), 321-343.

Van Eenennaam, A. L. (2024). Addressing the 2050 demand for terrestrial animal source food. Proceedings of the National Academy of Sciences, 121(50), e2319001121.

Credits

Lead Fellow

  • Eric Toensmeier

Internal Reviewer

  • Christina Swanson, Ph.D.
Speed of Action
Caveats
Additional Benefits
Risks
Consensus
Trade-offs
Action Word
Improve
Solution Title
Ruminant Breeding
Classification
Keep Watching
Updated Date
Coming Soon Label
Coming Soon

Use Feed Additives

Image
Image
Cow at feeding station
Coming Soon
Off
Summary

Feed additives can reduce enteric methane production in ruminant livestock, such as cattle, goats, and sheep. Most feed additive compounds are still being researched to determine their efficacy and safety; however, at least one product, 3-NOP (3-nitrooxypropanol), has been shown to be effective, has recently been approved for use in many countries, and has experienced some early adoption. However, because of cost and the need to be administered daily, the use of feed additives is currently limited to confined ruminants in high-income countries and is not feasible for the majority of global ruminant livestock. Based on these limitations and current levels of adoption, we will “Keep Watching” this potential solution.

Description for Social and Search
Feed additives can reduce enteric methane production in ruminant livestock, such as cattle, goats, and sheep. Most feed additive compounds are still being researched to determine their efficacy and safety.
Overview

What is our assessment?

Based on our analysis, feed additives are a promising technology that could yield globally meaningful reductions in methane emissions. A few, including 3-NOP, are just on the threshold of commercial adoption and may be widely used by confined ruminant producers in the coming years. The current use of feed additives is low, and the effectiveness of most feed additive compounds is not well-documented. Consequently, wide-scale adoption is largely confined to confined livestock in high-income countries. Based on our assessment, we will “Keep Watching” this potential solution.

Plausible Could it work? Yes
Ready Is it ready? No
Evidence Are there data to evaluate it? Yes
Effective Does it consistently work? Yes
Impact Is it big enough to matter? Yes
Risk Is it risky or harmful? No
Cost Is it cheap? Yes

What is it?

Feed additives are a diverse group of natural and synthetic compounds that, when fed daily, can reduce enteric methane production in ruminant livestock, including cattle, sheep, and goats. Enteric methane from livestock is the source of 21% of humanity’s methane emissions, or 2.9 Gt CO₂‑eq/yr. Feed additives reduce enteric methane production by suppressing the activity of microbes in the digestive system. 3-NOP (3-nitrooxypropanol) is a synthetic that inhibits an enzyme involved in enteric methane production.

Does it work?

More than 170 different feed additives have been developed and tested so far, but only a few of them have been studied enough to offer predictable outcomes and proper doses. Methane reductions from these well-studied additives typically range from 10-30%. The feed additive 3-NOP, the first compound approved for commercial use, reduces enteric methane by an average of 32.5%. A second feed additive derived from active compounds found in Asparagopsis seaweed has shown promising results in some studies and has recently received regulatory approval in two countries. In addition, because different feed additives use different mechanisms to suppress enteric methane production, it’s possible that multiple additives can be used together to achieve greater methane reductions. The great majority of other additives are not yet ready for widespread adoption due to a lack of understanding of effectiveness, side effects on cattle and humans who consume milk from treated cattle, and other concerns.

Why are we excited?

Ruminants are a major source of methane emissions, yet ruminant meat and dairy products are in high demand. Therefore, any strategy that can reduce methane emissions per kilogram of meat or milk is potentially very valuable and, if broadly adopted, could yield globally meaningful reductions in methane emissions (>0.1 Gt CO₂‑eq per year). The feed additive 3-NOP, first approved for commercial use in two countries in 2021, is now legal in 55 countries. Research on other feed additives is active and generally well-supported with funding from philanthropic and investment sources. Although current use of feed additives is very low, successful research and pilot studies, increasing regulatory approvals, and strong positive interest from the livestock industry suggest that wider-scale adoption of this emissions reduction technology could occur quickly. In addition to potential emissions reduction benefits, some additives offer other benefits such as increased productivity and parasite control.

Why are we concerned?

Because they must be fed daily as a supplement to a concentrated feed, use of feed additives is limited to ruminants managed under confined conditions. Most of the billions of ruminant animals today are raised or managed in extensive grazing or pastoralist systems, often in small herds in remote areas. This makes use of feed additives infeasible, although some research is underway to develop methane-reducing compounds that could be added to water troughs instead of to feed. Feed additives are also costly. Though they may be cost-effective in terms of dollars per ton of CO₂‑eq reduced, the cost of additives themselves would likely be prohibitive for smallholders and pastoralists in low-income countries. These limitations mean that feed additives, as currently under development, are only suitable for a subset of total ruminant livestock – those that are raised in confinement systems in wealthy countries. The great majority of feed additives are not yet ready for widespread adoption due to a lack of understanding of effectiveness, side effects on cattle and humans who consume milk from treated cattle, and other concerns. There are also other challenges, including regulatory issues, public acceptance, and effects on livestock and human health. There is also concern that feed additives could be used to divert attention from the importance of reducing ruminant meat and milk products in the diets of wealthy countries and reducing food waste of ruminant products.

Solution in Action

References

Almeida, A. K., Hegarty, R. S., & Cowie, A. (2021). Meta-analysis quantifying the potential of dietary additives and rumen modifiers for methane mitigation in ruminant production systems. Animal Nutrition, 7(4), 1219-1230. Link to source: https://doi.org/10.1016/j.aninu.2021.09.005

Batley, R. J., Chaves, A. V., Johnson, J. B., Naiker, M., Quigley, S. P., Trotter, M. G., & Costa, D. F. (2024). Rapid screening of methane-reducing compounds for deployment in livestock drinking water using in vitro and FTIR-ATR analyses. Methane, 3(4), 533-560. Link to source: https://doi.org/10.3390/methane3040030 

Canadell, J.G., P.M.S. Monteiro, M.H. Costa, L. Cotrim da Cunha, P.M. Cox, A.V. Eliseev, S. Henson, M. Ishii, S. Jaccard, C. Koven, A. Lohila, P.K. Patra, S. Piao, J. Rogelj, S. Syampungani, S. Zaehle, and K. Zickfeld, 2021: Global Carbon and other Biogeochemical Cycles and Feedbacks. In Climate Change 2021: The Physical Science Basis. Contribution of Working Group I to the Sixth Assessment Report of the Intergovernmental Panel on Climate Change [Masson-Delmotte, V., P. Zhai, A. Pirani, S.L. Connors, C. Péan, S. Berger, N. Caud, Y. Chen, L. Goldfarb, M.I. Gomis, M. Huang, K. Leitzell, E. Lonnoy, J.B.R. Matthews, T.K. Maycock, T. Waterfield, O. Yelekçi, R. Yu, and B. Zhou (eds.)]. Cambridge University Press, Cambridge, United Kingdom and New York, NY, USA, pp. 673–816. Link to source: https://doi.org/10.1017/9781009157896.007

Foley, J. (2021) To stop climate change, time is as important as tech. February 20, 2021, Medium. Link to source: https://globalecoguy.org/to-stop-climate-change-time-is-as-important-as-tech-1be4beb7094a 

Hanson, M. (2024) What can we really expect from Elanco’s new Bovaer®?. Dairy Herd Management, June 24, 2024. Link to source: https://www.dairyherd.com/news/education/what-can-we-really-expect-elancos-new-bovaerr 

Herrmann, M. (2023) The rise of the ‘climate friendly’ cow. April 26, 2023, DeSmog. Link to source: https://www.desmog.com/2023/04/26/rise-of-the-climate-friendly-cow/ 

Hodge, I., Quille, P., & O’Connell, S. (2024). A review of potential feed additives intended for carbon footprint reduction through methane abatement in dairy cattle. Animals, 14(4), 568. Link to source: https://doi.org/10.3390/ani14040568

Krogsad, K. (2024) Dairy cow enteric carbon mitigation calculator. Link to source: https://view.officeapps.live.com/op/view.aspx?src=https%3A%2F%2Fdairy.osu.edu%2Fsites%2Fdairy%2Ffiles%2Fimce%2FVideos_and_Software%2FDairy%2520Carbon%2520Return%2520Calculator%25202.0.xlsx&wdOrigin=BROWSELINK 

Morse, C. (2024a) Rumin8 achieves first regulatory approval in New Zealand. July 22, 2024 Rumin8.com. Link to source: https://rumin8.com/rumin8-achieves-first-regulatory-approval-in-new-zealand/ 

Morse, C. (2024b) Rumin8 achieves first regulatory approval in Brazil. October 8, 2024 Rumin8.com. 
Link to source: https://rumin8.com/rumin8-achieves-first-regulatory-approval-in-brazil/  

Nabuurs, G-J., R. Mrabet, A. Abu Hatab, M. Bustamante, H. Clark, P. Havlík, J. House, C. Mbow, K.N. Ninan, A. Popp, S. Roe, B. Sohngen, S. Towprayoon, 2022: Agriculture, Forestry and Other Land Uses (AFOLU). In IPCC, 2022: Climate Change 2022: Mitigation of Climate Change. Contribution of Working Group III to the Sixth Assessment Report of the Intergovernmental Panel on Climate Change [P.R. Shukla, J. Skea, R. Slade, A. Al Khourdajie, R. van Diemen, D. McCollum, M. Pathak, S. Some, P. Vyas, R. Fradera, M. Belkacemi, A. Hasija, G. Lisboa, S. Luz, J. Malley, (eds.)]. Cambridge University Press, Cambridge, UK and New York, NY, USA. Link to source: https://doi.org/10.1017/9781009157926.009

Paddision, L. (2023) Bill Gates backs start-up tackling cow burps and farts. CNN.com, January 24, 2023. Link to source: https://www.cnn.com/2023/01/24/world/cows-methane-emissions-seaweed-bill-gates-climate-intl/index.html 

Roques, S., Martinez-Fernandez, G., Ramayo-Caldas, Y., Popova, M., Denman, S., Meale, S. J., & Morgavi, D. P. (2024). Recent advances in enteric methane mitigation and the long road to sustainable ruminant production. Annual Review of Animal Biosciences, 12(1), 321-343. Link to source: https://doi.org/10.1146/annurev-animal-021022-024931

Credits

Lead Fellow 

  • Eric Toensmeier

Internal Reviewer

  • Christina Swanson, Ph.D.
Speed of Action
Caveats
Additional Benefits
Risks
Consensus
Trade-offs
Action Word
Use
Solution Title
Feed Additives
Classification
Keep Watching
Updated Date
Coming Soon Label
Coming Soon

Deploy Micro Wind Turbines

Sector
Electricity
Image
Coming Soon
Off
Summary

Micro wind turbines harness natural wind to generate electricity. They can operate independently or be connected to a centralized electricity grid, and are useful for small-scale commercial, agricultural, and residential applications. Advantages include reducing reliance on fossil fuels for electricity generation, potential expansion of electrification to rural areas, and improvement in energy equity and independence worldwide. Disadvantages include unpredictable and unreliable electricity generation (especially in urban locations), high cost, and noise pollution. Based on our assessment, we will “Keep Watching” this potential solution.

Description for Social and Search
Micro wind turbines harness natural wind to generate electricity. They can operate independently or be connected to a centralized electricity grid, and are useful for small-scale commercial, agricultural, and residential applications.
Overview

What is our assessment? 

Based on our analysis, micro wind turbines (MWTs) are a promising technology for reducing emissions, but given the limited potential for global adoption and variable financial viability, they do not meet our threshold for global climate solutions (<0.1 Gt CO₂‑eq/yr ). Despite the low climate impact and high costs, Deploy Micro Wind Turbines is an important solution for achieving energy equity. Based on our assessment, we will “Keep Watching” this potential solution.

Plausible Could it work? Yes
Ready Is it ready? Yes
Evidence Are there data to evaluate it? Yes
Effective Does it consistently work? Yes
Impact Is it big enough to matter? No
Risk Is it risky or harmful? No
Cost Is it cheap? No

What is it? 

MWTs are small-scale turbines that rely on natural wind to generate electricity, charge batteries, or power equipment. Specific definitions for MWTs vary from country to country. Our analysis assessed energy production and GHG emissions reduction potential for wind turbines rated to generate a maximum of 100 kW of electrical power. MWTs are actively used for a variety of applications, including telecommunications, lighting, and agriculture. The total installed capacity for MWTs globally as of 2023 is nearly 1.8 GW or 0.002% of utility-scale onshore wind capacity. MWTs are most commonly used in rural settings.

Does it work? 

When connected to a regional or national electricity grid, MWTs can reduce baseline electricity grid emissions by reducing reliance on fossil fuel energy sources. Off-grid MWTs, which accounted for more than 90% of commercial sales in 2019, help electrify industrial and agricultural processes that otherwise may have been powered by fossil fuels, such as diesel or natural gas. Energy production from MWTs is highly dependent on the availability of consistent wind speeds, with the majority of turbines requiring an average wind speed of around 5 m/s to generate electricity. As long as sufficient wind resources are available, MWTs are effective at producing electricity to meet local energy demand and reduce reliance on fossil fuels.

Why are we excited? 

MWTs reduce reliance on fossil fuels for electricity generation, whether they are connected to an electric grid or isolated for local energy use. For grid-connected systems, more available renewable energy sources reduce the need for fossil fuel–based energy generation to meet demand. MWTs isolated from the electricity grid still reduce the local carbon footprint of a household, farm, or commercial building. Globally, the average household consumes approximately 17,000 kWh of electricity annually. Depending on the size of the turbine, local wind energy can produce 1,000–20,000 kWh/yr. Fluctuations in wind speed throughout the day and year can lead to unreliable power output, but this risk can be reduced by integrating batteries or hybrid electricity generation systems, such as combining wind and solar photovoltaics (PV). In addition to emissions reduction, MWTs are crucial tools for expanding electricity access worldwide. Since MWTs can operate independently of an electric grid, they can electrify rural areas where transmission lines are nonexistent or challenging to install. For example, many populations in Africa live in remote areas that could be well-served by installing MWTs to power telecommunications and other local electrification needs. Increasing interest in smart energy systems and Internet of Things technologies presents promising future applications for MWTs.

Why are we concerned? 

While MWTs show potential for expanding electrification, they have a number of limitations compared to other small-scale renewable energy technologies, like solar photovoltaics. First, real-world performance due to wind speed variability and turbulence at installation sites can be unpredictable and is often substantially lower than manufacturers’ power ratings. Second, life-cycle emissions from manufacturing and installation can be more than five times higher for small-scale wind than for large, multi-MW turbines. Energy payback times – the time period for the MWT to generate enough clean energy to offset the energy used during manufacturing and installation – can be long, sometimes exceeding the 20– to 25-year lifetime of the turbine. Third, MWTs are expensive, with up-front costs ranging from approximately US$3,000/kW to more than US$10,000/kW. Even after including financial incentives to partially offset high upfront costs, the levelized cost of electricity (LCOE) for residential MWTs in the United States was estimated at US$0.28/kWh. Not only was this higher than average U.S. residential electricity rates (US$0.1–0.24/kWh), but it was also more than double the LCOE for residential solar PV (US$0.12/kWh). Finally, noise pollution and vibration are environmental concerns for the wide-scale adoption of MWTs in urban areas. In addition, MWT performance can be poor in urban and suburban areas because buildings and other obstacles disrupt airflow. There is a general consensus in the scientific community and commercial market that MWTs are worthwhile electricity sources for many agricultural and industrial applications where cost is less prohibitive, but they remain a niche technology due to uncertain global economic viability and lack of reliable power generation in suburban and urban areas.

Solution in Action

References

Bianchini, A., Bangga, G., Baring-Gould, I., Croce, A., Cruz, J. I., Damiani, R., Erfort, G., Simao Ferreira, C., Infield, D., Nayeri, C. N., Pechlivanoglou, G., Runacres, M., Schepers, G., Summerville, B., Wood, D., & Orrell, A. (2022). Current status and grand challenges for small wind turbine technology. Wind Energy Science, 7(5), 2003–2037. Link to source: https://doi.org/10.5194/wes-7-2003-2022

Global Wind Energy Council. (2024). Global Wind Report 2024. Link to source: https://www.gwec.net/reports/globalwindreport

Ismail, K. A. R., Lino, F. A. M., Baracat, P. A. A., De Almeida, O., Teggar, M., & Laouer, A. (2025). Wind Turbines for Decarbonization and Energy Transition of Buildings and Urban Areas: A Review. Advances in Environmental and Engineering Research, 06(01), 1–59. Link to source: https://doi.org/10.21926/aeer.2501013

Jurasz, J., Bochenek, B., Wieczorek, J., Jaczewski, A., Kies, A., & Figurski, M. (2025). Energy potential and economic viability of small-scale wind turbines. Energy, 322, 135608. Link to source: https://doi.org/10.1016/j.energy.2025.135608

Pacific Northwest National Laboratory. (2024). Distributed wind market report: 2024 edition (PNNL-36057). Wind Energy Technologies Office, Office of Energy Efficiency and Renewable Energy of the U.S. Department of Energy. Link to source: https://www.pnnl.gov/distributed-wind/market-report 

Pitsilka E. & Kasiteropoulou D., (2024). Wind turbines farms applications. A mini review. International Journal of Research in Engineering and Science (IJRES), 12(2), 36-41. Link to source: https://www.ijres.org/papers/Volume-12/Issue-2/12023641.pdf 

Rosato, A., Perrotta, A., & Maffei, L. (2024). Commercial small-scale horizontal and vertical wind turbines: A comprehensive review of geometry, materials, costs and performance. Energies, 17(13), 3125. Link to source: https://doi.org/10.3390/en17133125

Small-Scale Wind Turbines. (2017). In P. A. B. James & A. S. Bahaj, Wind Energy Engineering (pp. 389–418). Elsevier. Link to source: https://doi.org/10.1016/b978-0-12-809451-8.00019-9

Taylor, J., Eastwick, C., Lawrence, C., & Wilson, R. (2013). Noise levels and noise perception from small and micro wind turbines. Renewable Energy, 55, 120–127. Link to source: https://doi.org/10.1016/j.renene.2012.11.031

Tummala, A., Velamati, R. K., Sinha, D. K., Indraja, V., & Krishna, V. H. (2016). A review on small scale wind turbines. Renewable and Sustainable Energy Reviews, 56, 1351–1371. Link to source: https://doi.org/10.1016/j.rser.2015.12.027

Wang, H., Xiong, B., Zhang, Z., Zhang, H., & Azam, A. (2023). Small wind turbines and their potential for internet of things applications. iScience, 26(9), 107674. Link to source: https://doi.org/10.1016/j.isci.2023.107674

World Wind Energy Association. (2025). WWEA Annual Report 2024. World Wind Wind Energy Association. Link to source: https://wwindea.org/AnnualReport2024 

Zajicek, L., Drapalik, M., Kral, I., & Liebert, W. (2023). Energy efficiency and environmental impacts of horizontal small wind turbines in Austria. Sustainable Energy Technologies and Assessments, 59, 103411. Link to source: https://doi.org/10.1016/j.seta.2023.103411 

Credits

Lead Fellow

  • Megan Matthews, Ph.D.

Internal Reviewer

  • Christina Swanson, Ph.D.
Speed of Action
Caveats
Additional Benefits
Risks
Consensus
Trade-offs
Action Word
Deploy
Solution Title
Micro Wind Turbines
Classification
Keep Watching
Updated Date
Coming Soon Label
Coming Soon

Boost Appliance & Equipment Efficiency

Image
Image
Washing machines on conveyer belts in a factory
Coming Soon
Off
Summary

Boosting the efficiency of appliances and equipment cuts GHG emissions by reducing the amount of electricity used to operate these devices. Efficiency improvements also lead to reduced peak demand, less strain on the electric grid, and potential utility savings for homeowners due to reduced electricity use. Despite this potential, the increase in the total number of households and average ownership of appliances, especially in low- and middle-income countries, has offset the impact of efficiency gains and resulted in increased electricity consumption from devices globally. We conclude that Boost Appliance & Equipment Efficiency is “Worthwhile” because it functionally reduces the energy consumed by these devices, but significant leaps in efficiency and shifts in user behavior are needed to realize its full potential as a climate solution.

Description for Social and Search
Boosting the efficiency of appliances and equipment cuts GHG emissions by reducing the amount of electricity used to operate these devices.
Overview

What is our assessment?

Based on our analysis, boosting appliance and equipment efficiency is a promising strategy for reducing GHG emissions, but significant leaps in efficiency and shifts in user behavior are needed to counteract the rebound effect and realize its impact. This potential climate solution is “Worthwhile.”

Plausible Could it work? Yes
Ready Is it ready? Yes
Evidence Are there data to evaluate it? Yes
Effective Does it consistently work? Yes
Impact Is it big enough to matter? No
Risk Is it risky or harmful? No
Cost Is it cheap? Yes

What is it?

Appliance and equipment efficiency typically refers to larger devices in residential buildings that run on electricity, such as refrigerators, freezers, washing machines, dishwashers, dryers, and televisions. Energy-efficient appliances or equipment consume less electricity when operated than do inefficient devices. Therefore, boosting appliance efficiency reduces the CO₂, methane, and nitrous oxide emissions from electricity generation. As of 2022, the energy consumed by household appliances globally was more than twice the total energy used to cool both residential and nonresidential buildings, and about half the energy used for heating. To drive higher efficiency for these devices, various countries have established regional energy efficiency standards, rating systems, and labeling programs. Currently, homeowners can readily access a variety of options on the appliance market, and less efficient devices can easily be replaced. However, income levels, especially in low- and middle-income countries, may affect people’s actual ability to purchase certain appliances, although these devices are increasingly becoming cheaper.

Does it work?

Improving the efficiency of appliances and equipment functionally reduces the energy required to run these devices. Various field studies have demonstrated the effect of efficiency gains on lowering electricity consumption. However, the rise in appliance ownership per household and the growing total number of households have offset the collective climate impact expected from efficiency improvements. Globally, the number of households grew from about 1.5 billion in 2000 to 2.2 billion in 2021. Considering the concurrent increase in the global average units owned per household, the number of appliances in use has essentially doubled over the same period. For example, we estimate that over two decades, the number of televisions owned grew from about 1.4 to 2.8 billion units, refrigerators grew from 0.9 to 1.7 billion units, and washing machines grew from about 0.6 to 1.1 billion units. This growth resulted in rising electricity consumption by appliances annually, from 2,880 TWh in 2000 to 5,734 TWh in 2022, which translates to a 99% global increase, largely driven by the Asia-Pacific region.

Why are we excited?

Boosting appliance and equipment efficiency allows homeowners to realize operational cost savings as a result of lower electricity consumption and utility bills. Compared with less efficient devices, using appliances with higher efficiency ratings functionally reduces peak electricity demand, alleviating strain on the electric grid. The advent of smart devices and the Internet of Things (IoT) also helps to automate the operation of these appliances, optimizing their runtime while minimizing the energy consumed. Initial purchasing costs are also declining, making efficient appliances more accessible and affordable. 

Access to high-efficiency appliances also yields additional benefits. For example, access to energy-efficient refrigerators and freezers means that food waste can be minimized with less energy, leading to better food security. Similarly, multimedia equipment, such as television sets, offers access to critical information. Further cuts in GHG emissions are also possible as the electric grid transitions to renewable energy sources.

Why are we concerned?

Despite the potential benefits, the efficiency improvements in household appliances and equipment have not effectively translated into a positive climate impact. This is largely due to the significant rebound effect, or the increase in appliances owned by households as these devices become cheaper and more efficient. Considering the role of appliances in providing a greater quality of life, limiting the increase in appliance purchases is dismissible. The markets for appliances and equipment in many countries also still consist of pre-owned devices, which are less efficient. Some countries, such as Ghana, have established legislation to prevent the importation of pre-owned devices. This approach ensures that the appliances bought by homeowners will run on the newest, most efficient technologies. Recent findings from regions with stringent energy rating systems also suggest that regulations and programs can lead to a 50% cut in the electricity consumed by appliances. Global initiatives, such as the United for Efficiency (U4E) partnership, which seeks to shift appliance markets in low- and middle-income countries into high-efficiency devices, are increasingly needed for the potential energy savings to be realized as a climate solution.

Solution in Action

References

CLASP. (2023). Net zero heroes: Scaling efficient appliances for climate change mitigation, adaptation & resilience. CLASP. Link to source: https://www.clasp.ngo/wp-content/uploads/2024/01/CLASP-COP28-FullReport-V8-012424.pdf

Darshan, A., Girdhar, N., Bhojwani, R., Rastogi, K., Angalaeswari, S., Natrayan, L., & Paramasivam, P. (2022). Energy audit of a residential building to reduce energy cost and carbon footprint for sustainable development with renewable energy sources. Advances in Civil Engineering, 2022(1), 4400874. Link to source: https://doi.org/10.1155/2022/4400874

de Ayala, A., Foudi, S., Solà, M. d. M., López-Bernabé, E., & Galarraga, I. (2020). Consumers’ preferences regarding energy efficiency: A qualitative analysis based on the household and services sectors in Spain. Energy Efficiency, 14(1), 3. Link to source: https://doi.org/10.1007/s12053-020-09921-0

de Ayala, A., & Solà, M. d. M. (2022). Assessing the EU energy efficiency label for appliances: Issues, potential improvements and challenges. Energies, 15(12), 4272. Link to source: https://doi.org/10.3390/en15124272

IEA. (2022, 22 September 2022). Worldwide average household ownership of appliances and number of households in the net zero scenario, 2000–2030. Retrieved April 20, 2025, from Link to source: https://www.iea.org/data-and-statistics/charts/worldwide-average-household-ownership-of-appliances-and-number-of-households-in-the-net-zero-scenario-2000-2030

IEA. (2023). Space cooling: Net zero emissions guide. IEA. Link to source: https://www.iea.org/reports/space-cooling-2

IEA/4E TCP. (2021). Achievements of energy efficiency appliance and equipment standards and labeling programmes. IEA. Link to source: https://www.iea.org/reports/achievements-of-energy-efficiency-appliance-and-equipment-standards-and-labelling-programmes

Lane, K., & Camarasa, C. (2023, 11 July 2023). Appliances and equipment. IEA. Retrieved May 13, 2025, from Link to source: https://www.iea.org/energy-system/buildings/appliances-and-equipment

Stasiuk, K., & Maison, D. (2022). The influence of new and old energy labels on consumer judgements and decisions about household appliances. Energies, 15(4), 1260. Link to source: https://doi.org/10.3390/en15041260

United for Efficiency (U4E). (2025). About the partnership. United Nations Environment Program (UNEP). Retrieved May 15, 2025, from Link to source: https://united4efficiency.org/about-the-partnership/ 

Credits

Lead Fellow

  • Henry Igugu, Ph.D.

Contributors

  • Zoltan Nagy, Ph.D.
  • Amanda D. Smith, Ph.D.

Internal Reviewer

  • Christina Swanson, Ph.D.
Speed of Action
Caveats
Additional Benefits
Risks
Consensus
Trade-offs
Action Word
Boost
Solution Title
Appliance & Equipment Efficiency
Classification
Worthwhile
Updated Date
Coming Soon Label
Coming Soon

Use Low-Flow Fixtures

Image
Image
Water streaming from shower head
Coming Soon
Off

Key Takeaways

  • Low-flow showerheads and faucet aerators reduce the volume of hot water used. This reduces GHG emissions from heating, treating and pumping water. 
  •  Aerators for faucets and low-flow showerheads are readily available and relatively low-cost investments that users can install themselves. 
  • Adopting low-flow fixtures reduces utility bills, improves water resource management, and can defer infrastructure expansion projects.
  • Even with widespread adoption, low-flow fixtures would have a relatively small impact on GHG emissions and permanence may be a concern due to the ease with which they can be replaced.
Summary

Low-flow fixtures reduce GHG emissions by reducing the volume of hot water used and therefore reducing the emissions from the energy used to heat that water (Kenway et al., 2023). Reduced water usage also leads to fewer emissions from treating and pumping water for domestic use (Yateh et al., 2024). Low-flow fixtures are low-cost and simple to install. They generate utility bill savings for households and support sustainable water resource management (Maas et al., 2024). Modern quality low-flow fixtures have resolved many of the performance issues of earlier versions (Environmental Protection Agency [EPA], 2022). Even with significant adoption, however, the total emissions reduction potential for low-flow fixtures is relatively small. We conclude that, despite its modest emissions impact, Use Low Flow Fixtures is “Worthwhile” due to its relative ease, low cost, and additional benefits.

Description for Social and Search
Low-flow fixtures reduce GHG emissions by reducing the volume of hot water that is used and therefore reducing the emissions from the energy used to heat that water.
Overview

What is our assessment?

Based on our analysis, using low-flow fixtures is a cost-effective strategy for reducing water consumption, but has only a modest impact on GHG emissions. Therefore, this climate solution is “Worthwhile.”

Plausible Could it work? Yes
Ready Is it ready? Yes
Evidence Are there data to evaluate it? Yes
Effective Does it consistently work? Yes
Impact Is it big enough to matter? No
Risk Is it risky or harmful? No
Cost Is it cheap? Yes

What is it?

Low-flow fixtures lessen the total consumption of water by reducing flow rates through a household faucet or shower (EPA, 2022). Less hot water use means fewer emissions from the energy source used to heat the water, and it also means fewer emissions from pumping and treating tap water (Kenway et al., 2023; Paraschiv et al., 2023; Yateh et al., 2024). Heating water for showers, sinks, and other domestic appliances is one of the largest sources of energy use in residential buildings after space heating, especially in advanced economies (International Energy Agency [IEA], 2025). Modern low-flow showerheads can produce comparable pressure and coverage to traditional showerheads through aeration and/or laminar flow (EPA, 2022). Aerators for faucets and low-flow showerheads are relatively low-cost investments that users can install themselves.

Does it work?

Low-flow fixtures reduce emissions from heating, delivering, and treating water by reducing hot water consumption. There is ample evidence for water savings with low-flow fixtures, as well as for the linkage between quantity and source of energy used for water heating and GHG emissions (EPA, 2022; Kenway et al., 2023; Pomianowski et al., 2020). Additionally, there is substantial research on the emissions from treating and pumping water, which can be reduced through water conservation (Paraschiv et al., 2023; Yateh et al., 2024). Low-flow fixtures are readily available, and performance labels are available to help consumers select quality products (Dieu-Hang et al., 2017; EPA, 2022).

Why are we excited?

Low-flow fixtures conserve water, which reduces emissions, reduces energy demand, saves consumers money, and helps with sustainable water resource management. Households that adopt low-flow fixtures can enjoy significant utility bill savings because these fixtures reduce both water consumption and the energy used to heat water in the home (Kenway et al., 2023; Maas et al., 2024). Faucet aerators also produce a smoother water stream with less splashing, and along with low-flow showerheads, are low-cost and simple to install. Household water conservation practices, such as low-flow fixtures, can help with regional sustainable water resource management and defer infrastructure expansion projects (Maas et al., 2024). This is particularly important in areas where water resources are increasingly strained due to climate change, growing populations, and other factors. In some regions, community water conservation efforts have had measurable impacts on water treatment costs, resulting in lower water rates for consumers (Alliance for Water Efficiency, 2017).  

Why are we concerned?

Even with widespread adoption, low-flow fixtures would have a relatively small impact on GHG emissions (Kenway et al., 2023). Moreover, the low cost and ease of replacement mean that low-flow fixtures can be easily reverted to less efficient fixtures, eliminating the emissions impact and other benefits. Lastly, although modern quality low-flow showerheads are comparable to traditional fixtures (EPA, 2022), the poor quality of early low-flow showerheads may have contributed to decreasing levels of adoption in some areas (Tomberg, 2024).

Solution in Action

References

Alliance for water efficiency. (2017). Conservation keeps rates low in Tucson, Arizona [report]. Link to source: https://allianceforwaterefficiency.org/wp-content/uploads/2017/06/AWE_Tucson_ConsRates_FactSheet_final.pdf

Dieu-Hang, T., Grafton, R. Q., Martínez-Espiñeira, R., & Garcia-Valiñas, M. (2017). Household adoption of energy and water-efficient appliances: An analysis of attitudes, labelling and complementary green behaviours in selected OECD countries. Journal of Environmental Management, 197, 140–150. Link to source: https://doi.org/10.1016/j.jenvman.2017.03.070

Environmental protection agency. (2022). WaterSense performance overview: Showerheads. Link to source: https://www.epa.gov/system/files/documents/2022-05/ws-products-perfomance-showerheads.pdf

International Energy Agency. (2025). Total energy demand in the residential sector, by end-use, advanced economies and emerging economies. 2023. Link to source: https://www.iea.org/data-and-statistics/charts/total-energy-demand-in-the-residential-sector-by-end-use-advanced-economies-and-emerging-economies-2023  

Kenway, S. J., Pamminger, F., Yan, G., Hall, R., Lam, K. L., Skinner, R., Olsson, G., Satur, P., & Allan, J. (2023). Opportunities and challenges of tackling Scope 3 “Indirect” emissions from residential hot water. Water Research X, 21, Article 100192. Link to source: https://doi.org/10.1016/j.wroa.2023.100192

Maas, A., Puri, R., & Goemans, C. (2024). A review of residential water conservation policies and attempts to measure their effectiveness. PLOS Water, 3(8), Article e0000278. Link to source: https://doi.org/10.1371/journal.pwat.0000278

Paraschiv, S., Paraschiv, L. S., & Serban, A. (2023). An overview of energy intensity of drinking water production and wastewater treatment. Energy Reports, 9, 118–123. Link to source: https://doi.org/10.1016/j.egyr.2023.08.074

Pomianowski, M. Z., Johra, H., Marszal-Pomianowska, A., & Zhang, C. (2020). Sustainable and energy-efficient domestic hot water systems: A review. Renewable and Sustainable Energy Reviews, 128, 109900. Article 109900. Link to source: https://doi.org/10.1016/j.rser.2020.109900

Tomberg, L. (2024). Resource conservation through improved efficiency, behavioral change, or both: Willingness to pay for (smart) efficient shower heads. Resources, Conservation and Recycling, 203, Article 107387. Link to source: https://doi.org/10.1016/j.resconrec.2023.107387

Yateh, M., Li, F., Tang, Y., Li, C., & Xu, B. (2024). Energy consumption and carbon emissions management in drinking water treatment plants: A systematic review. Journal of Cleaner Production, 437, Article 140688. Link to source: https://doi.org/10.1016/j.jclepro.2024.140688

Credits

Lead Fellow

  • Heather McDiarmid, Ph.D.

Internal Reviewer

  • Christina Swanson, Ph.D.
Speed of Action
Caveats
Additional Benefits
Risks
Consensus
Trade-offs
Action Word
Use
Solution Title
Low-Flow Fixtures
Classification
Worthwhile
Updated Date
Coming Soon Label
Coming Soon
Subscribe to