| Deploy |
Alternative Insulation Materials |
256Highly Recommended
|
Cut Emissions |
1
Buildings & Industry |
Improve Materials |
insulation units of 100 m² and 1 m²·K/W
|
1.59 |
1.4×10⁷/yr |
2.9×10⁷ to 7.3×10⁷/yr |
0.05 to 0.12 |
-121.00
|
CO₂,
F-gas |
195Emergency Brake |
|
| Deploy |
Alternative Refrigerants |
256Highly Recommended
|
Cut Emissions |
1
Buildings & Industry |
Improve Materials |
kt high-GWP refrigerant phased out
|
460,000/yr |
440 |
5,500 to 5,900 |
2.50 to 2.70 |
50.00
|
F-gases |
195Emergency Brake |
|
| Improve |
Annual Cropping |
256Highly Recommended
|
Cut Emissions, Remove Carbon |
9
FALO & Nature-Based Carbon Removal |
Shift Agriculture Practices |
ha cropland
|
1.8/yr |
2.674×10⁸ |
3.317×10⁸ to 7.0×10⁸ |
0.43 to 1.09 |
47.80
|
CO₂
, N₂O |
197Delayed |
|
| Increase |
Carpooling |
256Highly Recommended
|
Cut Emissions |
6
Transportation |
Shift to Alternatives |
million pkm avoided
|
54.71 |
0/yr |
4.638×10⁶ to 1.752×10⁷/yr |
0.25 to 0.96 |
-3119.00
|
CO₂
, CH₄, N₂O
|
196Gradual |
|
| Improve |
Cement Production: Clinker substitution |
256Highly Recommended
|
Cut Emissions |
5
Industry, Materials & Waste |
Improve Materials |
Mt clinker avoided |
690,000 |
980/yr |
1,000 to 2,000/yr |
0.70 to 1.00 |
-30.00
|
CO₂
|
196Gradual |
|
| Improve |
Cement Production: Alternative fuels |
256Highly Recommended
|
Cut Emissions |
5
Industry, Materials & Waste |
Improve Materials |
Mt cement produced using alternative fuels |
96,000 |
300/yr |
610 to 2,000/yr |
0.06 to 0.20 |
-50.00
|
CO₂
|
196Gradual |
|
| Improve |
Cement Production: Efficiency upgrades |
256Highly Recommended
|
Cut Emissions |
5
Industry, Materials & Waste |
Improve Materials |
GJ thermal energy input reduced from current levels |
0.085 |
0/yr |
8.86×10⁸ to 1.18×10⁹/yr |
0.08 to 0.10 |
-60.00
|
CO₂
|
196Gradual |
|
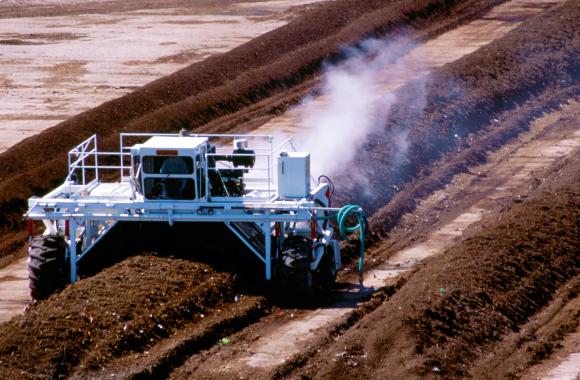
| Increase |
Centralized Composting |
256Highly Recommended
|
Cut Emissions |
5
Industry, Materials & Waste |
Use Waste as a Resource |
t organic waste
|
3.9 |
7.8×10⁷/yr |
2.009×10⁸ to 3.01×10⁸/yr |
0.78 to 1.20 |
10.00
|
CO₂,
CH₄
|
195Emergency Brake |
|
| Deploy |
Clean Cooking |
256Highly Recommended
|
Cut Emissions |
0
Buildings |
Shift Energy Sources |
household switching to cleaner cooking
|
2.3/yr |
|
4.2×10⁸ to 4.2×10⁸ |
0.98 to 0.98 |
27.00
|
CO₂
, CH₄ |
195Emergency Brake |
|
| Protect |
Coastal Wetlands: Mangrove ecosystems |
256Highly Recommended
|
Cut Emissions |
9
FALO & Nature-Based Carbon Removal |
Protect & Manage Ecosystems |
ha protected |
7.88/yr |
2.94×10⁶ |
7.85×10⁶ to 1.1×10⁷ |
0.06 to 0.09 |
1.00
|
CO₂
|
195Emergency Brake |
|
| Protect |
Coastal Wetlands: Salt marsh ecosystems |
257Worthwhile
|
Cut Emissions |
9
FALO & Nature-Based Carbon Removal |
Protect & Manage Ecosystems |
ha protected |
4.78/yr |
1.24×10⁶ |
3.75×10⁶ to 5.25×10⁶ |
0.02 to 0.03 |
2.00
|
CO₂
|
195Emergency Brake |
|
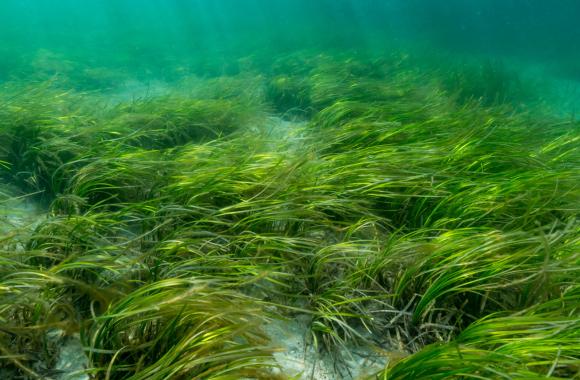
| Protect |
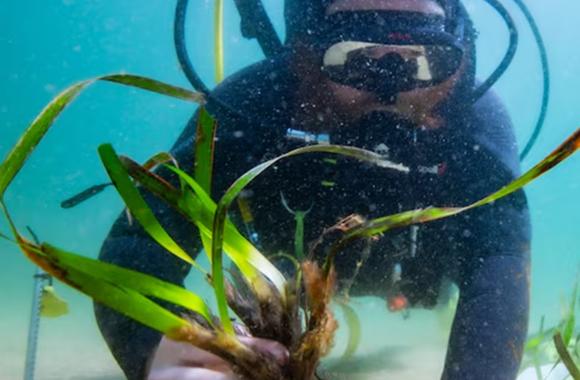
Coastal Wetlands: Seagrass ecosystems |
256Highly Recommended
|
Cut Emissions |
9
FALO & Nature-Based Carbon Removal |
Protect & Manage Ecosystems |
ha protected |
3.56/yr |
3.86×10⁶ |
1.57×10⁷ to 2.2×10⁷ |
0.06 to 0.08 |
-6.00
|
CO₂
|
195Emergency Brake |
|
| Improve |
Diets |
256Highly Recommended
|
Cut Emissions |
8
Food, Agriculture, Land & Ocean (FALO) |
Curb Growing Demands |
kg avoided ruminant meat
|
0.065 |
0/yr |
2.14×10¹⁰ to 4.29×10¹⁰/yr |
1.40 to 2.80 |
-8.54
|
CO₂,
CH₄
, N₂O
|
195Emergency Brake |
|
| Deploy |
Distributed Solar PV |
256Highly Recommended
|
Cut Emissions |
3
Electricity |
Shift Production |
MW installed capacity
|
650/yr |
708,000 |
4.3×10⁶ to 5.3×10⁶ |
2.80 to 3.50 |
|
CO₂
, CH₄, N₂O, BC |
196Gradual |
|
| Mobilize |
Electric Bicycles: Private electric bicycles |
256Highly Recommended
|
Cut Emissions |
6
Transportation |
Electrify Vehicles |
1,000 electric bicycles |
110.5/yr |
277,600 |
421,300 to 1.01×10⁶ |
0.05 to 0.11 |
-1748.00
|
CO₂
, CH₄, N₂O
|
196Gradual |
|
| Mobilize |
Electric Bicycles: Shared electric bicycles |
257Worthwhile
|
Cut Emissions |
6
Transportation |
Electrify Vehicles |
1,000 electric bicycles |
14.44/yr |
2,000 |
22,010 to 69,260 |
0.00 to 0.00 |
22860.00
|
CO₂
, CH₄, N₂O, BC |
196Gradual |
|
| Mobilize |
Electric Cars |
256Highly Recommended
|
Cut Emissions |
6
Transportation |
Electrify Vehicles |
million passenger kilometers (million pkm)
|
48.52 |
818,900/yr |
2.602×10⁷ to 4.731×10⁷/yr |
1.26 to 2.30 |
-1019.00
|
CO₂
, CH₄, N₂O
|
196Gradual |
|
| Mobilize |
Electric Seated Scooters & Motorcycles |
256Highly Recommended
|
Cut Emissions |
6
Transportation |
Electrify Vehicles |
million passenger kilometers (million pkm)
|
54.4 |
865,000/yr |
5.642×10⁶ to 7.522×10⁶/yr |
0.31 to 0.41 |
-382.00
|
CO₂
, CH₄, N₂O
|
196Gradual |
|
| Reduce |
Food Loss & Waste |
256Highly Recommended
|
Cut Emissions |
8
Food, Agriculture, Land & Ocean (FALO) |
Curb Growing Demands |
t reduced FLW
|
2.82 |
|
4.375×10⁸ to 8.75×10⁸/yr |
1.23 to 2.47 |
-193.99
|
CO₂
, CH₄
, N₂O
|
195Emergency Brake |
|
| Protect |
Forests: Boreal |
256Highly Recommended
|
Cut Emissions, Remove Carbon |
9
FALO & Nature-Based Carbon Removal |
Protect & Manage Ecosystems |
ha protected |
0.299/yr |
4.67×10⁸ |
8.47×10⁸ to 8.61×10⁸ |
0.25 to 0.26 |
2.00
|
CO₂
|
195Emergency Brake |
|
| Restore |
Forests: Boreal |
256Highly Recommended
|
Remove Carbon |
10
Nature-Based Carbon Removal |
Restore & Manage Ecosystems |
ha under restoration |
10.21/yr |
|
9.7×10⁶ to 1.46×10⁷ |
0.10 to 0.15 |
53.00
|
CO₂
|
197Delayed |
|
| Protect |
Forests: Temperate |
256Highly Recommended
|
Cut Emissions, Remove Carbon |
9
FALO & Nature-Based Carbon Removal |
Protect & Manage Ecosystems |
ha protected |
1.403/yr |
1.59×10⁸ |
2.04×10⁸ to 3.78×10⁸ |
0.29 to 0.53 |
2.00
|
CO₂
|
195Emergency Brake |
|
| Restore |
Forests: Temperate |
256Highly Recommended
|
Remove Carbon |
10
Nature-Based Carbon Removal |
Restore & Manage Ecosystems |
ha under restoration |
12.11/yr |
|
9.5×10⁶ to 1.43×10⁷ |
0.12 to 0.17 |
53.00
|
CO₂
|
197Delayed |
|
| Restore |
Forests: Subtropical |
256Highly Recommended
|
Remove Carbon |
10
Nature-Based Carbon Removal |
Restore & Manage Ecosystems |
ha under restoration |
11.78/yr |
|
1.7×10⁶ to 2.6×10⁶ |
0.02 to 0.03 |
53.00
|
CO₂
|
197Delayed |
|
| Protect |
Forests: Subtropical |
256Highly Recommended
|
Cut Emissions, Remove Carbon |
9
FALO & Nature-Based Carbon Removal |
Protect & Manage Ecosystems |
ha protected |
2.204/yr |
1.12×10⁸ |
1.26×10⁸ to 2.19×10⁸ |
0.28 to 0.48 |
2.00
|
CO₂
|
195Emergency Brake |
|
| Restore |
Forests: Tropical |
256Highly Recommended
|
Remove Carbon |
10
Nature-Based Carbon Removal |
Restore & Manage Ecosystems |
ha under restoration |
17.63/yr |
|
2.74×10⁷ to 4.11×10⁷ |
0.48 to 0.73 |
53.00
|
CO₂
|
197Delayed |
|
| Protect |
Forests: Tropical |
256Highly Recommended
|
Cut Emissions, Remove Carbon |
9
FALO & Nature-Based Carbon Removal |
Protect & Manage Ecosystems |
ha protected |
1.489/yr |
9.36×10⁸ |
1.12×10⁹ to 1.577×10⁹ |
1.67 to 2.35 |
2.00
|
CO₂
|
195Emergency Brake |
|
| Protect |
Grasslands & Savannas: Boreal |
256Highly Recommended
|
Cut Emissions and Remove Carbon |
9
FALO & Nature-Based Carbon Removal |
Protect & Manage Ecosystems |
ha of grassland or savanna protected |
0.9/yr |
3.386×10⁸ |
3.386×10⁸ to 3.731×10⁸ |
0.31 to 0.34 |
-1.58
|
CO₂,
N₂O
|
195Emergency Brake |
|
| Protect |
Grasslands & Savannas: Temperate |
256Highly Recommended
|
Cut Emissions and Remove Carbon |
9
FALO & Nature-Based Carbon Removal |
Protect & Manage Ecosystems |
ha of grassland or savanna protected |
0.54/yr |
1.722×10⁸ |
3.617×10⁸ to 5.064×10⁸ |
0.20 to 0.27 |
-1.58
|
CO₂,
N₂O
|
195Emergency Brake |
|
| Protect |
Grasslands & Savannas: Subtropical |
256Highly Recommended
|
Cut Emissions and Remove Carbon |
9
FALO & Nature-Based Carbon Removal |
Protect & Manage Ecosystems |
ha of grassland or savanna protected |
0.13/yr |
2.93×10⁸ |
3.132×10⁸ to 4.385×10⁸ |
0.04 to 0.06 |
-1.58
|
CO₂,
N₂O
|
195Emergency Brake |
|
| Protect |
Grasslands & Savannas: Tropical |
256Highly Recommended
|
Cut Emissions and Remove Carbon |
9
FALO & Nature-Based Carbon Removal |
Protect & Manage Ecosystems |
ha of grassland or savanna protected |
0.06/yr |
5.826×10⁸ |
5.826×10⁸ to 7.059×10⁸ |
0.03 to 0.04 |
-1.58
|
CO₂,
N₂O
|
195Emergency Brake |
|
| Use |
Heat Pumps |
256Highly Recommended
|
Cut Emissions |
2
Buildings & Electricity |
Enhance Efficiency, Shift Energy Sources |
heat pump systems
|
0.97/yr |
1.3×10⁸ |
6.0×10⁸ to 9.6×10⁸ |
0.58 to 0.93 |
-200.00
|
CO₂
, CH₄, N₂O
|
196Gradual |
|
| Mobilize |
Hybrid Cars |
256Highly Recommended
|
Cut Emissions |
6
Transportation |
Enhance Efficiency |
million passenger kilometers (million pkm)
|
28.97 |
1.318×10⁶/yr |
1.183×10⁷ to 2.957×10⁷/yr |
0.34 to 0.86 |
247.00
|
CO₂
, N₂O
|
196Gradual |
|
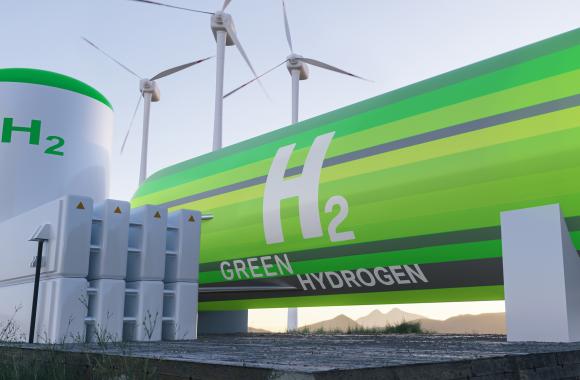
| Deploy |
Industrial Green Hydrogen |
256Highly Recommended
|
Cut Emissions |
5
Industry, Materials & Waste |
Improve Processes |
kg of hydrogen produced
|
0.012/yr |
1.3×10⁸/yr |
2.6×10¹⁰ to 5.0×10¹⁰/yr |
0.31 to 0.60 |
|
CO₂
,CH₄, N₂O
|
196Gradual |
|
| Improve |
Landfill Management: Methane capture |
256Highly Recommended
|
Cut Emissions |
5
Industry, Materials & Waste |
Cut Fugitive Emissions |
Mt methane abated |
2.79×10⁷ |
1.59/yr |
4.5 to 34.78/yr |
0.13 to 0.97 |
-6.42
|
CH₄, N₂O |
195Emergency Brake |
|
| Improve |
Landfill Management: Biocovers |
256Highly Recommended
|
Cut Emissions |
5
Industry, Materials & Waste |
Cut Fugitive Emissions |
Mt methane abated |
2.79×10⁷ |
0/yr |
35.13 to 57.04/yr |
0.98 to 1.59 |
0.47
|
CH₄, N₂O |
195Emergency Brake |
|
| Deploy |
LED Lighting |
256Highly Recommended
|
Cut Emissions |
3
Electricity |
Enhance Efficiency |
% lamps LED
|
7.09×10⁶/yr |
50.5 |
87 to 92 |
0.62 to 0.65 |
-175.00
|
CO₂
, CH₄, N₂O
|
196Gradual |
|
| Improve |
Nonmotorized Transportation |
256Highly Recommended
|
Cut Emissions |
6
Transportation |
Shift to Alternatives |
million passenger kilometers (million pkm)
|
115.6 |
5.556×10⁶/yr |
1.236×10⁷ to 1.634×10⁷/yr |
1.43 to 1.89 |
-1771.00
|
CO₂
, CH₄, N₂O
|
196Gradual |
|
| Improve |
Nutrient Management |
256Highly Recommended
|
Cut Emissions |
8
Food, Agriculture, Land & Ocean (FALO) |
Shift Agriculture Practices |
t avoided excess nitrogen application
|
6 |
1.045×10⁷/yr |
6.985×10⁷ to 9.106×10⁷/yr |
0.42 to 0.54 |
-85.21
|
N₂O |
196Gradual |
|
| Deploy |
Offshore Wind Turbines |
256Highly Recommended
|
Cut Emissions |
3
Electricity |
Shift Production |
MW installed capacity
|
1,900/yr |
73,000 |
1.0×10⁶ to 1.6×10⁶ |
1.90 to 3.04 |
|
CO₂
, CH₄, N₂O
|
196Gradual |
|
| Deploy |
Onshore Wind Turbines |
256Highly Recommended
|
Cut Emissions |
3
Electricity |
Shift Production |
MW installed capacity
|
1,700/yr |
940,000 |
3.2×10⁶ to 4.4×10⁶ |
5.40 to 7.50 |
|
CO₂
, CH₄, N₂O
|
196Gradual |
|
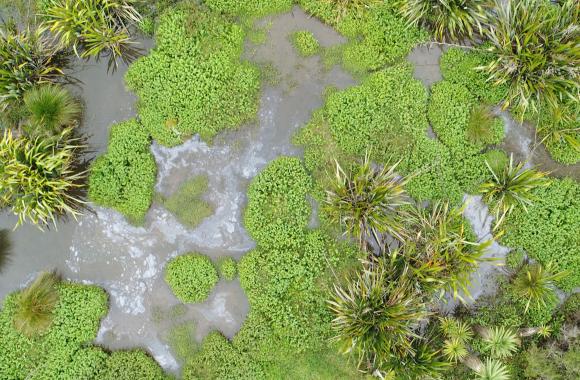
| Protect |
Peatlands: Boreal |
256Highly Recommended
|
Cut Emissions and Remove Carbon |
9
FALO & Nature-Based Carbon Removal |
Protect & Manage Ecosystems |
ha protected |
0.92/yr |
5.4×10⁷ |
1.99×10⁸ to 2.55×10⁸ |
0.18 to 0.24 |
0.25
|
CO₂
, CH₄, N₂O
|
195Emergency Brake |
|
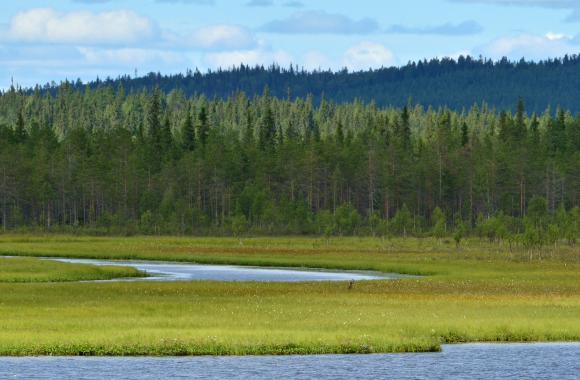
| Protect |
Peatlands: Temperate |
256Highly Recommended
|
Cut Emissions and Remove Carbon |
9
FALO & Nature-Based Carbon Removal |
Protect & Manage Ecosystems |
ha protected |
4.42/yr |
1.3×10⁷ |
1.8×10⁷ to 2.4×10⁷ |
0.08 to 0.11 |
0.25
|
CO₂
, CH₄, N₂O
|
195Emergency Brake |
|
| Protect |
Peatlands: Subtropical |
256Highly Recommended
|
Cut Emissions and Remove Carbon |
9
FALO & Nature-Based Carbon Removal |
Protect & Manage Ecosystems |
ha protected |
13.47/yr |
3.0×10⁶ |
9.0×10⁶ to 1.1×10⁷ |
0.12 to 0.15 |
0.25
|
CO₂
, CH₄, N₂O
|
195Emergency Brake |
|
| Protect |
Peatlands: Tropical |
256Highly Recommended
|
Cut Emissions and Remove Carbon |
9
FALO & Nature-Based Carbon Removal |
Protect & Manage Ecosystems |
ha protected |
13.23/yr |
3.5×10⁷ |
7.2×10⁷ to 9.2×10⁷ |
0.95 to 1.22 |
0.25
|
CO₂
, CH₄, N₂O
|
195Emergency Brake |
|
| Enhance |
Public Transit |
256Highly Recommended
|
Cut Emissions |
6
Transportation |
Shift to Alternatives |
million passenger kilometers (million pkm)
|
58.27 |
6.784×10⁶/yr |
1.203×10⁷ to 1.767×10⁷/yr |
0.70 to 1.03 |
-3300.00
|
CO₂
, CH₄, N₂O
|
196Gradual |
|
| Increase |
Recycling: Metals |
256Highly Recommended
|
Cut Emissions |
5
Industry, Materials & Waste |
Use Waste as a Resource |
Mt recycled |
1.48×10⁶ |
740/yr |
1,300 to 1,400/yr |
1.90 to 2.10 |
-100.00
|
CO₂
, CH₄
|
196Gradual |
|
| Increase |
Recycling: Paper and Cardboard |
256Highly Recommended
|
Cut Emissions |
5
Industry, Materials & Waste |
Use Waste as a Resource |
Mt recycled |
1.0×10⁶ |
160/yr |
220 to 260/yr |
0.22 to 0.26 |
-400.00
|
CO₂
, CH₄
|
196Gradual |
|
| Increase |
Recycling: Plastics |
256Highly Recommended
|
Cut Emissions |
5
Industry, Materials & Waste |
Use Waste as a Resource |
Mt recycled |
2.0×10⁶ |
35.9/yr |
45 to 54/yr |
0.09 to 0.10 |
-4.00
|
CO₂
, CH₄
|
196Gradual |
|
| Increase |
Recycling: Glass |
257Worthwhile
|
Cut Emissions |
5
Industry, Materials & Waste |
Use Waste as a Resource |
Mt recycled |
79,000 |
27/yr |
36 to 48/yr |
0.00 to 0.00 |
9000.00
|
CO₂
, CH₄
|
196Gradual |
|
| Improve |
Rice Production |
256Highly Recommended
|
Cut Emissions |
8
Food, Agriculture, Land & Ocean (FALO) |
Shift Agriculture Practices |
ha rice paddies
|
2.03/yr |
4.865×10⁷ |
4.956×10⁷ to 7.753×10⁷ |
0.10 to 0.16 |
-175.00
|
CH₄
, N₂O
|
195Emergency Brake |
|
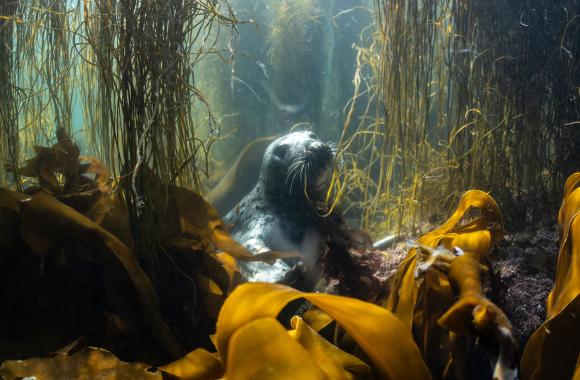
| Protect |
Seaweed Ecosystems |
256Highly Recommended
|
Cut Emissions and Remove Carbon |
9
FALO & Nature-Based Carbon Removal |
Protect & Manage Ecosystems |
ha of seaweed ecosystem protected
|
0.32/yr |
7.88×10⁷ |
2.163×10⁸ to 3.029×10⁸ |
0.07 to 0.10 |
-72.00
|
CO₂
|
195Emergency Brake |
|
| Deploy |
Silvopasture |
256Highly Recommended
|
Remove Carbon |
10
Nature-Based Carbon Removal |
Shift Agriculture Practices |
ha converted from grazing land to silvopasture
|
9.81/yr |
1.414×10⁸ |
1.47×10⁸ to 2.063×10⁸ |
0.40 to 0.98 |
43.25
|
CO₂
|
197Delayed |
|
| Deploy |
Utility-Scale Solar PV |
256Highly Recommended
|
Cut Emissions |
3
Electricity |
Shift Production |
MW installed capacity
|
760 |
918,000/yr |
1.2×10⁷ to 1.5×10⁷/yr |
9.20 to 11.00 |
|
CO₂
, CH₄, N₂O
|
196Gradual |
|
| Improve |
Windows & Glass |
256Highly Recommended
|
Cut Emissions |
2
Buildings & Electricity |
Enhance Efficiency |
m2 windows minimum double-glazed
|
0.065/yr |
1.99×10¹⁰ |
3.29×10¹⁰ to 4.0×10¹⁰ |
2.10 to 2.60 |
-123.00
|
CO₂
, CH₄, N₂O
|
196Gradual |
|
| Boost |
Appliance & Equipment Efficiency |
257Worthwhile
|
Cut Emissions |
2
Buildings & Electricity |
Enhance Efficiency |
—
|
|
|
|
|
|
|
|
|
| Improve |
Aquaculture |
257Worthwhile
|
Cut Emissions |
8
Food, Agriculture, Land & Ocean (FALO) |
Shift Agriculture Practices |
—
|
|
|
|
|
|
|
|
|
| Deploy |
Cool Roofs |
257Worthwhile
|
Cut Emissions |
3
Electricity |
Enhance Efficiency |
—
|
|
|
|
|
|
|
|
|
| Deploy |
Electric Irrigation Pumps |
257Worthwhile
|
Cut Emissions |
8
Food, Agriculture, Land & Ocean (FALO) |
Fuel Switching |
—
|
|
|
|
|
|
|
|
|
| Improve |
Fishing Vessel Efficiency |
257Worthwhile
|
Cut Emissions |
6
Transportation |
Enhance Efficiency |
—
|
|
|
|
|
|
|
|
|
| Restore |
Grasslands & Savannas |
257Worthwhile
|
Remove Carbon |
10
Nature-Based Carbon Removal |
Restore & Manage Ecosystems |
—
|
|
|
|
|
|
|
|
|
| Deploy |
Green Roofs |
257Worthwhile
|
Cut Emissions |
2
Buildings & Electricity |
Enhance Efficiency |
—
|
|
|
|
|
|
|
|
|
| Use |
Low-Flow Fixtures |
257Worthwhile
|
Cut Emissions |
2
Buildings & Electricity |
Enhance Efficiency |
—
|
|
|
|
|
|
|
|
|
| Restore |
Mangrove Ecosystems |
257Worthwhile
|
Remove Carbon |
10
Nature-Based Carbon Removal |
Restore & Manage Ecosystems |
—
|
|
|
|
|
|
|
|
|
| Improve |
Manure Management |
257Worthwhile
|
Cut Emissions |
8
Food, Agriculture, Land & Ocean (FALO) |
Shift Agriculture Practices |
—
|
|
|
|
|
|
|
|
|
| Reduce |
Overfishing |
257Worthwhile
|
Cut Emissions |
8
Food, Agriculture, Land & Ocean (FALO) |
Protect & Manage Ecosystems |
—
|
|
|
|
|
|
|
|
|
| Restore |
Salt Marsh Ecosystems |
257Worthwhile
|
Remove Carbon |
10
Nature-Based Carbon Removal |
Restore & Manage Ecosystems |
—
|
|
|
|
|
|
|
|
|
| Protect |
Seafloors |
257Worthwhile
|
Cut Emissions and Remove Carbon |
8
Food, Agriculture, Land & Ocean (FALO) |
Protect & Manage Ecosystems |
—
|
|
|
|
|
|
|
|
|
| Restore |
Seagrass Ecosystems |
257Worthwhile
|
Remove Carbon |
10
Nature-Based Carbon Removal |
Restore & Manage Ecosystems |
—
|
|
|
|
|
|
|
|
|
| Restore |
Seaweed Ecosystems |
257Worthwhile
|
Remove Carbon |
10
Nature-Based Carbon Removal |
Restore & Manage Ecosystems |
—
|
|
|
|
|
|
|
|
|
| Deploy |
Advanced Geothermal Energy |
258Keep Watching
|
Cut Emissions |
3
Electricity |
Shift Production |
—
|
|
|
|
|
|
|
|
|
| Reduce |
Airplane Contrails |
258Keep Watching
|
Other |
6
Transportation |
Solar Radiation Management |
—
|
|
|
|
|
|
|
|
|
| Deploy |
Alternative Grazing |
258Keep Watching
|
Remove Carbon |
10
Nature-Based Carbon Removal |
Shift Agriculture Practices |
—
|
|
|
|
|
|
|
|
|
| Advance |
Cultivated Meat |
258Keep Watching
|
Cut Emissions |
8
Food, Agriculture, Land & Ocean (FALO) |
Curb Growing Demands |
—
|
|
|
|
|
|
|
|
|
| Deploy |
District Cooling |
258Keep Watching
|
Cut Emissions |
3
Electricity |
Enhance Efficiency |
—
|
|
|
|
|
|
|
|
|
| Improve |
District Heating: Industry |
258Keep Watching
|
Cut Emissions |
5
Industry, Materials & Waste |
Shift Production |
—
|
|
|
|
|
|
|
|
|
| Deploy |
Enhanced Rock Weathering |
258Keep Watching
|
Remove Carbon |
10
Nature-Based Carbon Removal |
Manipulate Biogeochemical Cycles |
—
|
|
|
|
|
|
|
|
|
| Use |
Feed Additives |
258Keep Watching
|
Cut Emissions |
8
Food, Agriculture, Land & Ocean (FALO) |
Shift Agriculture Practices |
—
|
|
|
|
|
|
|
|
|
| Reduce |
Grazing Intensity |
258Keep Watching
|
Remove Carbon |
10
Nature-Based Carbon Removal |
Shift Agriculture Practices |
—
|
|
|
|
|
|
|
|
|
| Mobilize |
Green Hydrogen for Aviation and Trucking |
258Keep Watching
|
Cut Emissions |
6
Transportation |
Fuel Switching |
—
|
|
|
|
|
|
|
|
|
| Improve |
Irrigation Water Use Efficiency |
258Keep Watching
|
Cut Emissions |
8
Food, Agriculture, Land & Ocean (FALO) |
Shift Agriculture Practices |
—
|
|
|
|
|
|
|
|
|
| Restore |
Large Herbivores |
258Keep Watching
|
Remove Carbon |
10
Nature-Based Carbon Removal |
Restore & Manage Ecosystems |
—
|
|
|
|
|
|
|
|
|
| Deploy |
Methane Digesters |
258Keep Watching
|
Cut Emissions |
5
Industry, Materials & Waste |
Use Waste as a Resource |
—
|
|
|
|
|
|
|
|
|
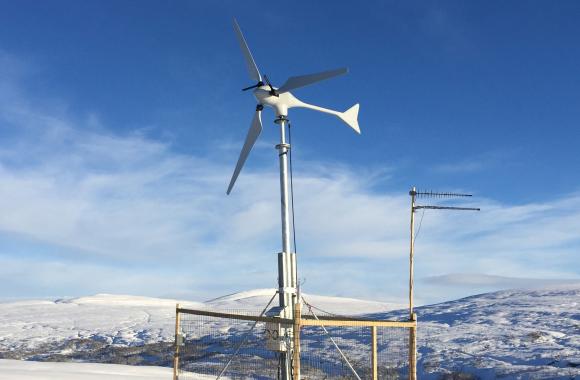
| Deploy |
Micro Wind Turbines |
258Keep Watching
|
Cut Emissions |
3
Electricity |
Shift Production |
—
|
|
|
|
|
|
|
|
|
| Use |
Nitrous Oxide Removal |
258Keep Watching
|
Remove Carbon |
11
Industrial Carbon Removal |
|
—
|
|
|
|
|
|
|
|
|
| Deploy |
Nuclear Fusion |
258Keep Watching
|
Cut Emissions |
3
Electricity |
Shift Production |
—
|
|
|
|
|
|
|
|
|
| Deploy |
Ocean Alkalinity Enhancement |
258Keep Watching
|
Remove Carbon |
10
Nature-Based Carbon Removal |
Manipulate Biogeochemical Cycles |
—
|
|
|
|
|
|
|
|
|
| Deploy |
Ocean Electrochemistry |
258Keep Watching
|
Remove Carbon |
10
Nature-Based Carbon Removal |
Manipulate Biogeochemical Cycles |
—
|
|
|
|
|
|
|
|
|
| Deploy |
Plastic Alternatives / Bioplastics |
258Keep Watching
|
Cut Emissions |
5
Industry, Materials & Waste |
Improve Materials |
—
|
|
|
|
|
|
|
|
|
| Improve |
Ruminant Breeding |
258Keep Watching
|
Cut Emissions |
8
Food, Agriculture, Land & Ocean (FALO) |
Shift Agriculture Practices |
—
|
|
|
|
|
|
|
|
|
| Deploy |
Seaweed Farming for Food |
258Keep Watching
|
Cut Emissions |
8
Food, Agriculture, Land & Ocean (FALO) |
Curb Growing Demands |
—
|
|
|
|
|
|
|
|
|
| Deploy |
Small Modular Nuclear Reactors |
258Keep Watching
|
Cut Emissions |
3
Electricity |
Shift Production |
—
|
|
|
|
|
|
|
|
|
| Improve |
Steel Production |
258Keep Watching
|
Cut Emissions |
5
Industry, Materials & Waste |
Improve Materials, Shift Energy Sources |
—
|
|
|
|
|
|
|
|
|
| Deploy |
Sustainable Aviation Fuel |
258Keep Watching
|
Cut Emissions |
6
Transportation |
Fuel Switching |
—
|
|
|
|
|
|
|
|
|
| Deploy |
Artificial Upwelling |
259Not Recommended
|
Remove Carbon |
10
Nature-Based Carbon Removal |
Manipulate Biogeochemical Cycles |
—
|
|
|
|
|
|
|
|
|
| Use |
Atmospheric Oxidation Enhancement |
259Not Recommended
|
Remove Carbon |
11
Industrial Carbon Removal |
Atmospheric Removal & Storage |
—
|
|
|
|
|
|
|
|
|
| Produce |
Blue Hydrogen |
259Not Recommended
|
Cut Emissions |
5
Industry, Materials & Waste |
Improve Processes |
—
|
|
|
|
|
|
|
|
|
| Use |
Carbon Capture & Storage on Fossil Fuel Power Plants |
259Not Recommended
|
Cut Emissions |
3
Electricity |
Shift Production |
—
|
|
|
|
|
|
|
|
|
| Use |
Corn Ethanol |
259Not Recommended
|
Cut Emissions |
6
Transportation |
Fuel Switching |
—
|
|
|
|
|
|
|
|
|
| Deploy |
Direct Air Capture |
259Not Recommended
|
Remove Carbon |
11
Industrial Carbon Removal |
Atmospheric Removal & Storage |
—
|
|
|
|
|
|
|
|
|
| Deploy |
Grass-Finished Beef |
259Not Recommended
|
Cut Emissions |
8
Food, Agriculture, Land & Ocean (FALO) |
Shift Agriculture Practices |
—
|
|
|
|
|
|
|
|
|
| Deploy |
Insect Farming for Food and Feed |
259Not Recommended
|
Cut Emissions |
8
Food, Agriculture, Land & Ocean (FALO) |
Curb Growing Demands |
—
|
|
|
|
|
|
|
|
|
| Expand |
Livestock Grazing |
259Not Recommended
|
Remove Carbon |
10
Nature-Based Carbon Removal |
Shift Agriculture Practices |
—
|
|
|
|
|
|
|
|
|
| Deploy |
Ocean Biomass Sinking |
259Not Recommended
|
Cut Emissions and Remove Carbon, Remove Carbon |
10
Nature-Based Carbon Removal |
Biomass Carbon Removal & Storage |
—
|
|
|
|
|
|
|
|
|
| Deploy |
Ocean Fertilization |
259Not Recommended
|
Remove Carbon |
10
Nature-Based Carbon Removal |
Manipulate Biogeochemical Cycles |
—
|
|
|
|
|
|
|
|
|
| Deploy |
Stratospheric Aerosol Injection |
259Not Recommended
|
Other |
13
Geoengineering |
Solar Radiation Management |
—
|
|
|
|
|
|
|
|
|
| Deploy |
Vertical Farms |
259Not Recommended
|
Cut Emissions |
8
Food, Agriculture, Land & Ocean (FALO) |
Shift Agriculture Practices |
—
|
|
|
|
|
|
|
|
|
| Deploy |
Waste to Energy |
259Not Recommended
|
Cut Emissions |
4
Electricity & Industry |
Shift Production, Use Waste as a Resource |
—
|
|
|
|
|
|
|
|
|
| Manage |
Coal Mine Methane |
Under Revision
|
Cut Emissions |
7
Other Energy |
Cut Fugitive Emissions |
—
|
2.79×10⁷ |
0.59/yr |
2.83 to 4.4/yr |
0.08 to 0.12 |
-3.17
|
CH₄
, N₂O
|
195Emergency Brake |
|
| Manage |
Oil & Gas Methane |
Under Revision
|
Cut Emissions |
7
Other Energy |
Cut Fugitive Emissions |
—
|
2.79×10⁷ |
|
3.26 to 8.84/yr |
0.09 to 0.25 |
-6.20
|
CH₄, N₂O |
195Emergency Brake |
|
| Increase |
Urban Trees |
Coming Soon
|
|
10
Nature-Based Carbon Removal |
Restore & Manage Ecosystems |
—
|
|
|
|
|
|
|
|
|
| Restore |
Abandoned Farmland |
Coming Soon
|
Remove Carbon |
10
Nature-Based Carbon Removal |
Use Degraded Land |
—
|
|
|
|
|
|
|
|
|
| Deploy |
Agrivoltaics |
Coming Soon
|
Cut Emissions |
3
Electricity |
Shift Production |
—
|
|
|
|
|
|
|
|
|
| Deploy |
Agroforestry: Trees on Cropland |
Coming Soon
|
Remove Carbon |
10
Nature-Based Carbon Removal |
Shift Agriculture Practices |
—
|
|
|
|
|
|
|
|
|
| Deploy |
Agroforestry: Multi-strata |
Coming Soon
|
Remove Carbon |
10
Nature-Based Carbon Removal |
Shift Agriculture Practices |
—
|
|
|
|
|
|
|
|
|
| Improve |
Aviation Efficiency |
Coming Soon
|
Cut Emissions |
6
Transportation |
Enhance Efficiency |
—
|
|
|
|
|
|
|
|
|
| Produce |
Biochar |
Coming Soon
|
Remove Carbon |
11
Industrial Carbon Removal |
Biomass Carbon Removal & Storage |
—
|
|
|
|
|
|
|
|
|
| Deploy |
Biomass Crops on Degraded Land |
Coming Soon
|
Remove Carbon |
10
Nature-Based Carbon Removal |
Use Degraded Land |
—
|
|
|
|
|
|
|
|
|
| Deploy |
Building Automation Systems |
Coming Soon
|
Cut Emissions |
2
Buildings & Electricity |
Enhance Efficiency |
—
|
0.011/yr |
1.0×10¹⁰ |
1.7×10¹⁰ to 3.4×10¹⁰ |
0.18 to 0.36 |
0.00
|
CO₂
, CH₄, N₂O
|
196Gradual |
|
| Improve |
Building Envelopes |
Coming Soon
|
Cut Emissions |
2
Buildings & Electricity |
Enhance Efficiency |
—
|
|
|
|
|
|
|
|
|
| Deploy |
Concentrated Solar |
Coming Soon
|
Cut Emissions |
3
Electricity |
Shift Production |
—
|
|
|
|
|
|
|
|
|
| Reduce |
Crop Residue Burning |
Coming Soon
|
Cut Emissions |
8
Food, Agriculture, Land & Ocean (FALO) |
Shift Agriculture Practices |
—
|
1.34 |
|
8.5×10⁷ to 2.87×10⁸/yr |
0.11 to 0.39 |
-10.20
|
CO₂,
CH₄
, N₂O
|
195Emergency Brake |
|
| Improve |
District Heating: Buildings |
Coming Soon
|
Cut Emissions |
2
Buildings & Electricity |
Enhance Efficiency |
—
|
|
|
|
|
|
|
|
|
| Mobilize |
Electric Buses |
Coming Soon
|
Cut Emissions |
6
Transportation |
Fuel Switching |
—
|
|
|
|
|
|
|
|
|
| Mobilize |
Electric Trains |
Coming Soon
|
Cut Emissions |
6
Transportation |
Electrify Vehicles, Fuel Switching |
—
|
|
|
|
|
|
|
|
|
| Mobilize |
Electric Trucks |
Coming Soon
|
Cut Emissions |
6
Transportation |
Electrify Vehicles, Fuel Switching |
—
|
|
|
|
|
|
|
|
|
| Improve |
Forest Management: Sustainable Forest Management |
Coming Soon
|
Cut Emissions |
8
Food, Agriculture, Land & Ocean (FALO) |
Protect & Manage Ecosystems |
—
|
|
|
|
|
|
|
|
|
| Improve |
Forest Management: Integrated Fire Management |
Coming Soon
|
Cut Emissions |
8
Food, Agriculture, Land & Ocean (FALO) |
Protect & Manage Ecosystems |
—
|
|
|
|
|
|
|
|
|
| Deploy |
Geothermal Power |
Coming Soon
|
Cut Emissions |
3
Electricity |
Shift Production |
—
|
|
|
|
|
|
|
|
|
| Improve |
Grid Efficiency |
Coming Soon
|
Cut Emissions |
3
Electricity |
Improve Electrical System |
—
|
|
|
|
|
|
|
|
|
| Enhance |
High-Speed Rail |
Coming Soon
|
Cut Emissions |
6
Transportation |
Shift to Alternatives |
—
|
|
|
|
|
|
|
|
|
| Boost |
Industrial Efficiency |
Coming Soon
|
Cut Emissions |
4
Electricity & Industry |
Enhance Efficiency |
—
|
|
|
|
|
|
|
|
|
| Increase |
Industrial Electrification |
Coming Soon
|
Cut Emissions |
5
Industry, Materials & Waste |
Improve Processes |
—
|
|
|
|
|
|
|
|
|
| Deploy |
Low-Emission Industrial Feedstocks |
Coming Soon
|
Cut Emissions |
5
Industry, Materials & Waste |
Improve Materials |
—
|
|
|
|
|
|
|
|
|
| Deploy |
Nuclear Power |
Coming Soon
|
Cut Emissions |
3
Electricity |
Shift Production |
—
|
|
|
|
|
|
|
|
|
| Improve |
Ocean Shipping Efficiency |
Coming Soon
|
Cut Emissions |
6
Transportation |
Enhance Efficiency |
—
|
|
|
|
|
|
|
|
|
| Improve |
Other Building Materials |
Coming Soon
|
Cut Emissions |
5
Industry, Materials & Waste |
Improve Materials |
—
|
|
|
|
|
|
|
|
|
| Restore |
Peatlands: Boreal |
Coming Soon
|
Remove Carbon |
10
Nature-Based Carbon Removal |
Restore & Manage Ecosystems |
—
|
|
|
|
|
|
|
|
|
| Restore |
Peatlands: Temperate |
Coming Soon
|
Remove Carbon |
10
Nature-Based Carbon Removal |
Restore & Manage Ecosystems |
—
|
|
|
|
|
|
|
|
|
| Restore |
Peatlands: Subtropical |
Coming Soon
|
Remove Carbon |
10
Nature-Based Carbon Removal |
Restore & Manage Ecosystems |
—
|
|
|
|
|
|
|
|
|
| Restore |
Peatlands: Tropical |
Coming Soon
|
Remove Carbon |
10
Nature-Based Carbon Removal |
Restore & Manage Ecosystems |
—
|
|
|
|
|
|
|
|
|
| Deploy |
Perennial Crops |
Coming Soon
|
Remove Carbon |
10
Nature-Based Carbon Removal |
Shift Agriculture Practices |
—
|
|
|
|
|
|
|
|
|
| Deploy |
Precision Fermentation |
Coming Soon
|
Cut Emissions |
8
Food, Agriculture, Land & Ocean (FALO) |
Curb Growing Demands |
—
|
|
|
|
|
|
|
|
|
| Improve |
Refrigerant Management |
Coming Soon
|
Cut Emissions |
1
Buildings & Industry |
Cut Fugitive Emissions |
—
|
|
|
|
|
|
|
|
|
| Use |
Smart & Programmable Thermostats: Heating |
Coming Soon
|
Cut Emissions |
2
Buildings & Electricity |
Enhance Efficiency |
smart or programmable thermostat programmed to adjust temperatures |
0.23/yr |
1.4×10⁸ |
2.9×10¹⁰ to 5.1×10⁸ |
0.07 to 0.12 |
-370.00
|
CO₂
, CH₄, N₂O
|
196Gradual |
|
| Use |
Smart & Programmable Thermostats: Cooling |
Coming Soon
|
Cut Emissions |
2
Buildings & Electricity |
Enhance Efficiency |
smart or programmable thermostat programmed to adjust temperatures |
0.091/yr |
3.0×10⁷ |
1.9×10⁸ to 5.1×10⁸ |
0.02 to 0.05 |
-230.00
|
CO₂
, CH₄, N₂O
|
196Gradual |
|
| Improve |
Supply Chain Efficiency |
Coming Soon
|
Cut Emissions |
6
Transportation |
Enhance Efficiency |
—
|
|
|
|
|
|
|
|
|
| Improve |
Truck Efficiency |
Coming Soon
|
Cut Emissions |
6
Transportation |
Enhance Efficiency |
—
|
|
|
|
|
|
|
|
|
| Hold |
Virtual Meetings |
Coming Soon
|
Cut Emissions |
6
Transportation |
Shift to Alternatives |
—
|
|
|
|
|
|
|
|
|
| Increase |
Building Deconstruction & Recycling |
Coming Soon
|
Cut Emissions |
1
Buildings & Industry |
Use Waste as a Resource |
—
|
|
|
|
|
|
|
|
|
| Increase |
Decentralized Composting |
Coming Soon
|
Cut Emissions |
5
Industry, Materials & Waste |
Use Waste as a Resource |
—
|
|
|
|
|
|
|
|
|
| Deploy |
Electric Cooking Equipment |
Coming Soon
|
Cut Emissions |
2
Buildings & Electricity |
Shift Energy Sources |
—
|
|
|
|
|
|
|
|
|
| Deploy |
Heat Pump Water Heaters |
Coming Soon
|
Cut Emissions |
0
Buildings |
Shift Energy Sources |
—
|
|
|
|
|
|
|
|
|
| Deploy |
Ocean Power |
Coming Soon
|
Cut Emissions |
3
Electricity |
Shift Production |
—
|
|
|
|
|
|
|
|
|
| Deploy |
Small Hydropower |
Coming Soon
|
Cut Emissions |
3
Electricity |
Shift Production |
—
|
|
|
|
|
|
|
|
|
| Deploy |
Solar Hot Water Heaters |
Coming Soon
|
Cut Emissions |
0
Buildings |
Shift Energy Sources |
—
|
|
|
|
|
|
|
|
|
| Deploy |
Utility-Scale Hydropower |
Coming Soon
|
Cut Emissions |
3
Electricity |
Shift Production |
—
|
|
|
|
|
|
|
|
|
| Boost |
Whale Restoration |
Coming Soon
|
Remove Carbon |
10
Nature-Based Carbon Removal |
Restore & Manage Ecosystems |
—
|
|
|
|
|
|
|
|
|
| Deploy |
Advanced Biofuels |
Coming Soon
|
Cut Emissions |
6
Transportation |
Electrify Vehicles, Fuel Switching |
—
|
|
|
|
|
|
|
|
|
| Produce |
Bio Bricks |
Coming Soon
|
Remove Carbon |
11
Industrial Carbon Removal |
Biomass Carbon Removal & Storage |
—
|
|
|
|
|
|
|
|
|
| Produce |
Bio Oils |
Coming Soon
|
Remove Carbon |
11
Industrial Carbon Removal |
Biomass Carbon Removal & Storage |
—
|
|
|
|
|
|
|
|
|
| Deploy |
Bioelectricity With Carbon Capture & Storage |
Coming Soon
|
Cut Emissions |
4
Electricity & Industry |
Shift Production |
—
|
|
|
|
|
|
|
|
|
| Deploy |
Electric Cooking Equipment |
Coming Soon
|
Cut Emissions |
2
Buildings & Electricity |
Shift Energy Sources |
—
|
|
|
|
|
|
|
|
|
| Improve |
Fuel-Burning Cooking Equipment |
Coming Soon
|
Cut Emissions |
0
Buildings |
Enhance Efficiency, Shift Energy Sources |
—
|
|
|
|
|
|
|
|
|
| Deploy |
Leaf Protein Concentrates |
Coming Soon
|
Cut Emissions |
8
Food, Agriculture, Land & Ocean (FALO) |
Shift Agriculture Practices |
—
|
|
|
|
|
|
|
|
|
| Use |
Methane Removal |
Coming Soon
|
Remove Carbon |
11
Industrial Carbon Removal |
Methane Removal |
—
|
|
|
|
|
|
|
|
|
| Improve |
Routing & Logistics |
Coming Soon
|
|
6
Transportation |
Enhance Efficiency |
—
|
|
|
|
|
|
|
|
|