Agriculture is the dominant source of human-caused emissions of nitrous oxide (Figure 1; Tian et al., 2020). Nitrogen is critical for plant growth and is added to croplands in synthetic forms, such as urea, ammonium nitrate, or anhydrous ammonia; in organic forms, such as manure or compost; and by growing legume crops, which host microbes that capture nitrogen from the air and add it to the soil (Adalibieke et al., 2023; Ludemann et al., 2024). If more nitrogen is added than crops can use, the excess can be converted to other forms, including nitrous oxide, through microbial processes called denitrification and nitrification (Figure 2; Reay et al., 2012).
Improve Nutrient Management
Mode
Cut Emissions
Cluster
Shift Agriculture Practices
Image
Image
Coming Soon
Off
Summary
We define the Improve Nutrient Management solution as reducing excessive nitrogen use on croplands. Nitrogen is critical for crop production and is added to croplands as synthetic or organic fertilizers and through microbial activity. However, farmers often add more nitrogen to croplands than crops can use. Some of that excess nitrogen is emitted to the atmosphere as nitrous oxide, a potent GHG.
Overview
Figure 1. The agricultural nitrogen cycle represents the key pathways by which nitrogen is added to croplands and lost to the environment, including as nitrous oxide. The “4R” nutrient management principles – right source, right rate, right time, right place – increase the proportion of nitrogen taken up by the plant, therefore reducing nitrogen losses to the environment.
Image
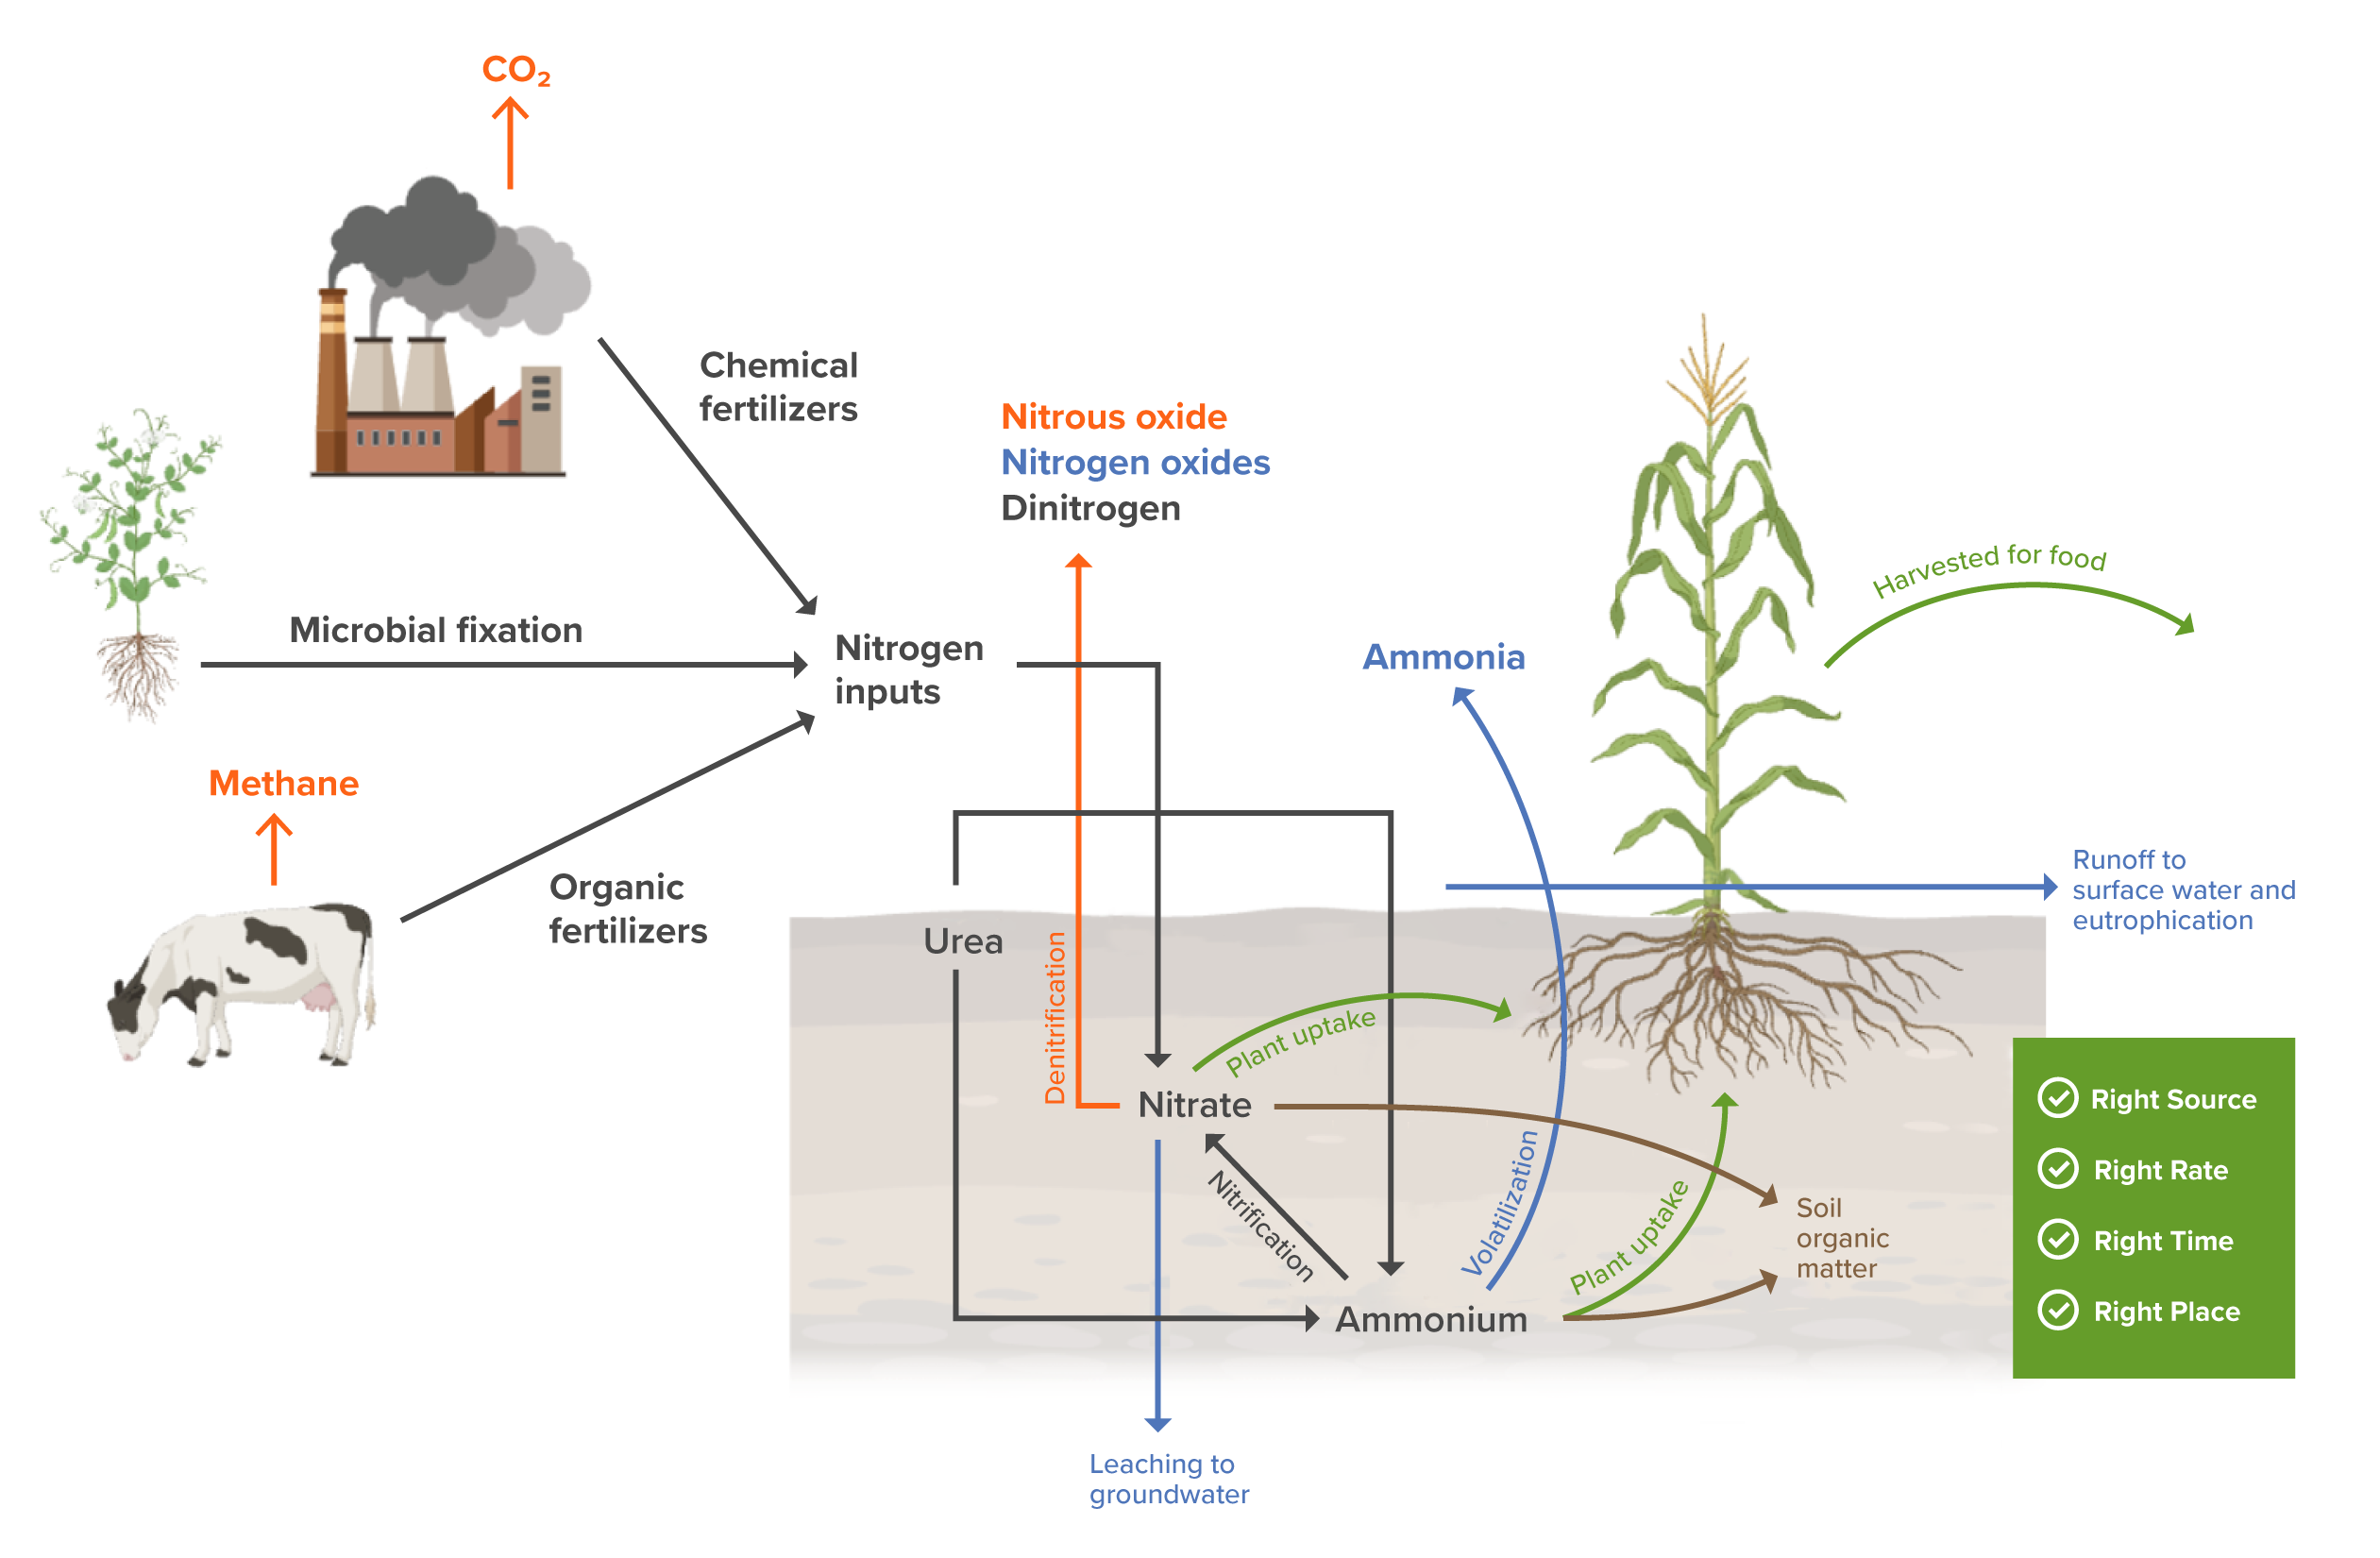
Illustrations: BioRender CC-BY 4.0
Farmers can reduce nitrous oxide emissions from croplands by using the right amount and the right type of fertilizer at the right time and in the right place (Fixen, 2020; Gao & Cabrera Serrenho, 2023). Together, these four “rights” increase nitrogen use efficiency – the proportion of applied nitrogen that the crop uses (Congreves et al., 2021). Improved nutrient management is often a win-win for the farmer and the environment, reducing fertilizer costs while also lowering nitrous oxide emissions (Gu et al., 2023).
Improving nutrient management involves reducing the amount of nitrogen applied to match the crop’s requirements in areas where nitrogen is currently overapplied. A farmer can implement the other three principles – type, time, and place – in a number of ways. For example, fertilizing just before planting instead of after the previous season’s harvest better matches the timing of nitrogen addition to that of plant uptake, reducing nitrous oxide emissions before the crop is planted. Certain types of fertilizers are better suited for maximizing plant uptake, such as extended-release fertilizers, which allow the crop to steadily absorb nutrients over time. Techniques such as banding, in which farmers apply fertilizers in concentrated bands close to the plant roots instead of spreading them evenly across the soil surface, also reduce nitrous oxide emissions. Each of these practices can increase nitrogen use efficiency and decrease the amount of excess nitrogen lost as nitrous oxide (Gao & Cabrera Serrenho, 2023; Gu et al., 2023; Wang et al., 2024; You et al., 2023).
For this solution, we estimated a target rate of nitrogen application for major crops as the 20th percentile of the current rate of nitrogen application (in tN/t crop) in areas where yields are near a realistic ceiling. Excess nitrogen was defined as the amount of nitrogen applied beyond the target rate (see Adoption and Appendix for more details). Our emissions estimates include nitrous oxide from croplands, fertilizer runoff, and fertilizer volatilization. They do not include emissions from fertilizer manufacturing, which are addressed in the Deploy Low-Emission Industrial Feedstocks and Increase Industrial Efficiency solutions. We excluded nutrient management on pastures from this solution due to data limitations, and address nutrient management in paddy rice systems in the Improve Rice Management solution instead.
References
Adalibieke, W., Cui, X., Cai, H., You, L., & Zhou, F. (2023). Global crop-specific nitrogen fertilization dataset in 1961–2020. Scientific Data, 10(1), 617. https://doi.org/10.1038/s41597-023-02526-z
Almaraz, M., Bai, E., Wang, C., Trousdell, J., Conley, S., Faloona, I., & Houlton, B. Z. (2018). Agriculture is a major source of NOx pollution in California. Science Advances, 4(1), eaao3477. https://doi.org/10.1126/sciadv.aao3477
Antil, R. S., & Raj, D. (2020). Integrated nutrient management for sustainable crop production and improving soil health. In R. S. Meena (Ed.), Nutrient Dynamics for Sustainable Crop Production (pp. 67–101). Springer. https://doi.org/10.1007/978-981-13-8660-2_3
Bijay-Singh, & Craswell, E. (2021). Fertilizers and nitrate pollution of surface and ground water: An increasingly pervasive global problem. SN Applied Sciences, 3(4), 518. https://doi.org/10.1007/s42452-021-04521-8
Chivenge, P., Saito, K., Bunquin, M. A., Sharma, S., & Dobermann, A. (2021). Co-benefits of nutrient management tailored to smallholder agriculture. Global Food Security, 30, 100570. https://doi.org/10.1016/j.gfs.2021.100570
Deng, J., Guo, L., Salas, W., Ingraham, P., Charrier-Klobas, J. G., Frolking, S., & Li, C. (2018). Changes in irrigation practices likely mitigate nitrous oxide emissions from California cropland. Global Biogeochemical Cycles, 32(10), 1514–1527. https://doi.org/10.1029/2018GB005961
Domingo, N. G. G., Balasubramanian, S., Thakrar, S. K., Clark, M. A., Adams, P. J., Marshall, J. D., Muller, N. Z., Pandis, S. N., Polasky, S., Robinson, A. L., Tessum, C. W., Tilman, D., Tschofen, P., & Hill, J. D. (2021). Air quality–related health damages of food. Proceedings of the National Academy of Sciences, 118(20), e2013637118. https://doi.org/10.1073/pnas.2013637118
Elberling, B. B., Kovács, G. M., Hansen, H. F. E., Fensholt, R., Ambus, P., Tong, X., Gominski, D., Mueller, C. W., Poultney, D. M. N., & Oehmcke, S. (2023). High nitrous oxide emissions from temporary flooded depressions within croplands. Communications Earth & Environment, 4(1), 1–9. https://doi.org/10.1038/s43247-023-01095-8
Fixen, P. E. (2020). A brief account of the genesis of 4R nutrient stewardship. Agronomy Journal, 112(5), 4511–4518. https://doi.org/10.1002/agj2.20315
Foley, J. A., Ramankutty, N., Brauman, K. A., Cassidy, E. S., Gerber, J. S., Johnston, M., Mueller, N. D., O’Connell, C., Ray, D. K., West, P. C., Balzer, C., Bennett, E. M., Carpenter, S. R., Hill, J., Monfreda, C., Polasky, S., Rockström, J., Sheehan, J., Siebert, S., … Zaks, D. P. M. (2011). Solutions for a cultivated planet. Nature, 478(7369), 337–342. https://doi.org/10.1038/nature10452
Gao, Y., & Cabrera Serrenho, A. (2023). Greenhouse gas emissions from nitrogen fertilizers could be reduced by up to one-fifth of current levels by 2050 with combined interventions. Nature Food, 4(2), 170–178. https://doi.org/10.1038/s43016-023-00698-w
Gerber, J. S., Carlson, K. M., Makowski, D., Mueller, N. D., Garcia de Cortazar-Atauri, I., Havlík, P., Herrero, M., Launay, M., O’Connell, C. S., Smith, P., & West, P. C. (2016). Spatially explicit estimates of nitrous oxide emissions from croplands suggest climate mitigation opportunities from improved fertilizer management. Global Change Biology, 22(10), 3383–3394. https://doi.org/10.1111/gcb.13341
Gerber, J. S., Ray, D. K., Makowski, D., Butler, E. E., Mueller, N. D., West, P. C., Johnson, J. A., Polasky, S., Samberg, L. H., & Siebert, S. (2024). Global spatially explicit yield gap time trends reveal regions at risk of future crop yield stagnation. Nature Food, 5(2), 125–135. https://doi.org/10.1038/s43016-023-00913-8
Gong, C., Tian, H., Liao, H., Pan, N., Pan, S., Ito, A., Jain, A. K., Kou-Giesbrecht, S., Joos, F., Sun, Q., Shi, H., Vuichard, N., Zhu, Q., Peng, C., Maggi, F., Tang, F. H. M., & Zaehle, S. (2024). Global net climate effects of anthropogenic reactive nitrogen. Nature, 632(8025), 557–563. https://doi.org/10.1038/s41586-024-07714-4
Gu, B., Zhang, X., Lam, S. K., Yu, Y., van Grinsven, H. J. M., Zhang, S., Wang, X., Bodirsky, B. L., Wang, S., Duan, J., Ren, C., Bouwman, L., de Vries, W., Xu, J., Sutton, M. A., & Chen, D. (2023). Cost-effective mitigation of nitrogen pollution from global croplands. Nature, 613(7942), 77–84. https://doi.org/10.1038/s41586-022-05481-8
Hergoualc’h, K., Akiyama, H., Bernoux, M., Chirinda, N., del Prado, A., Kasimir, Å., MacDonald, J. D., Ogle, S. M., Regina, K., & van der Weerden, T. J. (2019). Chapter 11: nitrous oxide Emissions from managed soils, and CO₂ emissions from lime and urea application (2019 Refinement to the 2006 IPCC Guidelines for National Greenhouse Gas Inventories). Intergovernmental Panel on Climate Change. https://www.ipcc-nggip.iges.or.jp/public/2019rf/pdf/4_Volume4/19R_V4_Ch11_Soils_nitrous oxide_CO₂. pdf
Hergoualc’h, K., Mueller, N., Bernoux, M., Kasimir, Ä., van der Weerden, T. J., & Ogle, S. M. (2021). Improved accuracy and reduced uncertainty in greenhouse gas inventories by refining the IPCC emission factor for direct nitrous oxide emissions from nitrogen inputs to managed soils. Global Change Biology, 27(24), 6536–6550. https://doi.org/10.1111/gcb.15884
IPCC, 2019: Summary for Policymakers. In: Climate Change and Land: an IPCC special report on climate change, desertification, land degradation, sustainable land management, food security, and greenhouse gas fluxes in terrestrial ecosystems [P.R. Shukla, J. Skea, E. Calvo Buendia, V. Masson-Delmotte, H.-O. Pörtner, D. C. Roberts, P. Zhai, R. Slade, S. Connors, R. van Diemen, M. Ferrat, E. Haughey, S. Luz, S. Neogi, M. Pathak, J. Petzold, J. Portugal Pereira, P. Vyas, E. Huntley, K. Kissick, M. Belkacemi, J. Malley, (eds.)].
Lam, S. K., Suter, H., Mosier, A. R., & Chen, D. (2017). Using nitrification inhibitors to mitigate agricultural nitrous oxide emission: A double-edged sword? Global Change Biology, 23(2), 485–489. https://doi.org/10.1111/gcb.13338
Lawrence, N. C., Tenesaca, C. G., VanLoocke, A., & Hall, S. J. (2021). Nitrous oxide emissions from agricultural soils challenge climate sustainability in the US Corn Belt. Proceedings of the National Academy of Sciences, 118(46), e2112108118. https://doi.org/10.1073/pnas.2112108118
Ludemann, C. I., Wanner, N., Chivenge, P., Dobermann, A., Einarsson, R., Grassini, P., Gruere, A., Jackson, K., Lassaletta, L., Maggi, F., Obli-Laryea, G., van Ittersum, M. K., Vishwakarma, S., Zhang, X., & Tubiello, F. N. (2024). A global FAOSTAT reference database of cropland nutrient budgets and nutrient use efficiency (1961–2020): Nitrogen, phosphorus and potassium. Earth System Science Data, 16(1), 525–541. https://doi.org/10.5194/essd-16-525-2024
Menegat, S., Ledo, A., & Tirado, R. (2022). Greenhouse gas emissions from global production and use of nitrogen synthetic fertilisers in agriculture. Scientific Reports, 12(1), 14490. https://doi.org/10.1038/s41598-022-18773-w
Michaelowa, A., Hermwille, L., Obergassel, W., & Butzengeiger, S. (2019). Additionality revisited: Guarding the integrity of market mechanisms under the Paris Agreement. Climate Policy, 19(10), 1211–1224. https://doi.org/10.1080/14693062.2019.1628695
Mueller, N. D., Gerber, J. S., Johnston, M., Ray, D. K., Ramankutty, N., & Foley, J. A. (2012). Closing yield gaps through nutrient and water management. Nature, 490(7419), Article 7419. https://doi.org/10.1038/nature11420
Patel, N., Srivastav, A. L., Patel, A., Singh, A., Singh, S. K., Chaudhary, V. K., Singh, P. K., & Bhunia, B. (2022). Nitrate contamination in water resources, human health risks and its remediation through adsorption: A focused review. Environmental Science and Pollution Research, 29(46), 69137–69152. https://doi.org/10.1007/s11356-022-22377-2
Pinder, R. W., Davidson, E. A., Goodale, C. L., Greaver, T. L., Herrick, J. D., & Liu, L. (2012). Climate change impacts of US reactive nitrogen. Proceedings of the National Academy of Sciences, 109(20), 7671–7675. https://doi.org/10.1073/pnas.1114243109
Porter, E. M., Bowman, W. D., Clark, C. M., Compton, J. E., Pardo, L. H., & Soong, J. L. (2013). Interactive effects of anthropogenic nitrogen enrichment and climate change on terrestrial and aquatic biodiversity. Biogeochemistry, 114(1), 93–120. https://doi.org/10.1007/s10533-012-9803-3
Qiao, C., Liu, L., Hu, S., Compton, J. E., Greaver, T. L., & Li, Q. (2015). How inhibiting nitrification affects nitrogen cycle and reduces environmental impacts of anthropogenic nitrogen input. Global Change Biology, 21(3), 1249–1257. https://doi.org/10.1111/gcb.12802
Qin, Z., Deng, S., Dunn, J., Smith, P., & Sun, W. (2021). Animal waste use and implications to agricultural greenhouse gas emissions in the United States. Environmental Research Letters, 16(6), 064079. https://doi.org/10.1088/1748-9326/ac04d7
Reay, D. S., Davidson, E. A., Smith, K. A., Smith, P., Melillo, J. M., Dentener, F., & Crutzen, P. J. (2012). Global agriculture and nitrous oxide emissions. Nature Climate Change, 2(6), 410–416. https://doi.org/10.1038/nclimate1458
Rockström, J., Williams, J., Daily, G., Noble, A., Matthews, N., Gordon, L., Wetterstrand, H., DeClerck, F., Shah, M., Steduto, P., de Fraiture, C., Hatibu, N., Unver, O., Bird, J., Sibanda, L., & Smith, J. (2017). Sustainable intensification of agriculture for human prosperity and global sustainability. Ambio, 46(1), 4–17. https://doi.org/10.1007/s13280-016-0793-6
Rurinda, J., Zingore, S., Jibrin, J. M., Balemi, T., Masuki, K., Andersson, J. A., Pampolino, M. F., Mohammed, I., Mutegi, J., Kamara, A. Y., Vanlauwe, B., & Craufurd, P. Q. (2020). Science-based decision support for formulating crop fertilizer recommendations in sub-Saharan Africa. Agricultural Systems, 180, 102790. https://doi.org/10.1016/j.agsy.2020.102790
Scavia, D., David Allan, J., Arend, K. K., Bartell, S., Beletsky, D., Bosch, N. S., Brandt, S. B., Briland, R. D., Daloğlu, I., DePinto, J. V., Dolan, D. M., Evans, M. A., Farmer, T. M., Goto, D., Han, H., Höök, T. O., Knight, R., Ludsin, S. A., Mason, D., … Zhou, Y. (2014). Assessing and addressing the re-eutrophication of Lake Erie: Central basin hypoxia. Journal of Great Lakes Research, 40(2), 226–246. https://doi.org/10.1016/j.jglr.2014.02.004
Selim, M. M. (2020). Introduction to the integrated nutrient management strategies and their contribution to yield and soil properties. International Journal of Agronomy, 2020(1), 2821678. https://doi.org/10.1155/2020/2821678
Shcherbak, I., Millar, N., & Robertson, G. P. (2014). Global metaanalysis of the nonlinear response of soil nitrous oxide (nitrous oxide) emissions to fertilizer nitrogen. Proceedings of the National Academy of Sciences, 111(25), 9199–9204. https://doi.org/10.1073/pnas.1322434111
Shindell, D. T., Faluvegi, G., Koch, D. M., Schmidt, G. A., Unger, N., & Bauer, S. E. (2009). Improved attribution of climate forcing to emissions. Science, 326(5953), 716–718. https://doi.org/10.1126/science.1174760
Sobota, D. J., Compton, J. E., McCrackin, M. L., & Singh, S. (2015). Cost of reactive nitrogen release from human activities to the environment in the United States. Environmental Research Letters, 10(2), 025006. https://doi.org/10.1088/1748-9326/10/2/025006
Tian, H., Xu, R., Canadell, J. G., Thompson, R. L., Winiwarter, W., Suntharalingam, P., Davidson, E. A., Ciais, P., Jackson, R. B., Janssens-Maenhout, G., Prather, M. J., Regnier, P., Pan, N., Pan, S., Peters, G. P., Shi, H., Tubiello, F. N., Zaehle, S., Zhou, F., … Yao, Y. (2020). A comprehensive quantification of global nitrous oxide sources and sinks. Nature, 586(7828), 248–256. https://doi.org/10.1038/s41586-020-2780-0
van Grinsven, H. J. M., Bouwman, L., Cassman, K. G., van Es, H. M., McCrackin, M. L., & Beusen, A. H. W. (2015). Losses of ammonia and nitrate from agriculture and their effect on nitrogen recovery in the European Union and the United States between 1900 and 2050. Journal of Environmental Quality, 44(2), 356–367. https://doi.org/10.2134/jeq2014.03.0102
Vanlauwe, B., Descheemaeker, K., Giller, K. E., Huising, J., Merckx, R., Nziguheba, G., Wendt, J., & Zingore, S. (2015). Integrated soil fertility management in sub-Saharan Africa: Unravelling local adaptation. SOIL, 1(1), 491–508. https://doi.org/10.5194/soil-1-491-2015
Wang, C., Shen, Y., Fang, X., Xiao, S., Liu, G., Wang, L., Gu, B., Zhou, F., Chen, D., Tian, H., Ciais, P., Zou, J., & Liu, S. (2024). Reducing soil nitrogen losses from fertilizer use in global maize and wheat production. Nature Geoscience, 17(10), 1008–1015. https://doi.org/10.1038/s41561-024-01542-x
Wang, Y., Li, C., Li, Y., Zhu, L., Liu, S., Yan, L., Feng, G., & Gao, Q. (2020). Agronomic and environmental benefits of Nutrient Expert on maize and rice in Northeast China. Environmental Science and Pollution Research, 27(22), 28053–28065. https://doi.org/10.1007/s11356-020-09153-w
Ward, M. H., Jones, R. R., Brender, J. D., de Kok, T. M., Weyer, P. J., Nolan, B. T., Villanueva, C. M., & van Breda, S. G. (2018). Drinking water nitrate and human health: an updated review. International Journal of Environmental Research and Public Health, 15(7), 1557. https://doi.org/10.3390/ijerph15071557
Withers, P. J. A., Neal, C., Jarvie, H. P., & Doody, D. G. (2014). Agriculture and eutrophication: where do we go from here? Sustainability, 6(9), Article 9. https://doi.org/10.3390/su6095853
You, L., Ros, G. H., Chen, Y., Shao, Q., Young, M. D., Zhang, F., & de Vries, W. (2023). Global mean nitrogen recovery efficiency in croplands can be enhanced by optimal nutrient, crop and soil management practices. Nature Communications, 14(1), 5747. https://doi.org/10.1038/s41467-023-41504-2
Zaehle, S., Ciais, P., Friend, A. D., & Prieur, V. (2011). Carbon benefits of anthropogenic reactive nitrogen offset by nitrous oxide emissions. Nature Geoscience, 4(9), 601–605. https://doi.org/10.1038/ngeo1207
Zhang, X., Fang, Q., Zhang, T., Ma, W., Velthof, G. L., Hou, Y., Oenema, O., & Zhang, F. (2020). Benefits and trade-offs of replacing synthetic fertilizers by animal manures in crop production in China: A meta-analysis. Global Change Biology, 26(2), 888–900. https://doi.org/10.1111/gcb.14826
Credits
Lead Fellow
Avery Driscoll, Ph.D.
Contributors
Ruthie Burrows, Ph.D.
James Gerber, Ph.D.
Yusuf Jameel, Ph.D.
Daniel Jasper
Alex Sweeney
Eric Toensmeier
Internal Reviewers
Aiyana Bodi
Hannah Henkin
Ted Otte
Effectiveness
We relied on the 2019 IPCC emissions factors to calculate the emissions impacts of improved nutrient management. These are disaggregated by climate zone (“wet” vs. “dry”) and by fertilizer type (“organic” vs. “synthetic”). Nitrogen use reductions in wet climates, which include ~65% of the cropland area represented in this analysis (see Appendix for details), have the largest impact. In these areas, a 1 t reduction in nitrogen use reduces emissions by 8.7 t CO₂‑eq on average for synthetic fertilizers and by 5.0 t CO₂‑eq for organic fertilizers. Emissions savings are lower in dry climates, where a 1 t reduction in nitrogen use reduces emissions by 2.4 t CO₂‑eq for synthetic fertilizers and by 2.6 t CO₂‑eq for organic fertilizers. While these values reflect the median emissions reduction for each climate zone and fertilizer type, they are associated with large uncertainties because emissions are highly variable depending on climate, soil, and management conditions.
Based on our analysis of the adoption ceiling for each climate zone and fertilizer type (see Appendix), we estimated that a 1 t reduction in nitrogen use reduces emissions by 6.0 t CO₂‑eq at the global average (Table 1). This suggests that ~1.4% of the applied nitrogen is emitted as nitrous oxide at the global average, which is consistent with existing estimates (IPCC, 2019).
left_text_column_width
Table 1. Effectiveness at reducing emissions.
Unit: t CO₂‑eq /tN, 100-yr basis
| 25th percentile | 4.2 |
| median (50th percentile) | 6.0 |
| 75th percentile | 7.7 |
Left Text Column Width
Cost
Improving nutrient management typically reduces fertilizer costs while maintaining or increasing yields, resulting in a net financial benefit to the producer. Gu et al. (2023) found that a 21% reduction in global nitrogen use would be economically beneficial, notably after accounting for increased fertilizer use in places that do not currently have adequate access. Using data from their study, we evaluated the average cost of reduced nitrogen application considering the following nutrient management practices: increased use of high-efficiency fertilizers, organic fertilizers, and/or legumes; optimizing fertilizer rates; altering the timing and/or placement of fertilizer applications; and use of buffer zones. Implementation costs depend on the strategy used to improve nutrient management. For example, optimizing fertilizer rates requires soil testing and the ability to apply different fertilizer rates to different parts of a field. Improving timing can involve applying fertilizers at two different times during the season, increasing labor and equipment operation costs. Furthermore, planting legumes incurs seed purchase and planting costs.
Gu et al. (2023) estimated that annual reductions of 42 Mt of nitrogen were achievable globally using these practices, providing total fertilizer savings of US$37.2 billion and requiring implementation costs of US$15.9 billion, adjusted for inflation to 2023. A 1 t reduction in excess nitrogen application, therefore, was estimated to provide an average of US$507.80 of net cost savings, corresponding to a savings of US$85.21 per t CO₂‑eq of emissions reductions (Table 2).
left_text_column_width
Table 2. Cost per unit of climate impact, 100-yr basis.
Unit: 2023 US$/t CO₂‑eq
| mean | -85.21 |
Left Text Column Width
Methods and Supporting Data
Abatzoglou, J. T., Dobrowski, S. Z., Parks, S. A., & Hegewisch, K. C. (2018). TerraClimate, a high-resolution global dataset of monthly climate and climatic water balance from 1958–2015. Scientific Data, 5(1), 170191. https://doi.org/10.1038/sdata.2017.191
Adalibieke, W., Cui, X., Cai, H., You, L., & Zhou, F. (2023). Global crop-specific nitrogen fertilization dataset in 1961–2020. Scientific Data, 10(1), 617. https://doi.org/10.1038/s41597-023-02526-z
Gerber, J. S., Ray, D. K., Makowski, D., Butler, E. E., Mueller, N. D., West, P. C., Johnson, J. A., Polasky, S., Samberg, L. H., & Siebert, S. (2024). Global spatially explicit yield gap time trends reveal regions at risk of future crop yield stagnation. Nature Food, 5(2), 125–135. https://doi.org/10.1038/s43016-023-00913-8
IPCC, 2019: Summary for Policymakers. In: Climate Change and Land: an IPCC special report on climate change, desertification, land degradation, sustainable land management, food security, and greenhouse gas fluxes in terrestrial ecosystems [P.R. Shukla, J. Skea, E. Calvo Buendia, V. Masson-Delmotte, H.-O. Pörtner, D. C. Roberts, P. Zhai, R. Slade, S. Connors, R. van Diemen, M. Ferrat, E. Haughey, S. Luz, S. Neogi, M. Pathak, J. Petzold, J. Portugal Pereira, P. Vyas, E. Huntley, K. Kissick, M. Belkacemi, J. Malley, (eds.)].
Mehta, P., Siebert, S., Kummu, M., Deng, Q., Ali, T., Marston, L., Xie, W., & Davis, K. F. (2024). Half of twenty-first century global irrigation expansion has been in water-stressed regions. Nature Water, 2(3), 254–261. https://doi.org/10.1038/s44221-024-00206-9
Learning Curve
The improved nutrient management strategies considered for this solution are already well-established and widely deployed (Fixen, 2020). Large nitrogen excesses are relatively easy to mitigate through simple management changes with low implementation costs. As nitrogen use efficiency increases, further reductions may require increasingly complex mitigation practices and increasing marginal costs. Therefore, a learning curve was not quantified for this solution.
left_text_column_width
Speed of Action
Speed of action refers to how quickly a climate solution physically affects the atmosphere after it is deployed. This is different from speed of deployment, which is the pace at which solutions are adopted.
At Project Drawdown, we define the speed of action for each climate solution as gradual, emergency brake, or delayed.
Improve Nutrient Management is a GRADUAL climate solution. It has a steady, linear impact on the atmosphere. The cumulative effect over time builds as a straight line.
left_text_column_width
Caveats
Emissions reductions from improved nutrient management are permanent, though they may not be additional in all cases.
Permanence
As this solution reduces emissions rather than enhancing sequestration, permanence is not applicable.
Additionality
Additionality requires that the emissions benefits of the practice are attributable to climate-related incentives and would not have occurred in the absence of incentives (Michaelowa et al., 2019). If they are not contingent on external incentives, fertilizer use reductions implemented solely to maximize profits do not meet the threshold for additionality. However, fertilizer reductions may be additional if incentives are required to provide access to the technical knowledge and soil testing required to identify optimal rates. Other forms of nutrient management (e.g., applying nitrification inhibitors, using extended-release or organic fertilizers, or splitting applications between two time points) may involve additional costs, substantial practice change, and technical expertise. Thus, these practices are likely to be additional.
left_text_column_width
Current Adoption
Given that improved nutrient management takes a variety of forms and data on the adoption of individual practices are very limited, we leveraged several global datasets related to nitrogen use and yields to directly assess improvements in nitrogen use efficiency (see Appendix for details).
First, we calculated nitrogen use per t of crop produced using global maps of nitrogen fertilizer use (Adalibieke et al., 2023) and global maps of crop yields (Gerber et al., 2024) for 17 major crops (see Appendix). Next, we determined a target nitrogen use rate (t N/t crop) for each crop, corresponding to the 20th percentile of nitrogen use rates observed in croplands with yield gaps at or below the 20th percentile, meaning that actual yields were close to an attainable yield ceiling (Gerber et al., 2024). Areas with large yield gaps were excluded from the calculation of target nutrient use efficiency because insufficient nitrogen supply may be compromising yields (Mueller et al., 2012). Yield data were not available for a small number of crops; for these, we assumed reductions in nitrogen use to be proportional to those of other crops.
We considered croplands that had achieved the target rate and had yield gaps lower than the global median to have adopted the solution. We calculated the amount of excess nitrogen use avoided from these croplands as the difference in total nitrogen use under current fertilization rates relative to median fertilizer application rates. As of 2020, croplands that had achieved the adoption threshold for improved nutrient management avoided 10.45 Mt of nitrogen annually relative to the median nitrogen use rate (Table 3), equivalent to 11% of the adoption ceiling.
left_text_column_width
Table 3. Current (2020) adoption level.
Unit: tN/yr
| estimate | 10,450,000 |
Left Text Column Width
Adoption Trend
Global average nitrogen use efficiency increased from 47.7% to 54.6% between 2000 and 2020, a rate of approximately 0.43%/yr (Ludemann et al., 2024). This increase accelerated somewhat in the latter decade, from an average rate of 0.38%/yr to 0.53%/yr. Underlying this increase were increases in both the amount of nitrogen used and the amount of excess nitrogen. Total nitrogen additions increased by approximately 2.64 Mt/yr, with the amount of nitrogen used increasing more rapidly (1.99 Mt/yr) than the amount of excess nitrogen (0.65 Mt/yr) between 2000 and 2020 (Ludemann et al., 2024). Although nitrogen use increased between 2000 and 2020 as yields increased, the increase in nitrogen use efficiency suggests uptake of this solution.
left_text_column_width
Adoption Ceiling
We estimated the adoption ceiling of improved nutrient management to be 95.13 Mt avoided excess nitrogen use/year (Table 4), including current adoption. This value reflects our estimate of the maximum potential reduction in nitrogen application while avoiding large yield losses and consists of the potential to avoid 62.25 Mt of synthetic nitrogen use and 32.88 Mt of manure and other organic nitrogen use, in addition to current adoption. In total, this is equivalent to an additional 68% reduction in global nitrogen use. The adoption ceiling was calculated as the difference between total nitrogen use at the current rate and total nitrogen use at the target rate (as described in Current Adoption), assuming no change in crop yields. For nitrogen applied to crops for which yield data were not available, the potential reduction in nitrogen use was assumed to be proportional to that of crops for which full data were available.
left_text_column_width
Table 4. Adoption ceiling.
Unit: tN/yr
| estimate | 105,580,000 |
Left Text Column Width
Achievable Adoption
We estimated that fertilizer use reductions of 69.85–91.06 Mt of nitrogen are achievable, reflecting current adoption plus nitrogen savings due to the achievement of nitrogen application rates equal to the median and 30th percentile of nitrogen application rates occurring in locations where yield gaps are small (Table 5).
This range is more ambitious than a comparable recent estimate by Gu et al. (2023), who found that reductions of approximately 42 Mt of nitrogen are avoidable via cost-effective implementation of similar practices. Differences in target nitrogen use efficiencies underlie differences between our estimates and those of Gu et al., whose findings correspond to an increase in global average cropland nitrogen use efficiency from 42% to 52%. Our estimates reflect higher target nitrogen use efficiencies. Nitrogen use efficiencies greater than 52% have been widely achieved through basic practice modification without compromising yields or requiring prohibitively expensive additional inputs. For instance, You et al. (2023) estimated that the global average nitrogen use efficiency could be increased to 78%. Similarly, cropland nitrogen use efficiency in the United States in 2020 was estimated to be 71%, and substantial opportunities for improved nitrogen use efficiency are still available within the United States (Ludemann et al., 2024), though Lu et al. (2019) and Swaney et al. (2018) report slightly lower estimates. These findings support our slightly more ambitious range of achievable nitrogen use reductions for this solution.
left_text_column_width
Table 5. Range of achievable adoption levels.
Unit: tN/yr
| Current Adoption | 10,450,000 |
| Achievable – Low | 69,850,000 |
| Achievable – High | 91,060,000 |
| Adoption Ceiling | 105,580,000 |
Left Text Column Width
We estimated that improved nutrient management has the potential to reduce emissions by 0.63 Gt CO₂‑eq/yr, with achievable emissions reductions of 0.42–0.54 Gt CO₂‑eq/yr (Table 6). This is equivalent to an additional 56–76% reduction in total nitrous oxide emissions from fertilizer use, based on the croplands represented in our analysis.
We estimated avoidable emissions by multiplying our estimates of adoption ceiling and achievable adoption by the relevant IPCC 2019 emissions factors, disaggregated by climate zone and fertilizer type. Under the adoption ceiling scenario, approximately 70% of emissions reductions occurred in wet climates, where emissions per t of applied fertilizer are higher. Reductions in synthetic fertilizer use, which are larger than reductions in organic fertilizer use, contributed about 76% of the potential avoidable emissions. We estimated that the current implementation of improved nutrient management was associated with 0.06 Gt CO₂‑eq/yr of avoided emissions.
Our estimates are slightly more optimistic but well within the range of the IPCC 2021 estimates, which found that improved nutrient management could reduce nitrous oxide emissions by 0.06–0.7 Gt CO₂‑eq/yr.
left_text_column_width
Table 6. Climate impact at different levels of adoption.
Unit: Gt CO₂-eq/yr, 100-yr basis
| Current Adoption | 0.06 |
| Achievable – Low | 0.42 |
| Achievable – High | 0.54 |
| Adoption Ceiling | 0.63 |
Left Text Column Width
Additional Benefits
Food Security
While excessive nutrients cause environmental problems in some parts of the world, insufficient nutrients are a significant problem in others, resulting in lower agricultural yields (Foley et al., 2011). Targeted, site-specific, efficient use of fertilizers can improve crop productivity (Mueller et al., 2012; Vanlauwe et al., 2015), improving food security globally.
Health
Domingo et al. (2021) estimated about 16,000 premature deaths annually in the United States are due to air pollution from the food sector and found that more than 3,500 premature deaths per year could be avoided through reduced use of ammonia fertilizer, a secondary particulate matter precursor. Better agriculture practices overall can reduce particulate matter-related premature deaths from the agriculture sector by 50% (Domingo et al., 2021). Nitrogen oxides from fertilized croplands is another source of agriculture-based air pollution, and improved management can lead to decreased respiratory and cardiovascular disease (Almarez et al., 2018; Sobota et al., 2015).
Nitrate contamination of drinking water due to excessive runoff from agriculture fields has been linked to several health disorders, including methemoglobinemia and cancer (Patel et al., 2022; Ward et al., 2018). Reducing nutrient runoff through better management is critical to minimize these risks (Ward et al., 2018).
Income & Work
Better nutrient management reduces farmers' input costs and increases profitability (Rurinda et al., 2020; Wang et al., 2020). It is especially beneficial to smallholder farmers in sub-Saharan Africa, where site-specific nutrient management programs have demonstrated a significant increase in yield (Chivenge et al., 2021). A review of 61 studies across 11 countries showed that site-specific nutrient management resulted in an average increase in yield by 12% and increased farmer’s’ income by 15% while improving nitrogen use efficiency (Chivenge et al., 2021).
Nature Protection
Nutrient runoff from agricultural systems is a major driver of water pollution globally, leading to eutrophication and hypoxic zones in aquatic ecosystems (Bijay-Singh & Craswell, 2021). Nitrogen pollution also harms terrestrial biodiversity through soil acidification and increases productivity of fast-growing species, including invasives, which can outcompete native species (Porter et al., 2013). Improved nutrient management is necessary to reduce nitrogen and phosphorus loads to water bodies (Withers et al., 2014; van Grinsven et al., 2019) and terrestrial ecosystems (Porter et al., 2013). These practices have been effective in reducing harmful algal blooms and preserving biodiversity in sensitive water systems (Scavia et al., 2014).
Resilience to Drought
Balanced nutrient concentration contributes to long-term soil fertility and improved soil health by enhancing organic matter content, microbial diversity, and nutrient cycling (Antil & Raj, 2020; Selim, 2020). Healthy soil experiences reduced erosion and has higher water content, which increases its resilience to droughts and extreme heat (Rockström et al., 2017).
left_text_column_width
Risks
Although substantial reductions in nitrogen use can be achieved in many places with no or minimal impacts on yields, reducing nitrogen application by too much can lead to yield declines, which in turn can boost demand for cropland, causing GHG-producing land use change. Reductions in only excess nitrogen application will prevent substantial yield losses.
left_text_column_width
Some nutrient management practices are associated with additional emissions. For example, nitrification inhibitors reduce direct nitrous oxide emissions (Qiao et al., 2014) but can increase ammonia volatilization and subsequent indirect nitrous oxide emissions (Lam et al., 2016). Additionally, in wet climates, nitrous oxide emissions may be reduced through the use of manure instead of synthetic fertilizers (Hergoualc’h et al., 2019), though impacts vary across sites and studies (Zhang et al., 2020). Increased demand for manure could increase livestock production, which has high associated GHG emissions. Emissions also arise from transporting manure to the site of use (Qin et al., 2021).
Although nitrous oxide has a strong direct climate-warming effect, fertilizer use can cool the climate through emissions of other reactive nitrogen-containing compounds (Gong et al., 2024). First, aerosols from fertilizers scatter heat from the sun and cool the climate (Shindell et al., 2009; Gong et al., 2024). Moreover, other reactive nitrogen compounds from fertilizers shorten the lifespan of methane in the atmosphere, reducing its warming effects (Pinder et al., 2012). Finally, nitrogen fertilizers that leave farm fields through volatilization or runoff are ultimately deposited elsewhere, enhancing photosynthesis and sequestering additional carbon in plants and soils (Zaehle et al., 2011; Gong et al., 2024). Improved nutrient management would reduce these cooling effects.
left_text_column_width
Interactions with Other Solutions
Reinforcing
Improved nutrient management will reduce emissions from the production phase of biomass crops, increasing their benefit.
left_text_column_width
Competing
Improved nutrient management will reduce the GHG production associated with each calorie and, therefore, the impacts of the Improve Diets and Reduce Food Loss and Waste solutions will be reduced
left_text_column_width
Each of these solutions could decrease emissions associated with fertilizer production, but improved nutrient management will reduce total demand for fertilizers.
left_text_column_width
Dashboard
Solution Basics
t avoided excess nitrogen application/yr
t CO₂-eq/unit
6
units
Current
1.05×10⁷6.99×10⁷9.11×10⁷
Achievable (Low to High)
Climate Impact
Gt CO₂-eq/yr
Current 0.06
0.420.54
US$ per t CO₂-eq
-85
Gradual
N₂O
tCO2-eq/ha
The Problem — Emissions of Nitrous Oxide Coming from Over-fertilized Soils
The world’s agricultural lands can emit high levels of nitrous oxide (N2O), the third most powerful greenhouse gas. These emissions stem from overusing nitrogen-based fertilizers, especially in regions in China, India, Western Europe, and central North America (in red). While crops absorb some of the nitrogen fertilizer we apply, much of what remains is lost to the atmosphere as nitrous oxide pollution or to local waterways as nitrate pollution. Using fertilizers more wisely can dramatically reduce greenhouse gas emissions and water pollution while maintaining high levels of crop production.
Analysis: Project Drawdown; Driscoll et al, In prep.
Geographic Guidance Introduction
Improved nutrient management will have the greatest emissions reduction if it is targeted at areas with the largest excesses of nitrogen fertilizer use. In 2020, China, India, and the United States alone accounted for 52% of global excess nitrogen application (Ludemann et al., 2024). Improved nutrient management could be particularly beneficial in China and India, where nutrient use efficiency is currently lower than average (Ludemann et al., 2024). You et al. (2023) also found potential for large increases in nitrogen use efficiency in parts of China, India, Australia, Northern Europe, the United States Midwest, Mexico, and Brazil under standard best management practices. Gu et al. (2024) found that nitrogen input reductions are economically feasible in most of Southern Asia, Northern and Western Europe, parts of the Middle East, North America, and Oceania.
In addition to regional patterns in the adoption ceiling, greater nitrous oxide emissions reductions are possible in wet climates or on irrigated croplands compared to dry climates. Nitrous oxide emissions tend to peak when nitrogen availability is high and soil moisture is in the ~70–90% range (Betterbach-Bahl et al., 2013; Elberling et al., 2023; Hao et al., 2025; Lawrence et al., 2021), though untangling the drivers of nitrous oxide emissions is complex (Lawrence et al., 2021). Water management to avoid prolonged periods of soil moisture in this range is an important complement to nutrient management in wet climates and on irrigated croplands (Deng et al., 2018).
Importantly, improved nutrient management, as defined here, is not appropriate for implementation in areas with nitrogen deficits or negligible nitrogen surpluses, including much of Africa. In these areas, crop yields are constrained by nitrogen availability, and an increase in nutrient inputs may be needed to achieve target yields. Additionally, nutrient management in paddy (flooded) rice systems is not included in this solution but rather in the Improve Rice Production solution.
Action Word
Improve
Solution Title
Nutrient Management
Classification
Highly Recommended
Lawmakers and Policymakers
- Focus policies and regulations on the four nutrient management principles – right rate, type, time, and place.
- Create dynamic nutrient management policies that account for varying practices, environments, drainage, historical land use, and other factors that may require adjusting nutrient regulations.
- Offer financial assistance responsive to local soil and weather conditions, such as grants and subsidies, insurance programs, and tax breaks, to encourage farmers to comply with regulations.
- Mandate insurance schemes that allow farmers to reduce fertilizer use.
- Mandate nutrient budgets or ceilings that are responsive to local yield, weather, and soil conditions.
- Require farmers to formulate nutrient management and fertilizer plans.
- Mandate efficiency rates for manure-spreading equipment.
- Ensure access to and require soil tests to inform fertilizer application.
- Invest in research on alternative organic nutrient sources.
- Create and expand education programs and extension services that highlight the problems that arise from the overuse of fertilizers, benefits of soil management such as cost-savings, and penalties for non-compliance
- Create ongoing support groups among farmers.
Further information:
- Nutrient management. Watershed Agricultural Council
- Nutrient management. U.S. Department of Agriculture
- Toolbox. Global Partnership on Nutrient Management
- Government relations and public policy job function action guide. Project Drawdown (2022)
- Legal job function action guide. Project Drawdown (2022)
Practitioners
- Use the four nutrient management principles – right rate, type, time, and place – to guide fertilizer application.
- Utilize or advocate for financial assistance and tax breaks for farmers to improve nutrient management techniques.
- Create and adhere to nutrient and fertilizer management plans.
- Conduct soil tests to inform fertilizer application.
- Use winter cover crops, crop rotations, residue retention, and split applications for fertilizer.
- Improve the efficiency of, and regularly calibrate, manure-spreading equipment.
- Leverage agroecological practices such as nutrient recycling and biological nitrogen fixation.
- Join, create, or participate in partnerships or certification programs dedicated to improving nutrient management.
- Take advantage of education programs, support groups, and extension services focused on improved nutrient management.
Further information:
- Nutrient management. Watershed Agricultural Council
- Nutrient management. U.S. Department of Agriculture
- Toolbox. Global Partnership on Nutrient Management
Business Leaders
- Provide incentives for farmers in primary sourcing regions to adopt best management practices for reducing nitrogen application.
- Invest in companies that use improved nutrient management techniques or produce equipment or research for fertilizer application and testing.
- Advocate to policymakers for improved nutrient management techniques, incentives, and regulations.
- Join, create, or participate in partnerships or certification programs dedicated to improving nutrient management practices.
- Promote products produced with improved nutrient management techniques and educate consumers about the importance of the practice.
- Create or support education programs and extension services that highlight the problems that arise from the overuse of fertilizers, benefits of soil management such as cost-savings, and penalties for non-compliance.
- Create ongoing support groups among farmers.
Further information:
- Nutrient management. Watershed Agricultural Council
- Nutrient management. U.S. Department of Agriculture
- Toolbox. Global Partnership on Nutrient Management
- Climate solutions at work. Project Drawdown (2021)
- Drawdown-aligned business framework. Project Drawdown (2021)
Nonprofit Leaders
- Start model farms to demonstrate improved nutrient management techniques, conduct experiments, and educate local farmers.
- Conduct and share research on improved nutrient management techniques, alternative organic fertilizers, or local policy options.
- Advocate to policymakers for improved nutrient management techniques, incentives, and regulations.
- Engage with businesses to encourage corporate responsibility and/or monitor water quality and soil health.
- Join, create, or participate in partnerships or certification programs dedicated to improving nutrient management practices.
- Create or support education programs and extension services that highlight the problems that arise from the overuse of fertilizers, benefits of soil management such as cost-savings, and penalties for non-compliance.
- Create ongoing support groups among farmers.
Further information:
- Nutrient management. Watershed Agricultural Council
- Nutrient management. U.S. Department of Agriculture
- Toolbox. Global Partnership on Nutrient Management
Investors
- Invest in companies developing technologies that support improved nutrient management such as precision fertilizer applicators, alternative fertilizers, soil management equipment, and software.
- Invest in ETFs and ESG funds that hold companies committed to improved nutrient management techniques in their portfolios.
- Encourage companies in your investment portfolio to adopt improved nutrient management.
- Provide access to capital at reduced rates for farmers adhering to improved nutrient management.
Further information:
- Nutrient management. Watershed Agricultural Council
- Nutrient management. U.S. Department of Agriculture
- Toolbox. Global Partnership on Nutrient Management
Philanthropists and International Aid Agencies
- Provide financing for farmers to improve nutrient management.
- Start model farms to demonstrate nutrient management techniques, conduct experiments, and educate local farmers.
- Conduct and share research on improved nutrient management, alternative organic fertilizers, or local policy options.
- Advocate to policymakers for improved nutrient management techniques, incentives, and regulations.
- Engage with businesses to encourage corporate responsibility and/or monitor water quality and soil health.
- Join, create, or participate in partnerships or certification programs dedicated to improving nutrient management practices.
- Create or support education programs and extension services that highlight the problems that arise from the overuse of fertilizers, benefits of soil management such as cost-savings, and penalties for non-compliance.
- Create ongoing support groups among farmers.
Further information:
- Nutrient management. Watershed Agricultural Council
- Nutrient management. U.S. Department of Agriculture
- Toolbox. Global Partnership on Nutrient Management
Thought Leaders
- Start model farms to demonstrate techniques, conduct experiments, and educate local farmers.
- Conduct and share research on improved nutrient management, alternative organic fertilizers, or local policy options.
- Advocate to policymakers for improved nutrient management techniques, incentives, and regulations.
- Engage with businesses to encourage corporate responsibility and/or monitor water quality and soil health.
- Join, create, or participate in partnerships dedicated to improving nutrient management practices.
- Create or support education programs and extension services that highlight the problems that arise from the overuse of fertilizers, benefits of soil management such as cost-savings, and penalties for non-compliance.
- Create ongoing support groups among farmers.
Further information:
- Nutrient management. Watershed Agricultural Council
- Nutrient management. U.S. Department of Agriculture
- Toolbox. Global Partnership on Nutrient Management
Technologists and Researchers
- Improve technology and cost-effectiveness of precision fertilizer application, slow-release fertilizer, alternative organic fertilizers, nutrient recycling, and monitoring equipment.
- Create tracking and monitoring software to support farmers' decision-making.
- Research and develop the application of AI and robotics for precise fertilizer application.
- Improve data and analytics to monitor soil and water quality, assist farmers, support policymaking, and assess the impacts of policies.
- Develop education and training applications to promote improved nutrient management and provide real-time feedback.
Further information:
- Nutrient management. Watershed Agricultural Council
- Nutrient management. U.S. Department of Agriculture
- Toolbox. Global Partnership on Nutrient Management
Communities, Households, and Individuals
- Create or join community-supported agriculture programs that source from farmers who used improved nutrient management practices.
- Conduct soil tests on your lawn and garden and reduce fertilizer use if you are over-fertilizing.
- Volunteer for soil and water quality monitoring and restoration projects.
- Start model farms to demonstrate techniques, conduct experiments, and educate local farmers.
- Advocate to policymakers for improved nutrient management techniques, incentives, and regulations.
- Engage with businesses to encourage corporate responsibility and/or monitor water quality and soil health.
- Join, create, or participate in partnerships dedicated to improving nutrient management.
- Create or support education programs and extension services that highlight the problems that arise from the overuse of fertilizers, benefits of soil management such as cost-savings, and penalties for non-compliance.
- Create ongoing support groups among farmers.
Further information:
- Nutrient management. Watershed Agricultural Council
- Nutrient management. U.S. Department of Agriculture
- Toolbox. Global Partnership on Nutrient Management
Sources
- Which factors influence farmers’ intentions to adopt nutrient management planning?, Daxini, A., et al. (2018)
- Quantification of environmental-economic trade-offs in nutrient management policies, Kaye-Blake, et al. (2019)
- Regulating farmer nutrient management: A three-state case study on the Delmarva Peninsula, Perez, M. R. (2015)
- Promise and performance of agricultural nutrient management policy: lessons from the Baltic Sea, Thorsøe, M. H., et al. (2021)
- Exploring nutrient management options to increase nitrogen and phosphorus use efficiencies in food production of China, Wang, M., et al. (2018)
- Quantifying nutrient budgets for sustainable nutrient management, Zhang, X., et al. (2020)
Evidence Base
There is high scientific consensus that reducing nitrogen surpluses through improved nutrient management reduces nitrous oxide emissions from croplands.
Nutrient additions to croplands produce an estimated 0.9 Gt CO₂‑eq/yr (range 0.7–1.1 Gt CO₂ -e/yr) of direct nitrous oxide emissions from fields, plus approximately 0.3 Gt CO₂‑eq/yr of indirect emissions from fertilizers that runoff into waterways or erode (Tian et al., 2020). Nitrous oxide emissions from croplands are directly linked to the amount of nitrogen applied. Furthermore, the amount of nitrous oxide emitted per unit of applied nitrogen is well quantified for a range of different nitrogen sources and field conditions (Reay et al., 2012; Shcherbak et al., 2014; Gerber et al., 2016; Intergovernmental Panel on Climate Change [IPCC], 2019; Hergoualc’h et al., 2021). Tools to improve nutrient management have been extensively studied, and practices that improve nitrogen use efficiency through right rate, time, place, and type principles have been implemented in some places for several decades (Fixen, 2020; Ludemann et al., 2024).
Recently, Gao & Cabrera Serrenho (2023) estimated that fertilizer-related emissions could be reduced up to 80% by 2050 relative to current levels using a combination of nutrient management and new fertilizer production methods. You et al. (2023) found that adopting improved nutrient management practices would increase nitrogen use efficiency from a global average of 48% to 78%, substantially reducing excess nitrogen. Wang et al. (2024) estimated that the use of enhanced-efficiency fertilizers could reduce nitrogen losses to the environment 70–75% for maize and wheat systems. Chivenge et al. (2021) found comparable results in smallholder systems in Africa and Asia.
The results presented in this document were produced through analysis of global datasets. We recognize that geographic biases can influence the development of global datasets and hope this work inspires research and data sharing on this topic in underrepresented regions.
left_text_column_width
Appendix
In this analysis, we calculated the potential for reducing crop nitrogen inputs and associated nitrous oxide emissions by integrating spatially explicit, crop-specific data on nitrogen inputs, crop yields, attainable yields, irrigated extent, and climate. Broadly, we calculated a “target” yield-scaled nitrogen input rate based on pixels with low yield gaps and calculated the difference between nitrous oxide emissions under the current rate and under the hypothetical target emissions rate, using nitrous oxide emissions factors disaggregated by fertilizer type and climate.
Emissions factors
We used Tier 1 emissions factors from the IPCC 2019 Refinement to the 2006 Guidelines for National Greenhouse Gas Inventories, including direct emissions factors as well as indirect emissions from volatilization and leaching pathways. Direct emissions factors represent the proportion of applied nitrogen emitted as nitrous oxide, while we calculated volatilization and leaching emissions factors by multiplying the proportion of applied nitrogen lost through these pathways by the proportion of volatilized or leached nitrogen ultimately emitted as nitrous oxide. Including both direct and indirect emissions, organic and synthetic fertilizers emit 4.97 kg CO₂‑eq/kg nitrogen and 8.66 kg CO₂‑eq/kg nitrogen, respectively, in wet climates, and 2.59 kg CO₂‑eq/kg nitrogen and 2.38 kg CO₂‑eq/kg nitrogen in dry climates. We included uncertainty bounds (2.5th and 97.5th percentiles) for all emissions factors.
We classified each pixel as “wet” or “dry” using an aridity index (AI) threshold of 0.65, calculated as the ratio of annual precipitation to potential evapotranspiration (PET) from TerraClimate data (1991–2020), based on a threshold of 0.65. For pixels in dry climates that contained irrigation, we took the weighted average of wet and dry emissions factors based on the fraction of cropland that was irrigated (Mehta et al., 2024). We excluded irrigated rice from this analysis due to large differences in nitrous oxide dynamics in flooded rice systems.
Current, target, and avoidable nitrogen inputs and emissions
Using highly disaggregated data on nitrogen inputsfrom Adalibieke et al. (2024) for 21 crop groups (Table S1), we calculated total crop-specific inputs of synthetic and organic nitrogen. We then averaged over 2016–2020 to reduce the influence of interannual variability in factors like fertilizer prices. These values are subsequently referred to as “current” nitrogen inputs. We calculated nitrous oxide emissions under current nitrogen inputs as the sum of the products of nitrogen inputs and the climatically relevant emissions factors for each fertilizer type.
Next, we calculated target nitrogen application rates in terms of kg nitrogen per ton of crop yield using data on actual and attainable yields for 17 crops from Gerber et al., 2024 (Table S1). For each crop, we first identified pixels in which the ratio of actual to attainable yields was above the 80th percentile globally. The target nitrogen application rate was then calculated as the 20th percentile of nitrogen application rates across low-yield-gap pixels. Finally, we calculated total target nitrogen inputs as the product of actual yields and target nitrogen input rates. We calculated hypothetical nitrous oxide emissions from target nitrogen inputs as the product of nitrogen inputs and the climatically relevant emissions factor for each fertilizer type.
The difference between current and target nitrogen inputs represents the amount by which nitrogen inputs could hypothetically be reduced without compromising crop productivity (i.e., “avoidable” nitrogen inputs). We calculated avoidable nitrous oxide emissions as the difference between nitrous oxide emissions with current nitrogen inputs and those with target nitrogen inputs. For crops for which no yield or attainable yield data were available, we applied the average percent reduction in nitrogen inputs under the target scenario from available crops to the nitrogen input data for missing crops to calculate the avoidable nitrogen inputs and emissions.
This simple and empirically driven method aimed to identify realistically low but nutritionally adequate nitrogen application rates by including only pixels with low yield gaps, which are unlikely to be substantially nutrient-constrained. We did not control for other factors affecting nitrogen availability, such as historical nutrient application rates or depletion, rotation with nitrogen fixing crops, or tillage and residue retention practices.
left_text_column_width
Table S1. Crops represented by the source data on nitrogen inputs (Adalibieke et al., 2024) and estimated and attainable yields (Gerber et al., 2024). Crop groups included consistently in both datasets are marked as “both,” and crop groups represented in the nitrogen input data but not in the yield datasets are marked as “nitrogen only.”
| Crop | Dataset(s) |
|---|---|
| Barley | Both |
| Cassava | Both |
| Cotton | Both |
| Maize | Both |
| Millet | Both |
| Oil Palm | Both |
| Potato | Both |
| Rice | Both |
| Rye | Both |
| Rapeseed | Both |
| Sorghum | Both |
| Soybean | Both |
| Sugarbeet | Both |
| Sugarcane | Both |
| Sunflower | Both |
| Sweet Potato | Both |
| Wheat | Both |
| Groundnut | Nitrogen only |
| Fruits | Nitrogen only |
| Vegetables | Nitrogen only |
| Other | Nitrogen only |
Left Text Column Width
Updated Date
Protect Forests
Mode
Cut Emissions
Cluster
Protect & Manage Ecosystems
Image
Image

Coming Soon
Off
Summary
We define the Protect Forests solution as the long-term protection of tree-dominated ecosystems through establishment of protected areas (PAs), managed with the primary goal of conserving nature, and land tenure for Indigenous peoples. These protections reduce forest degradation, avoiding GHG emissions and ensuring continued carbon sequestration by healthy forests. This solution addresses protection of forests on mineral soils. The Protect Peatlands and Protect Coastal Wetlands solutions address protection of forested peatlands and mangrove forests, respectively, and the Restore Forests solution addresses restoring degraded forests.
Overview
Forests store carbon in biomass and soils and serve as carbon sinks, taking up an estimated 12.8 Gt CO₂‑eq/yr (including mangroves and forested peatlands; Pan et al., 2024). Carbon stored in forests is released into the atmosphere through deforestation and degradation, which refer to forest clearing or reductions in ecosystem integrity from human influence (DellaSala et al., 2025). Humans cleared an average of 0.4% (16.3 Mha) of global forest area annually 2001–2019 (excluding wildfire but including mangroves and forested peatlands; Hansen et al., 2013). This produced a gross flux of 7.4 Gt CO₂‑eq/yr (Harris et al., 2021), equivalent to ~14% of total global GHG emissions over that period (Dhakal et al., 2022). Different forest types store varying amounts of carbon and experience different rates of clearing; in this analysis, we individually evaluate forest protection in boreal, temperate, subtropical, and tropical regions. We included woodlands in our definition of forests because they are not differentiated in the satellite-based data used in this analysis.
We consider forests to be protected if they 1) are formally designated as PAs (UNEP-WCMC and IUCN, 2024), or 2) are mapped as Indigenous peoples’ lands in the global study by Garnett et al. (2018). The International Union for Conservation of Nature defines PAs as areas managed primarily for the long-term conservation of nature and ecosystem services. They are disaggregated into six levels of protection, ranging from strict wilderness preserves to sustainable-use areas that allow for some natural resource extraction, including logging. We included all levels of protection in this analysis, primarily because not all PAs have been classified into these categories. We rely on existing maps of Indigenous peoples’ lands but emphasize that much of their extent has not been fully mapped nor recognized for its conservation benefits (Garnett et al., 2018). Innovative and equity-driven strategies for forest protection that recognize the land rights, sovereignty, and stewardship of Indigenous peoples and local communities are critical for achieving just and effective forest protection globally (Dawson et al., 2024; Fa et al., 2020; FAO, 2024; Garnett et al., 2018; Tran et al., 2020; Zafra-Calvo et al., 2017).
Indigenous peoples’ lands and PAs reduce, but do not eliminate, forest clearing relative to unprotected areas (Baragwanath et al., 2020; Blackman & Viet 2018; Li et al., 2024; McNicol et al., 2023; Sze et al. 2022; Wolf et al., 2023; Wade et al., 2020). We rely on estimates of current PA effectiveness for this analysis but highlight that improving management to further reduce land use change within PAs is a critical component of forest protection (Jones et al., 2018; Meng et al., 2023; Vijay et al., 2018; Visconti et al., 2019; Watson et al., 2014).
Market-based strategies and other policies can complement legal protections by increasing the value of intact forests and reducing incentives for clearing (e.g., Garett et al., 2019; Golub et al., 2021; Heilmayr et al., 2020; Lambin et al., 2018; Levy et al., 2023; Macdonald et al., 2024; Marin et al., 2022; Villoria et al., 2022; West et al., 2023). The estimates in this report are based on legal protection alone because the effectiveness of market-based strategies is difficult to quantify, but strategies such as sustainable commodities programs, reducing or redirecting agricultural subsidies, and strategic infrastructure planning will be further discussed in an Appendix (coming soon).
References
Adams, V. M., Iacona, G. D., & Possingham, H. P. (2019). Weighing the benefits of expanding protected areas versus managing existing ones. Nature Sustainability, 2(5), 404–411. https://doi.org/10.1038/s41893-019-0275-5
Anderegg, W. R. L., Trugman, A. T., Badgley, G., Anderson, C. M., Bartuska, A., Ciais, P., Cullenward, D., Field, C. B., Freeman, J., Goetz, S. J., Hicke, J. A., Huntzinger, D., Jackson, R. B., Nickerson, J., Pacala, S., & Randerson, J. T. (2020). Climate-driven risks to the climate mitigation potential of forests. Science, 368(6497), eaaz7005. https://doi.org/10.1126/science.aaz7005
Arneth, A., Leadley, P., Claudet, J., Coll, M., Rondinini, C., Rounsevell, M. D. A., Shin, Y.-J., Alexander, P., & Fuchs, R. (2023). Making protected areas effective for biodiversity, climate and food. Global Change Biology, 29(14), 3883–3894. https://doi.org/10.1111/gcb.16664
Baragwanath, K., & Bayi, E. (2020). Collective property rights reduce deforestation in the Brazilian Amazon. Proceedings of the National Academy of Sciences, 117(34), 20495–20502. https://doi.org/10.1073/pnas.1917874117
Barnes, M. D., Glew, L., Wyborn, C., & Craigie, I. D. (2018). Prevent perverse outcomes from global protected area policy. Nature Ecology & Evolution, 2(5), 759–762. https://doi.org/10.1038/s41559-018-0501-y
Bliege Bird, R., & Nimmo, D. (2018). Restore the lost ecological functions of people. Nature Ecology & Evolution, 2(7), 1050–1052. https://doi.org/10.1038/s41559-018-0576-5
Blackman, A., & Veit, P. (2018). Titled Amazon Indigenous Communities Cut Forest Carbon Emissions. Ecological Economics, 153, 56–67. https://doi.org/10.1016/j.ecolecon.2018.06.016
Brennan, A., Naidoo, R., Greenstreet, L., Mehrabi, Z., Ramankutty, N., & Kremen, C. (2022). Functional connectivity of the world’s protected areas. Science, 376(6597), 1101–1104. https://doi.org/10.1126/science.abl8974
Brinck, K., Fischer, R., Groeneveld, J., Lehmann, S., Dantas De Paula, M., Pütz, S., Sexton, J. O., Song, D., & Huth, A. (2017). High resolution analysis of tropical forest fragmentation and its impact on the global carbon cycle. Nature Communications, 8(1), 14855. https://doi.org/10.1038/ncomms14855
Bruner, A. G., Gullison, R. E., & Balmford, A. (2004). Financial Costs and Shortfalls of Managing and Expanding Protected-Area Systems in Developing Countries. BioScience, 54(12), 1119–1126. https://doi.org/10.1641/0006-3568(2004)054[1119:FCASOM]2.0.CO;2
Buotte, P. C., Law, B. E., Ripple, W. J., & Berner, L. T. (2020). Carbon sequestration and biodiversity co-benefits of preserving forests in the western United States. Ecological Applications, 30(2), e02039. https://doi.org/10.1002/eap.2039
Curtis, P. G., Slay, C. M., Harris, N. L., Tyukavina, A., & Hansen, M. C. (2018). Classifying drivers of global forest loss. Science, 361(6407), 1108–1111. https://doi.org/10.1126/science.aau3445
Dawson, N. M., Coolsaet, B., Bhardwaj, A., Booker, F., Brown, D., Lliso, B., Loos, J., Martin, A., Oliva, M., Pascual, U., Sherpa, P., & Worsdell, T. (2024). Is it just conservation? A typology of Indigenous peoples’ and local communities’ roles in conserving biodiversity. One Earth, 7(6), 1007–1021. https://doi.org/10.1016/j.oneear.2024.05.001
de Souza, S. E. X. F., Vidal, E., Chagas, G. de F., Elgar, A. T., & Brancalion, P. H. S. (2016). Ecological outcomes and livelihood benefits of community-managed agroforests and second growth forests in Southeast Brazil. Biotropica, 48(6), 868–881. https://doi.org/10.1111/btp.12388
Delacote, P., Le Velly, G., & Simonet, G. (2022). Revisiting the location bias and additionality of REDD+ projects: The role of project proponents status and certification. Resource and Energy Economics, 67, 101277. https://doi.org/10.1016/j.reseneeco.2021.101277
Delacote, P., Velly, G. L., & Simonet, G. (2024). Distinguishing potential and effective additionality of forest conservation interventions. Environment and Development Economics, 1–21. https://doi.org/10.1017/S1355770X24000202
DellaSala, D. A., Mackey, B., Kormos, C. F., Young, V., Boan, J. J., Skene, J. L., Lindenmayer, D. B., Kun, Z., Selva, N., Malcolm, J. R., & Laurance, W. F. (2025). Measuring forest degradation via ecological-integrity indicators at multiple spatial scales. Biological Conservation, 302, 110939. https://doi.org/10.1016/j.biocon.2024.110939
Dhakal, S., J.C. Minx, F.L. Toth, A. Abdel-Aziz, M.J. Figueroa Meza, K. Hubacek, I.G.C. Jonckheere, Yong-Gun Kim, G.F. Nemet, S. Pachauri, X.C. Tan, T. Wiedmann, 2022: Emissions Trends and Drivers. In IPCC, 2022: Climate Change 2022: Mitigation of Climate Change. Contribution of Working Group III to the Sixth Assessment Report of the Intergovernmental Panel on Climate Change [P.R. Shukla, J. Skea, R. Slade, A. Al Khourdajie, R. van Diemen, D. McCollum, M. Pathak, S. Some, P. Vyas, R. Fradera, M. Belkacemi, A. Hasija, G. Lisboa, S. Luz, J. Malley, (eds.)]. Cambridge University Press, Cambridge, UK and New York, NY, USA. doi: 10.1017/9781009157926.004
Dinerstein, E., Joshi, A. R., Hahn, N. R., Lee, A. T. L., Vynne, C., Burkart, K., Asner, G. P., Beckham, C., Ceballos, G., Cuthbert, R., Dirzo, R., Fankem, O., Hertel, S., Li, B. V., Mellin, H., Pharand-Deschênes, F., Olson, D., Pandav, B., Peres, C. A., … Zolli, A. (2024). Conservation Imperatives: Securing the last unprotected terrestrial sites harboring irreplaceable biodiversity. Frontiers in Science, 2. https://doi.org/10.3389/fsci.2024.1349350
Dye, A. W., Houtman, R. M., Gao, P., Anderegg, W. R. L., Fettig, C. J., Hicke, J. A., Kim, J. B., Still, C. J., Young, K., & Riley, K. L. (2024). Carbon, climate, and natural disturbance: A review of mechanisms, challenges, and tools for understanding forest carbon stability in an uncertain future. Carbon Balance and Management, 19(1), 35. https://doi.org/10.1186/s13021-024-00282-0
Ellison, D., N. Futter, M., & Bishop, K. (2012). On the forest cover–water yield debate: From demand- to supply-side thinking. Global Change Biology, 18(3), 806–820. https://doi.org/10.1111/j.1365-2486.2011.02589.x
ESA CCI (2019). Copernicus Climate Change Service, Climate Data Store: Land cover classification gridded maps from 1992 to present derived from satellite observation. Copernicus Climate Change Service (C3S) Climate Data Store (CDS). Accessed November 2024. doi: 10.24381/cds.006f2c9a
Fa, J. E., Watson, J. E., Leiper, I., Potapov, P., Evans, T. D., Burgess, N. D., Molnár, Z., Fernández-Llamazares, Á., Duncan, T., Wang, S., Austin, B. J., Jonas, H., Robinson, C. J., Malmer, P., Zander, K. K., Jackson, M. V., Ellis, E., Brondizio, E. S., & Garnett, S. T. (2020). Importance of Indigenous Peoples’ lands for the conservation of Intact Forest Landscapes. Frontiers in Ecology and the Environment, 18(3), 135–140. https://doi.org/10.1002/fee.2148
FAO. 2024. The State of the World’s Forests 2024 – Forest-sector innovations towards a more sustainable future. Rome. https://doi.org/10.4060/cd1211en
Filoso, S., Bezerra, M. O., Weiss, K. C. B., & Palmer, M. A. (2017). Impacts of forest restoration on water yield: A systematic review. PLOS ONE, 12(8), e0183210. https://doi.org/10.1371/journal.pone.0183210
Fletcher, M.-S., Hamilton, R., Dressler, W., & Palmer, L. (2021). Indigenous knowledge and the shackles of wilderness. Proceedings of the National Academy of Sciences, 118(40), e2022218118. https://doi.org/10.1073/pnas.2022218118
Fuller, C., Ondei, S., Brook, B. W., & Buettel, J. C. (2020). Protected-area planning in the Brazilian Amazon should prioritize additionality and permanence, not leakage mitigation. Biological Conservation, 248, 108673. https://doi.org/10.1016/j.biocon.2020.108673
Gallemore, C., Bowsher, A., Atheeque, A., Groff, E., & Furtado, J. (n.d.). The geography of avoided deforestation and sustainable forest management offsets: The enduring question of additionality. Climate Policy, 0(0), 1–17. https://doi.org/10.1080/14693062.2024.2383418
Gallemore, C., Bowsher, A., Atheeque, A., Groff, E., & Furtado, J. (2023). The geography of avoided deforestation and sustainable forest management offsets: The enduring question of additionality. Climate Policy, 0(0), 1–17. https://doi.org/10.1080/14693062.2024.2383418
Garnett, S. T., Burgess, N. D., Fa, J. E., Fernández-Llamazares, Á., Molnár, Z., Robinson, C. J., Watson, J. E. M., Zander, K. K., Austin, B., Brondizio, E. S., Collier, N. F., Duncan, T., Ellis, E., Geyle, H., Jackson, M. V., Jonas, H., Malmer, P., McGowan, B., Sivongxay, A., & Leiper, I. (2018). A spatial overview of the global importance of Indigenous lands for conservation. Nature Sustainability, 1(7), 369–374. https://doi.org/10.1038/s41893-018-0100-6
Garrett, R. D., Levy, S., Carlson, K. M., Gardner, T. A., Godar, J., Clapp, J., Dauvergne, P., Heilmayr, R., le Polain de Waroux, Y., Ayre, B., Barr, R., Døvre, B., Gibbs, H. K., Hall, S., Lake, S., Milder, J. C., Rausch, L. L., Rivero, R., Rueda, X., … Villoria, N. (2019). Criteria for effective zero-deforestation commitments. Global Environmental Change, 54, 135–147. https://doi.org/10.1016/j.gloenvcha.2018.11.003
Gibbs, H. K., Ruesch, A. S., Achard, F., Clayton, M. K., Holmgren, P., Ramankutty, N., & Foley, J. A. (2010). Tropical forests were the primary sources of new agricultural land in the 1980s and 1990s. Proceedings of the National Academy of Sciences, 107(38), 16732–16737. https://doi.org/10.1073/pnas.0910275107
Golub, A., Herrera, D., Leslie, G., Pietracci, B., & Lubowski, R. (2021). A real options framework for reducing emissions from deforestation: Reconciling short-term incentives with long-term benefits from conservation and agricultural intensification. Ecosystem Services, 49, 101275. https://doi.org/10.1016/j.ecoser.2021.101275
Graham, V., Geldmann, J., Adams, V. M., Negret, P. J., Sinovas, P., & Chang, H.-C. (2021). Southeast Asian protected areas are effective in conserving forest cover and forest carbon stocks compared to unprotected areas. Scientific Reports, 11(1), 23760. https://doi.org/10.1038/s41598-021-03188-w
Grantham, H. S., Duncan, A., Evans, T. D., Jones, K. R., Beyer, H. L., Schuster, R., Walston, J., Ray, J. C., Robinson, J. G., Callow, M., Clements, T., Costa, H. M., DeGemmis, A., Elsen, P. R., Ervin, J., Franco, P., Goldman, E., Goetz, S., Hansen, A., … Watson, J. E. M. (2020). Anthropogenic modification of forests means only 40% of remaining forests have high ecosystem integrity. Nature Communications, 11(1), 5978. https://doi.org/10.1038/s41467-020-19493-3
Gray, C. L., Hill, S. L. L., Newbold, T., Hudson, L. N., Börger, L., Contu, S., Hoskins, A. J., Ferrier, S., Purvis, A., & Scharlemann, J. P. W. (2016). Local biodiversity is higher inside than outside terrestrial protected areas worldwide. Nature Communications, 7(1), 12306. https://doi.org/10.1038/ncomms12306
Griscom, B. W., Adams, J., Ellis, P. W., Houghton, R. A., Lomax, G., Miteva, D. A., Schlesinger, W. H., Shoch, D., Siikamäki, J. V., Smith, P., Woodbury, P., Zganjar, C., Blackman, A., Campari, J., Conant, R. T., Delgado, C., Elias, P., Gopalakrishna, T., Hamsik, M. R., … Fargione, J. (2017). Natural climate solutions. Proceedings of the National Academy of Sciences, 114(44), 11645–11650. https://doi.org/10.1073/pnas.1710465114
Hansen, M. C., Potapov, P. V., Moore, R., Hancher, M., Turubanova, S. A., Tyukavina, A., Thau, D., Stehman, S. V., Goetz, S. J., Loveland, T. R., Kommareddy, A., Egorov, A., Chini, L., Justice, C. O., & Townshend, J. R. G. (2013). High-Resolution Global Maps of 21st-Century Forest Cover Change. Science, 342(6160), 850–853. https://doi.org/10.1126/science.1244693. Data available on-line from: http://earthenginepartners.appspot.com/science-2013-global-forest. Accessed through Global Forest Watch on 01/12/2024. www.globalforestwatch.org
Harris, N. L., Gibbs, D. A., Baccini, A., Birdsey, R. A., de Bruin, S., Farina, M., Fatoyinbo, L., Hansen, M. C., Herold, M., Houghton, R. A., Potapov, P. V., Suarez, D. R., Roman-Cuesta, R. M., Saatchi, S. S., Slay, C. M., Turubanova, S. A., & Tyukavina, A. (2021). Global maps of twenty-first century forest carbon fluxes. Nature Climate Change, 11(3), 234–240. https://doi.org/10.1038/s41558-020-00976-6
Heilmayr, R., Rausch, L. L., Munger, J., & Gibbs, H. K. (2020). Brazil’s Amazon Soy Moratorium reduced deforestation. Nature Food, 1(12), 801–810. https://doi.org/10.1038/s43016-020-00194-5
Herrera, D., Ellis, A., Fisher, B., Golden, C. D., Johnson, K., Mulligan, M., Pfaff, A., Treuer, T., & Ricketts, T. H. (2017). Upstream watershed condition predicts rural children’s health across 35 developing countries. Nature Communications, 8(1), 811. https://doi.org/10.1038/s41467-017-00775-2
Herrera, D., Pfaff, A., & Robalino, J. (2019). Impacts of protected areas vary with the level of government: Comparing avoided deforestation across agencies in the Brazilian Amazon. Proceedings of the National Academy of Sciences, 116(30), 14916–14925. https://doi.org/10.1073/pnas.1802877116
Jones, K. R., Venter, O., Fuller, R. A., Allan, J. R., Maxwell, S. L., Negret, P. J., & Watson, J. E. M. (2018). One-third of global protected land is under intense human pressure. Science, 360(6390), 788–791. https://doi.org/10.1126/science.aap9565
Kolden, C. A., Abatzoglou, J. T., Jones, M. W., & Jain, P. (2024). Wildfires in 2023. Nature Reviews Earth & Environment, 5(4), 238–240. https://doi.org/10.1038/s43017-024-00544-y
Kreye, M. M., Adams, D. C., & Escobedo, F. J. (2014). The Value of Forest Conservation for Water Quality Protection. Forests, 5(5), Article 5. https://doi.org/10.3390/f5050862
Lambin, E. F., Gibbs, H. K., Heilmayr, R., Carlson, K. M., Fleck, L. C., Garrett, R. D., le Polain de Waroux, Y., McDermott, C. L., McLaughlin, D., Newton, P., Nolte, C., Pacheco, P., Rausch, L. L., Streck, C., Thorlakson, T., & Walker, N. F. (2018). The role of supply-chain initiatives in reducing deforestation. Nature Climate Change, 8(2), 109–116. https://doi.org/10.1038/s41558-017-0061-1
Lawrence, D., Coe, M., Walker, W., Verchot, L., & Vandecar, K. (2022). The unseen effects of deforestation: biophysical effects on climate. Frontiers in Forests and Global Change, 5. https://doi.org/10.3389/ffgc.2022.756115
Levy, S. A., Cammelli, F., Munger, J., Gibbs, H. K., & Garrett, R. D. (2023). Deforestation in the Brazilian Amazon could be halved by scaling up the implementation of zero-deforestation cattle commitments. Global Environmental Change, 80, 102671. https://doi.org/10.1016/j.gloenvcha.2023.102671
Li, G., Fang, C., Watson, J. E. M., Sun, S., Qi, W., Wang, Z., & Liu, J. (2024). Mixed effectiveness of global protected areas in resisting habitat loss. Nature Communications, 15(1), 8389. https://doi.org/10.1038/s41467-024-52693-9
Lindenmayer, D. (2024). Key steps toward expanding protected areas to conserve global biodiversity. Frontiers in Science, 2. https://doi.org/10.3389/fsci.2024.1426480
Lutz, J. A., Furniss, T. J., Johnson, D. J., Davies, S. J., Allen, D., Alonso, A., Anderson-Teixeira, K. J., Andrade, A., Baltzer, J., Becker, K. M. L., Blomdahl, E. M., Bourg, N. A., Bunyavejchewin, S., Burslem, D. F. R. P., Cansler, C. A., Cao, K., Cao, M., Cárdenas, D., Chang, L.-W., … Zimmerman, J. K. (2018). Global importance of large-diameter trees. Global Ecology and Biogeography, 27(7), 849–864. https://doi.org/10.1111/geb.12747
Macdonald, K., Diprose, R., Grabs, J., Schleifer, P., Alger, J., Bahruddin, Brandao, J., Cashore, B., Chandra, A., Cisneros, P., Delgado, D., Garrett, R., & Hopkinson, W. (2024). Jurisdictional approaches to sustainable agro-commodity governance: The state of knowledge and future research directions. Earth System Governance, 22, 100227. https://doi.org/10.1016/j.esg.2024.100227
McCallister, M., Krasovskiy, A., Platov, A., Pietracci, B., Golub, A., Lubowski, R., & Leslie, G. (2022). Forest protection and permanence of reduced emissions. Frontiers in Forests and Global Change, 5. https://doi.org/10.3389/ffgc.2022.928518
Marin, F. R., Zanon, A. J., Monzon, J. P., Andrade, J. F., Silva, E. H. F. M., Richter, G. L., Antolin, L. A. S., Ribeiro, B. S. M. R., Ribas, G. G., Battisti, R., Heinemann, A. B., & Grassini, P. (2022). Protecting the Amazon forest and reducing global warming via agricultural intensification. Nature Sustainability, 5(12), 1018–1026. https://doi.org/10.1038/s41893-022-00968-8
McNicol, I. M., Keane, A., Burgess, N. D., Bowers, S. J., Mitchard, E. T. A., & Ryan, C. M. (2023). Protected areas reduce deforestation and degradation and enhance woody growth across African woodlands. Communications Earth & Environment, 4(1), 1–14. https://doi.org/10.1038/s43247-023-01053-4
Melo, F. P. L., Parry, L., Brancalion, P. H. S., Pinto, S. R. R., Freitas, J., Manhães, A. P., Meli, P., Ganade, G., & Chazdon, R. L. (2021). Adding forests to the water–energy–food nexus. Nature Sustainability, 4(2), 85–92. https://doi.org/10.1038/s41893-020-00608-z
Meng, Z., Dong, J., Ellis, E. C., Metternicht, G., Qin, Y., Song, X.-P., Löfqvist, S., Garrett, R. D., Jia, X., & Xiao, X. (2023). Post-2020 biodiversity framework challenged by cropland expansion in protected areas. Nature Sustainability, 6(7), 758–768. https://doi.org/10.1038/s41893-023-01093-w
Morales-Hidalgo, D., Oswalt, S. N., & Somanathan, E. (2015). Status and trends in global primary forest, protected areas, and areas designated for conservation of biodiversity from the Global Forest Resources Assessment 2015. Forest Ecology and Management, 352, 68–77. https://doi.org/10.1016/j.foreco.2015.06.011
Mykleby, P. M., Snyder, P. K., & Twine, T. E. (2017). Quantifying the trade-off between carbon sequestration and albedo in midlatitude and high-latitude North American forests. Geophysical Research Letters, 44(5), 2493–2501. https://doi.org/10.1002/2016GL071459
Nabuurs, G-J., R. Mrabet, A. Abu Hatab, M. Bustamante, H. Clark, P. Havlík, J. House, C. Mbow, K.N. Ninan, A. Popp, S. Roe, B. Sohngen, S. Towprayoon, 2022: Agriculture, Forestry and Other Land Uses (AFOLU). In IPCC, 2022: Climate Change 2022: Mitigation of Climate Change. Contribution of Working Group III to the Sixth Assessment Report of the Intergovernmental Panel on Climate Change [P.R. Shukla, J. Skea, R. Slade, A. Al Khourdajie, R. van Diemen, D. McCollum, M. Pathak, S. Some, P. Vyas, R. Fradera, M. Belkacemi, A. Hasija, G. Lisboa, S. Luz, J. Malley, (eds.)]. Cambridge University Press, Cambridge, UK and New York, NY, USA. doi: 10.1017/9781009157926.009
Naidoo, R., Gerkey, D., Hole, D., Pfaff, A., Ellis, A. M., Golden, C. D., Herrera, D., Johnson, K., Mulligan, M., Ricketts, T. H., & Fisher, B. (2019). Evaluating the impacts of protected areas on human well-being across the developing world. Science Advances, 5(4), eaav3006. https://doi.org/10.1126/sciadv.aav3006
Oldekop, J. A., Rasmussen, L. V., Agrawal, A., Bebbington, A. J., Meyfroidt, P., Bengston, D. N., Blackman, A., Brooks, S., Davidson-Hunt, I., Davies, P., Dinsi, S. C., Fontana, L. B., Gumucio, T., Kumar, C., Kumar, K., Moran, D., Mwampamba, T. H., Nasi, R., Nilsson, M., … Wilson, S. J. (2020). Forest-linked livelihoods in a globalized world. Nature Plants, 6(12), 1400–1407. https://doi.org/10.1038/s41477-020-00814-9
Pan, Y., Birdsey, R. A., Phillips, O. L., Houghton, R. A., Fang, J., Kauppi, P. E., Keith, H., Kurz, W. A., Ito, A., Lewis, S. L., Nabuurs, G.-J., Shvidenko, A., Hashimoto, S., Lerink, B., Schepaschenko, D., Castanho, A., & Murdiyarso, D. (2024). The enduring world forest carbon sink. Nature, 631(8021), 563–569. https://doi.org/10.1038/s41586-024-07602-x
Phillips, C. A., Rogers, B. M., Elder, M., Cooperdock, S., Moubarak, M., Randerson, J. T., & Frumhoff, P. C. (2022). Escalating carbon emissions from North American boreal forest wildfires and the climate mitigation potential of fire management. Science Advances, 8(17), eabl7161. https://doi.org/10.1126/sciadv.abl7161
Reddington, C. L., Butt, E. W., Ridley, D. A., Artaxo, P., Morgan, W. T., Coe, H., & Spracklen, D. V. (2015). Air quality and human health improvements from reductions in deforestation-related fire in Brazil. Nature Geoscience, 8(10), 768–771. https://doi.org/10.1038/ngeo2535
Richter, J., Goldman, E., Harris, N., Gibbs, D., Rose, M., Peyer, S., Richardson, S., & Velappan, H. (2024). Spatial Database of Planted Trees (SDPT Version 2.0) [Dataset]. https://doi.org/10.46830/writn.23.00073
Rogers, B. M., Mackey, B., Shestakova, T. A., Keith, H., Young, V., Kormos, C. F., DellaSala, D. A., Dean, J., Birdsey, R., Bush, G., Houghton, R. A., & Moomaw, W. R. (2022). Using ecosystem integrity to maximize climate mitigation and minimize risk in international forest policy. Frontiers in Forests and Global Change, 5. https://doi.org/10.3389/ffgc.2022.929281
Ruseva, T., Marland, E., Szymanski, C., Hoyle, J., Marland, G., & Kowalczyk, T. (2017). Additionality and permanence standards in California’s Forest Offset Protocol: A review of project and program level implications. Journal of Environmental Management, 198, 277–288. https://doi.org/10.1016/j.jenvman.2017.04.082
Sarira, T. V., Zeng, Y., Neugarten, R., Chaplin-Kramer, R., & Koh, L. P. (2022). Co-benefits of forest carbon projects in Southeast Asia. Nature Sustainability, 5(5), 393–396. https://doi.org/10.1038/s41893-022-00849-0
Seymour, F., Wolosin, M., & Gray, E. (2022, October 23). Policies underestimate forests’ full effect on the climate. World Resources Institute. https://www.wri.org/insights/how-forests-affect-climate
Smith, C., Baker, J. C. A., & Spracklen, D. V. (2023). Tropical deforestation causes large reductions in observed precipitation. Nature, 615(7951), 270–275. https://doi.org/10.1038/s41586-022-05690-1
Soto-Navarro, C., Ravilious, C., Arnell, A., de Lamo, X., Harfoot, M., Hill, S. L. L., Wearn, O. R., Santoro, M., Bouvet, A., Mermoz, S., Le Toan, T., Xia, J., Liu, S., Yuan, W., Spawn, S. A., Gibbs, H. K., Ferrier, S., Harwood, T., Alkemade, R., … Kapos, V. (2020). Mapping co-benefits for carbon storage and biodiversity to inform conservation policy and action. Philosophical Transactions of the Royal Society B: Biological Sciences, 375(1794), 20190128. https://doi.org/10.1098/rstb.2019.0128
Sunderlin, W. D., Angelsen, A., Belcher, B., Burgers, P., Nasi, R., Santoso, L., & Wunder, S. (2005). Livelihoods, forests, and conservation in developing countries: An Overview. World Development, 33(9), 1383–1402. https://doi.org/10.1016/j.worlddev.2004.10.004
Sweeney, B. W., Bott, T. L., Jackson, J. K., Kaplan, L. A., Newbold, J. D., Standley, L. J., Hession, W. C., & Horwitz, R. J. (2004). Riparian deforestation, stream narrowing, and loss of stream ecosystem services. Proceedings of the National Academy of Sciences, 101(39), 14132–14137. https://doi.org/10.1073/pnas.0405895101
Sze, J. S., Carrasco, L. R., Childs, D., & Edwards, D. P. (2022). Reduced deforestation and degradation in Indigenous Lands pan-tropically. Nature Sustainability, 5(2), 123–130. https://doi.org/10.1038/s41893-021-00815-2
Tauli-Corpuz, V., Alcorn, J., Molnar, A., Healy, C., & Barrow, E. (2020). Cornered by PAs: Adopting rights-based approaches to enable cost-effective conservation and climate action. World Development, 130, 104923. https://doi.org/10.1016/j.worlddev.2020.104923
Tran, T. C., Ban, N. C., & Bhattacharyya, J. (2020). A review of successes, challenges, and lessons from Indigenous protected and conserved areas. Biological Conservation, 241, 108271. https://doi.org/10.1016/j.biocon.2019.108271
UNEP-WCMC and IUCN (2024), Protected Planet: The World Database on Protected Areas (WDPA) and World Database on Other Effective Area-based Conservation Measures (WD-OECM) [Online], Accessed November 2024, Cambridge, UK: UNEP-WCMC and IUCN. Available at: www.protectedplanet.net.
Vijay, V., Fisher, J. R. B., & Armsworth, P. R. (2022). Co-benefits for terrestrial biodiversity and ecosystem services available from contrasting land protection policies in the contiguous United States. Conservation Letters, 15(5), e12907. https://doi.org/10.1111/conl.12907
Villoria, N., Garrett, R., Gollnow, F., & Carlson, K. (2022). Leakage does not fully offset soy supply-chain efforts to reduce deforestation in Brazil. Nature Communications, 13(1), 5476. https://doi.org/10.1038/s41467-022-33213-z
Visconti, P., Butchart, S. H. M., Brooks, T. M., Langhammer, P. F., Marnewick, D., Vergara, S., Yanosky, A., & Watson, J. E. M. (2019). Protected area targets post-2020. Science, 364(6437), 239–241. https://doi.org/10.1126/science.aav6886
Wade, C. M., Austin, K. G., Cajka, J., Lapidus, D., Everett, K. H., Galperin, D., Maynard, R., & Sobel, A. (2020). What Is Threatening Forests in Protected Areas? A Global Assessment of Deforestation in Protected Areas, 2001–2018. Forests, 11(5), Article 5. https://doi.org/10.3390/f11050539
Waldron, A., Adams, V., Allan, J., Arnell, A., Asner, G., Atkinson, S., Baccini, A., Baillie, J., Balmford, A., & Austin Beau, J. (2020). Protecting 30% of the planet for nature: Costs, benefits and economic implications. https://pure.iiasa.ac.at/id/eprint/16560/1/Waldron_Report_FINAL_sml.pdf
Walton, Z. L., Poudyal, N. C., Hepinstall-Cymerman, J., Johnson Gaither, C., & Boley, B. B. (2016). Exploring the role of forest resources in reducing community vulnerability to the heat effects of climate change. Forest Policy and Economics, 71, 94–102. https://doi.org/10.1016/j.forpol.2015.09.001
Watson, J. E. M., Dudley, N., Segan, D. B., & Hockings, M. (2014). The performance and potential of protected areas. Nature, 515(7525), 67–73. https://doi.org/10.1038/nature13947
West, T. A. P., Wunder, S., Sills, E. O., Börner, J., Rifai, S. W., Neidermeier, A. N., Frey, G. P., & Kontoleon, A. (2023). Action needed to make carbon offsets from forest conservation work for climate change mitigation. Science, 381(6660), 873–877. https://doi.org/10.1126/science.ade3535
Wolf, C., Levi, T., Ripple, W. J., Zárrate-Charry, D. A., & Betts, M. G. (2021). A forest loss report card for the world’s protected areas. Nature Ecology & Evolution, 5(4), 520–529. https://doi.org/10.1038/s41559-021-01389-0
Zafra-Calvo, N., Pascual, U., Brockington, D., Coolsaet, B., Cortes-Vazquez, J. A., Gross-Camp, N., Palomo, I., & Burgess, N. D. (2017). Towards an indicator system to assess equitable management in protected areas. Biological Conservation, 211, 134–141. https://doi.org/10.1016/j.biocon.2017.05.014
Credits
Lead Fellow
Avery Driscoll, Ph.D.
Contributors
Ruthie Burrows, Ph.D.
James Gerber, Ph.D.
Yusuf Jameel, Ph.D.
Daniel Jasper
Alex Sweeney
Internal Reviewers
Hannah Henkin
Ted Otte
Tina Swanson, Ph.D.
Paul West, Ph.D.
Effectiveness
We estimated that one hectare of forest protection provides total carbon benefits of 0.299–2.204 t CO₂‑eq/yr depending on the biome (Table 1; Appendix). This effectiveness estimate includes avoided emissions and preserved sequestration capacity attributable to the reduction in forest loss conferred by protection (Equation 1). First, we calculated the difference between the rate of human-caused forest loss outside of PAs (Forest lossbaseline) and the rate inside of PAs (Forest lossprotected). We then multiplied the annual rate of avoided forest loss by the sum of the carbon stored in one hectare of forest (Carbonstock) and the amount of carbon that one hectare of intact forest takes up over a 30-yr timeframe (Carbonsequestration).
Equation 1.
Effectiveness= (Forest lossbaseline- Forest lossprotected)* (Carbonstock + Carbonsequestration)
Each of these factors varies across biomes. Based on our definition, for instance, the effectiveness of forest protection in boreal forests is lower than that in tropical and subtropical forests primarily because the former face lower rates of human-caused forest loss (though greater wildfire impacts). Importantly, the effectiveness of forest protection as defined here reflects only a small percentage of the carbon stored (394 t CO₂‑eq ) and absorbed (4.25 t CO₂‑eq/yr ) per hectare of forest (Harris et al., 2021). This is because humans clear ~0.4% of forest area annually, and forest protection is estimated to reduce human-caused forest loss by an average of 40.5% (Curtis et al., 2018; Wolf et al., 2023).
left_text_column_width
Table 1. Effectiveness at avoiding emissions and sequestering carbon (t CO₂‑eq /ha/yr, 100-yr basis), with carbon sequestration calculated over a 30-yr timeframe. Differences in values between biomes are driven by variation in forest carbon stocks and sequestration rates, baseline rates of forest loss, and effectiveness of PAs at reducing forest loss. See the Appendix for source data and calculation details. Emissions and sequestration values may not sum to total effectiveness due to rounding.
Unit: t CO₂‑eq/ha/yr
| Avoided emissions | 0.207 |
| Sequestration | 0.091 |
| Total effectiveness | 0.299 |
Unit: t CO₂‑eq/ha/yr
| Avoided emissions | 0.832 |
| Sequestration | 0.572 |
| Total effectiveness | 1.403 |
Unit: t CO₂‑eq/ha/yr
| Avoided emissions | 1.860 |
| Sequestration | 0.344 |
| Total effectiveness | 2.204 |
Unit: t CO₂‑eq/ha/yr
| Avoided emissions | 1.190 |
| Sequestration | 0.300 |
| Total effectiveness | 1.489 |
Left Text Column Width
Cost
We estimated that forest protection costs approximately US$2/t CO₂‑eq (Table 2). Data related to the costs of forest protection are limited, and these estimates are uncertain. The costs of forest protection include up-front costs of land acquisition and ongoing costs of management and enforcement. The market price of land reflects the opportunity cost of not using the land for other purposes (e.g., agriculture or logging). Protecting forests also generates revenue, notably through increased tourism. Costs and revenues vary across regions, depending on the costs of land and enforcement and potential for tourism.
The cost of land acquisition for ecosystem protection was estimated by Dienerstein et al. (2024), who found a median cost of US$988/ha (range: US$59–6,616/ha), which we amortized over 30 years. Costs of PA maintenance were estimated at US$9–17/ha/yr (Bruner et al., 2004; Waldron et al., 2020). These estimates reflect the costs of effective enforcement and management, but many existing PAs do not have adequate funds for effective enforcement (Adams et al., 2019; Barnes et al., 2018; Burner et al., 2004). Tourism revenues directly attributable to forest protection were estimated to be US$43/ha/yr (Waldron et al., 2020), not including downstream revenues from industries that benefit from increased tourism. Inclusion of a tourism multiplier would substantially increase the estimated economic benefits of forest protection.
left_text_column_width
Table 2. Cost per unit of climate impact.
Unit: 2023 US$/t CO₂‑eq, 100-yr basis
| median | 2 |
Left Text Column Width
Methods and Supporting Data
Crezee, B. et al. Mapping peat thickness and carbon stocks of the central Congo Basin using field data. Nature Geoscience 15: 639-644 (2022). https://www.nature.com/articles/s41561-022-00966-7. Data downloaded from https://congopeat.net/maps/, using classes 4 and 5 only (peat classes).
Curtis, P. G., Slay, C. M., Harris, N. L., Tyukavina, A., & Hansen, M. C. (2018). Classifying drivers of global forest loss. Science, 361(6407), 1108–1111. https://doi.org/10.1126/science.aau3445
ESA CCI (2019). Copernicus Climate Change Service, Climate Data Store: Land cover classification gridded maps from 1992 to present derived from satellite observation. Copernicus Climate Change Service (C3S) Climate Data Store (CDS). Accessed November 2024. doi: 10.24381/cds.006f2c9a
Garnett, S. T., Burgess, N. D., Fa, J. E., Fernández-Llamazares, Á., Molnár, Z., Robinson, C. J., Watson, J. E. M., Zander, K. K., Austin, B., Brondizio, E. S., Collier, N. F., Duncan, T., Ellis, E., Geyle, H., Jackson, M. V., Jonas, H., Malmer, P., McGowan, B., Sivongxay, A., & Leiper, I. (2018). A spatial overview of the global importance of Indigenous lands for conservation. Nature Sustainability, 1(7), 369–374. https://doi.org/10.1038/s41893-018-0100-6
Giri C, Ochieng E, Tieszen LL, Zhu Z, Singh A, Loveland T, Masek J, Duke N (2011). Status and distribution of mangrove forests of the world using earth observation satellite data (version 1.3, updated by UNEP-WCMC). Global Ecology and Biogeography 20: 154-159. doi: 10.1111/j.1466-8238.2010.00584.x . Data URL: http://data.unep-wcmc.org/datasets/4
Gumbricht, T. et al. An expert system model for mapping tropical wetlands and peatlands reveals South America as the largest contributor. Global Change Biology 23, 3581–3599 (2017). https://onlinelibrary.wiley.com/doi/full/10.1111/gcb.13689
Hansen, M. C., Potapov, P. V., Moore, R., Hancher, M., Turubanova, S. A., Tyukavina, A., Thau, D., Stehman, S. V., Goetz, S. J., Loveland, T. R., Kommareddy, A., Egorov, A., Chini, L., Justice, C. O., & Townshend, J. R. G. (2013). High-Resolution Global Maps of 21st-Century Forest Cover Change. Science, 342(6160), 850–853. https://doi.org/10.1126/science.1244693. Data available on-line from: http://earthenginepartners.appspot.com/science-2013-global-forest. Accessed through Global Forest Watch on 01/12/2024. www.globalforestwatch.org
Harris, N. L., Gibbs, D. A., Baccini, A., Birdsey, R. A., de Bruin, S., Farina, M., Fatoyinbo, L., Hansen, M. C., Herold, M., Houghton, R. A., Potapov, P. V., Suarez, D. R., Roman-Cuesta, R. M., Saatchi, S. S., Slay, C. M., Turubanova, S. A., & Tyukavina, A. (2021). Global maps of twenty-first century forest carbon fluxes. Nature Climate Change, 11(3), 234–240. https://doi.org/10.1038/s41558-020-00976-6
Hastie, A. et al. Risks to carbon storage from land-use change revealed by peat thickness maps of Peru. Nature Geoscience 15: 369-374 (2022). https://www.nature.com/articles/s41561-022-00923-4
Miettinen, J., Shi, C. & Liew, S. C. Land cover distribution in the peatlands of Peninsular Malaysia, Sumatra and Borneo in 2015 with changes since 1990. Global Ecological Conservation. 6, 67– 78 (2016). https://www.sciencedirect.com/science/article/pii/S2351989415300470
UNEP-WCMC and IUCN (2024), Protected Planet: The World Database on Protected Areas (WDPA) and World Database on Other Effective Area-based Conservation Measures (WD-OECM) [Online], Accessed November 2024, Cambridge, UK: UNEP-WCMC and IUCN. Available at: www.protectedplanet.net.
Wolf, C., Levi, T., Ripple, W. J., Zárrate-Charry, D. A., & Betts, M. G. (2021). A forest loss report card for the world’s protected areas. Nature Ecology & Evolution, 5(4), 520–529. https://doi.org/10.1038/s41559-021-01389-0
Xu et al. PEATMAP: Refining estimates of global peatland distribution based on a meta-analysis. CATENA 160: 134-140 (2018). https://www.sciencedirect.com/science/article/pii/S0341816217303004
Learning Curve
A learning curve is defined here as falling costs with increased adoption. The costs of forest protection do not fall with increasing adoption, so there is no learning curve for this solution.
left_text_column_width
Speed of Action
Speed of action refers to how quickly a climate solution physically affects the atmosphere after it is deployed. This is different from speed of deployment, which is the pace at which solutions are adopted.
At Project Drawdown, we define the speed of action for each climate solution as gradual, emergency brake, or delayed.
Protect Forests is an EMERGENCY BRAKE climate solution. It has the potential to deliver a more rapid impact than nominal and delayed solutions. Because emergency brake solutions can deliver their climate benefits quickly, they can help accelerate our efforts to address dangerous levels of climate change. For this reason, they are a high priority.
left_text_column_width
Caveats
Additionality, or the degree to which emissions reductions are above and beyond a baseline, is a key caveat for emissions avoided through forest protection (e.g., Fuller et al., 2020; Ruseva et al., 2017). Emissions avoided via forest protection are only considered additional if that forest would have been cleared or degraded without protection (Delacote et al., 2022; Delacote et al., 2024; Gallemore et al., 2020). In this analysis, additionality is addressed by using baseline rates of forest loss outside of PAs in the effectiveness calculation. Additionality is particularly important when forest protection is used to generate carbon offsets. However, the likelihood of forest removal in the absence of protection is often difficult to determine at the local level.
Permanence, or the durability of stored carbon over long timescales, is another important consideration not directly addressed in this solution. Carbon stored in forests can be compromised by natural factors, like drought, heat, flooding, wildfire, pests, and diseases, which are further exacerbated by climate change (Anderegg et al., 2020; Dye et al., 2024). Forest losses via wildfire in particular can create very large pulses of emissions (e.g., Kolden et al. 2024; Phillips et al. 2022) that negate accumulated carbon benefits of forest protection. Reversal of legal protections, illegal forest clearing, biodiversity loss, edge effects from roads, and disturbance from permitted uses can also cause forest losses directly or reduce ecosystem integrity, further increasing vulnerability to other stressors (McCallister et al., 2022).
left_text_column_width
Current Adoption
We estimated that approximately 1,673 Mha of forests are currently recognized as PAs or Indigenous peoples’ lands (Table 3; Garnett et al., 2018; UNEP-WCMC and IUCN, 2024). Using two different maps of global forests that differ in their methodologies and definitions (ESA CCI, 2019; Hansen et al., 2013), we found an upper-end estimate of 1,943 Mha protected and a lower-end estimate of 1,404 Mha protected. These two maps classify forests using different thresholds for canopy cover and vegetation height, different satellite data, and different classification algorithms (see the Appendix for additional details).
Based on our calculations, tropical forests make up the majority of forested PAs, with approximately 936 Mha under protection, followed by boreal forests (467 Mha), temperate forests (159 Mha), and subtropical forests (112 Mha). We estimate that 49% of all forests have some legal protection, though only 7% of forests are under strict protection (IUCN class I or II), with the remaining area protected under other IUCN levels, as OECMs, or as Indigenous peoples’ lands.
left_text_column_width
Table 3. Current (circa 2023) forest and woodland area under legal protection by biome (Mha). The low and high values are calculated using two different maps of global forest cover that differ in methodology for defining a forest (ESA CCI, 2019; Hansen et al., 2013). Biome-level values may not sum to global totals due to rounding.
Unit: Mha
| low | 313 |
| mean | 467 |
| high | 621 |
Unit: Mha
| low | 135 |
| mean | 159 |
| high | 183 |
Unit: Mha
| low | 85 |
| mean | 112 |
| high | 138 |
Unit: Mha
| low | 872 |
| mean | 936 |
| high | 1,000 |
Unit: Mha
| low | 1,404 |
| mean | 1,673 |
| high | 1,943 |
Left Text Column Width
Adoption Trend
We calculated the rate of PA expansion based on the year the PA was established. We do not have data on the expansion rate of Indigenous peoples’ lands, so the calculated adoption trend reflects only PAs. An average of 19 Mha of additional forests were protected each year between 2000 and 2020 (Table 4; Figure 1), representing a roughly 2% increase in PAs per year (excluding Indigenous peoples’ lands that are not located in PAs). There were large year-to-year differences in how much new forest area was protected over this period, ranging from only 6.4 Mha in 2020 to over 38 Mha in both 2000 and 2006. Generally, the rate at which forest protection is increasing has been decreasing, with an average increase of 27 Mha/yr between 2000–2010 declining to 11 Mha/yr between 2010–2020. Recent rates of forest protection (2010–2020) are highest in the tropics (5.6 Mha/yr), followed by temperate regions (2.4 Mha/yr) and the boreal (2.0 Mha/yr), and lowest in the subtropics (0.7 Mha/yr).
left_text_column_width
Figure 1. Trend in forest protection by climate zone. These values reflect only the area located within PAs; Indigenous peoples’ lands, which were not included in the calculation of the adoption trend, are excluded.
Enable Download
On
Table 4. 2000–2020 adoption trend.
Unit: Mha protected/yr
| 25th percentile | 1.3 |
| mean | 2.8 |
| median (50th percentile) | 2.0 |
| 75th percentile | 3.4 |
Unit: Mha protected/yr
| 25th percentile | 1.9 |
| mean | 2.8 |
| median (50th percentile) | 2.5 |
| 75th percentile | 3.1 |
Unit: Mha protected/yr
| 25th percentile | 0.5 |
| mean | 1.0 |
| median (50th percentile) | 0.7 |
| 75th percentile | 1.1 |
Unit: Mha protected/yr
| 25th percentile | 5.4 |
| mean | 12.5 |
| median (50th percentile) | 7.7 |
| 75th percentile | 17.8 |
Unit: Mha protected/yr
| 25th percentile | 9 |
| mean | 19 |
| median (50th percentile) | 13 |
| 75th percentile | 25 |
Left Text Column Width
Adoption Ceiling
We estimated an adoption ceiling of 3,370 Mha of forests globally (Table 5), defined as all existing forest areas, excluding peatlands and mangroves. Of the calculated adoption ceiling, 469 Mha of boreal forests, 282 Mha of temperate forests, 211 Mha of subtropical forests, and 734 Mha of tropical forests are currently unprotected. The high and low values represent estimates of currently forested areas from two different maps of forest cover that use different methodologies and definitions (ESA CCI, 2019; Hansen et al., 2013). While it is not socially, politically, or economically realistic that all existing forests could be protected, these values represent the technical upper limit to adoption of this solution. Additionally, some PAs allow for ongoing sustainable use of resources, enabling some demand for wood products to be met via sustainable use of trees in PAs.
left_text_column_width
Table 5. Adoption ceiling.
Unit: Mha protected
| low | 686 |
| mean | 936 |
| high | 1,186 |
Unit: Mha protected
| low | 385 |
| mean | 441 |
| high | 498 |
Unit: Mha protected
| low | 260 |
| mean | 323 |
| high | 385 |
Unit: Mha protected
| low | 1,557 |
| mean | 1,669 |
| high | 1,782 |
Unit: Mha protected
| low | 2,889 |
| mean | 3,370 |
| high | 3,851 |
Left Text Column Width
Achievable Adoption
We defined the lower end of the achievable range for forest protection as all high integrity forests in addition to forests in existing PAs and Indigenous peoples’ lands, totaling 2,297 Mha. We estimated that there are 624 Mha of unprotected high integrity forests, based on maps of forest integrity developed by Grantham et al. (2020). High integrity forests have experienced little disturbance from human pressures (i.e., logging, agriculture, and buildings), are located further away from areas of human disturbance, and are well-connected to other forests. High integrity forests are a top priority for protection as they have particularly high value with respect to biodiversity and ecosystem service provisioning. These forests are also not currently being used to meet human demand for land or forest-derived products, and thus their protection may be more feasible.
To estimate the upper end of the achievable range, we excluded the global areas of planted trees and tree crops from the adoption ceiling (Richter et al., 2024), comprising approximately 335 Mha globally (Table 6). Planted trees include tree stands established for crops such as oil palm, products such as timber and fiber production, and those established as windbreaks or for ecosystem services such as erosion control. These stands are often actively managed and are unlikely to be protected.
left_text_column_width
Table 6. Range of achievable adoption levels.
Unit: Mha protected
| Current Adoption | 467 |
| Achievable – Low | 847 |
| Achievable – High | 861 |
| Adoption ceiling | 936 |
Unit: Mha protected
| Current Adoption | 159 |
| Achievable – Low | 204 |
| Achievable – High | 378 |
| Adoption ceiling | 441 |
Unit: Mha protected
| Current Adoption | 112 |
| Achievable – Low | 126 |
| Achievable – High | 219 |
| Adoption ceiling | 323 |
Unit: Mha protected
| Current Adoption | 936 |
| Achievable – Low | 1,120 |
| Achievable – High | 1,577 |
| Adoption ceiling | 1,669 |
Unit: Mha protected
| Current Adoption | 1,673 |
| Achievable – Low | 2,297 |
| Achievable – High | 3,035 |
| Adoption ceiling | 3,370 |
Left Text Column Width
We estimated that forest protection currently avoids approximately 2.00 Gt CO₂‑eq/yr, with potential impacts of 2.49 Gt CO₂‑eq/yr at the low-achievable scenario, 3.62 Gt CO₂‑eq/yr at the high-achievable scenario, and 4.10 Gt CO₂‑eq/yr at the adoption ceiling (Table 7). Although not directly comparable due to the inclusion of different land covers, these values are aligned with Griscom et al. (2017) estimates that forest protection could avoid 3.6 Gt CO₂‑eq/yr and the IPCC estimate that protection of all ecosystems could avoid 6.2 Gt CO₂‑eq/yr (Nabuurs et al., 2022).
Note that the four adoption scenarios vary only with respect to the area under protection. Increases in either the rate of forest loss that would have occurred if the area had not been protected or in the effectiveness of PAs at avoiding forest loss would substantially increase the climate impacts of forest protection. For instance, a hypothetical 50% increase in the rate of forest loss outside of PAs would increase the carbon impacts of the current adoption, low achievable, high achievable, and adoption ceiling scenarios to 3.0, 3.7, 5.4, and 6.1 Gt CO₂‑eq/yr, respectively. Similarly, if legal forest protection reduced forest loss twice as much as it currently does, the climate impacts of the four scenarios would increase to 3.9, 4.8, 7.0, and 7.8 Gt CO₂‑eq/yr, respectively.
left_text_column_width
Table 7. Climate impact at different levels of adoption.
Unit: Gt CO₂‑eq/yr, 100-yr basis
| Boreal | 0.14 |
| Achievable – Low | 0.25 |
| Achievable – High | 0.26 |
| Adoption ceiling | 0.28 |
Unit: Gt CO₂‑eq/yr, 100-yr basis
| Current Adoption | 0.22 |
| Achievable – Low | 0.29 |
| Achievable – High | 0.53 |
| Adoption ceiling | 0.62 |
Unit: Gt CO₂‑eq/yr, 100-yr basis
| Current Adoption | 0.25 |
| Achievable – Low | 0.28 |
| Achievable – High | 0.48 |
| Adoption ceiling | 0.71 |
Unit: Gt CO₂‑eq/yr, 100-yr basis
| Current Adoption | 1.39 |
| Achievable – Low | 1.67 |
| Achievable – High | 2.35 |
| Adoption ceiling | 2.49 |
Unit: Gt CO₂‑eq/yr, 100-yr basis
| Current Adoption | 2.00 |
| Achievable – Low | 2.49 |
| Achievable – High | 3.62 |
| Adoption ceiling | 4.10 |
Left Text Column Width
Additional Benefits
Water Quality
Forests act as a natural water filter and can maintain and improve water quality (Melo et al., 2021). Forests can also retain nutrients from polluting the larger watershed (Sweeney et al., 2004). For example, forests can uptake excess nutrients like nitrogen, reducing their flow into surrounding water (Sarira et al., 2022). These excessive nutrients can cause eutrophication and algal blooms that negatively impact water quality and aquatic life.
Biodiversity
Forests are home to a wide range of species and habitats and are essential for safeguarding biodiversity. Forests have high above- and belowground carbon density, high tree species richness, and often provide habitat to threatened and endangered species (Buotte et al., 2020). PAs can aid in avoiding extinctions by protecting rare and threatened species (Dinerstein et al. 2024). In Southeast Asia, protecting 58% of threatened forests could safeguard about half of the key biodiversity areas in the region (Sarira et al., 2022).
Extreme Weather Events
Protected forests are more biodiverse and therefore more resilient and adaptable, providing higher-quality ecosystem services to surrounding communities (Gray et al., 2016). Protected forests can also buffer surrounding areas from the effects of extreme weather events. By increasing plant species richness, forest preservation can contribute to drought and fire tolerance (Buotte et al., 2020). Forests help regulate local climate by reducing temperature extremes (Lawrence et al., 2022). Studies have shown that the extent of forest coverage helps to alleviate vulnerability associated with heat effects (Walton et al., 2016). Tropical deforestation threatens human well-being by removing critical local cooling effects provided by tropical forests, exacerbating extreme heat conditions in already vulnerable regions (Seymour et al., 2022).
Food Security
Protecting forests in predominantly natural areas can improve food security by supporting crop pollination of nearby agriculture. Sarira et al. (2022) found that protecting 58% of threatened forests in Southeast Asia could support the dietary needs of about 305,000–342,000 people annually. Forests also provide a key source of income and livelihoods for subsistence households and individuals (de Souza et al., 2016; Herrera et al., 2017; Naidoo et al., 2019). By maintaining this source of income through forest protection, households can earn sufficient income to ensure food security.
Health
Protected forests can benefit the health and well-being of surrounding communities through impacts on the environment and local economies. Herrera et al. (2017) found that in rural areas of low- and middle-income countries, household members living downstream of higher tree cover had a lower probability of diarrheal disease. Proximity to PAs can benefit local tourism, which may provide more economic resources to surrounding households. Naidoo et al. (2019) found that households near PAs in low- and middle-income countries were more likely to have higher levels of wealth and were less likely to have children who were stunted. Reducing deforestation can improve health by lowering vector-borne diseases, mitigating extreme weather impacts, and improving air quality (Reddington et al., 2015).
Equality
Indigenous peoples have a long history of caring for and shaping landscapes that are rich with biodiversity (Fletcher et al., 2021). Indigenous communities provide vital ecological functions for preserving biodiversity, like seed dispersal and predation (Bliege Bird & Nimmo, 2018). Indigenous peoples also have spiritual and cultural ties to their lands (Garnett et al., 2018). Establishing protected areas must prioritize the return of landscapes to Indigenous peoples so traditional owners can feel the benefits of biodiversity. However, the burden of conservation should not be placed on Indigenous communities without legal recognition or support (Fa et al., 2020). In fact, land grabs and encroachments on Indigenous lands have led to greater deforestation pressure (Sze et al., 2022). Efforts to protect these lands must include legal recognition of Indigenous ownership to support a just and sustainable conservation process (Fletcher et al., 2021).
left_text_column_width
Risks
Ecosystem protection initiatives that are not led by or undertaken in close collaboration with local communities can compromise community sovereignty and create injustice and inequity (Baragwanath et al., 2020; Blackman & Viet 2018; Dawson et al., 2024; Fa et al., 2020; FAO, 2024; Garnett et al. 2018; Sze et al. 2022; Tauli-Corpuz et al., 2020). Forest protection has the potential to be a win-win for climate and communities, but only if PAs are established with respect to livelihoods and other socio-ecological impacts, ensuring equity in procedures, recognition, and the distribution of benefits (Zafra-Calvo et al., 2017).
Leakage is a key risk of relying on forest protection as a climate solution. Leakage occurs when deforestation-related activities move outside of PA boundaries, resulting in the relocation of, rather than a reduction in, emissions from forest loss. If forest protection efforts are not coupled with policies to reduce incentives for forest clearing, leakage will likely offset some of the emissions avoided through forest protection. Additional research is needed to comprehensively quantify the magnitude of leakage effects, though two regional-scale studies found only small negative effects (Fuller et al., 2020; Herrera et al., 2019).
left_text_column_width
Interactions with Other Solutions
Reinforcing
Other intact and degraded ecosystems often occur within areas of forest protection. Therefore, forest protection can facilitate natural restoration of these other degraded ecosystems, and increase the health of adjacent ecosystems.
left_text_column_width
Reducing the demand for agricultural land will reduce barriers to forest protection.
left_text_column_width
Competing
Forest protection will decrease the availability and increase the prices of wood feedstocks for other applications.
left_text_column_width
Dashboard
Solution Basics
1 hectare of forest protected
t CO₂-eq/unit/yr
0.3
units
Current
4.67×10⁸8.47×10⁸8.61×10⁸
Achievable (Low to High)
Climate Impact
Gt CO₂-eq/yr
Current 0.14
0.250.26
US$ per t CO₂-eq
2
Emergency Brake
CO₂
Solution Basics
1 hectare of forest protected
t CO₂-eq/unit/yr
1.4
units
Current
1.59×10⁸2.04×10⁸3.77×10⁸
Achievable (Low to High)
Climate Impact
Gt CO₂-eq/yr
Current 0.22
0.290.53
US$ per t CO₂-eq
2
Emergency Brake
CO₂
Solution Basics
1 hectare of forest protected
t CO₂-eq/unit/yr
2.2
units
Current
1.12×10⁸1.26×10⁸2.19×10⁸
Achievable (Low to High)
Climate Impact
Gt CO₂-eq/yr
Current 0.25
0.280.48
US$ per t CO₂-eq
2
Emergency Brake
CO₂
Solution Basics
1 hectare of forest protected
t CO₂-eq/unit/yr
1.49
units
Current
9.36×10⁸1.12×10⁹1.58×10⁹
Achievable (Low to High)
Climate Impact
Gt CO₂-eq/yr
Current 1.39
1.672.35
US$ per t CO₂-eq
2
Emergency Brake
CO₂
% tree cover
Tree cover, 2000 (excluding mangroves and peatlands)
We exclude mangroves and peatlands because they are addressed in other solutions.
Global Forest Watch (2023). Global peatlands [Data set]. Retrieved December 6, 2024 from https://data.globalforestwatch.org/datasets/gfw::global-peatlands/about
Hansen, M.C., Potapov, P.V., Moore, R., Hancher, M., Turubanova, S.A., Tyukavina, A., Thau, D., Stehman, S.V., Goetz, S.J., Loveland, T.R., Kommareddy, A., Egorov, A., Chini, L., Justice, C.O., and Townshend, J.R.G. (2013). High-resolution global maps of 21st-century forest cover change [Data set]. Science 342 (15 November): 850-53. https://glad.earthengine.app/view/global-forest-change
UNEP-WCMC (2025). Ocean+ habitats (version 1.3) [Data set]. Retrieved November 2024 from habitats.oceanplus.org
Geographic Guidance Introduction
The adoption, potential adoption, and effectiveness of forest protection are highly geographically variable. While forest protection can help avoid emissions anywhere that forests occur, areas with high rates of forest loss from human drivers and particularly carbon-rich forests have the greatest potential for avoiding emissions via forest protection. The tropics and subtropics are high-priority areas for forest protection as they contain 55% of currently unprotected forest area, forest loss due to agricultural expansion is particularly concentrated in these regions (Curtis et al., 2018; West et al., 2014; Gibbs et al., 2010), and tend to have larger biomass carbon stocks than boreal forests (Harris et al., 2021).
Developed countries also have significant potential to protect remaining old and long unlogged forests and foster recovery in secondary natural forests. The top 10 forested countries include Canada, the USA, Russia and even Australia, with the latter moving towards ending commodity production in its natural forests and increasing formal protection. Restoration of degraded forests is addressed in the “Forest Restoration” solution, but including regenerating forests in well designed protected areas is well within the capacity of every developed country.
Buffering and reconnecting existing high integrity forests is a low risk climate solution that increases current and future forest ecosystem resilience and adaptive capacity (Brennan et al., 2022; Brink et al., 2017; Grantham et al., 2020; Rogers et al., 2022). Forests with high ecological integrity provide outsized benefits for carbon storage and biodiversity and have greater resilience, making them top priorities for protection (Grantham et al., 2020; Rogers et al., 2022). Within a given forest, large-diameter trees similarly provide outsized carbon storage and biodiversity benefits, comprising only 1% of trees globally but storing 50% of the above ground forest carbon (Lutz et al., 2018). Additionally, forests that improve protected area connectivity (Brennan et al., 2022; Brink et al., 2017), areas at high risk of loss (particularly to expansion of commodity agriculture; Curtis et al., 2018; Hansen et al., 2013), and areas with particularly large or specialized benefits for biodiversity, ecosystem services, and human well-being (Dinerstein et al., 2024; Sarira et al., 2022; Soto-Navarro et al., 2020) may be key targets for forest protection.
Action Word
Protect
Solution Title
Forests
Classification
Highly Recommended
Lawmakers and Policymakers
- Set achievable targets and pledges for PA designation and set clear effectiveness goals for PAs, emphasizing the effectiveness of current PAs before seeking to expand designations.
- Use a variety of indicators to measure effectiveness, such as estimated avoided deforestation.
- Ensure public procurement utilizes deforestation-free products and supply chains.
- Grant Indigenous communities full property rights and autonomy and support them in monitoring, managing, and enforcing PAs.
- Ensure PAs don’t displace, violate rights, or reduce access to vital resources for local and Indigenous communities.
- Invest in PA infrastructure, monitoring, management, and enforcement mechanisms.
- Utilize real-time monitoring and satellite data such as the “Real-Time System for Detection of Deforestation” (DETER).
- Join, support, or create certification schemes like the Forest Stewardship Council for sustainable logging practices.
- Conduct proactive land-use planning to avoid roads and other development projects that may interfere with PAs or incentivize deforestation.
- Create processes for legal grievances, dispute resolution, and restitution.
- Remove harmful agricultural and logging subsidies.
- Prioritize reducing food loss and waste.
- Create education programs that educate the public on PA regulations, the benefits of the regulations, and how to use forest resources sustainably.
Further information:
- Forests, people, climate.
- Protected planet: The world database on protected areas and world database on other effective area-based conservation measures. UNEP-WCMC & IUCN
- Agriculture, forestry and other land uses (AFOLU). IPCC
- Government relations and public policy job function action guide. Project Drawdown
- Legal job function action guide. Project Drawdown
Practitioners
- Set achievable targets and pledges for PA designation and set clear effectiveness goals for PAs, emphasizing the effectiveness of current PAs before seeking to expand designations
- Use a variety of indicators to measure effectiveness, such as estimated avoided deforestation.
- Ensure PAs don’t displace, violate rights, or reduce access to vital resources for local and Indigenous communities.
- Utilize real-time monitoring and satellite data such as the “Real-Time System for Detection of Deforestation” (DETER).
- Create sustainable use regulations for PA areas that provide resources to the local community.
- Conduct proactive land-use planning to avoid infrastructure or development projects that may interfere with PAs or incentivize deforestation.
- Grant Indigenous communities full property rights and autonomy and support them in monitoring, managing, and enforcing PAs.
- Join, support, or create certification schemes like the Forest Stewardship Council for sustainable logging practices.
- Create processes for legal grievances, dispute resolution, and restitution.
- Create education programs that educate the public on PA regulations, the benefits of the regulations, and how to use forest resources sustainably.
Business Leaders
- Create deforestation-free supply chains, utilizing data, information, and the latest technology to inform product sourcing.
- Integrate deforestation-free business and investment policies and practices in Net-Zero strategies.
- Only purchase carbon credits from high-integrity, verifiable carbon markets and do not use them as replacements for reducing emissions.
- Help shift the public narrative around carbon markets as integrity increases to boost education, dialogue, and awareness.
- Develop financial instruments to invest in PA jurisdictions, focusing on supporting Indigenous communities.
- Join or create public-private partnerships, alliances, or coalitions of stakeholders and rightsholders to support PAs and advance deforestation-free markets.
- Join, support, or create certification schemes like the Forest Stewardship Council for sustainable logging practices.
- Conduct proactive land-use planning to avoid infrastructure or development projects that may interfere with PAs or incentivize deforestation.
- Amplify the voices of local communities and civil society to promote robust media coverage.
- Invest in and support Indigenous and local communities' capacity for public relations and communications.
- Support education programs that educate the public on PA regulations, the benefits of the regulations, and how to use forest resources sustainably.
- Leverage political influence to advocate for stronger PA policies at national and international levels, especially policies that reduce deforestation pressure.
Further information:
- Forests, people, climate.
- Protected planet: The world database on protected areas and world database on other effective area-based conservation measures. UNEP-WCMC & IUCN
- Agriculture, forestry and other land uses (AFOLU). IPCC
- Climate solutions at work. Project Drawdown
- Drawdown-aligned business framework. Project Drawdown
Nonprofit Leaders
- Ensure operations utilize deforestation-free products and supply chains.
- Advocate for PAs and for public investments and evaluation indicators to strengthen the effectiveness of PAs.
- Assist in managing and monitoring PAs, utilizing real-time monitoring and satellite data such as the “Real-Time System for Detection of Deforestation” (DETER).
- Provide financial support for PAs management, monitoring, and enforcement.
- Assist in conducting proactive land-use planning to avoid infrastructure or development projects that may interfere with PAs or incentivize deforestation.
- Advocate for creating legal grievance processes, dispute resolution mechanisms, and restitution procedures for violations or disagreements over PAs.
- Support high-integrity carbon markets, institutions, rules, and norms to cultivate the demand for high-quality carbon credits.
- Help shift the public narrative around carbon markets as integrity increases to boost education, dialogue, and awareness.
- Support PAs, businesses, and investors by sharing data, information, and investment frameworks that successfully avoid deforestation.
- Help shift public narratives to mobilize public action and build political will for PAs by creating educational campaigns and strengthening networks of stakeholders and rightsholders.
- Join, support, or create certification schemes like the Forest Stewardship Council for sustainable logging practices.
- Amplify the voices of local communities and civil society to promote robust media coverage.
- Invest in and support Indigenous and local communities' capacity for legal protection and public relations.
- Advocate for non-timber forest products to support local and Indigenous communities.
- Advocate to remove harmful agricultural subsidies and prioritize reducing food loss and waste.
Investors
- Create deforestation-free investment portfolios, utilizing data, information, and the latest technology to inform investments.
- Invest in PA infrastructure, monitoring, management, and enforcement mechanisms.
- Invest in green bonds or high-integrity carbon credits for forest conservation efforts.
- Develop financial instruments to invest in PA jurisdictions, focusing on supporting Indigenous communities.
- Support PAs, other investors, and NGOs by sharing data, information, and investment frameworks that successfully avoid investments that drive deforestation.
- Join, support, or create science-based certification schemes like the Forest Stewardship Council for sustainable logging practices.
- Help shift public narratives to mobilize public action and build political will for PAs by creating educational campaigns and strengthening networks of stakeholders and rightsholders.
- Require portfolio companies to eliminate deforestation from their supply chains and ask that they demonstrate strong PA practices.
- Consider opportunities to invest in forest monitoring technologies or bioeconomy products derived from standing forests (e.g., nuts, berries, or other derivatives)
Philanthropists and International Aid Agencies
- Ensure operations utilize deforestation-free products and supply chains.
- Provide financial support for PAs management, monitoring, and enforcement.
- Assist in monitoring PAs, utilizing real-time monitoring and satellite data such as the “Real-Time System for Detection of Deforestation” (DETER).
- Assist in conducting proactive land-use planning to avoid infrastructure or development projects that may interfere with PAs or incentivize deforestation.
- Support and finance high-integrity carbon markets, institutions, rules, and norms to cultivate the demand for high-quality carbon credits.
- Help shift the public narrative around carbon markets as integrity increases to boost education, dialogue, and awareness.
- Support PAs, businesses, and investors by sharing data, information, and investment frameworks that successfully avoid deforestation.
- Help shift public narratives to mobilize public action and build political will for PAs by creating educational campaigns and strengthening networks of stakeholders and rightsholders.
- Amplify the voices of local communities and civil society to promote robust media coverage.
- Invest in and support Indigenous and local communities' capacity for public relations and communications.
- Financially support Indigenous land tenure.
- Join, support, or create certification schemes like the Forest Stewardship Council for sustainable logging practices.
- Advocate for PAs and for public investments and evaluation indicators to strengthen the effectiveness of PAs.
- Advocate for legal grievances, dispute resolution, and restitution processes.
Thought Leaders
- Advocate for PAs and for public investments and evaluation indicators to strengthen the effectiveness of PAs.
- Assist in monitoring PAs, utilizing real-time monitoring and satellite data such as the “Real-Time System for Detection of Deforestation” (DETER).
- Assist in conducting proactive land-use planning to avoid infrastructure or development projects that may interfere with PAs or incentivize deforestation.
- Advocate for legal grievances, dispute resolution, and restitution processes.
- Support high-integrity carbon markets, institutions, rules, and norms to cultivate the demand for high-quality carbon credits.
- Help shift the public narrative around carbon markets as integrity increases to boost education, dialogue, and awareness.
- Support PAs, businesses, and investors by sharing data, information, and investment frameworks that successfully avoid deforestation.
- Help shift public narratives to mobilize public action and build political will for PAs by creating educational campaigns and strengthening networks of stakeholders and rightsholders.
- Amplify the voices of local communities and civil society to promote robust media coverage.
- Support Indigenous and local communities' capacity for public relations and communications.
Technologists and Researchers
- Improving PA monitoring methods and data collection, utilizing satellite imagery and GIS tools.
- Develop land-use planning tools that help avoid infrastructure or development projects that may interfere with PAs or incentivize deforestation.
- Create tools for local communities to monitor PAs, such as mobile apps, e-learning platforms, and mapping tools.
- Conduct evaluations of the species richness of potential PAs and recommend areas of high biodiversity to be designated as PAs.
- Develop verifiable carbon credits using technology such as blockchain to improve the integrity of carbon markets.
- Develop supply chain tracking software for investors and businesses seeking to create deforestation-free portfolios and products.
Communities, Households, and Individuals
- Ensure purchases and investments utilize deforestation-free products and supply chains.
- Advocate for PAs and for public investments and evaluation indicators to strengthen the effectiveness of PAs.
- Assist in monitoring PAs, utilizing real-time monitoring and satellite data such as the “Real-Time System for Detection of Deforestation” (DETER).
- Assist in conducting proactive land-use planning to avoid infrastructure or development projects that may interfere with PAs or incentivize deforestation.
- Advocate for legal grievances, dispute resolution, and restitution processes.
- Support Indigenous and local communities' capacity for public relations and communications.
- Assist with evaluations of the species richness of potential PAs and advocate for PAs in areas of high biodiversity that are threatened.
- Help shift public narratives to mobilize public action and build political will for PAs by creating educational campaigns and strengthening networks of stakeholders and rightsholders.
- Undertake forest protection and expansion initiatives locally by working to preserve existing forests and restore degraded forest areas.
- Engage in citizen science initiatives by partnering with researchers or conservation groups to monitor PAs and document threats.
Sources
- Forests, people, climate.
- Protected planet: The world database on protected areas and world database on other effective area-based conservation measures. UNEP-WCMC & IUCN
- Making protected areas effective for biodiversity, climate and food, Arneth et al.
- Collective property rights reduce deforestation in the Brazilian Amazon, Baragwanath et al.
- Prevent perverse outcomes from global protected area policy, Barnes et al.
- Is it just conservation? A typology of Indigenous peoples’ and local communities’ roles in conserving biodiversity, Dawson et al.
- Agriculture, forestry and other land uses (AFOLU). IPCC
- Protected-area planning in the Brazilian Amazon should prioritize additionality and permanence, not leakage mitigation, Fuller et al.
- Mixed effectiveness of global protected areas in resisting habitat loss, Li et al.
- Key steps toward expanding protected areas to conserve global biodiversity, Lindenmayer
- Cornered by PAs: Adopting rights-based approaches to enable cost-effective conservation and climate action, Tauli-Corpuz, V.
Evidence Base
There is high scientific consensus that forest protection is a key strategy for reducing forest loss and addressing climate change. Rates of forest loss are lower inside of PAs and Indigenous peoples’ lands than outside of them. Globally, Wolf et al. (2021) found that rates of forest loss inside PAs are 40.5% lower on average than in unprotected areas, and Li et al. (2024) estimated that overall forest loss is 14% lower in PAs relative to unprotected areas. Regional studies find similar average effects of PAs on deforestation rates. For instance, McNichol et al. (2023) reported 39% lower deforestation rates in African woodlands in PAs relative to unprotected areas, and Graham et al. (2021) reported 69% lower deforestation rates in PAs relative to unprotected areas in Southeast Asia. In the tropics, Sze et al. (2022) found that rates of forest loss were similar between Indigenous lands and PAs, with forest loss rates reduced 17–29% relative to unprotected areas. Baragwanath & Bayi (2020) reported a 75% decline in deforestation in the Brazilian Amazon when Indigenous peoples are granted full property rights.
Reductions in forest loss lead to proportionate reductions in CO₂ emissions. The Intergovernmental Panel on Climate Change (IPCC) estimated that ecosystem protection, including forests, peatlands, grasslands, and coastal wetlands, has a technical mitigation potential of 6.2 Gt CO₂‑eq/yr, 4.0 Gt of which are available at a carbon price less than US$100 tCO₂‑eq/yr (Nabuurs et al., 2022). Similarly, Griscom et al. (2017) found that avoiding human-caused forest loss is among the most effective natural climate solutions, with a potential impact of 3.6 Gt CO₂‑eq/yr (including forests on peatlands), nearly 2 Gt CO₂‑eq/yr of which is achievable at a cost below US$10/t CO₂‑eq/yr.
The results presented in this document were produced through analysis of 12 global datasets. We recognize that geographic biases can influence the development of global datasets and hope this work inspires research and data sharing on this topic in underrepresented regions.
left_text_column_width
Appendix
In this analysis, we integrated global land cover data, maps of forest loss rates, shapefiles of PAs and Indigenous people’s lands, country-scale data on reductions in forest loss inside of PAs, and biome-scale data on forest carbon stocks and sequestration rates to calculate currently protected forest area, total global forest area, and avoided emissions from forest protection. Forested peatlands and mangroves are excluded from this analysis and addressed in the Protect Peatlands and Protect Coastal Wetlands solutions, respectively.
Land cover data
We used two land cover data products to estimate forest extent inside and outside of PAs and Indigenous people’s lands, including: 1) the Global Forest Watch (GFW) tree cover dataset (Hansen et al., 2013), resampled to 30 second resolution, and 2) the 2022 European Space Agency Climate Change Initiative (ESA CCI) land cover dataset at native resolution (300 m). For the ESA CCI dataset, all non-flooded tree cover classes (50, 60, 70, 80, 90) and the “mosaic tree and shrub (>50%)/herbaceous cover (<50%)” class (100) and associated subclasses were included as forests. Both products are associated with uncertainty, which we did not address directly in our calculations. We include estimates from both products in order to provide readers with a sense of the variability in values that can stem from different land cover classification methods, which are discussed in more detail below.
These two datasets have methodological differences that result in substantially different classifications of forest extent, including their thresholds for defining forests, their underlying satellite data, and the algorithms used to classify forests based on the satellite information. For example, the ESA CCI product classifies 300-meter pixels with >15% tree cover as forests (based on our included classes), attempts to differentiate tree crops, relies on a 2003–2012 baseline land cover map coupled with a change-detection algorithm, and primarily uses imagery from MERIS, PROBA-V, and Sentinel missions (ESA CCI 2019). In contrast, the Global Forest Watch product generally requires >30% tree cover at 30-meter resolution, does not exclude tree crops, relies on a regression tree model for development of a baseline tree cover map circa 2010, and primarily uses Landsat ETM+ satellite imagery (Hansen et al., 2013). We recommend that interested readers refer to the respective user guides for each data product for a comprehensive discussion of the complex methods used for their development.
We used the Forest Landscape Integrity Index map developed by Grantham et al. (2020), which classifies forests with integrity indices ≥9.6 as high integrity. These forests are characterized by minimal human disturbance and high connectivity. Mangroves and peatlands were excluded from this analysis. We used a map of mangroves from Giri et al. (2011) and a map of peatlands compiled by Global Forest Watch to define mangrove and peatland extent (accessed at https://data.globalforestwatch.org/datasets/gfw::global-peatlands/about). The peatlands map is a composite of maps from five publications: Crezee et al. (2022), Gumbricht et al. (2017), Hastie et al. (2022), Miettinen et al. (2016), and Xu et al. (2018). For each compiled dataset, the data were resampled to 30-second resolution by calculating the area of each grid cell occupied by mangroves or peatlands. For each grid cell containing forests, the “eligible” forest area was calculated by subtracting the mangrove and peatland area from the total forest area for each forest cover dataset (GFW, ESA CCI, and high-integrity forests).
Protected forest areas
We identified protected forest areas using the World Database on Protected Areas (WDPA, 2024), which contains boundaries for each PA and additional information, including their establishment year and IUCN management category (Ia to VI, not applicable, not reported, and not assigned). For each PA polygon, we extracted the forest area from the GFW, ESA CCI, and high-integrity dataset (after removing the peatland and mangrove areas).
Each protected area was classified into a climate zone based on the midpoint between its minimum and maximum latitude. Zones included tropical (23.4°N–23.4°S), subtropical (23.4°–35° latitude), temperate (35°–50° latitude), and boreal (>50° latitude) in order to retain some spatial variability in emissions factors. We aggregated protected forest cover areas (from each of the two forest cover datasets and the high-integrity forest data) by IUCN class and climate zone. To evaluate trends in adoption over time, we also aggregated protected areas by establishment year. We used the same method to calculate the forest area that could be protected, extracting the total area of each land cover type by climate zone (inside and outside of existing PAs).
We used maps from Garnett et al. (2018) to identify Indigenous people’s lands that were not inside established PAs. We calculated the total forest area within Indigenous people’s lands (excluding PAs, mangroves, and peatlands) using the same three forest area data sources.
Forest loss and emissions factors
Forest loss rates were calculated for unprotected areas using the GFW forest loss dataset for 2001–2022, resampled to 1 km resolution. Forest losses were reclassified according to their dominant drivers based on the maps originally developed by Curtis et al. (2018), with updates accessible through GFW. Dominant drivers of forest loss include commodity agriculture, shifting agriculture, urbanization, forestry, and wildfire. We classified all drivers except wildfire as human-caused forest loss for this analysis. We calculated the area of forest loss attributable to each driver within each climate zone, which represented the “baseline” rate of forest loss outside of PAs.
To calculate the difference in forest loss rates attributable to protection, we used country-level data from Wolf et al. (2021) on the ratio of forest loss in unprotected areas versus PAs, controlling for a suite of socio-environmental characteristics. We classified countries into climate zones based on their median latitude and averaged the ratios within climate zones. We defined the avoided forest loss attributable to protection as the product of the baseline forest loss rate and the ratio of forest loss outside versus inside of PAs.
We calculated the carbon benefits of avoided forest loss by multiplying avoided forest loss by average forest carbon stocks and sequestration rates. Harris et al. (2021) reported carbon stocks and sequestration rates by climate zone (boreal, temperate, subtropical, and tropical), and forest type. Carbon stocks and sequestration rates for primary and old secondary (>20 years old) forests were averaged for this analysis. We calculated carbon sequestration over a 20-yr period to provide values commensurate with the one-time loss of biomass carbon stocks.
left_text_column_width
Updated Date
Manage Oil & Gas Methane
Sector
Other Energy
Mode
Cut Emissions
Cluster
Cut Fugitive Emissions
Image
Image
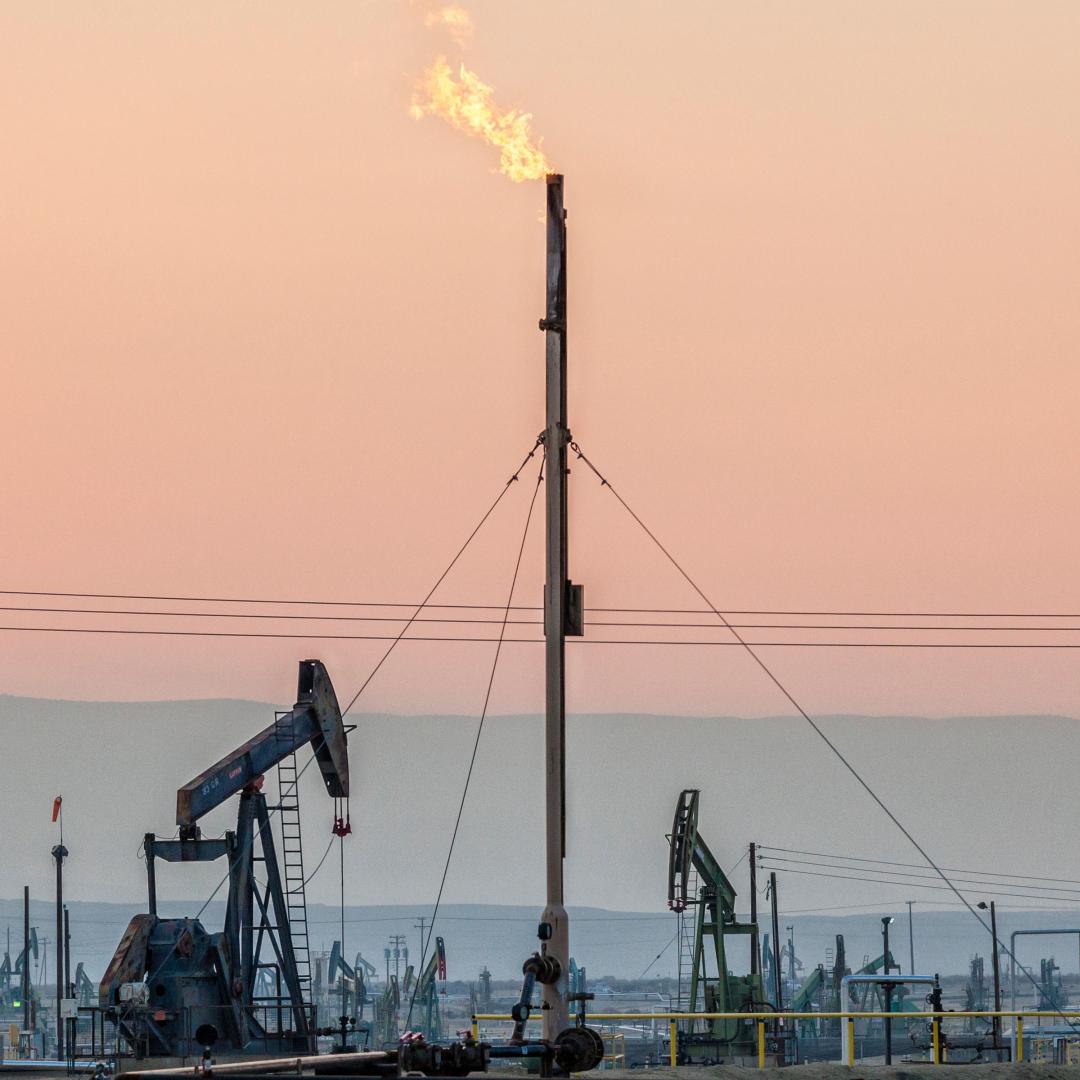
Coming Soon
Off
Summary
Oil and gas methane management is the process of reducing methane emissions from oil and gas (O&G) supply chains. These supply chains release methane when pipes and other system parts leak or methane is intentionally vented for operation and safety reasons. We define the Manage Oil & Gas Methane solution as adopting approaches to reduce methane emissions, including fixing leaks in components, upgrading control equipment, changing procedures, and destroying methane by burning methane as a fuel or in flares.
Overview
Methane can be unintentionally released due to imperfections and faults along the supply chain or intentionally released as part of operations and maintenance. Atmospheric methane has a GWP of 81 over a 20-yr time basis and a GWP of 28 over a 100-yr time basis (IPCC, 2023). This means methane is 81 times more effective at trapping heat than CO₂. Because methane is a short-lived climate pollutant that has a much stronger warming effect than CO₂ over a given time period, abating methane will have a relatively large near-term impact on slowing global climate change (IEA, 2023b).
The first step to reduce methane releases from O&G production is to identify where releases occur along the supply chain. Many occur during O&G extraction as methane is either intentionally vented or unintentionally emitted. The International Energy Agency (IEA, 2024) estimated more than 60% of global energy-related methane emissions originated from the O&G sector in 2023, with the remaining emissions mostly coming from coal use and some bioenergy (Figure 1). The United Nations Environment Programme (UNEP) has formed a transparency and accountability initiative whose members are responsible for 42% of global O&G production. It reported that activities involved in exploration and processing of O&G accounted for 83% of total reported O&G emissions from 2020 to 2023, with production processes being responsible for 90% of those emissions (UNEP 2024). Alvarez et al. (2018) found that in the United States, more than 58% of O&G methane emissions came from production and about 20% came from extraction in 2015.
Figure 1. Methane emissions (kt) from energy sources (IEA, 2025).
Source: International Energy Agency. (2025). Methane tracker: Data tools. https://www.iea.org/data-and-statistics/data-tools/methane-tracker
O&G producers can reduce their methane emissions by preventing its release or by converting it to CO₂ through combustion. Strategies for reducing O&G methane emissions can be put into two broad categories (Climate & Clean Air Coalition [CCAC], 2021):
Device conversion, replacement, and installation is the practice of fixing leaks in pipes, valves, compressors, pumps, and other equipment. This can include converting natural gas–powered devices to electric, driving compressors/pneumatics with air instead of natural gas, or replacing emitting components with non-emitting ones (Pembina Institute, 2024).
Changes to operations and maintenance practices seek to reduce the intentional venting of methane. They include eliminating the need for blow-down (releasing gases during the maintenance or operation of pipe infrastructure), reducing venting, and capturing methane before it is released into the atmosphere, then using it as fuel for product refining or burning it to convert it into CO₂.
Leak detection and repair (LDAR) is the practice of regularly monitoring for methane leaks and modifying or replacing leaking equipment.
References
Alvarez, R., Zavala-Araiza, D., Lyon, D. R., Allen, D. T., Barkley, Z. B., Brandt, A. R., Davis, K. J., Herndon, S. C., Jacob, D. J., Karion, A., Kort, E. A., Lamb, B. K., Lauvaux, T., Maasakkers, J. D., Marchese, A. J., Omara, M., Pacala, S. W., Peischl, J., Robinson, A. L., Shepson, P. B., Sweeney, C., Townsend-Small, A., Wofsy, S. C., & Hamburg, S. P. (2018). Assessment of methane emissions from the U.S. oil and gas supply chain. Science, 361(6398), 186-188. https://doi.org/10.1126/science.aar7204
Anejionu, O. C., Whyatt, J. D., Blackburn, G. A., & Price, C. S. (2015). Contributions of gas flaring to a global air pollution hotspot: spatial and temporal variations, impacts and alleviation. Atmospheric Environment, 118, 184-193. https://doi.org/10.1016/j.atmosenv.2015.08.006
Beck, C., Rashidbeigi, S., Roelofsen, O., & Speelman, E. (2020). The future is now: how oil and gas companies can decarbonize. McKinsey & Company. https://www.mckinsey.com/industries/oil-and-gas/our-insights/the-future-is-now-how-oil-and-gas-companies-can-decarbonize
Carbon Limits. (2014). Quantifying cost-effectiveness of systematic leak detection and repair program using infrared cameras. https://www.catf.us/resource/quantifying-cost-effectiveness-ldar/
Clean Air Task Force. (2022). Fossil fumes (2022 update): A public health analysis of toxic air pollution from the oil and gas industry. https://www.catf.us/resource/fossil-fumes-public-health-analysis/
Climate & Clean Air Coalition. (2021). Global methane assessment: Summary for decision makers. https://www.ccacoalition.org/resources/global-methane-assessment-summary-decision-makers
Climate & Clean Air Coalition. (n.d.). Methane. Retrieved July 19, 2024. https://www.ccacoalition.org/short-lived-climate-pollutants/methane#:~:text=While%20methane%20does%20not%20cause,rise%20in%20tropospheric%20ozone%20levels.
Climateworks Foundation. (2024). Reducing methane emissions on a global scale. https://climateworks.org/blog/reducing-methane-emissions-on-a-global-scale/
Conrad, B. M., Tyner, D. R., Li, H. Z., Xie, D. & Johnson, M. R. (2023). A measurement-based upstream oil and gas methane inventory for Alberta, Canada reveals higher emissions and different sources than official estimates. Earth & Environment. https://doi.org/10.1038/s43247-023-01081-0
DeFabrizio, S., Glazener, W., Hart, C., Henderson, K., Kar, J., Katz, J., Pratt, M. P., Rogers, M., Ulanov, A., & Tryggestad, C. (2021). Curbing methane emissions: How five industries can counter a major climate threat. McKinsey Sustainability. https://www.mckinsey.com/~/media/mckinsey/business%20functions/sustainability/our%20insights/curbing%20methane%20emissions%20how%20five%20industries%20can%20counter%20a%20major%20climate%20threat/curbing-methane-emissions-how-five-industries-can-counter-a-major-climate-threat-v4.pdf
Dunsky. (2023, July 21). Canada’s methane abatement opportunity. https://dunsky.com/project/methane-abatement-opportunities-in-the-oil-gas-extraction-sector/
Fawole, O. G., Cai, X. M., & MacKenzie, A. R. (2016). Gas flaring and resultant air pollution: A review focusing on black carbon. Environmental pollution, 216, 182-197. https://doi.org/10.1016/j.envpol.2016.05.075
Fiore, A. M., Jacob, D. J., & Field, B. D. (2002). Linking ozone pollution and climate change: The case for controlling methane. Geophysical Research Letters, 29(19), 182-197. https://doi.org/10.1029/2002GL015601
Giwa, S. O., Nwaokocha, C. N., Kuye, S. I., & Adama, K. O. (2019). Gas flaring attendant impacts of criteria and particulate pollutants: A case of Niger Delta region of Nigeria. Journal of King Saud University-Engineering Sciences, 31(3), 209-217. https://doi.org/10.1016/j.jksues.2017.04.003
Global Energy Monitor (2024). Global Methane Emitters Tracker [Data set, September 2024 release]. Retrieved April 18, 2025 from https://globalenergymonitor.org/projects/global-methane-emitters-tracker/
Global Methane Initiative (2019). GMI methane data EPA [Data set]. https://www.globalmethane.org/methane-emissions-data.aspx
Global Methane Initiative (2024). 2023 Accomplishments in methane mitigation, recovery, and use through U.S.-supported international efforts. https://www.epa.gov/gmi/us-government-global-methane-initiative-accomplishments
Global Methane Pledge. (n.d.). Global methane pledge. Retrieved August 16, 2024 from https://www.globalmethanepledge.org/
Guarin, J. R., Jägermeyr, J., Ainsworth, E. A., Oliveira, F. A., Asseng, S., Boote, K., ... & Sharps, K. (2024). Modeling the effects of tropospheric ozone on the growth and yield of global staple crops with DSSAT v4. 8.0. Geoscientific Model Development, 17(7), 2547-2567. https://doi.org/10.5194/gmd-17-2547-2024
Hong, C., Mueller, N. D., Burney, J. A., Zhang, Y., AghaKouchak, A., Moore, F. C., Qin, Y., Tong, D., & Davis, S. J. (2020). Impacts of ozone and climate change on yields of perennial crops in California. Nature Food, 1(3), 166-172. https://doi.org/10.1038/s43016-020-0043-8
ICF International. (2016). Economic analysis of methane emission reduction potential from natural gas systems. https://onefuture.us/wp-content/uploads/2018/05/ONE-Future-MAC-Final-6-1.pdf
Intergovernmental Panel on Climate Change (IPCC). (2023). In: Climate change 2023: Synthesis report. Contribution of working groups I, II and III to the sixth assessment report of the intergovernmental panel on climate change [core writing team, H. Lee and J. Romero (eds.)]. IPCC, Geneva, Switzerland, pp. 1-34, doi: 10.59327/IPCC/AR6-9789291691647.001 https://www.ipcc.ch/report/ar6/syr/
International Energy Agency. (2021). Global methane tracker 2021: Methane abatement and regulation. https://www.iea.org/reports/methane-tracker-2021/methane-abatement-and-regulation
International Energy Agency. (2023a). Financing reductions in oil and gas methane emissions. https://www.iea.org/reports/financing-reductions-in-oil-and-gas-methane-emissions
International Energy Agency. (2023b). Net zero roadmap: A global pathway to keep the 1.5℃ goal in reach - 2023 update. https://www.iea.org/reports/net-zero-roadmap-a-global-pathway-to-keep-the-15-0c-goal-in-reach
International Energy Agency. (2023c). The imperative of cutting methane from fossil fuels. https://www.iea.org/reports/the-imperative-of-cutting-methane-from-fossil-fuels
International Energy Agency. (2023d). World energy outlook 2023. https://www.iea.org/reports/world-energy-outlook-2023
International Energy Agency. (2025). Methane tracker: Data tools. https://www.iea.org/data-and-statistics/data-tools/methane-tracker
Ismail, O. S., & Umukoro, G. E. (2012). Global impact of gas flaring. Energy and Power Engineering, 4(4), 290-302. http://dx.doi.org/10.4236/epe.2012.44039
Johnson, M. R., & Coderre, A. R. (2012). Opportunities for CO₂ equivalent emissions reductions via flare and vent mitigation: A case study for Alberta, Canada. International Journal of Greenhouse Gas Control, 8, 121-131. https://doi.org/10.1016/j.ijggc.2012.02.004
Laan, T., Do, N., Haig, S., Urazova, I., Posada, E., & Wang, H. (2024). Public financial support for renewable power generation and integration in the G20 countries. International Institute for Sustainable Development. https://www.iisd.org/system/files/2024-09/renewable-energy-support-g20.pdf
Malley, C. S., Borgford-Parnell, N. Haeussling, S., Howard, L. C., Lefèvre E. N., & Kuylenstierna J. C. I. (2023). A roadmap to achieve the global methane pledge. Environmental Research: Climate, 2(1). https://doi.org/10.1088/2752-5295/acb4b4
Mar, K. A., Unger, C., Walderdorff, L., & Butler, T. (2022). Beyond CO₂ equivalence: The impacts of methane on climate, ecosystems, and health. Environmental Science & Policy, 134, 127-136. https://doi.org/10.1016/j.envsci.2022.03.027
Marks, L. (2022). The abatement cost of methane emissions from natural gas production. Journal of the Association of Environmental and Resource Economists, 9(2). https://doi.org/10.1086/716700
Methane Guiding Principles Partnership. (n.d.). Reducing methane emissions on a global scale. Retrieved August 16, 2024 from https://methaneguidingprinciples.org/
MethaneSAT. (2024). Solving a crucial climate challenge. Retrieved September 2, 2024 https://www.methanesat.org/satellite/
Michanowicz, D. R., Lebel, E. D., Domen, J. K., Hill, L. A. L., Jaeger, J. M., Schiff, J. E., Krieger, E. M., Banan, Z., Goldman, J. S. W., Nordgaard, C. L., & Shonkoff, S. B.C. (2021). Methane and health-damaging air pollutants from the oil and gas sector: Bridging 10 years of scientific understanding. PSE Healthy Energy. https://www.psehealthyenergy.org/work/methane-and-health-damaging-air-pollutants-from-oil-and-gas/
Mills, G., Sharps, K., Simpson, D., Pleijel, H., Frei, M., Burkey, K., Emberson, L., Cuddling, J., Broberg, M., Feng, Z., Kobayashi, K. & Agrawal, M. (2018). Closing the global ozone yield gap: Quantification and cobenefits for multistress tolerance. Global Change Biology, 24(10), 4869-4893. https://doi.org/10.1111/gcb.14381
Moore, C. W., Zielinska, B., Pétron, G., & Jackson, R. B. (2014). Air impacts of increased natural gas acquisition, processing, and use: A critical review. Environmental Science & Technology, 48(15), 8349–8359. https://doi.org/10.1021/es4053472
Motte, J., Alvarenga, R. A., Thybaut, J. W., & Dewulf, J. (2021). Quantification of the global and regional impacts of gas flaring on human health via spatial differentiation. Environmental Pollution, 291, 118213. https://doi.org/10.1016/j.envpol.2021.118213
National Atmospheric and Ocean Agency (2024). Carbon cycle greenhouse gases in CH₄ . Retrieved July 19, 2024. https://gml.noaa.gov/ccgg/trends_ch4/
Ocko, I. B., Sun, T., Shindell, D., Oppenheimer, M. Hristov, A. N., Pacala, S. W., Mauzerall, D. L., Xu, Y. & Hamburg, S. P. (2021). Acting rapidly to deploy readily available methane mitigation measures by sector can immediately slow global warming. Environmental Research, 16(5). https://doi.org/10.1088/1748-9326/abf9c8
Odjugo, P. A. O. & Osemwenkhae, E. J. (2009). Natural gas flaring affects microclimate and reduces maize (Zea mays) yield.. International Journal of Agriculture and Biology, 11(4), 408-412. https://www.cabidigitallibrary.org/doi/full/10.5555/20093194660
Oil and Gas Climate Initiative. (2023). Building towards net zero. https://www.ogci.com/progress-report/building-towards-net-zero
Olczak, M., Piebalgs, A., & Balcombe, P. (2023). A global review of methane policies reveals that only 13% of emissions are covered with unclear effectiveness. One Earth, 6(5), 519–535. https://doi.org/10.1016/j.oneear.2023.04.009
Pembina Institute. (2024). Comments on environment and climate change Canada’s (ECCC) regulations amending the regulations respecting reduction in the release of methane and certain volatile organic compounds (upstream oil and gas sector). https://www.pembina.org/reports/2024-02-joint-methane-submission-eccc.pdf
Project Drawdown. (2021). Climate solutions at work. https://drawdown.org/publications/climate-solutions-at-work
Project Drawdown. (2022). Legal job function action guide. https://drawdown.org/programs/drawdown-labs/job-function-action-guides/legal
Project Drawdown. (2023). Government relations and public policy job function action guide. https://drawdown.org/programs/drawdown-labs/job-function-action-guides/government-relations-and-public-policy
Project Drawdown. (2024, May 29). Unsung (climate) hero: The business case for curbing methane | presented by Stephan Nicoleau [video]. YouTube. https://www.youtube.com/watch?v=Y5y0i-RMfJ0
Ramya, A., Dhevagi, P., Poornima, R., Avudainayagam, S., Watanabe, M., & Agathokleous, E. (2023). Effect of ozone stress on crop productivity: A threat to food security. Environmental Research, 236(2), 116816. https://doi.org/10.1016/j.envres.2023.116816
Ravikumar, A. P., & Brandt, A. R. (2017). Designing better methane mitigation policies: The challenge of distributed small sources in the natural gas sector. Environmental Research Letters, 12(4), 044023. https://doi.org/10.1088/1748-9326/aa6791
Rissman, J. (2021). Benefits of the build back better act’s methane fee. Energy Innovation. https://energyinnovation.org/wp-content/uploads/2021/10/Benefits-of-the-Build-Back-Better-Act-Methane-Fee.pdf
Sampedro, J., Waldhoff, S., Sarofim, M., & Van Dingenen, R. (2023). Marginal damage of methane emissions: Ozone impacts on agriculture. Environmental and Resource Economics, 84(4), 1095-1126. https://doi.org/10.1007/s10640-022-00750-6
Schiffner, D., Kecinski, M., & Mohapatra, S. (2021). An updated look at petroleum well leaks, ineffective policies and the social cost of methane in Canada’s largest oil-producing province. Climatic Change, 164(3-4). https://doi.org/10.1007/s10584-021-03044-w
Shindell, D., Sadavarte, P., Aben, I., Bredariol, T. O., Dreyfus, G., Höglund-Isaksson, L., Poulter, B., Saunois, M., Schmidt, G. A., Szopa, S., Rentz, K., Parsons, L., Qu, Z., Faluvegi, G., & Maasakkers, J. D. (2024). The methane imperative. Frontiers. https://www.frontiersin.org/journals/science/articles/10.3389/fsci.2024.1349770/full
Schmeisser, L., Tecza, A., Huffman, M., Bylsma, S., Delang, M., Stanger, J., Conway, TJ, and Gordon, D. (2024). Fossil Fuel Operations Sector: Oil and Gas Production and Transport Emissions [Data set]. RMI, Climate TRACE Emissions Inventory. Retrieved April 18, 2025 from https://climatetrace.org
Smith, C., Nicholls, Z. R. J., Armour, K., Collins, W., Forster, P., Meinshausen, M., Palmer, M. D., & Watanabe, M. (2021). The earth’s energy budget, climate feedbacks, and climate sensitivity supplementary material (climate change 2021: The physical science basis. Contribution of working group I to the sixth assessment report of the Intergovernmental Panel on Climate Change). Intergovernmental Panel on Climate Change (IPCC). https://www.ipcc.ch/
Tai, A. P., Sadiq, M., Pang, J. Y., Yung, D. H., & Feng, Z. (2021). Impacts of surface ozone pollution on global crop yields: Comparing different ozone exposure metrics and incorporating co-effects of CO₂. Frontiers in Sustainable Food Systems, 5, 534616. https://doi.org/10.3389/fsufs.2021.534616
Tradewater. (2023). Methane. Retrieved August 16, 2024, from https://www.ogci.com/progress-report/building-towards-net-zero
Tran, H., Polka, E., Buonocore, J. J., Roy, A., Trask, B., Hull, H., & Arunachalam, S. (2024). Air quality and health impacts of onshore oil and gas flaring and venting activities estimated using refined satellite‐based emissions. GeoHealth, 8(3), e2023GH000938. https://doi.org/10.1029/2023GH000938
UN Environment Program. (2021). Global methane assessment: Benefits and costs of mitigating methane emissions. https://www.unep.org/resources/report/global-methane-assessment-benefits-and-costs-mitigating-methane-emissions
UN Environment Program. (2024). An eye on methane: Invisible but not unseen. https://www.unep.org/interactives/eye-on-methane-2024/
U.S. Department of Commerce, Commercial Law Development Programme. (2023). Methane abatement for oil and gas - handbook for policymakers. https://cldp.doc.gov/sites/default/files/2023-09/CLDP%20Methane%20Abatement%20Handbook.pdf
U.S. Energy Information Administration. (2024). What countries are the top producers and consumers of oil?. https://www.eia.gov/tools/faqs/faq.php?id=709&t=6
U.S. Environmental Protection Agency. (2019). Global non-CO₂ greenhouse gas emission projections & mitigation 2015 - 2050. https://www.epa.gov/ozone-layer-protection/transitioning-low-gwp-alternatives-residential-and-commercial-air
Van Dingenen, R., Crippa, M., Maenhout, G., Guizzardi, D., & Dentener, F. (2018). Global trends of methane emissions and their impacts on ozone concentrations. Joint Research Commission (European Commission). https://op.europa.eu/en/publication-detail/-/publication/c40e6fc4-dbf9-11e8-afb3-01aa75ed71a1/language-en
Wang, J., Fallurin, J., Peltier, M., Conway, TJ, and Gordon, D. (2024). Fossil Fuel Operations Sector: Refining Emissions [Data set]. RMI, Climate TRACE Emissions Inventory. Retrieved April 18, 2025 from https://climatetrace.org
World Bank Group. (2023). What you need to know about abatement costs and decarbonization. https://www.worldbank.org/en/news/feature/2023/04/20/what-you-need-to-know-about-abatement-costs-and-decarbonisation
World Bank Group. (2024). Global flaring and methane reduction partnership (GFMR). Retrieved August 16, 2024, from https://www.worldbank.org/en/programs/gasflaringreduction
Credits
Lead Fellow
Jason Lam
Contributors
Ruthie Burrows, Ph.D.
James Gerber, Ph.D.
Yusuf Jameel, Ph.D.
Daniel Jasper
Alex Sweeney
Internal Reviewers
Aiyana Bodi
Hannah Henkin
Ted Otte
Amanda Smith, Ph.D.
Paul West, Ph.D.
Effectiveness
Each Mt of methane that is not emitted avoids 81.2 million t CO₂‑eq on a 20-yr basis and 27.9 million t CO₂‑eq on a 100-yr basis (Smith et al., 2021). The GWP of methane is shown in Table 1. If the methane is burned (converted into CO₂ ), the contribution to climate change will still be less than that of methane released directly into the atmosphere. Methane abatement can have a more immediate impact on future global temperature rise because it has a larger and faster warming effect than CO₂. Mitigating methane emissions in the near term can give us more time for reducing GHG emissions in hard to abate sectors.
left_text_column_width
Table 1. Effectiveness at reducing emissions.
Unit: t CO₂‑eq /Mt of methane abated
| 100-yr Global Warming Potential | 27,900,000 |
| 20-yr Global Warming Potential | 81,200,000 |
Left Text Column Width
Cost
The cost of methane abatement will vary depending on the type of O&G production, the methane content of the O&G resource, and the strategies used to address it. We averaged the costs for various abatement strategies; methane content is sufficiently high to utilize methane abatement strategies, and energy infrastructure is available to utilize abated methane. The initial cost to abate 1 Mt of methane is US$594 million, the revenue is about US$193 million, and the overall net savings over a 30-yr amortization period is US$173 million. This means that reducing O&G methane emissions offers a net economic gain for O&G producers. We were not able to find operating cost information for the solution, meaning the net economic gain may be lower in practice.
We considered the baseline scenario where O&G producers do not have systems or practices in place to monitor or stop methane from escaping to the atmosphere and found very limited cost data. We assumed baseline costs to be 0 for initial costs, operational costs, and revenue because current practices and infrastructure are releasing methane to the atmosphere as a part of their existing cost of doing business.
Many of the initial cost data for methane abatement come from studies estimating how much capital would be required to reach methane emission targets for the O&G industry. These costs are for the global scale of O&G methane abatement and not from the point of view of an individual O&G producer. These studies do not go into detail about the cost of specific abatement strategies or their potential revenues. The context and assumptions are difficult to identify, since the abatement strategies must be tailored to each site. Ocko et al (2021) noted that most (around 80%) of economically feasible methane abatement actions are from the O&G sector.
Table 2 shows the costs per t CO₂‑eq .The value of the methane sold, instead of released, will often bring in revenue that covers the costs of abatement. Refer to the Appendix for information on the proportion of strategies that O&G producers could implement at low to no cost.
left_text_column_width
Table 2. Net cost per unit of climate impact.
Unit: 2023 US$/t CO₂‑eq
| median (100-yr basis) | -6.20 |
Left Text Column Width
Learning Curve
Many of the technology solutions for reducing methane emissions are mature, and we were unable to find literature suggesting the costs to implement these solutions will fall in the future. There may be efficiencies to be gained in LDAR, but little research offers insights into the costs of LDAR programs (Delphi Group, 2017, ICF 2016).
left_text_column_width
Speed of Action
Speed of action refers to how quickly a climate solution physically affects the atmosphere after it is deployed. This is different from speed of deployment, which is the pace at which solutions are adopted.
At Project Drawdown, we define the speed of action for each climate solution as gradual, emergency brake, or delayed.
Manage OIl & Gas Methane is an EMERGENCY BRAKE climate solution. It has the potential to deliver a more rapid impact than nominal and delayed solutions. Because emergency brake solutions can deliver their climate benefits quickly, they can help accelerate our efforts to address dangerous levels of climate change. For this reason, they are a high priority.
left_text_column_width
Caveats
Burning methane produces CO₂.
Though the GWP is far less than that of releasing methane into the atmosphere, the practice still creates a negative climate impact. Depending on the type of O&G production, methane abatement is already practiced with natural gas production and is likely to bring additional profit. However, oil producers who are not already producing methane for profit may not be able to abate methane at a profit.
Avoiding fossil fuel extraction, transport, and use is the only way to permanently reduce emissions from O&G production. For many low- and middle-income countries (LMICs), O&G is the main source of energy, and it is challenging for them to completely eliminate O&G from their energy mix while they are simultaneously working to improve living standards. High-income countries can help LMICs develop clean energy infrastructure by providing financial and technological support. This will prevent new investments in O&G infrastructure (Laan, et al., 2024), which would result in ongoing emissions for decades. It would also allow LMICs a realistic pathway to transition away from their existing O&G usage. O&G demand must fall by 80% between 2022 and 2050 to stay in alignment with the net-zero emissions scenarios modeled by IEA (2023c). O&G methane abatement will decrease over time as the O&G industry produces less methane to be abated.
Our assessment does not include the impact of the CO₂ created from the destruction of methane.
left_text_column_width
Current Adoption
We found little literature quantifying the current adoption of methane management; much of the methane abatement research revolves around the amount of methane that needs to be abated to reach certain climate targets. Based on data from Global Methane Initiative (GMI, 2024), 0 Mt of methane was abated in 2023 and is shown in Table 3.
GMI (2024) provided a conservative estimate of cumulative methane emissions abated each year, with a total of 153.6 Mt CO₂‑eq
(5.51 Mt methane) abated as of 2023. The methane is given as a cumulative value to show the incremental increase in total methane abated and to avoid double counting methane abated. GMI members only cover 70% of human-caused methane emissions, and the organization does not capture methane mitigation that occurs outside of GMI members. This suggests that even in years where methane was abated, it would likely still be an underestimate of what may have actually occurred globally. The untapped potential for methane abatement suggests that O&G companies are investing in increasing natural gas production, which may be due to relatively smaller profits from abatement and nonbinding regulations (Shindell et al., 2024).
left_text_column_width
Table 3. Current (2023) adoption level.
Unit: Mt of methane abated/yr
| median (50th percentile) | 0 |
Left Text Column Width
Adoption Trend
Although there is little research specifically quantifying the adoption of methane abatement strategies over time, we estimate the average adoption trend in recent years to be about 0.35 Mt/yr of methane abated. To create this estimate, we relied on GMI analysis (GMI, 2024). GMI showed methane abatement gradually increasing from 2011 to 2023, then tapering off around 2020 and beginning to decrease among its member organizations. Table 4 shows the adoption trend for O&G methane abatement.
The IEA (2025) compiled country-level reporting for GHG emissions with data up to 2024. However, we were not able to use the data for the adoption trend because the changes in methane emissions could have been due to reasons other than methane abatement. In reality, methane emissions may be affected by multiple factors such as natural disasters, political conditions, changes in O&G demand, and changes in O&G industry practices.
Oil and Gas Climate Initiative (2023) data on methane abatement to date for 12 major O&G companies indicate that methane emissions decreased 50% from 2017 to 2022; however, we cannot assume the rest of the O&G industry has made the same level of progress.
left_text_column_width
Table 4. Adoption trend, 2011–2022.
Unit: Mt methane abated/yr
| median (50th percentile) | 0.35 |
Left Text Column Width
Adoption Ceiling
We found an adoption ceiling of 80.7 Mt/yr of methane based on the IEA’s (2025) estimate for total methane emissions from the O&G sector. We assumed that current O&G methane emissions would remain the same into the future with no changes in O&G production or demand. Table 5 shows the adoption ceiling for O&G methane abatement.
Even in the IEA’s (2023c) highest methane abatement energy scenario, only 93% of the methane emissions are reduced by 2050. This would still leave methane emissions being released into the atmosphere by the O&G sector. Reduced O&G production will reduce the amount of methane emissions produced by the O&G sector and consequently reduce the amount of methane that needs to be controlled with methane abatement.
left_text_column_width
Table 5. Adoption ceiling.
Unit: Mt methane abated/yr
| median (50th percentile) | 80.7 |
Left Text Column Width
Achievable Adoption
Based on the limited data available for current adoption and adoption trend, we expect 3.26–8.84 Mt/yr of methane abated. The Achievable – Low value aligns with the IEA (2023c) baseline energy scenario (STEPS), in which partial methane abatement is used but not all technically possible methane is abated. The Achievable – High value aligns with the IEA (2023c) baseline scenario (STEPS), in which full methane abatement is employed (all technically possible methane is abated). We determined this range by taking the total methane abated in these scenarios and dividing by the difference between the target year and 2024 to determine an average amount of methane abated each year to reach the scenario target. Under both scenarios, reduced demand for O&G would reduce methane emissions produced and lower the adoption ceiling possible for methane abatement. Even in scenarios where there is reduced O&G demand, methane abatement would still be required to control fugitive methane emissions from O&G infrastructure and limit global climate change.
The amount of methane that can be abated varies greatly depending on how much methane the O&G industry produces. If O&G production remains steady, cumulative methane abatement could be 21–81 Mt, according to the IEA energy scenarios. If O&G demand drops 80% (IEA’s Net Zero Emissions scenario), total methane emissions would decline to 18 Mt, and the use of methane abatement would reduce methane emissions further by 17 Mt, leaving only 1 Mt of methane emitted in 2050.
There has been growing interest from governments and academia to more accurately identify methane emissions using technologies such as satellite sensing (MethaneSat, 2024); UNEP (2024) has set up a monitoring and operator’s alliance group that will share best practices among O&G producers. This alliance group has identified more than 1,200 methane releases, but only 15 responses from government or companies provided detail about the source of the emissions or whether any mitigation action was considered or taken. This shows there are still many opportunities to abate methane emissions.
More than 150 countries (representing 50% of the world’s human-caused methane emissions) have joined the Global Methane Pledge to reduce methane emissions 30% from 2020 to 2030 (UNEP, 2021). The IEA (2023b) found that many governments already have announced or put into place measures to cut methane emissions, so we expect global methane abatement to grow.
Conrad et al. (2023) found that the emission inventories reported by the Alberta, Canada, government underestimate the methane emissions from the O&G sector, with a large portion coming from venting. These sources of methane are relatively easier to address and can allow the O&G sector to quickly reduce methane emissions. Table 6 shows the statistical low and high achievable ranges for O&G methane abatement based on different sources for future uptake of O&G methane abatement.
left_text_column_width
Table 6. Achievable adoption.
Unit: Mt methane abated/yr
| Current Adoption | 0 |
| Achievable – Low | 3.26 |
| Achievable – High | 8.84 |
| Adoption Ceiling | 80.66 |
Left Text Column Width
We estimate that the O&G industry is currently abating approximately 0 Gt CO₂‑eq/yr on a 100-yr basis and 0 Gt CO₂‑eq/yr on a 20-yr basis using methane abatement strategies.
As the O&G industry grows or shrinks its emissions, the amount of methane available to abate will change accordingly. If O&G demand and production stay constant to 2050, we estimate 0.09–0.25 Gt CO₂‑eq/yr of methane could be abated.
However, if O&G demand drops, the methane abatement potential would drop because the O&G sector is producing less methane. This is projected in the different energy scenarios modeled by the IEA (2023). The range between the current O&G methane abatement and the adoption ceiling is shown in Table 7.
left_text_column_width
Table 7. Climate impact at different levels of adoption.
Unit: Gt CO₂‑eq/yr, 100-yr basis
| Current Adoption | 0 |
| Achievable – Low | 0.09 |
| Achievable – High | 0.25 |
| Adoption Ceiling | 2.25 |
Left Text Column Width
Additional Benefits
Air Pollution & Health
Methane reacts with other pollutants to create ground-level ozone (Mar et al., 2022), and incomplete combustion of methane releases CO₂, carbon monoxide, black carbon, and other pollutants such as volatile organic compounds (Fawole et al., 2016; Johnson and Coderre, 2012; Motte et al., 2021). These pollutants cause respiratory, reproductive, and neurological diseases; cancer; and premature death (Michanowicz et al., 2021; Motte et al., 2021; Tran et al., 2024), so reducing methane release can improve human health. Reducing or stopping flaring at a small number of the largest active sites can significantly reduce air pollution (Anejionu et al., 2015; Johnson and Coderre, 2012). Van Dingenen et al. (2018) estimate that ambitious methane reduction could prevent 70,000 to 130,000 ozone-related deaths worldwide each year.
left_text_column_width
Figure 2. Air pollutants emitted along the O&G life cycle (Moore et al., 2014). BTEX = benzene, toluene, ethylbenzene, xylene.
Image
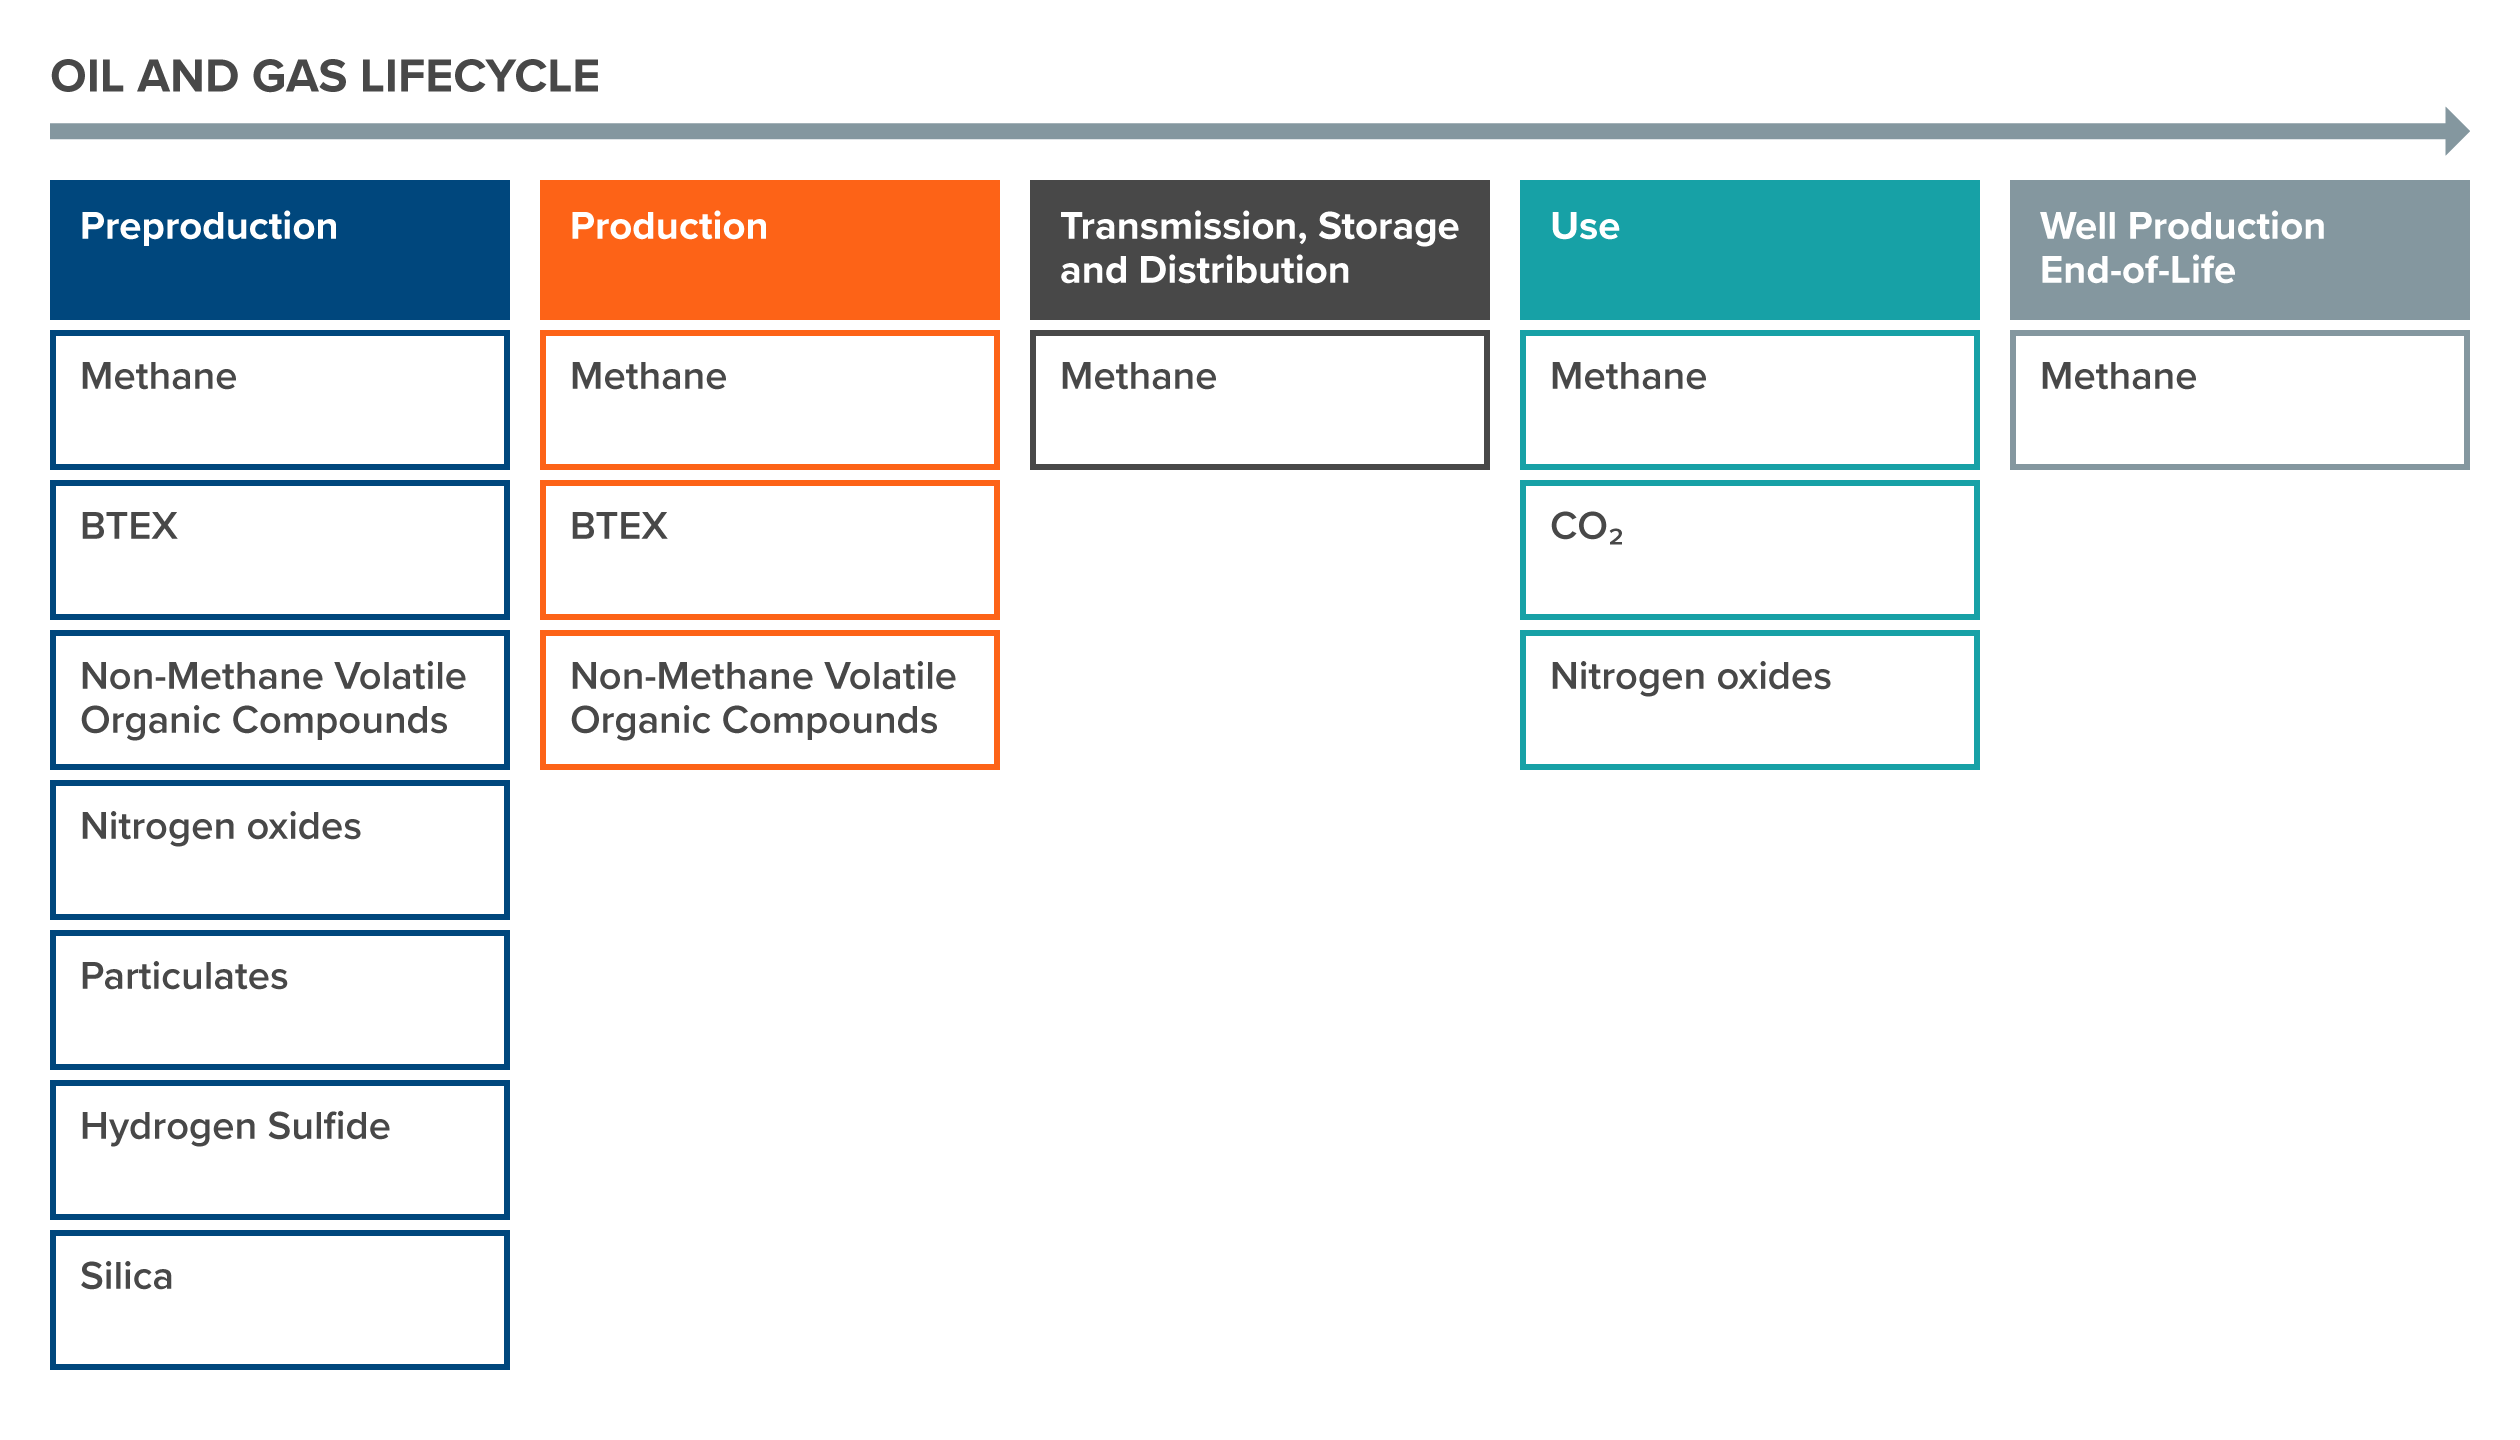
Source: Moore, C. W., Zielinska, B., Pétron, G., & Jackson, R. B. (2014). Air impacts of increased natural gas acquisition, processing, and use: A critical review. Environmental Science & Technology, 48(15), 8349–8359. https://doi.org/10.1021/es4053472
Enable Download
On
Food Security
Methane reacts with chemicals like VOCs to form tropospheric, or ground-level ozone (Fiore et al., 2002). Ground-level ozone has been linked to reduced crop growth and yields (Mills et al., 2018; Samperdo et al., 2023; Tai et al., 2021). Mitigating methane emissions from O&G could improve food security by reducing ground-level ozone and its harmful impacts on agricultural productivity (Tai et al., 2014; Ramya et al., 2023)
left_text_column_width
Risks
If natural gas prices drop there would be less economic reason for industries to voluntarily abate methane (IEA, 2021). Without policy support enforcing the use of methane abatement technologies, methane could continue to be released into the atmosphere. The use of methane abatement will be needed regardless of whether O&G demand remains the same or decreases over time because it has an immediate effect on reducing global temperature rise in the near term.
left_text_column_width
Interactions with Other Solutions
Reinforcing
Managing O&G methane can reinforce other solutions that reduce the amount of methane released to the atmosphere. The use of solutions such as applying changes to operations and maintenance; converting, replacing, and installing devices; and LDAR in the O&G industry can help demonstrate the effectiveness and economic case for methane abatement elsewhere and build momentum for adoption of methane abatement in other sectors.
left_text_column_width
Competing
Managing O&G methane has the potential to compete with solutions that provide clean electricity and solutions that focus on fuel switching in transportation because this solution increases O&G supply and can reduce the cost of O&G products. As a result, it could prolong the use of fossil fuels and slow down the transition to clean electricity.
left_text_column_width
Dashboard
Solution Basics
Mt methane abated
t CO₂-eq/unit
2.79×10⁷
units/yr
Current
03.268.84
Achievable (Low to High)
Climate Impact
Gt CO₂-eq/yr
Current 0
0.090.25
US$ per t CO₂-eq
-6
Emergency Brake
CH₄
Trade-offs
Methane abatement could increase the use of O&G resources without a broader strategy to reduce reliance on O&G as an energy resource. The use of methane abatement strategies to extend the use of existing O&G infrastructure, or building new O&G infrastructure, will not result in a net decrease in emissions. Beck et al. (2020) found that more than 57% of the GHG emissions from the O&G supply chain are from methane emissions, while the rest is due to CO₂ emissions (15% from the extraction process and 28% from O&G energy use). Even with methane mitigation, continued use of O&G will generate CO₂ emissions and will contribute to global temperature rise.
left_text_column_width
Mt CO2–eq
< 50
50–100
100–200
200–300
> 300
Refining
Production
Transport
Annual emissions from oil and gas sources, 2024
Globally, oil and gas sources (production, refining, and transport) are responsible for 78 of the 347 Mt of anthropogenic methane emissions in 2023. This is equivalent to 2,106 Mt CO2-eq based on a 100-year time scale. Methane emissions occur throughout the supply chain due to equipment imperfections, leaks, and intentional venting.
International Energy Agency. (2024). Methane tracker: Data tools. https://www.iea.org/data-and-statistics/data-tools/methane-tracker
Schmeisser, L., Tecza, A., Huffman, M., Bylsma, S., Delang, M., Stanger, J., Conway, TJ, and Gordon, D. (2024). Fossil fuel operations sector: Oil and gas production and transport emissions [Data set]. RMI, Climate TRACE Emissions Inventory. Retrieved April 18, 2025 from https://climatetrace.org
Wang, J., Fallurin, J., Peltier, M., Conway, TJ, and Gordon, D. (2024). Fossil fuel operations sector: Refining emissions [Data set]. RMI, Climate TRACE Emissions Inventory. Retrieved April 18, 2025 from https://climatetrace.org
Geographic Guidance Introduction
Methane abatement is recommended for all oil and gas (O&G) production. The levels of achievable abatement can vary geographically, depending on the extraction technology used (i.e., conventional drilling versus hydraulic fracturing). The Middle East, Europe, Asia, and North America are among the largest O&G producers and have the highest related methane emissions, according to the IEA (2025). Research from Shindell et al. (2024) found that North America, Russia, and several countries in the Middle East and Africa have the most methane abatement potential in O&G. O&G methane abatement could be accelerated if technologies and strategies used in high-income countries are shared with other O&G producing countries.
Action Word
Manage
Solution Title
Oil & Gas Methane
Classification
Highly Recommended
Lawmakers and Policymakers
- Hold well owners accountable for harm caused to the public and environment.
- Introduce performance goals for emissions reductions.
- Use economic measures such as taxes or financial incentives.
- Regulate key aspects of abatement, such as the use of LDAR, and enforce existing regulations.
- Utilize data-driven public information programs such as collecting and publishing monitoring and reporting data (“naming and shaming”).
- Distribute information to operators, such as technology options that fit relevant regulations.
Further information:
- Policy database – methane abatement. IEA (updated regularly)
- Global methane assessment. CCAC et al. (2021)
- Driving down methane leaks from the oil and gas industry – analysis. IEA (2021)
- Financing reductions in oil and gas methane emissions – analysis. IEA (2023)
- Global methane tracker 2024. IEA (2024)
- A global review of methane policies reveals that only 13% of emissions are covered with unclear effectiveness. Olczak et al. (2023)
- Government relations and public policy job function action guide. Project Drawdown (2022)
- Legal job function action guide. Project Drawdown (2022)
- Designing better methane mitigation policies: the challenge of distributed small sources in the natural gas sector. Ravikumar et al. (2017)
- Methane abatement for oil and gas - handbook for policymakers. U.S. Department of Commerce, Commercial Law Development Programme (2023)
Practitioners
- Shift business models toward 100% renewable energy.
- Detect and repair methane leaks.
- Implement device conversion, replacement, and installation and LDAR.
- Change operations and maintenance practices to reduce or recover vented methane.
- Implement zero-tolerance policies for methane leaks.
- Increase transparency on emissions and practices.
- Join cross-company and industry coalitions that facilitate implementation.
Further information:
- Global methane pledge. CCAC (n.d.)
- Global methane assessment. CCAC et al. (2021)
- Reducing methane emissions on a global scale. ClimateWorks Foundation (2024)
- Driving down methane leaks from the oil and gas industry – analysis. IEA (2021)
- Financing reductions in oil and gas methane emissions – analysis. IEA (2023)
- Strategies to reduce emissions from oil and gas operations. IEA (2023)
- Methane guiding principles. Methane Guiding Principles partnership (n.d.)
- Reducing methane emissions. Oil and Gas Climate Initiative (n.d.)
- Our green business transformation. Ørsted (2021)
- Unsung (climate) hero: the business case for curbing methane | presented by Stephan Nicoleau. Project Drawdown (2024)
Business Leaders
- Eliminate major methane O&G emitters in your value chains or pressure them to improve performance.
- Create a plan to transition to renewable energy.
- Center methane in net-zero strategies, such as establishing internal methane pricing mechanisms and requiring suppliers to meet standards for monitoring and reducing methane emissions in your operations.
- Identify technology partners that are monitoring and reducing methane emissions and make market commitments.
- If your company is participating in the voluntary carbon market, look into funding projects that plug methane leaks.
- Proactively collaborate with government and regulatory actors to support methane abatement policies.
- Join or support transparency initiatives led by trusted third parties, such as the Oil and Gas Methane Partnership 2.0.
Further information:
- Global methane assessment. CCAC et al. (2021)
- Driving down methane leaks from the oil and gas Industry – analysis. IEA (2021)
- Financing reductions in oil and gas methane emissions – analysis. IEA (2023)
- Climate solutions at work. Project Drawdown (2021)
- Drawdown-aligned business framework. Project Drawdown (2021)
- Unsung (climate) hero: the business case for curbing methane | presented by Stephan Nicoleau. Project Drawdown (2024)
- Methane. Tradewater (n.d.)
- Oil and gas methane partnership 2.0 UNEP (n.d.)
Nonprofit Leaders
- Help with monitoring and reporting by, for example, utilizing satellite data.
- Help design policies and regulations that support methane abatement.
- Educate the public on the urgent need to abate methane.
- Join or support efforts such as the Global Methane Alliance.
- Encourage policymakers to create ambitious targets and regulations.
- Pressure O&G companies to improve their practices.
- Take or support legal action when companies do not follow relevant regulations.
- Work with journalists and the media to support public education on the importance of methane abatement.
Further information:
- Global methane assessment. CCAC et al. (2021)
- Driving down methane leaks from the oil and gas industry – analysis. IEA (2021)
- Financing reductions in oil and gas methane emissions – analysis. IEA (2023)
- Global methane tracker 2024. IEA (2024)
- Policy database – methane abatement. IEA (updated regularly)
- A global review of methane policies reveals that only 13% of emissions are covered with unclear effectiveness. Olczak et al. (2023)
- Government relations and public policy job function action guide. Project Drawdown (2022)
- Legal job function action guide. Project Drawdown (2022)
- Designing better methane mitigation policies: the challenge of distributed small sources in the natural gas sector. Ravikumar et al. (2017)
- Methane abatement for oil and gas – handbook for policymakers. U.S. Department of Commerce, Commercial Law Development Programme (2023)
Investors
- Pressure and influence portfolio companies to incorporate methane abatement into their operations, noting that this saves money and adds value for investors.
- Provide capital for nascent methane abatement strategies and leak detection and monitoring instruments.
- Invest in green bonds and other financial instruments that support methane abatement projects.
- Seek impact investment opportunities such as sustainability-linked loans in entities that set methane abatement targets.
- Invest in projects that plug methane leaks.
Further information:
- Global methane assessment. CCAC et al. (2021)
- Driving down methane leaks from the oil and gas industry – analysis. IEA (2021)
- Financing reductions in oil and gas methane emissions – analysis. IEA (2023)
- Global methane tracker 2024. IEA (2024)
- Unsung (climate) hero: the business case for curbing methane | presented by Stephan Nicoleau. Project Drawdown (2024)
Philanthropists and International Aid Agencies
- Provide capital for methane monitoring, de-risking, and abatement in the early stages of implementation.
- Support global, national, and local policies that reduce methane emissions.
- Support accelerators or multilateral initiatives like the Global Methane Hub.
- If working in a fossil fuel–producing nation, support sustainable developments in other sectors of the economy.
- Explore opportunities to fund the plugging of abandoned oil or gas wells that leak methane.
- Advance awareness of the public health and climate threats from the O&G industry.
- Join, create, or participate in partnerships or certification programs dedicated to managing oil and gas methane.
Further information:
- Reducing methane emissions on a global scale. ClimateWorks Foundation (2024)
- Global methane assessment, CCAC & UNEP (2021)
- Driving down methane leaks from the oil and gas industry – analysis. IEA (2021)
- Financing reductions in oil and gas methane emissions – analysis. IEA (2023)
- Unsung (climate) hero: the business case for curbing methane | presented by Stephan Nicoleau. Project Drawdown (2024)
Thought Leaders
- Provide technical assistance (e.g., monitoring and reporting) to businesses, government agencies, and other entities working to reduce methane emissions.
- Help design policies and regulations that support methane abatement.
- Analyze historical emissions patterns to identify and publicize successful programs.
- Educate the public on the urgent need to abate methane.
- Advocate to policymakers for more ambitious targets and regulations.
- Pressure O&G companies to improve their practices.
- Join, create, or participate in partnerships or certification programs dedicated to managing oil and gas methane.
Further information:
- Reducing methane emissions on a global scale. ClimateWorks Foundation (2024)
- Global methane assessment. CCAC et al. (2021)
- Driving down methane leaks from the oil and gas industry – analysis. IEA (2021)
- Financing reductions in oil and gas methane emissions – analysis. IEA (2023)
- Unsung (climate) hero: the business case for curbing methane | presented by Stephan Nicoleau. Project Drawdown (2024)
Technologists and Researchers
- Develop new LDAR technologies that reduce cost and required capacity.
- Develop new technologies for measuring and verifying emissions.
- Conduct longitudinal studies to measure emissions against objectives or means of enforcement.
Further information:
- Global methane pledge. CCAC (secretariat) (n.d.)
- Global methane assessment. CCAC & UNEP (2021)
- Reducing methane emissions on a global scale. ClimateWorks Foundation (2024)
- Driving down methane leaks from the oil and gas industry – analysis. IEA (2021)
- Strategies to reduce emissions from oil and gas operations. IEA (2023)
- Methane guiding principles. Methane Guiding Principles partnership (n.d.)
- Reducing methane emissions. Oil and Gas Climate Initiative (n.d.)
- Unsung (climate) hero: the business case for curbing methane | presented by Stephan Nicoleau. Project Drawdown (2024)
- Global flaring and methane reduction partnership (GFMR). World Bank (n.d.)
Communities, Households, and Individuals
- If you are impacted by harmful O&G methane management practices, document your experiences.
- Reduce household consumption of fossil fuels by adopting clean energy sources, increasing energy efficiency, and replacing fossil fuel-powered equipment with electricity-powered equipment.
- Share documentation of harmful practices and/or other key messages with policymakers, the press, and the public.
- Encourage policymakers to improve regulations.
- Support public education efforts on the urgency and need to address the issue.
Further information:
- Reducing methane emissions on a global scale. ClimateWorks Foundation (2024)
- Global methane assessment. CCAC & UNEP (2021)
- Driving down methane leaks from the oil and gas industry – analysis. IEA (2021)
- Financing reductions in oil and gas methane emissions – analysis. IEA (2023)
- Unsung (climate) hero: the business case for curbing methane | presented by Stephan Nicoleau. Project Drawdown (2024)
Sources
- Global methane assessment. Climate and Clean Air Coalition et al. (2021)
- Driving down methane leaks from the oil and gas industry – analysis. International Energy Agency (2021)
- Financing reductions in oil and gas methane emissions – analysis. International Energy Agency (2023)
- Global methane tracker 2024 – Analysis. International Energy Agency (2024)
- A global review of methane policies reveals that only 13% of emissions are covered with unclear effectiveness. Olczak et al. (2023)
- Designing better methane mitigation policies: the challenge of distributed small sources in the natural gas sector. Ravikumar et al. (2017)
- An updated look at petroleum well leaks, ineffective policies and the social cost of methane in Canada’s largest oil-producing province. Schiffner et al. (2021)
- Methane abatement for oil and gas - handbook for policymakers. U.S. Department of Commerce, Commercial Law Development Programme (2023)
Evidence Base
Consensus of effectiveness of abating methane emissions in the O&G sector: High
There is a high level of consensus about the effectiveness of methane abatement strategies. These strategies can be deployed cost effectively in many cases and have an immediate impact on reducing global temperature rise.
Authoritative sources such as the IEA (2023d), UNEP (2021), and Global Methane Hub (2024) agree that reducing methane emissions can noticeably reduce the rate of global temperature rise. DeFabrizio et al. (2021) identified that methane abatement strategies such as LDAR, switching from natural gas fuel to electric power, using air for pneumatic devices, and using vapor recovery units could reduce O&G methane emissions by 40% by 2030 based on global 2017 O&G emissions. With methane being the second largest contributor to climate change after CO₂, reductions in methane emissions can quickly reduce global temperature rise.
Others (Marks Levi, 2022; DeFabrizio et al., 2021; Malley et al., 2023) have identified that many methane abatement strategies can use existing technologies, often at low cost. Dunsky (2023) found that implementing 24 of the least expensive abatement measures in the exploration and production phases of Canada’s O&G industry could help Canada achieve its 2030 methane target. The IEA (2023a) noted that the O&G industry was responsible for 80 Mt of methane in 2022 and had the largest potential for abatement in the near term. The O&G industry has the potential to abate 60 Mt of methane by 2030 using abatement strategies; 40% of that could be abated at no net cost based on average natural gas prices from 2017 to 2021 (IEA, 2023a).
The results presented in this document summarize findings from more than 15 reviews and meta-analyses and more than 10 original studies reflecting current evidence from two countries, primarily from the United States and Canada, and from global sources. We recognize this limited geographic scope creates bias, and hope this work inspires research and data-sharing on this topic in underrepresented regions.
left_text_column_width
Appendix
Data describing methane abatement potential in the O&G industry are often shown in marginal abatement cost curves (MACCs), which incorporate the initial cost, operating cost, revenue, and any extra costs per unit of emissions reduced as one value.
left_text_column_width
Figure A1. Marginal abatement cost curves (MACC) for methane abatement in the O&G industry (IEA, 2024).
Image
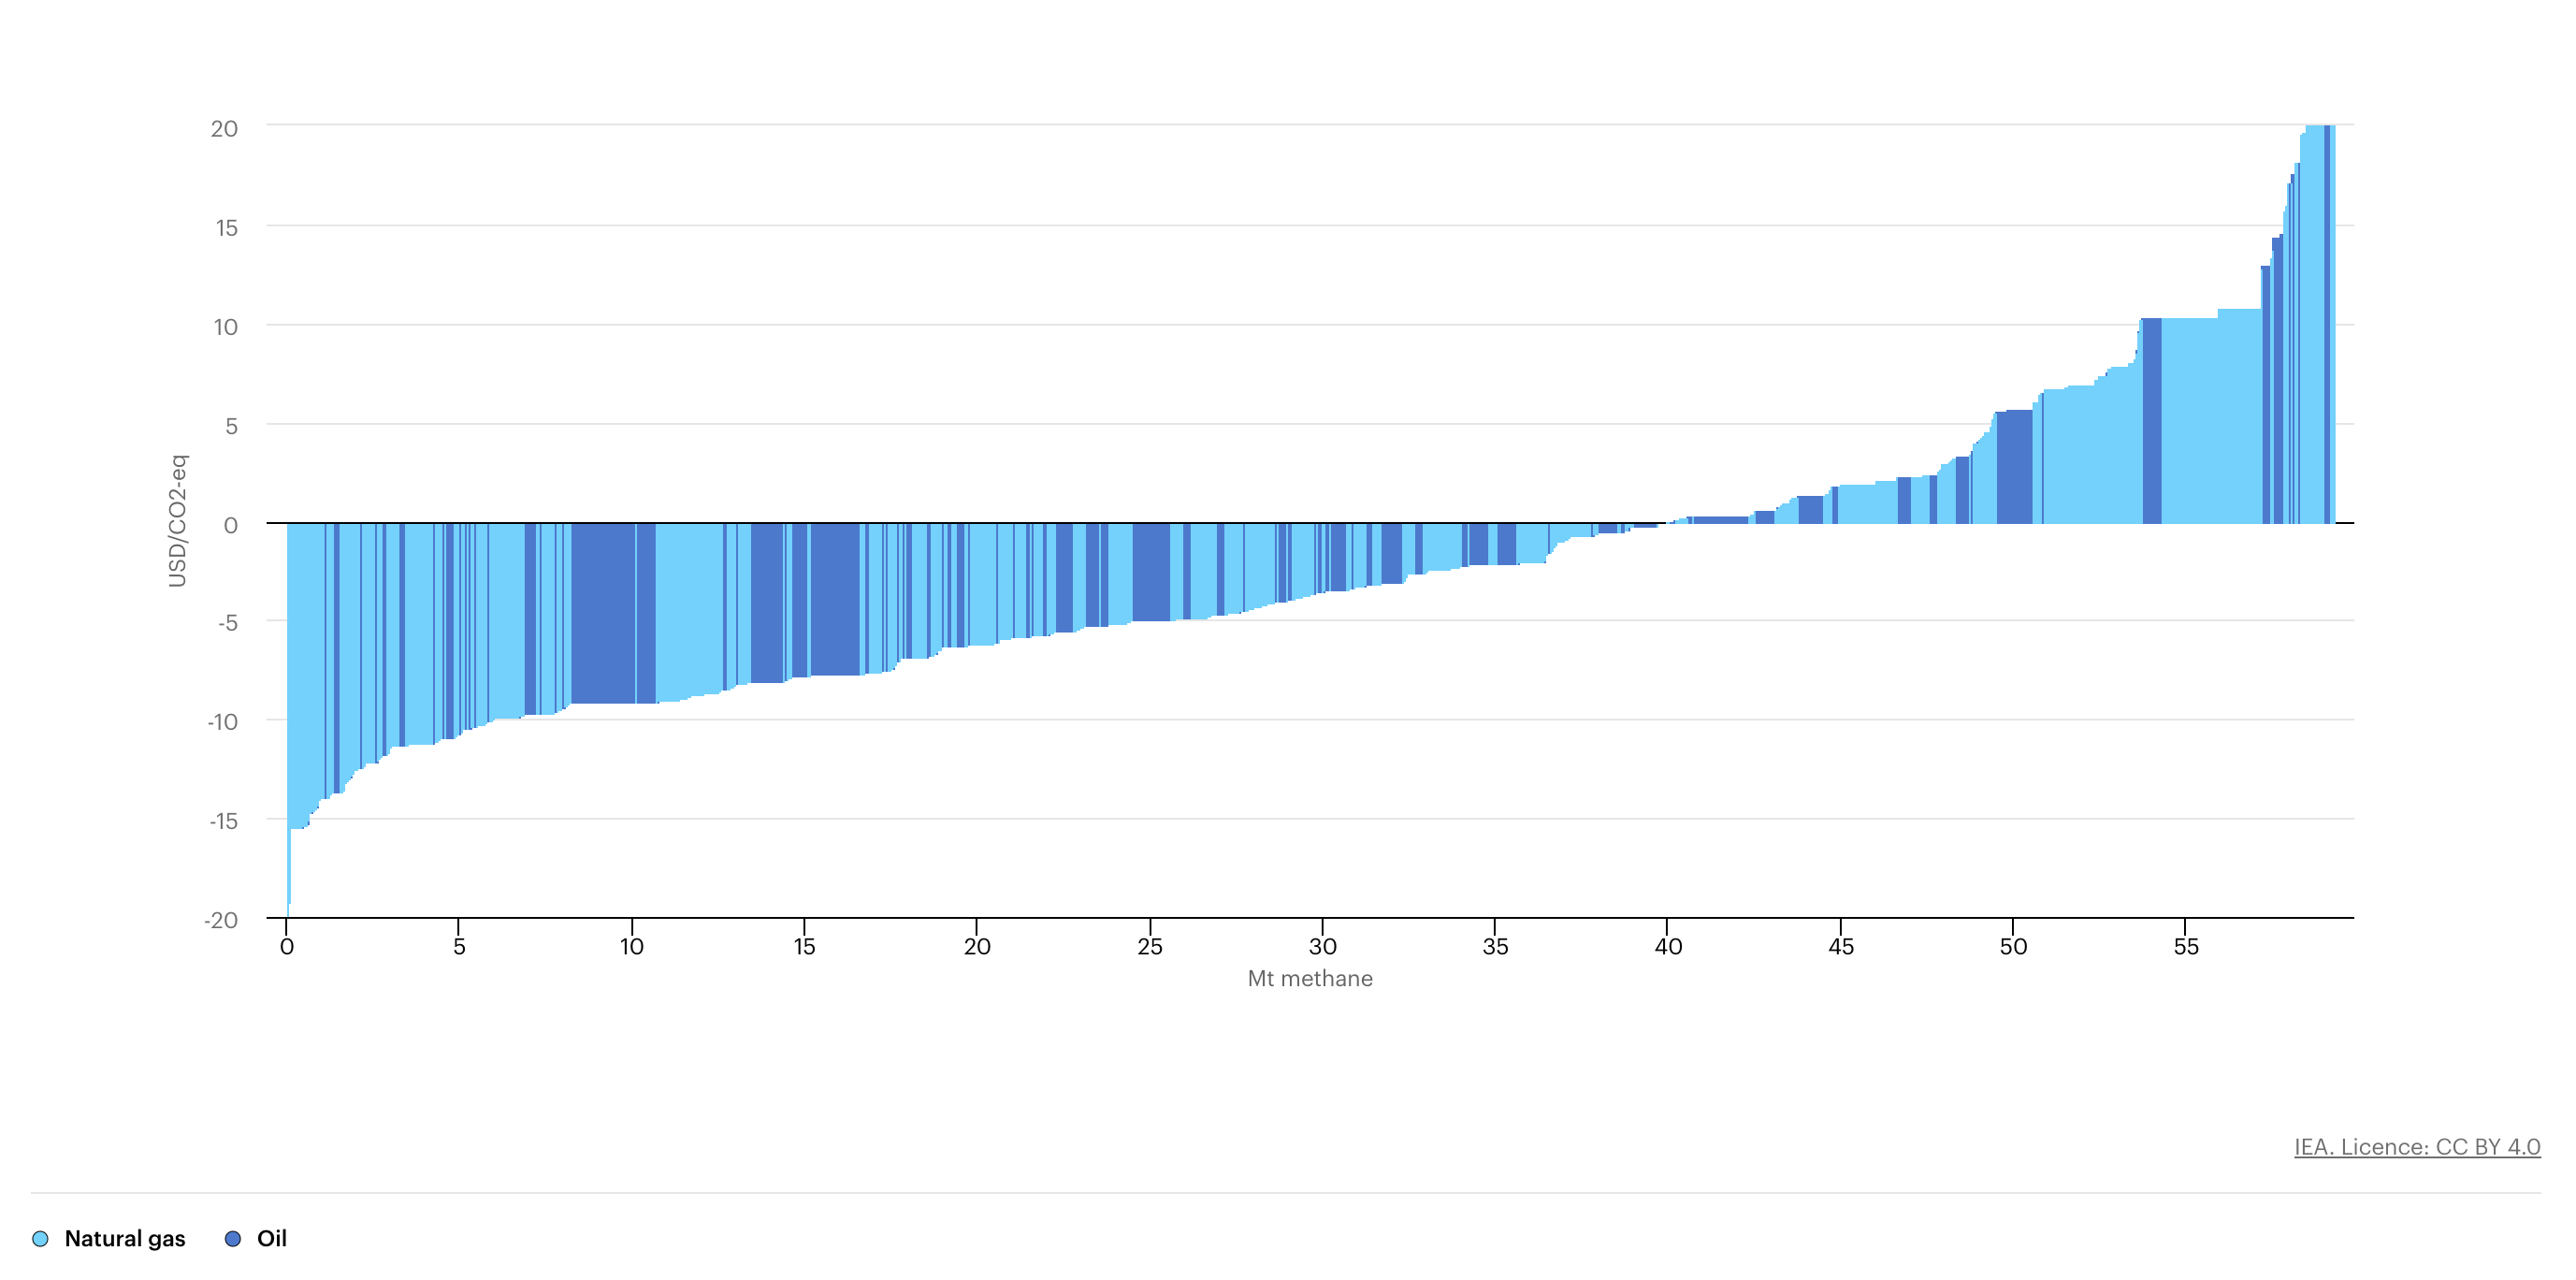
Source: International Energy Agency (Global Methane Tracker 2024).
Enable Download
On
MACCs indicate a range of potential climate actions and show at a glance the magnitude of financial return or financial cost across that range. In Figure A1, for the blocks below the horizontal axis, the value received from the sale of the captured methane is greater than the cost of the solution employed. The width of a block shows the annual amount of emissions a technology can abate, with wider blocks abating more emissions than narrower blocks.
MACCs are useful for identifying which climate action could have the most impact at reducing emissions or which options have a net economic gain. However, they do not illustrate the intricacies that may be in play among different climate actions and can lead users to ignore hard-to-abate emissions. The World Bank (2023) identified that MACCs are useful to find which option will reduce emissions by a set percentage but less useful for reducing absolute emissions to near zero.
left_text_column_width
Updated Date
Manage Coal Mine Methane
Sector
Other Energy
Mode
Cut Emissions
Cluster
Cut Fugitive Emissions
Image
Image

Coming Soon
Off
Summary
Managing coal mine methane (CMM) is the process of reducing methane emissions released from coal deposits and surrounding rock layers due to mining activities. CMM is naturally found in coal seams and released into the atmosphere when the coal seams are disturbed. Coal mines can continue to emit methane even after being closed or abandoned, which is known as abandoned mine methane (AMM). CMM and AMM can be captured and then utilized as a fuel source or destroyed before they reach the atmosphere [U.S. Environmental Protection Agency (EPA), 2024a].
Overview
CMM is released from coal mines before, during, and after active coal mining and from coal being transported (EPA, 2024a). Atmospheric methane has a GWP of 81 on a 20-yr basis and a GWP of 28 on a 100-yr basis (Intergovernmental Panel on Climate Change [IPCC], 2023). This means methane is 81 times more effective at trapping heat than CO₂. Because methane is a short-lived climate pollutant that has a much stronger warming effect than CO₂ over a given time period, abating methane from coal mines will have a powerful near-term impact on slowing global climate change. If capturing methane is not possible, destroying the methane by burning it is preferable to releasing it.
CMM comes from five major sources throughout the coal mine’s life cycle:
- Degasification systems – pipes installed in the ground to move methane into the atmosphere before starting mining
- Ventilation air – air escaping from underground mines when fresh air is used to push out underground methane during mining
- Surface mines – exposed coal seams that emit methane directly into the atmosphere during mining
- Fugitive emissions – already mined coal that emits methane while being transported or stored
- Abandoned or closed mines – coal seams and rock strata that are exposed to air, allowing AMM to escape through existing vents or cracks after mine closure.
Figure 1. Percent breakdown of CMM sources in the United States, 2021.
Source: U.S. Environmental Protection Agency (2024d). Sources of coal mine methane. Retrieved November 5, 2024. https://www.epa.gov/cmop/sources-coal-mine-methane
CMM management relies on several practices and technologies to reduce the amount of methane released into the atmosphere. The CMM that is captured can be used as a fuel at high concentrations and destroyed through flaring or oxidation at low concentrations. The methane captured from degasification systems typically has a high concentration while fugitive and ventilation methane sources are low concentration. CMM management also includes leak detection and repair using satellites, drones, or other technologies to prevent methane from escaping into the atmosphere.
Underground coal mines have more methane abatement strategies available due to higher average methane concentrations and relative ease of capture. Surface coal mines are exposed directly to the atmosphere and can cover large areas, making them more difficult to abate methane, though there are technologies that can reduce CMM emissions. See the Appendix for more details on the abatement technologies specific to underground and surface coal mines.
References
Assan, S., & Whittle, E. (2023). In the dark: Underreporting of coal mine methane is a major climate risk. Ember. https://ember-energy.org/latest-insights/in-the-dark-underreporting-of-coal-mine-methane-is-a-major-climate-risk/#supporting-material
Assan, S. (2024). Understanding the EU’s methane regulation for coal. Ember. https://ember-energy.org/latest-insights/eumethane-reg-explained/
CNX. (2024, March 20). Jumpstarting coal mine methane capture projects for beneficial end use [PowerPoint slides].Global Methane Initiative. https://www.globalmethane.org/resources/details.aspx?resourceid=5386
DeFabrizio, S., Glazener, W., Hart, C., Henderson, K., Kar, J., Katz, J., Pratt, M. P., Rogers, M., Ulanov, A., & Tryggestad, C. (2021). Curbing methane emissions: How five industries can counter a major climate threat. McKinsey Sustainability. https://www.mckinsey.com/~/media/mckinsey/business%20functions/sustainability/our%20insights/curbing%20methane%20emissions%20how%20five%20industries%20can%20counter%20a%20major%20climate%20threat/curbing-methane-emissions-how-five-industries-can-counter-a-major-climate-threat-v4.pdf
Domingo, N. G. G., Fiore, A. M., Lamarque, J.-F., Kinney, P. L., Jiang, L., Gasparrini, A., Breitner, S., Lavigne, E., Madureira, J., Masselot, P., das Neves Pereira da Silva, S., Sheng Ng, C. F., Kyselý, J., Guo, Y., Tong, S., Kan, H., Urban, A., Orru, H., Maasikmets, M., … Chen, K. (2024). Ozone-related acute excess mortality projected to increase in the absence of climate and air quality controls consistent with the Paris Agreement. One Earth (Cambridge, Mass.), 7(2), 325–335. https://doi.org/10.1016/j.oneear.2024.01.001
Fiore, A. M., Jacob, D. J., & Field, B. D. (2002). Linking ozone pollution and climate change: The case for controlling methane. Geophysical Research Letters, 29(19), 182-197. https://doi.org/10.1029/2002GL015601
Gajdzik, B., Tobór-Osadnik, K., Wolniak, R., & Grebski, W. W. (2024). European climate policy in the context of the problem of methane emissions from coal mines in Poland. Energies, 17(10), 2396. https://doi.org/10.3390/en17102396
Global Energy Monitor (n.d.). Global coal mine tracker. Retrieved February 27, 2025 from https://globalenergymonitor.org/projects/global-coal-mine-tracker/
Global Methane Initiative. (2015). Coal mine methane country profiles. https://www.globalmethane.org/documents/toolsres_coal_overview_fullreport.pdf
Global Methane Initiative (2018). Expert dialogue on ventilation air methane (VAM). https://www.globalmethane.org/documents/res_coal_VAM_Dialogue_Report_20181025.pdf
Global Methane Initiative (2024a). 2023 Accomplishments in methane mitigation, recovery, and use through U.S.-supported international efforts. https://www.epa.gov/system/files/documents/2024-12/epa430r24009-fy23-accomplishments-report.pdf
Global Methane Initiative (2024b). International coal mine methane project list. https://globalmethane.org/resources/details.aspx?resourceid=1981
Hong, C., Mueller, N. D., Burney, J. A., Zhang, Y., AghaKouchak, A., Moore, F. C., Qin, Y., Tong, D., & Davis, S. J. (2020). Impacts of ozone and climate change on yields of perennial crops in California. Nature Food, 1(3), 166–172. https://doi.org/10.1038/s43016-020-0043-8
Intergovernmental Panel on Climate Change (IPCC). (2023). In: Climate change 2023: Synthesis report. Contribution of working groups I, II and III to the sixth assessment report of the intergovernmental panel on climate change [core writing team, H. Lee and J. Romero (eds.)]. IPCC, Geneva, Switzerland, pp. 1–34, doi: 10.59327/IPCC/AR6-9789291691647.001 https://www.ipcc.ch/report/ar6/syr/
International Energy Agency. (2021). Global methane tracker 2021: Methane abatement and regulation. https://www.iea.org/reports/methane-tracker-2021/methane-abatement-and-regulation
International Energy Agency. (2023a). Net zero roadmap: A global pathway to keep the 1.5℃ goal in reach - 2023 update. https://www.iea.org/reports/net-zero-roadmap-a-global-pathway-to-keep-the-15-0c-goal-in-reach
International Energy Agency. (2023b). Strategies to reduce emissions from coal supply. Global Methane Tracker 2023. https://www.iea.org/reports/global-methane-tracker-2023/strategies-to-reduce-emissions-from-coal-supply
International Energy Agency. (2023c). The imperative of cutting methane from fossil fuels. https://www.iea.org/reports/the-imperative-of-cutting-methane-from-fossil-fuels
International Energy Agency. (2023d). Global methane tracker 2023: Overview. https://www.iea.org/reports/global-methane-tracker-2023/overview
International Energy Agency. (2024a). Global methane tracker documentation 2024 version. https://iea.blob.core.windows.net/assets/d42fc095-f706-422a-9008-6b9e4e1ee616/GlobalMethaneTracker_Documentation.pdf
International Energy Agency. (2024b). Methane tracker: Data tools. https://www.iea.org/data-and-statistics/data-tools/methane-tracker
International Energy Agency. (2024c). World energy outlook 2024. https://www.iea.org/reports/world-energy-outlook-2024
International Energy Agency. (2025). Global methane tracker documentation 2025 version. https://iea.blob.core.windows.net/assets/2c0cf2d5-3910-46bc-a271-1367edfed212/GlobalMethaneTracker2025.pdf
Kholod, N., Evans, M., Pilcher, R. C., Roshchanka, V., Ruiz, F., Coté, M., & Collings, R. (2020). Global methane emissions from coal mining to continue growing even with declining coal production. Journal of Cleaner Production, 256. https://doi.org/10.1016/j.jclepro.2020.120489
Lewis, C., Tate, R.D., and Mei, D.L. (2024). Fuel operations sector: Coal mining emissions methodology [Data set]. WattTime and Global Energy Monitor, Climate TRACE Emissions Inventory. Retrieved April 18, 2025, from https://climatetrace.org
Malley, C. S., Borgford-Parnell, N. Haeussling, S., Howard, L. C., Lefèvre E. N., & Kuylenstierna J. C. I. (2023). A roadmap to achieve the global methane pledge. Environmental Research: Climate, 2(1). https://doi.org/10.1088/2752-5295/acb4b4
Mar, K. A., Unger, C., Walderdorff, L., & Butler, T. (2022). Beyond CO₂ equivalence: The impacts of methane on climate, ecosystems, and health. Environmental Science & Policy, 134, 127–136. https://doi.org/10.1016/j.envsci.2022.03.027
MethaneSAT. (2024). Solving a crucial climate challenge. Retrieved September 2, 2024 https://www.methanesat.org/satellite/
Mills, G., Sharps, K., Simpson, D., Pleijel, H., Frei, M., Burkey, K., Emberson, L., Cuddling, J., Broberg, M., Feng, Z., Kobayashi, K. & Agrawal, M. (2018). Closing the global ozone yield gap: Quantification and cobenefits for multistress tolerance. Global Change Biology, 24(10), 4869–4893. https://doi.org/10.1111/gcb.14381
Ocko, I. B., Sun, T., Shindell, D., Oppenheimer, M. Hristov, A. N., Pacala, S. W., Mauzerall, D. L., Xu, Y. & Hamburg, S. P. (2021). Acting rapidly to deploy readily available methane mitigation measures by sector can immediately slow global warming. Environmental Research, 16(5). https://doi.org/10.1088/1748-9326/abf9c8
Ramya, A., Dhevagi, P., Poornima, R., Avudainayagam, S., Watanabe, M., & Agathokleous, E. (2023). Effect of ozone stress on crop productivity: A threat to food security. Environmental Research, 236(2), 116816. https://doi.org/10.1016/j.envres.2023.116816
Roshchanka, V., Evans, M., Ruiz, F., & Kholod, N. (2017). A strategic approach to selecting policy mechanisms for addressing coal mine methane emissions: A case study on Kazakhstan. Environmental Science & Policy, 78, 185–192. https://doi.org/10.1016/j.envsci.2017.08.005
Roshchanka, V., & Talkington, C. (2022). Effective monitoring, reporting and verification of methane emissions in the coal industry and the linkage to methane mitigation. https://papers.ssrn.com/sol3/papers.cfm?abstract_id=4298409
Rystad Energy. (2023, October 18). Methane tracking technologies study [PowerPoint slides]. Environmental Defense Fund. https://www.edf.org/sites/default/files/documents/Methane%20Tracking%20Technologies%20Study%20Oct%2018%202023.pdf
Sampedro, J., Waldhoff, S., Sarofim, M., & Van Dingenen, R. (2023). Marginal damage of methane emissions: Ozone impacts on agriculture. Environmental and Resource Economics, 84(4), 1095–1126. https://doi.org/10.1007/s10640-022-00750-6
Setiawan, D. & Wright, C. (2024). The risks of ignoring methane emissions in coal mining. Ember. https://ember-energy.org/latest-insights/the-risks-of-ignoring-methane-emissions-in-coal-mining/#supporting-material
Shindell, D., Sadavarte, P., Aben, I., Bredariol, T. O., Dreyfus, G., Höglund-Isaksson, L., Poulter, B., Saunois, M., Schmidt, G. A., Szopa, S., Rentz, K., Parsons, L., Qu, Z., Faluvegi, G., & Maasakkers, J. D. (2024). The methane imperative. Frontiers. https://www.frontiersin.org/journals/science/articles/10.3389/fsci.2024.1349770/full
Silvia, F., Talia, V., & Di Matteo, M. (2021). Coal mining and policy responses: Are externalities appropriately addressed? A meta-analysis. Environmental Science & Policy, 126, 39–47. https://doi.org/10.1016/j.envsci.2021.09.013
Smith, C., Nicholls, Z. R. J., Armour, K., Collins, W., Forster, P., Meinshausen, M., Palmer, M. D., & Watanabe, M. (2021). The earth’s energy budget, climate feedbacks, and climate sensitivity supplementary material (climate change 2021: The physical science basis. Contribution of working group I to the sixth assessment report of the Intergovernmental Panel on Climate Change). Intergovernmental Panel on Climate Change (IPCC). https://www.ipcc.ch/
Tai, A. P., Sadiq, M., Pang, J. Y., Yung, D. H., & Feng, Z. (2021). Impacts of surface ozone pollution on global crop yields: comparing different ozone exposure metrics and incorporating co-effects of CO₂. Frontiers in Sustainable Food Systems, 5, 534616. https://doi.org/10.3389/fsufs.2021.534616
Tao, S., Chen, S., & Pan, Z. (2019). Current status, challenges, and policy suggestions for coalbed methane industry development in China: A review. Energy Science & Engineering, 7(4), 1059–1074. https://doi.org/10.1002/ese3.358
Tate, R. D., (2022). Bigger than oil or gas? Sizing up coal mine methane. Global Energy Monitor. https://globalenergymonitor.org/wp-content/uploads/2022/03/GEM_CCM2022_final.pdf
United Nations Economic Commission for Europe (UNECE). (2019). Best practice guidance for effective methane recovery and use from abandoned coal mines. https://unece.org/fileadmin/DAM/energy/images/CMM/CMM_CE/Best_Practice_Guidance_for_Effective_Methane_Recovery_and_Use_from_Abandoned_Coal_Mines_FINAL__with_covers_.pdf
United Nations Economic Commission for Europe (UNECE). (2022). Best practice guidance for effective management of coal mine methane at national level: Monitoring, reporting, verification and mitigation. https://globalmethane.org/documents/Best%20Practice%20Guidance%20for%20Effective%20Management%20of%20Coal%20Mine%20Methane%20at%20National%20Level%20Monitoring,%20Reporting,%20Verification%20and%20Mitigation.pdf
United Nations Environment Program. (2022). Coal mine methane science studies road map. https://www.unep.org/resources/other-evaluation-reportsdocuments/coal-mine-methane-science-studies-road-map
U.S. Center for Disease Control and Prevention, (2024, September 25). Mining fires and explosions. https://www.cdc.gov/niosh/mining/topics/fires-explosions.html
U.S. Environmental Protection Agency (2019). Global non-CO₂ greenhouse gas emission projections & mitigation 2015 - 2050. https://www.epa.gov/sites/default/files/2019-09/documents/epa_non-co2_greenhouse_gases_rpt-epa430r19010.pdf
U.S. Environmental Protection Agency (2024a). About coal mine methane. Retrieved November 5, 2024. https://www.epa.gov/cmop/about-coal-mine-methane
U.S. Environmental Protection Agency (2024b). Coalbed methane outreach program accomplishments. https://www.epa.gov/cmop/coalbed-methane-outreach-program-accomplishments
U.S. Environmental Protection Agency (2024c). GHGRP underground coal mines. Retrieved November 5, 2024. https://www.epa.gov/ghgreporting/ghgrp-underground-coal-mines
U.S. Environmental Protection Agency (2024d). Sources of coal mine methane. Retrieved November 5, 2024. https://www.epa.gov/cmop/sources-coal-mine-methane
Ward, K., Mountain State Spotlight, Mierjeski, A. & Scott Pham. (2023). In the game of musical mines, environmental damage takes a back seat. ProPublica. https://www.propublica.org/article/west-virginia-coal-blackjewel-bankruptcy-pollution
Zhu, R., Khanna, N., Gordon, J., Dai, F., & Lin, J. (2023). Abandoned coal mine methane reduction. Berkeley Lab. https://ccci.berkeley.edu/sites/default/files/Abandonded%20Coal%20Mines_Final%20%28EN%29.pdf
Credits
Lead Fellow
Jason Lam
Contributors
James Gerber, Ph.D.
Yusuf Jameel, Ph.D.
Ruthie Burrows, Ph.D.
Daniel Jasper
Alex Sweeney
Internal Reviewers
Sarah Gleeson, Ph.D.
Aiyana Bodi
Hannah Henkin
Ted Otte
Amanda Smith, Ph.D.
Paul West, Ph.D.
Effectiveness
Each Mt of methane that is not emitted avoids 81.2 Mt CO₂‑eq on a 20-yr basis and 27.9 Mt CO₂‑eq on a 100-yr basis (Smith et al., 2021). The GWP of methane is shown in Table 1. If the methane is converted into CO₂ through burning the contribution to global climate change will still be less than if the methane were released into the atmosphere. Methane abatement can have a more immediate impact on future global temperature rise because it has a larger and faster warming effect than CO₂. Mitigating methane emissions in the near term can give us more time for reducing GHG emissions in hard to abate sectors.
left_text_column_width
Table 1. Effectiveness at reducing emissions.
Unit: t CO₂‑eq/Mt methane abated
| 100-yr GWP | 27,900,000 |
| 20-yr GWP | 81,200,000 |
Left Text Column Width
Cost
The cost of methane abatement will vary depending on the type of coal mine, the methane content of the coal seam, the strategies used, and the availability of financial support for methane abatement. For our analysis, we average the costs for various feasible abatement strategies under two general assumptions: sufficiently high methane content for any of the major abatement strategies to be applied (IEA, 2024a) and the ability to use the abated methane on-site or sell it to natural gas companies. The initial cost to abate 1 Mt of methane is US$1.5 billion, the operating cost is about US$130 million, revenue is about US$260 million and the overall net savings over a 30-yr amortization period is US$90 million. We were only able to find revenue information from the IEA (2023b, 2024a), meaning the net cost could be different than shown here due to the site specific nature of methane abatement strategies.
We considered the baseline scenario to be coal mining practices without methane abatement; all cost estimates here are relative to that scenario.
Cost data were limited for this solution. The available costs for a specific abatement strategy were normalized according to the cost of abating one Mt of methane, and it was assumed that a single strategy abated all of the methane for the coal mine. This results in an overestimate of the effectiveness of any individual strategy. In reality, multiple strategies are likely to be used. The costs shown in Table 2 are for the global scale of coal methane abatement and not from the point of view of an individual coal producer. Many studies that look at global coal methane abatement put multiple abatement strategies together and do not go into detail about the individual technology costs. The IEA (2024a) included costs for individual CMM abatement strategies; however, the costs were only applicable for coal mines that produce enough methane for it to be economically feasible to deploy the specific abatement strategy. Flaring is an effective strategy for destroying captured methane, but will not create revenue in the absence of a carbon market. For more details on important aspects for coal methane abatement strategies, refer to the Appendix.
left_text_column_width
Table 2. Cost per unit climate impact.
Unit: 2023 US$/t CO₂‑eq, 100-yr basis
| median | -3.17 |
Left Text Column Width
Learning Curve
Many of the solutions for reducing methane emissions from coal mining are mature. Research from Rystad (2023) found that technologies for abating CMM emissions, such as drainage gas utilization, sealing and rerouting, and flaring, were considered mature in Australian coal mines. Regenerative thermal oxidation technology is in commercial use for destroying volatile organic compounds and can be used for destroying ventilation air methane (VAM), but the manufacturers have little interest in improving the technology for use in coal mines without confirmed markets (GMI, 2018; Rystad, 2023). We do not foresee the costs of implementing these solutions falling in the future. CMM regulations may encourage manufacturers to improve oxidation technology, but the technology is already used commercially, so there may not be large efficiency gains.
left_text_column_width
Speed of Action
Speed of action refers to how quickly a climate solution physically affects the atmosphere after it is deployed. This is different from speed of deployment, which is the pace at which solutions are adopted.
At Project Drawdown, we define the speed of action for each climate solution as gradual, emergency brake, or delayed.
Manage Coal Mine Methane is an EMERGENCY BRAKE climate solution. It has the potential to deliver a more rapid impact than nominal and delayed solutions. Because emergency brake solutions can deliver their climate benefits quickly, they can help accelerate our efforts to address dangerous levels of climate change. For this reason, they are a high priority.
left_text_column_width
Caveats
CMM abatement consists of capturing methane that would otherwise be released into the atmosphere. If the methane is burned, CO₂ will be emitted as a byproduct; however, this provides a net climate benefit compared to the methane that would be emitted. CMM emissions management can be avoided by not extracting, transporting, or using coal in the first place.
As coal demand drops, the number of closed or abandoned coal mines will increase. These mines will continue to release AMM into the atmosphere for many decades. Sealing underground mines can stop methane from being released, but seals have been known to fail and require ongoing monitoring to verify methane is not escaping (Kholod et al., 2020). Gas collection systems can be used to capture AMM, but the CO₂ produced will need to be captured for complete emission reductions. Flooding underground coal mines is very effective at stopping methane from being released; however, there are concerns about water contamination (McKinsey, 2021).
Our assessment does not include the impact of the CO₂ created from the destruction of methane.
left_text_column_width
Current Adoption
We estimated that the coal sector abated 0.59 Mt of methane in 2023 and released 40 Mt in 2024 (IEA, 2025). Reports from EPA (2022), and GMI (2023) estimated the amount of CMM abated to date, and the statistical ranges from the sources are shown in Table 3. However, most of the data focused on coal mines in the United States. The EPA (2024b) stated that 0.3 Mt of methane was captured in 2021 due to the Coalbed Methane Outreach Program. CMM is controlled at coal mines for health and safety reasons, but only in 2024 was regulation introduced for reducing methane emissions from the energy sector in the European Union (Assan, 2024).
GMI (2024a) reports that 0.79 Mt of methane was abated from coal mines in 2023 among its member countries. The organization includes 48 GMI member countries but covers only 70% of human-caused methane emissions and does not track methane mitigation that has occurred outside of the group. GMI (2024b) currently lists more than 471 CMM abatement projects in 20 countries worldwide. According to Global Energy Monitor (n.d.), over 6,000 coal mines were active in more than 70 countries as of April 2024. With these data sources, we consider our analysis of the current adoption of CMM abatement as conservative.
left_text_column_width
Table 3. Current (2023) adoption level.
Unit: Mt/yr of methane abated
| 25th percentile | 0.49 |
| mean | 0.59 |
| median (50th percentile) | 0.59 |
| 75th percentile | 0.69 |
Left Text Column Width
Adoption Trend
Although there are little data specifically quantifying the adoption trend of methane abatement strategies, we estimate the median adoption trend to be about 0.60 Mt/yr of methane abated. Table 4 shows the adoption trend for CMM abatement.
GMI (2024) reported methane abatement staying relatively stable from 2016 to 2023 at about 0.8 Mt/yr, with a small increase to 1.0 Mt of methane in 2019–2022 before decreasing back to 0.8 Mt in 2023, causing the adoption trend to be higher than the current adoption value we state above. The EPA (2024a) Coalbed Methane Outreach Program showed fairly stable emission reductions of around 0.33 Mt/yr between 2016 and 2022. The annual methane emission abatement from this program gradually increased 2003–2011, followed by a continued trend of methane abatement at a slower rate 2011–2022. The IEA (2024b) found that almost 2.0 Mt of methane was emitted in 2023 by the United States coal industry, and 60% of those emissions could be abated.
left_text_column_width
Table 4. (2016–2023) adoption trend.
Unit: Mt/yr methane abated
| 25th percentile | 0.46 |
| mean | 0.60 |
| median (50th percentile) | 0.60 |
| 75th percentile | 0.73 |
Left Text Column Width
Adoption Ceiling
We found an adoption ceiling of about 40.3 Mt/yr of methane based on the IEA’s (2025) estimate for total methane emissions from the coal mine sector. We assumed that current CMM emissions would remain the same into the future with no changes in coal production or demand. Table 5 shows the adoption ceiling for coal mine methane abatement.
Even in the IEA’s (2023c) highest methane abatement energy scenario, only 93% of the methane emissions are reduced by 2050. This would still leave the coal sector releasing methane into the atmosphere. Reduced coal production will reduce the amount of methane emissions produced by the coal sector and consequently reduce the amount of methane that needs to be controlled with methane abatement. However, methane abatement will still be important for abating the remaining CMM emissions and the growing proportion of AMM emissions (IEA, 2023c, Kholod et al., 2020).
left_text_column_width
Table 5. Adoption ceiling.
Unit: Mt/yr of methane abated
| median (50th percentile) | 40.30 |
Left Text Column Width
Achievable Adoption
The amount of methane that could be abated from CMM varies greatly depending on global coal demand. We estimate an achievable adoption range of 2.83–4.40 Mt/yr of methane abated.The Achievable – Low value aligns with the IEA (2023c) Announced Pledges scenario, in which all announced climate policies are met and full methane abatement is employed, but net-zero emissions are not achieved. This range of high and low values was determined by taking the total methane abated in these scenarios and dividing by the difference between the target year and 2024 to determine an average amount of methane abated each year to reach the scenario target.
The Achievable – High value aligns with Ocko et al.(2021), where all economically and technically feasible methane abatement is employed by 2030. DeFabrizio et al. (2021) estimated that the degasification of underground mines and flaring would be the source of most methane abatement from coal mining, with degasification of surface mines abating a smaller proportion of methane over time. However, research from Kholod et al. (2020) suggested there will be an increase in AMM emissions as coal mines are closed. Methane emissions from AMM are not extensively monitored right now, and there is limited research on the topic. Methane abatement strategies will be needed to abate growing AMM emissions (Zhu et al, 2023).
In addition, some research suggested CMM is being underestimated, with global emissions being as high as 67 Mt/yr (Assan & Whittle, 2023). If coal demand drops by 90%, as outlined in IEA’s Net Zero Emissions scenario, total coal methane emissions would decline to 3 Mt/yr, and the use of methane abatement would reduce emissions by 2 Mt/yr, leaving only 1 Mt/yr of CMM emitted in 2050.
With growing interest and investment from governments and academia in identifying methane leaks using technologies such as satellite sensing (MethaneSAT, 2024), the opportunities for methane abatement will increase. Over 150 countries have joined the Global Methane Pledge (representing 50% of the world’s human-caused methane) to reduce methane emissions by 30% of 2020 emissions by 2030 (UNEP, 2021). The IEA (2023a) found that even in a baseline scenario, many governments have announced or put in place measures to cut methane emissions; we would expect a growing trend in global methane abatement to occur. The IEA (2024c) states that in all scenarios global coal demand will decrease. Table 6 shows the statistical low and high achievable ranges for CMM abatement based on different sources for future uptake of CMM abatement.
left_text_column_width
Table 6. Range of achievable adoption levels.
Unit: Mt/yr methane abated
| Current Adoption | 0.59 |
| Achievable – Low | 2.83 |
| Achievable – High | 4.40 |
| Adoption Ceiling | 40.30 |
Left Text Column Width
We estimate that the coal industry is currently abating approximately 0.02 Gt CO₂‑eq/yr on a 100-yr basis and 0.03 Gt CO₂‑eq/yr on a 20-yr basis using methane abatement strategies. This is about 1% of total methane emissions emitted in 2024 (IEA, 2025).
As the coal industry opens or closes coal mines due to changing coal demand, the opportunities for CMM abatement projects will change along with it. If coal demand gradually drops by 2050, more than 0.12 Gt CO₂‑eq/yr of methane could be abated. However, if coal demand drops more quickly from the implementation of energy and climate policies, the methane abatement potential would drop because the coal sector is producing less methane. This is projected in the different energy scenarios modeled by the IEA (2023c). The range between the current CMM abatement and the adoption ceiling is shown in Table 7.
left_text_column_width
Table 7. Climate impact at different levels of adoption.
Unit: Gt CO₂‑eq/yr, 100-yr basis
| Current Adoption | 0.02 |
| Achievable – Low | 0.08 |
| Achievable – High | 0.12 |
| Adoption Ceiling | 1.12 |
Left Text Column Width
Additional Benefits
Air Quality & Health
Around 10% of anthropogenic methane comes from coal mines (IEA, 2024a). Methane released from coal mines contributes to ground-level ozone pollution, which can harm lung function, exacerbating conditions like asthma, bronchitis, and emphysema, and can contribute to premature mortality (Mar et al., 2022). Domingo et al. (2024) estimated that ground-level ozone accounted for about 6,600 excess deaths per year in about 400 cities globally.
Methane released from coal mines also endangers workers’ safety in the mines, increasing the possibility of explosions, which are a significant source of fatalities and injuries (CDC, 2024). In the United States, from 2006 to 2011, mine explosions were responsible for about 25% of fatalities in the mining industry (CDC, 2024). While advances in methane mitigation technologies can prevent explosions and fatalities, mines across LMICs usually do not have methane mitigation protocols in place. Installing methane abatement strategies can potentially protect workers from such explosions (Tate, 2022).
Food Security
Methane reacts with chemicals like VOCs to form tropospheric, or ground-level ozone (Fiore et al., 2002). Ground-level ozone has been linked to reduced crop growth and yields (Mills et al., 2018; Samperdo et al., 2023; Tai et al., 2021). Mitigating methane emissions from coal mines could improve food security by reducing ground-level ozone and its harmful impacts on agricultural productivity (Tai et al., 2014; Ramya et al., 2023)
left_text_column_width
Risks
CMM abatement strategies could be implemented on a voluntary basis due to favorable natural gas prices, but if natural gas prices drop there is less economic incentive to abate methane (IEA, 2021). Without policy support enforcing methane abatement, emissions could continue, especially from VAM and AMM, which are more difficult to capture and use. Ensuring long-term monitoring and abatement of CMM can be challenging if coal mines are abandoned due to owners going bankrupt, leaving environmental damages unpaid for and remediation up to nearby communities or taxpayers (Ward et al., 2023).
left_text_column_width
Interactions with Other Solutions
Reinforcing
Managing coal methane can have a positive impact on other solutions that reduce methane release to the atmosphere. The use of technologies such as degasification systems, methane destruction, and Leak Detection and Repair (LDAR) in the coal mine sector can demonstrate the effectiveness and economic case for employing methane abatement. This would build momentum for the widespread adoption of methane abatement because successes in the coal sector can be leveraged and applied to other sectors. In addition, LDAR is a key part in identifying where we can abate methane emissions and lessons learned from the coal sector can be applied to other sites, as well as identifying methane leaks in general.
left_text_column_width
Competing
CMM management interacts negatively with solutions that provide clean electricity as this solution captures methane that can be used as an energy source, prolonging the use of natural gas infrastructure and reducing the cost of methane as a fuel source.
left_text_column_width
Dashboard
Solution Basics
1 Mt of methane abated
t CO₂-eq/unit
2.79×10⁷
units/yr
Current
0.592.834.4
Achievable (Low to High)
Climate Impact
Gt CO₂-eq/yr
Current 0.02
0.080.12
US$ per t CO₂-eq
-3
Emergency Brake
CH₄
Trade-offs
Methane abatement strategies are a powerful tool to reduce methane emissions; however, providing a secondary source of revenue for coal mining could increase the profitability and longevity of some coal mines. A broad strategy to reduce reliance on coal as an energy resource is needed to reduce the amount of CMM generated. Even with methane abatement strategies in place, methane used as a fuel or destroyed through flaring will still emit GHGs and contribute to global climate change.
left_text_column_width
Mt CO2–eq
< 1
1–3
3–5
5–7
7–9
> 9
Annual emissions from coal mine sources, 2024
Globally, coal mines are responsible for 40 of the 347 Mt of anthropogenic methane emissions in 2023. This is equivalent to 1,080 Mt CO2–eq based on a 100-year time scale. Methane emissions occur throughout the life of a coal mine and can continue after mines are closed or abandoned.
Lewis, C., Tate, R.D., and Mei, D.L. (2024). Fuel operations sector: Coal mining emissions methodology [Data set]. WattTime and Global Energy Monitor, Climate TRACE Emissions Inventory. Retrieved April 18, 2025, from https://climatetrace.org
International Energy Agency. (2024). Methane tracker: Data tools. https://www.iea.org/data-and-statistics/data-tools/methane-tracker
Geographic Guidance Introduction
Coal mine methane abatement is applicable in any area with coal mines. While China and the United States are the largest coal producers, Russia, Ukraine, Kazakhstan, and India also generated more than 10 Mt CO₂-eq (100–yr) from coal mines in 2015 (GMI, 2015).
Levels of methane emissions from coal mines can vary geographically. The greatest abatement potential is in China, Kazakhstan, Australia, and several countries in Eastern Europe and Africa (Shindell et al., 2024). However, methane abatement is recommended for all coal mining activities, and high-income countries are in a position to share supportive technologies and practices for coal mine methane abatement with other coal-producing countries to reduce methane emissions from active and abandoned or closed mines.
Action Word
Manage
Solution Title
Coal Mine Methane
Classification
Highly Recommended
Lawmakers and Policymakers
- Create policies based on global best practices, such as the IEA’s roadmap to implementing CMM regulations.
- Require all coal mines to measure and report on methane emissions.
- Invest in monitoring, reporting, and verification technologies, such as satellites, and support low-income countries in monitoring emissions.
- Provide financial incentives, such as reduced taxes, subsidies, grants, low-interest loans, and feed-in tariffs, for adopting drainage and capture technologies suitable for the region.
- Require closed and abandoned mines to be sealed and monitored.
- Compile or update global inventories of the status of abandoned and closed mines.
- When possible, do not approve the construction of new coal mines.
- Require low-emitting technologies for equipment, coal processing, storage, and transportation.
- Develop infrastructure to use captured CMM, including gas processing, grid connections, and industry capacity.
- Establish clear resource rights to methane emitted from active and abandoned mines.
- Include CMM recovery in Nationally Determined Contributions and other international reporting instruments.
- Provide educational resources to industry leaders, including potential reduction options, workshops, actionable reports, direct engagements, and demonstrations.
- Join, support, or create public initiatives such as the Global Methane Initiative, Global Methane Pledge, or Global Methane Hub.
Further information:
- Driving down coal mine methane emissions: A regulatory roadmap and toolkit. IEA (n.d.)
- Best practice guidance for effective methane recovery and use from abandoned coal mines. United Nations Economic Commission for Europe (2019)
- Best practice guidance for effective management of coal mine methane at national level: Monitoring, reporting, verification and mitigation. UN Economic Commission for Europe (2021)
- Actions for scaling up mitigation of methane emissions from coal mines. Global Methane Initiative (2024)
- Addressing top barriers to development of coal mine methane projects: Concrete ideas from expert brainstorming, Global Methane Initiative (2023)
- A strategic approach to selecting policy mechanisms for addressing coal mine methane emissions: A case study on Kazakhstan. Roshchanka et al. (2017)
- International coal mine methane project list. Global Methane Initiative (2024)
- Strategies to reduce emissions from coal supply. International Energy Agency (2023)
- Methane tracking technologies study. Environmental Defense Fund. (2023)
- Global methane hub. (n.d.)
- Global methane pledge. (n.d.)
- Government relations and public policy job function action guide. Project Drawdown (2022)
- Legal job function action guide. Project Drawdown (2022)
Practitioners
- Utilize or destroy CMM to the maximum extent.
- Work with policymakers to create policies based on global best practices, such as the IEA’s roadmap to implementing CMM regulations.
- Measure and report on methane emissions.
- Invest in monitoring, reporting, and verification technologies, such as satellites, and support low-income countries to monitor emissions.
- Take advantage of any financial incentives, such as reduced taxes, subsidies, grants, low-interest loans, and feed-in tariffs, to adopt drainage and capture technologies suitable for the region.
- Ensure abandoned and closed mines are sealed and monitored.
- Compile or update global inventories of the status of abandoned and closed mines.
- When possible, do not approve the construction of new coal mines.
- Develop infrastructure to use captured CMM, including gas processing, grid connections, and industry capacity.
- Assist policymakers in establishing clear resource rights to methane emitted from active and abandoned mines.
- Use existing drainage systems for gas capture, utilization, and sale.
- Improve technologies, such as thermal oxidizers, for the purposes of VAM destruction.
- Partner with carbon markets that are linked to CMM abatement.
- Improve CMM emissions modeling and monitoring, including satellites and on-the-ground methods.
- Invest in R&D to improve extraction, capture, storage, transportation, and utilization technologies.
- Join, support, or create public initiatives such as the Global Methane Initiative, Global Methane Pledge, or Global Methane Hub.
- Utilize educational resources to industry leaders, including potential reduction options, workshops, actionable reports, direct engagements, and demonstrations.
Further information:
- Actions for scaling up mitigation of methane emissions from coal mines. Global Methane Initiative (2024)
- Addressing top barriers to development of coal mine methane projects: Concrete ideas from expert brainstorming. Global Methane Initiative (2023)
- Driving down coal mine methane emissions: A regulatory roadmap and toolkit. IEA (n.d.)
- Best practice guidance for effective methane recovery and use from abandoned coal mines. United Nations Economic Commission for Europe (2019)
- Abandoned coal mine methane reduction. Zhu et al. (2023)
- Best practice guidance for effective management of coal mine methane at national level: Monitoring, reporting, verification and mitigation. UN Economic Commission for Europe (2021)
- A strategic approach to selecting policy mechanisms for addressing coal mine methane emissions: A case study on Kazakhstan. Roshchanka et al. (2017)
- Effective monitoring, reporting and verification of methane emissions in the coal industry and the linkage to methane mitigation. Roshchanka et al. (2022)
- Curbing methane emissions: How five industries can counter a major climate threat. DeFabrizio et al. (2021)
- International coal mine methane project list. Global Methane Initiative (2024)
- Strategies to reduce emissions from coal supply. International Energy Agency (2023)
- Methane tracking technologies study. Environmental Defense Fund. (2023)
- Global methane hub. (n.d.)
- Global methane pledge. (n.d.)
Business Leaders
- Ensure that operations or investments that include coal mines utilize or destroy methane emissions.
- Do not invest, plan to use, or create agreements with new coal mines.
- Invest in high-integrity carbon markets that are linked to CMM abatement.
- Invest in R&D to improve the efficiency of extraction, capture, storage, transportation, and utilization technologies.
- Develop infrastructure to use captured CMM, including gas processing, grid connections, and industry capacity.
- Utilize existing data sets such as the UN’s International Methane Emissions Observatory to inform current and future decisions.
- Join, support, or create public initiatives such as the Global Methane Initiative, Global Methane Pledge, or Global Methane Hub.
Further information:
- Curbing methane emissions: How five industries can counter a major climate threat. DeFabrizio et al. (2021)
- Actions for scaling up mitigation of methane emissions from coal mines. Global Methane Initiative (2024)
- Addressing top barriers to development of coal mine methane projects: Concrete ideas from expert brainstorming. Global Methane Initiative (2023)
- International coal mine methane project list. Global Methane Initiative (2024)
- Strategies to reduce emissions from coal supply. International Energy Agency (2023)
- Methane tracking technologies study. Environmental Defense Fund. (2023)
- Global methane hub. (n.d.)
- Global methane pledge. (n.d.)
- Climate solutions at work. Project Drawdown (2021)
- Drawdown-aligned business framework. Project Drawdown (2021)
Nonprofit Leaders
- Advocate for regulating CMM emissions and local policies based on global best practices, such as the IEA’s roadmap to implementing CMM regulations.
- Assist coal mines in measuring and reporting or conducting independent studies on CMM emissions.
- Advocate for financial incentives, such as reduced taxes, subsidies, grants, low-interest loans, and feed-in tariffs, for the adoption of drainage and capture technologies suitable for the region.
- Advocate to stop the construction of new coal mines.
- Compile or update global inventories of the status of abandoned and closed mines.
- Help create high-integrity carbon markets that are linked to CMM abatement.
- Provide educational resources to industry leaders, including potential reduction options, workshops, actionable reports, direct engagements, and demonstrations.
- Join, support, or create public initiatives such as the Global Methane Initiative, Global Methane Pledge, or Global Methane Hub.
Further information:
- Driving down coal mine methane emissions: A regulatory roadmap and toolkit. IEA (n.d.)
- Best practice guidance for effective methane recovery and use from abandoned coal mines. United Nations Economic Commission for Europe (2019)
- Abandoned coal mine methane reduction. Zhu et al. (2023)
- Best practice guidance for effective management of coal mine methane at national level: Monitoring, reporting, verification and mitigation. UN Economic Commission for Europe (2021)
- Actions for scaling up mitigation of methane emissions from coal mines. Global Methane Initiative (2024)
- Addressing top barriers to development of coal mine methane projects: Concrete ideas from expert brainstorming. Global Methane Initiative (2023)
- A strategic approach to selecting policy mechanisms for addressing coal mine methane emissions: A case study on Kazakhstan. Roshchanka et al. (2017)
- Effective monitoring, reporting and verification of methane emissions in the coal industry and the linkage to methane mitigation. Roshchanka et al. (2022)
- Curbing methane emissions: How five industries can counter a major climate threat. DeFabrizio et al. (2021)
- International coal mine methane project list. Global Methane Initiative (2024)
- Strategies to reduce emissions from coal supply. International Energy Agency (2023)
- Methane tracking technologies study. Environmental Defense Fund. (2023)
- Global methane hub. (n.d.)
- Global methane pledge. (n.d.)
Investors
- Invest in monitoring, reporting, and verification technologies, such as satellites, and support low-income countries to monitor emissions.
- Provide financial support through low-interest loans or green bonds to adopt drainage and capture technologies suitable for the region.
- Do not invest in constructing new coal mines and require any existing investments to provide transparent emissions data and time-based reduction strategies.
- Invest in R&D to improve the efficiency of extraction, capture, storage, transportation, and utilization technologies.
- Develop infrastructure to use captured CMM, including gas processing, grid connections, and industry capacity.
- Invest in high-integrity carbon markets that are linked to CMM abatement.
- Join, support, or create public initiatives such as the Global Methane Initiative, Global Methane Pledge, or Global Methane Hub.
Further information:
- Curbing methane emissions: How five industries can counter a major climate threat. DeFabrizio et al. (2021)
- Actions for scaling up mitigation of methane emissions from coal mines. Global Methane Initiative (2024)
- Addressing top barriers to development of coal mine methane projects: Concrete ideas from expert brainstorming. Global Methane Initiative (2023)
- International coal mine methane project list. Global Methane Initiative (2024)
- Strategies to reduce emissions from coal supply. International Energy Agency (2023)
- Methane tracking technologies study. Environmental Defense Fund. (2023)
- Global methane hub. (n.d.)
- Global methane pledge. (n.d.)
Philanthropists and International Aid Agencies
- Invest in monitoring, reporting, and verification technologies, such as satellites, and support low-income countries to monitor emissions.
- Provide financial support to adopt drainage and capture technologies suitable for the region.
- Invest in R&D to improve the efficiency of extraction, capture, storage, transportation, and utilization technologies.
- Assist in establishing clear resource rights to methane emitted from active and abandoned mines.
- Help create high-integrity carbon markets that are linked to CMM abatement.
- Join, support, or create public initiatives such as the Global Methane Initiative, Global Methane Pledge, or Global Methane Hub.
- Provide educational resources to industry leaders, including potential reduction options, workshops, actionable reports, direct engagements, and demonstrations.
- Advocate for regulating CMM emissions and local policies based on global best practices, such as the IEA’s roadmap to implementing CMM regulations.
- Compile or update global inventories of the status of abandoned and closed mines.
Further information:
- Driving down coal mine methane emissions: A regulatory roadmap and toolkit. IEA (n.d.)
- Best practice guidance for effective methane recovery and use from abandoned coal mines. United Nations Economic Commission for Europe (2019)
- Abandoned coal mine methane reduction. Zhu et al. (2023)
- Best practice guidance for effective management of coal mine methane at national level: Monitoring, reporting, verification and mitigation. UN Economic Commission for Europe (2021)
- Actions for scaling up mitigation of methane emissions from coal mines. Global Methane Initiative (2024)
- Addressing top barriers to development of coal mine methane projects: Concrete ideas from expert brainstorming. Global Methane Initiative (2023)
- A strategic approach to selecting policy mechanisms for addressing coal mine methane emissions: A case study on Kazakhstan. Roshchanka et al. (2017)
- Effective monitoring, reporting and verification of methane emissions in the coal industry and the linkage to methane mitigation. Roshchanka et al. (2022)
- Curbing methane emissions: How five industries can counter a major climate threat. DeFabrizio et al. (2021)
- International coal mine methane project list. Global Methane Initiative (2024)
- Strategies to reduce emissions from coal supply. International Energy Agency (2023)
- Methane tracking technologies study. Environmental Defense Fund. (2023)
- Global methane hub. (n.d.)
- Global methane pledge. (n.d.)
Thought Leaders
- Advocate for regulating CMM emissions and local policies based on global best practices, such as the IEA’s roadmap to implementing CMM regulations.
- Assist coal mines in measuring and reporting or conducting independent studies on CMM emissions.
- Advocate for financial incentives, such as reduced taxes, subsidies, grants, low-interest loans, and feed-in tariffs, for adopting drainage and capture technologies suitable for the region.
- Assist in establishing clear resource rights to methane emitted from active and abandoned mines.
- Advocate to stop the construction of new coal mines.
- Compile or update global inventories of the status of abandoned and closed mines.
- Help create high-integrity carbon markets that are linked to CMM abatement.
- Provide educational resources to industry leaders, including potential reduction options, workshops, actionable reports, direct engagements, and demonstrations.
- Join, support, or create public initiatives such as the Global Methane Initiative, Global Methane Pledge, or Global Methane Hub.
Further information:
- Driving down coal mine methane emissions: A regulatory roadmap and toolkit. IEA (n.d.)
- Best practice guidance for effective methane recovery and use from abandoned coal mines. United Nations Economic Commission for Europe (2019)
- Abandoned coal mine methane reduction. Zhu et al. (2023)
- Best practice guidance for effective management of coal mine methane at national level: Monitoring, reporting, verification and mitigation. UN Economic Commission for Europe (2021)
- Actions for scaling up mitigation of methane emissions from coal mines. Global Methane Initiative (2024)
- Addressing top barriers to development of coal mine methane projects: Concrete ideas from expert brainstorming. Global Methane Initiative (2023)
- A strategic approach to selecting policy mechanisms for addressing coal mine methane emissions: A case study on Kazakhstan. Roshchanka et al. (2017)
- Effective monitoring, reporting and verification of methane emissions in the coal industry and the linkage to methane mitigation. Roshchanka et al. (2022)
- Curbing methane emissions: How five industries can counter a major climate threat. DeFabrizio et al. (2021)
- International coal mine methane project list. Global Methane Initiative (2024)
- Strategies to reduce emissions from coal supply. International Energy Agency (2023)
- Methane tracking technologies study. Environmental Defense Fund. (2023)
- Global methane hub. (n.d.)
- Global methane pledge. (n.d.)
Technologists and Researchers
- Improve CMM emissions modeling and monitoring, including satellites and on-the-ground methods.
- Compile or update global inventories of the status of abandoned and closed mines.
- Develop infrastructure to use captured CMM, including gas processing, grid connections, and industry capacity.
- Discover ways to utilize existing drainage systems for gas capture, utilization, and sale.
- Improve technologies, such as thermal oxidizers, for the purposes of VAM destruction.
- Develop new ways to improve extraction, capture, storage, transportation, and utilization technologies.
- Develop verifiable carbon credits using technology such as blockchain to improve the integrity of carbon markets.
- Improve the efficiency of mining equipment to reduce maintenance requirements and costs.
Further information:
- Best practice guidance for effective methane recovery and use from abandoned coal mines. United Nations Economic Commission for Europe (2019)
- Abandoned coal mine methane reduction. Zhu et al. (2023)
- Best practice guidance for effective management of coal mine methane at national level: Monitoring, reporting, verification and mitigation. UN Economic Commission for Europe (2021)
- Actions for scaling up mitigation of methane emissions from coal mines. Global Methane Initiative (2024)
- Addressing top barriers to development of coal mine methane projects: Concrete ideas from expert brainstorming, Global Methane Initiative (2023)
- Effective monitoring, reporting and verification of methane emissions in the coal industry and the linkage to methane mitigation. Roshchanka et al. (2022)
- Curbing methane emissions: How five industries can counter a major climate threat. DeFabrizio et al. (2021)
- International coal mine methane project list. Global Methane Initiative (2024)
- Strategies to reduce emissions from coal supply. International Energy Agency (2023)
- Methane tracking technologies study. Environmental Defense Fund. (2023)
- Global methane hub. (n.d.)
- Global methane pledge. (n.d.)
Communities, Households, and Individuals
- Advocate for regulating CMM emissions and local policies based on global best practices, such as the IEA’s roadmap to implementing CMM regulations.
- Advocate for financial incentives, such as reduced taxes, subsidies, grants, low-interest loans, and feed-in tariffs, for the adoption of drainage and capture technologies suitable for the region.
- Advocate to stop the construction of new coal mines.
- Assist coal mines in measuring and reporting or conducting independent studies on CMM emissions.
- Provide educational resources to industry leaders, including potential reduction options, workshops, actionable reports, direct engagements, and demonstrations.
- Join, support, or create public initiatives such as the Global Methane Initiative, Global Methane Pledge, or Global Methane Hub.
Further information:
- Driving down coal mine methane emissions: A regulatory roadmap and toolkit. IEA (n.d.)
- Best practice guidance for effective methane recovery and use from abandoned coal mines. United Nations Economic Commission for Europe (2019)
- Abandoned coal mine methane reduction. Zhu et al. (2023)
- Actions for scaling up mitigation of methane emissions from coal mines. Global Methane Initiative (2024)
- Addressing top barriers to development of coal mine methane projects: Concrete ideas from expert brainstorming. Global Methane Initiative (2023)
- Effective monitoring, reporting and verification of methane emissions in the coal industry and the linkage to methane mitigation. Roshchanka et al. (2022)
- Curbing methane emissions: How five industries can counter a major climate threat. DeFabrizio et al. (2021)
- International coal mine methane project list. Global Methane Initiative (2024)
- Methane tracking technologies study. Environmental Defense Fund. (2023)
- Global methane hub. (n.d.)
- Global methane pledge. (n.d.)
Evidence Base
Consensus of effectiveness of abating methane emissions from coal mines: High
There is a high level of consensus about the effectiveness of methane abatement strategies. These strategies can be deployed cost effectively in many cases and have an immediate impact on reducing global temperature rise.
Authoritative sources such as the IEA (2024c) and UNEP (2021) agree that reducing methane emissions can noticeably slow global climate change. Methane is a short-lived climate pollutant that has a much stronger warming effect than CO₂ over a given time period. IEA (2023d) identified that close to 55% (22 Mt) of CMM emissions could be abated with existing technologies. However, there are significant challenges in measuring and recovering methane emissions in the coal sector. Analysis from Assan & Whittle (2023) found that global CMM emissions could be significantly higher than reported, 38–67 Mt/yr compared with the 40 Mt/yr reported by the IEA (2025).
The IEA (2023a) noted that more than half of CMM emissions could be abated through utilization, flaring, or oxidation technologies, with abatement being more practical for underground mines. Many studies (DeFabrizio et al., 2021; Malley et al., 2023; Shindell et al., 2024) have shown that methane abatement strategies can use existing technologies, often at low cost. In some countries, coal operators already identify the location and sources of CMM to meet health and safety regulations (Assan & Whittle, 2023); Setiawan & Wright (2024) noted that existing technologies such as pre-mine drainage and VAM mitigation have been proven in various places around the world over the past 25 years. According to UNEP (2021), coal methane abatement could reduce emissions by 12–25 Mt/yr, with up to 98% of the measures implemented at low cost. However, costs may vary significantly based on the available infrastructure and characteristics of an individual coal mine.
The results presented in this document summarize findings from 21 reviews and meta-analyses and 20 original studies reflecting current evidence from three countries (Australia, China, and the United States) as well as from sources examining global CMM emissions. We recognize this limited geographic scope creates bias, and hope this work inspires research and data sharing on this topic in underrepresented regions.
left_text_column_width
Appendix
CMM abatement strategy constraints:
The type of coal mine, the amount of methane produced, and the available infrastructure greatly affect which abatement strategies are economical. Underground coal mines often produce more CMM and are likely to capture CMM using degasification systems and use it for productive purposes such as electricity generation or selling captured methane. However, VAM, which is a major part of CMM emissions, can be challenging to use for productive purposes due to the low methane concentrations. VAM requires regenerative thermal oxidation technology to effectively destroy and with more gassy coal mines. According to the IEA (2023b), technologies such as flaring and drained CMM can be used at less gassy mines with lower initial capital cost. Capturing methane for destruction has the disadvantage of not creating a source of revenue to offset the capital cost of methane abatement without a form of carbon markets in place.
More than 60% of methane-related emissions from coal mining are from the ventilation of underground coal mines. Large amounts of fresh air are used to lower the concentration of methane and reduce the risk of explosions in underground mines. This makes it challenging to destroy or use the low concentrations of VAM (UNEP, 2022). It is also challenging to capture methane from surface mines because the coal is in direct contact with the atmosphere and over a larger surface area. However, thermal oxidation systems have been used to destroy VAM (U.S. EPA, 2019) and there have been examples of degasification systems used for surface mines as well (IEA, 2023b). Methane emissions from AMM can be dealt with by flooding underground mines with water (Kholod et al., 2020) or by sealing and using capture and utilization projects (Zhu et al., 2023).
Technologies for reducing methane emissions can be divided between underground and surface coal mines:
Underground mines
- Predainage prior to mining
- VAM capture and utilization
- Capture of abandoned mine gas
- Sealing or flooding of abandoned mines
Surface mines
- Degasification of surface mines
- Predrainage of surface mines
Appendix References
CNX. (2024, March 20). Jumpstarting coal mine methane capture projects for beneficial end use [PowerPoint slides].Global Methane Initiative. https://www.globalmethane.org/resources/details.aspx?resourceid=5386
United Nations Economic Commission for Europe (UNECE). (2019). Best practice guidance for effective methane recovery and use from abandoned coal mines. https://unece.org/fileadmin/DAM/energy/images/CMM/CMM_CE/Best_Practice_Guidance_for_Effective_Methane_Recovery_and_Use_from_Abandoned_Coal_Mines_FINAL__with_covers_.pdf
left_text_column_width
Updated Date
Mobilize Electric Cars
Sector
Transportation
Mode
Cut Emissions
Image
Image

Coming Soon
Off
Summary
Electric cars are four-wheeled passenger cars that run on electricity, usually from the electricity grid and stored in onboard batteries (i.e., not including fuel cell electric cars). This definition includes electric pickup trucks, motorhomes, and other such vehicles. It does not include two-wheeled vehicles or hybrid cars (which combine an electric motor with a gasoline or diesel engine). It also does not include freight and commercial vehicles, such as electric heavy trucks, buses, and ambulances. We define Mobilizing Electric Cars as replacing fossil fuel–powered cars (i.e., those powered by internal combustion engines) with electric equivalents, as well as building out the necessary infrastructure (especially charging stations) to support them.
Overview
Electric cars provide the same functionality as fossil fuel–powered cars, but use electric motors rather than fuel-burning engines. The energy for the motors comes from an onboard battery, which is normally charged using electricity from the grid.
Electric cars have no direct tailpipe emissions, since electric motors do not burn fuel to function. The grid electricity used to charge their batteries may have come from fossil fuel-burning power plants, meaning electric cars are not entirely free of direct emissions. However, in most electrical grids, even those that mainly generate electricity from fossil fuels, electric cars usually still produce fewer emissions per pkm than fossil fuel–powered cars. This is for three reasons. First, large, fixed power plants and efficient electric grids can convert fossil fuels into useful energy more efficiently than smaller, mobile internal combustion engines in cars. In extreme cases, such as grids powered entirely by coal, this might not be the case, particularly if the grid has a lot of transmission and distribution losses. Second, the powertrain of an electric car delivers electricity from the battery to the wheels much more efficiently than the powertrain of a fossil fuel–powered car, which wastes much more energy as heat (International Transport Forum, 2020; Mofolasayo, 2023; Verma et al., 2022). Third, electric cars’ powertrains enable regenerative braking, where the kinetic energy of the car’s motion is put back into the battery when the driver brakes (Yang et al., 2024).
Electric cars reduce emissions of CO₂, methane, and nitrous oxide to the atmosphere by replacing fuel-powered cars, which emit these gases from their tailpipes.
References
APEC. (2024). Connecting Traveler Choice with Climate Outcomes: Innovative Greenhouse Gas Emissions Reduction Policies and Practices in the APEC Region through Traveler Behavioral Change. https://www.apec.org/publications/2024/09/connecting-traveler-choice-with-climate-outcomes--innovative-greenhouse-gas-emissions-reduction-policies-and-practices-in-the-apec-region-through-traveler-behavioral-change
IEA. (2024). Global EV Outlook 2024. International Energy Agency. https://www.iea.org/reports/global-ev-outlook-2024
International Council on Clean Transportation. (2024). Clearing the air: Why EVs can outperform conventional vehicles in freezing temperatures. International Council on Clean Transportation. https://theicct.org/clearing-the-air-why-evs-can-outperform-conventional-vehicles-in-freezing-temperatures-oct24/
Peters, D. R., Schnell, J. L., Kinney, P. L., Naik, V., & Horton, D. E. (2020). Public health and climate benefits and trade‐offs of U.S. vehicle electrification. GeoHealth, 4, e2020GH000275.
https://doi.org/10.1029/2020GH000275
Yoder, K. (2023, June 14). The environmental disaster lurking beneath your neighborhood gas station. Grist. https://grist.org/accountability/gas-stations-underground-storage-tank-leaks-environmental-disaster/
Credits
Lead Fellow
Cameron Roberts, Ph.D.
Contributors
Ruthie Burrows, Ph.D.
James Gerber, Ph.D.
Daniel Jasper
Heather Jones, Ph.D.
Heather McDiarmid, Ph.D.
Alex Sweeney
Internal Reviewers
Aiyana Bodi
James Gerber, Ph.D.
Hannah Henkin
Jason Lam
Ted Otte
- Amanda Smith, Ph.D.
Effectiveness
Every million pkm shifted from fossil fuel–powered cars to electric cars reduces 48.52 t CO₂‑eq on a 100-yr basis (Table 1), or 49.13 t CO₂‑eq on a 20-yr basis.
We found this by collecting data on electricity consumption for a range of electric car models (Electric Vehicle Database, 2024) and multiplying it by the global average emissions per kWh of electricity generation. Fossil fuel–powered cars emit 115.3 t CO₂‑eq/pkm on a 100-yr basis (116.4 t CO₂‑eq/pkm on a 20-yr basis). Electric cars already have lower emissions in countries with large shares of renewable, nuclear, or hydropower generation in their electricity grids (International Transport Forum, 2020; Verma et al., 2022).
These data come disproportionately from North America and Europe, and, notably, leave out China, which has made major progress on electric cars in recent years and has many of its own makes and models.
Electric cars today are disproportionately used in high- and upper-middle-income countries, whose electricity grids emit fewer GHG emissions than the global average per unit of electricity generated (IEA, 2024). Electric cars in use today reduce more emissions on average than the figure we have calculated.
Electric cars have higher embodied emissions than fossil fuel–powered cars, due to the GHG-intensive process of manufacturing batteries. This gives them a carbon payback period which ranges from zero to over 10 years (Dillman et al., 2020; Ren et al., 2023).
left_text_column_width
Table 1. Effectiveness at reducing emissions.
Unit: t CO₂‑eq/million pkm
| 25th percentile | 38.95 |
| mean | 49.54 |
| median (50th percentile) | 48.52 |
| 75th percentile | 62.82 |
Shifted from fossil fuel–powered cars to electric cars, 100-yr basis.
Left Text Column Width
Cost
Including purchase price, financing, fuel and electricity costs, maintenance costs, and insurance, electric cars cost on average US$0.05 less per pkm (US$49,442.19/million pkm) than fuel-powered cars. This is based on a population-weighted average of the cost differential between electric and fossil fuel–powered cars in seven countries: Japan, South Korea, China, the United States, France, Germany, and the United Kingdom (Nickel Institute, 2021b, 2021c, 2021a).
While this analysis found that electric cars are less expensive than fossil fuel–powered cars almost everywhere, the margin is often quite small. The difference is less than US$0.01/pkm (US$10,000/million pkm) in South Korea, the United States, and Germany. In some markets, electric cars are more expensive per pkm than fossil fuel–powered cars (IEA, 2022).
This amounts to savings of US$1,019/t CO₂‑eq on a 100-yr basis (Table 2), or US$1,006/t CO₂‑eq avoided emissions on a 20-yr basis).
Our analysis does not include costs that are the same for both electric and fossil fuel–powered cars, including taxes, insurance costs, and public costs of building road infrastructure.
left_text_column_width
Table 2. Cost per unit climate impact.
Unit: 2023 US$/t CO₂‑eq, 100-yr basis
| median | -1,019 |
Left Text Column Width
Learning Curve
For every doubling in electric car production, costs decline by approximately 23% (Table 3; Goetzel & Hasanuzzaman, 2022; Kittner et al., 2020; Weiss et al., 2015).
In addition to manufacturing improvements and economies of scale, this reflects rapid technological advancements in battery production, which is a significant cost component of an electric powertrain (Weiss et al., 2015).
left_text_column_width
Table 3. Learning rate: drop in cost per doubling of the installed solution base.
Unit: %
| 25th percentile | 23.00 |
| mean | 22.84 |
| median (50th percentile) | 23.00 |
| 75th percentile | 24.00 |
Left Text Column Width
Speed of Action
Speed of action refers to how quickly a climate solution physically affects the atmosphere after it is deployed. This is different from speed of deployment, which is the pace at which solutions are adopted.
At Project Drawdown, we define the speed of action for each climate solution as gradual, emergency brake, or delayed.
Mobilize Electric Cars is a GRADUAL climate solution. It has a steady, linear impact on the atmosphere. The cumulative effect over time builds as a straight line.
left_text_column_width
Caveats
The effectiveness of electric cars in mitigating GHG emissions is critically dependent on the emissions associated with electricity production. In electricity grids dominated by fossil fuels, electric cars have far higher emissions than in jurisdictions with low-emission electricity generation (International Transport Forum, 2020; IPCC, 2022; Milovanoff et al., 2020).
Electric car adoption faces a major obstacle in the form of constraints on battery production. While electric car battery production is being aggressively upscaled (IEA, 2024), building enough batteries to replace a significant fraction of fossil fuel–powered cars is an enormous challenge and will likely slow down a transition to electric cars, even if there is very high consumer demand (Milovanoff et al., 2020).
left_text_column_width
Current Adoption
Approximately 28 million electric cars are in use worldwide (IEA, 2024). This corresponds to about 819,000 million pkm traveled by electric car worldwide each year (Table 4). We assume that all of this travel would be undertaken by a fossil fuel–powered car if the car’s occupants did not use an electric car. Adoption is much higher in some countries, such as Norway, where the share of electric cars was 29% in 2023.
To convert the IEA’s electric car estimates into pkm traveled, we needed to determine the average passenger-distance that each passenger car travels per year. Using population-weighted data from several different countries, the average car carries 1.5 people and travels an average of 29,250 pkm/yr. Multiplying this number by the number of electric cars in use gives the total travel distance shift from fossil fuel–powered cars to electric cars.
left_text_column_width
Table 4. Current (2024) adoption level.
Unit: million pkm/yr
| Population-weighted mean | 818,900 |
Implied travel shift from fossil fuel-powered cars to electric cars.
Left Text Column Width
Adoption Trend
Globally, about 104 billion pkm are displaced from fossil fuel–powered cars by electric cars every year (Table 5). The number of new electric cars purchased each year is growing at an average rate of over 10% (Bloomberg New Energy Finance, 2024; IEA, 2024), although purchase rates have declined slightly from record highs between 2020–2022. Global purchases of electric cars are still increasing by around 3.6 million cars/yr. This is based on globally representative data (Bloomberg New Energy Finance, 2024; IEA, 2024).
Despite this impressive rate of growth, electric cars still have a long way to go before they replace a large percentage of the more than 2 billion cars currently driven (WHO, 2024).
left_text_column_width
Table 5. 2023-2024 adoption trend.
Unit: million pkm/yr
| Median, or population-weighted mean | 104,000 |
Implied travel shift from fossil fuel-powered cars to electric cars.
Left Text Column Width
Adoption Ceiling
The adoption ceiling for electric cars is equal to the total passenger-distance driven by the more than 2 billion cars worldwide (WHO, 2024). Using a population-weighted mean of the average distance (in pkm) traveled per car annually, this translates to about 59 trillion pkm (Table 6).
Replacing every single fossil fuel–powered car with an electric car would require an enormous upscaling of electric car production capacity, rapid development of charging infrastructure, cost reductions to increase affordability, and technological improvements to improve suitability for more kinds of drivers and trips. It would also face cultural obstacles from drivers who are attached to fossil fuel–powered cars (Roberts, 2022).
left_text_column_width
Table 6. Adoption ceiling.
Unit: million pkm/yr
| Median, or population-weighted mean | 59,140,000 |
Implied travel shift from fossil fuel-powered cars to electric cars.
Left Text Column Width
Achievable Adoption
The achievable adoption of electric car travel ranges from about 26–47 trillion pkm displaced from fossil fuel–powered cars (Table 7).
Various organizations have produced forecasts for electric car adoption. These are not assessments of feasible adoption per se; they are instead trying to predict likely rates of adoption, given various assumptions about the future (Bloomberg New Energy Finance, 2024; IEA, 2024). However, they are useful in that they take a large number of different variables into account to make their estimates. To convert these estimates of future likely adoption into estimates of the achievable adoption range, we apply some assumptions to the numbers in the scenario projections.
To find a high rate of electric car adoption, we assume that every country could reach the highest rate of adoption projected to occur for any country. Bloomberg New Energy Finance’s (2024) Economic Transition scenario predicts that Norway will reach an 80% electric vehicle stock share by 2040. We therefore set our high adoption rate at 80% worldwide. This corresponds to 1,617 million total electric cars in use, or 47 trillion pkm traveled by electric car. An important caveat is that with a global supply constraint in the production of electric car batteries, per-country adoption rates are somewhat zero-sum. Every electric car purchased in Norway is one that cannot be purchased elsewhere. Therefore, for the whole world to achieve an 80% electric car stock share, global electric car and battery production would have to increase radically. While this might be possible due to technological improvements or radical increases in investment, it should not be taken for granted.
To identify a lower feasible rate of electric car adoption, we simply take the highest estimate for global electric car adoption. Bloomberg’s Economic Transition scenario predicts 44% global electric car adoption by 2050. This corresponds to 890 million electric cars, or 26 trillion pkm.
left_text_column_width
Table 7. Range of achievable adoption levels.
Unit: million pkm/yr.
| Current Adoption | 818,900 |
| Achievable – Low | 26,020,000 |
| Achievable – High | 47,310,000 |
| Adoption ceiling (physical limit) | 59,140,000 |
Left Text Column Width
Electric cars are currently displacing 0.040 Gt CO₂‑eq of GHG emissions from the transportation system on a 20-yr basis (Table 8), or 0.040 Gt CO₂‑eq on a 100-yr basis.
If electric cars reach 44% of the global car stock share by 2040, as Bloomberg (2024) projects, without any change in the total number of cars on the road, they will displace 1.263 Gt CO₂‑eq GHG emissions on a 100-yr basis (1.279 Gt CO₂‑eq on a 20-yr basis).
If electric cars globally reach 80% of car stock share, as Bloomberg projects might happen in Norway by 2040, they will displace 2.296 Gt CO₂‑eq GHG emissions on a 100-yr basis (2.325 Gt CO₂‑eq on a 20-yr basis).
If electric cars replace 100% of the global car fleet, they will displace 2.870 Gt CO₂‑eq GHG emissions on a 100-yr basis (2.906 Gt CO₂‑eq on a 20-yr basis).
These numbers are based on the present-day average emissions intensity from electrical grids in countries with high rates of electric car adoption. If more clean energy is deployed on electricity grids, the total climate impact from electric cars will increase considerably.
left_text_column_width
Table 8. Climate impact at different levels of adoption.
Unit: Gt CO₂‑eq/yr, 100-yr basis
| Current Adoption | 0.040 |
| Achievable – Low | 1.263 |
| Achievable – High | 2.296 |
| Adoption ceiling (physical limit) | 2.870 |
Left Text Column Width
Additional Benefits
Air Quality
The adoption of electric cars reduces emissions of air pollutants, including sulfur oxides, sulfur dioxide, and nitrous oxides, and especially carbon monoxide and volatile organic compounds. It has a smaller impact on particulate emissions (Requia et al., 2018). Some air pollution reductions are limited (particularly PM and ozone) due to heavier electric cars and pollution from brakes, tires, and wear on the batteries (Carey, 2023; Jones, 2019).
Water Quality
Substituting electric car charging points for gas stations can eliminate soil and water pollution from leaking underground gas tanks (Yoder, 2023).
Health
Since electric cars do not have tailpipe emissions, they can mitigate traffic-related air pollution, which is associated with asthma, lung cancer, increased emergency department visits for respiratory disease, and increased mortality (Anenberg et al., 2019; Guarnieri & Balmes, 2014; Pan et al., 2023; Pennington et al., 2024; Requia et al., 2018; Szyszkowicz et al., 2018). Transitioning to electric cars can reduce exposure to air pollution, improve health, and prevent premature mortality (Garcia et al., 2023; Larson et al., 2021; Peters et al., 2020).
The health benefits of adopting electric cars vary spatially and partly depend upon how communities generate electricity (Choma et al., 2020), but there is evidence that they have improved health. A study in California found a reduction in emergency department visits in ZIP codes with an increase in zero-emissions cars (Garcia et al., 2023). By 2050, projections estimate that about 64,000–167,000 deaths could be avoided by adopting electric cars (Larson et al., 2021).
Communities rich in racial and ethnic minorities tend to be located near highways and major traffic corridors and so are disproportionately exposed to air pollution (Kerr et al., 2021). Transitioning to electric cars could improve health in marginalized urban neighborhoods that are located near highways, industry, or ports (Pennington et al., 2024). These benefits depend upon an equitable distribution of electric cars and infrastructure to support the adoption of electric cars (Garcia et al., 2023). Low-income households may not see the same savings from an electric car due to the cost and stability of electricity prices and distance to essential services (Vega-Perkins et al., 2023)
Income & Work
Adopting electric cars can reduce a household’s energy burden, or the proportion of income spent on residential energy (Vega-Perkins et al., 2023). About 90% of United States households that use a car could see a reduction in energy burden by transitioning to an electric car. Money spent to charge electric cars is more likely to stay closer to the local community where electricity is generated, whereas money spent on fossil fuels often benefits oil-producing regions. This benefits local and national economies by improving their trade balance (Melaina et al., 2016).
left_text_column_width
Risks
Mining minerals necessary to produce electric car batteries carries environmental and social risks. This has been associated with significant harms, particularly in lower-income countries that supply many of these minerals (Agusdinata et al., 2018; Sovacool, 2019).
Electric cars might also pose additional safety risks due to their higher weight, which means they have longer stopping distances and can cause more significant damage in collisions and to pedestrians and cyclists (Jones, 2019). This risk includes dual-motor electric cars that incorporate two electric motors – one for the front axle and one for the rear – providing all-wheel drive (AWD) capabilities. The addition of a second motor increases the vehicle's weight and complexity, which can lead to higher energy consumption and reduced overall efficiency. Moreover, the increased manufacturing costs associated with dual-motor systems can result in higher purchase prices for consumers (Nguyen et al., 2023). However, this configuration enhances vehicle performance, offering improved acceleration, traction, and handling, particularly in adverse weather conditions which are valued by some consumers.
left_text_column_width
Interactions with Other Solutions
Reinforcing
Electric car batteries can potentially be used as stationary batteries for use as energy storage to balance electrical grids, either through vehicle-to-grid (V2G) technology or with degraded electric car batteries being installed in stationary battery farms as a form of reuse (Ravi & Aziz, 2022).
The effectiveness of electric cars in reducing GHG emissions increases as electricity grids become cleaner, since lower-carbon electricity further reduces the emissions associated with car charging.
left_text_column_width
Competing
Electric cars compete with heat pumps for electricity. Installing both heat pumps and electric cars could strain the electric grid’s capacity (Fakhrooeian et al., 2024).
left_text_column_width
Scaling up the production of electric cars requires more mining of critical minerals, which could affect ecosystems that are valuable carbon sinks (Agusdinata et al., 2018).
left_text_column_width
Getting travelers onto bicycles, sidewalks, public transit networks, or smaller electric vehicles (such as electric bicycles) provides a greater climate benefit than getting them into electric cars. There is an opportunity cost to deploying electric cars because those resources could otherwise be used to support these more effective solutions (APEC, 2024).
left_text_column_width
Dashboard
Solution Basics
1 million passenger-kilometers
t CO₂-eq/unit
48.52
units/yr
Current
818,9002.6×10⁷4.73×10⁷
Achievable (Low to High)
Climate Impact
Gt CO₂-eq/yr
Current 0.04
1.262.3
US$ per t CO₂-eq
-1,019
Gradual
CO₂, CH₄, N₂O
Trade-offs
Electric car batteries are currently quite emissions-intensive to produce, resulting in high embodied emissions. While the embodied emissions are higher for electric cars than fossil fuel–powered cars, the results are mixed when coupling these with operating emissions. Dillman et al.’s (2020) review of the literature on this topic found that producing the average battery-electric car emits 63% more GHG emissions than the average gasoline-powered car, and 77% more GHG emissions than the average diesel-powered car. Taking their lower tailpipe emissions into account, this gives them a GHG payback period of zero to more than 10 years. In some cases, the emissions payback period is longer than the expected lifespan of the electric car, meaning it will have higher life cycle GHG emissions than a comparable gasoline or diesel-powered car. However, the ITF (2020) found that the lifetime emissions from manufacturing, operation, and infrastructure are lower for electric cars. All of these studies relied on assumptions, including the type of car, size of battery, electricity grid, km/yr, and lifetime.
There is some criticism against any solution that advocates for car ownership, contending that the focus should be on solutions such as Enhance Public Transit that reduce car ownership and usage. Jones (2019) noted “there is little evidence to suggest that EVs can offer the universal solution that global governments are seeking,” and that efforts to popularize electric cars “may be better directed at creating more efficient public transport systems, rather than supporting personal transportation, if the significant health disbenefits of car use during the past 150 years are to be in any way reduced.”
Milovanoff et al. (2020) offered similar criticism: “Closing the mitigation gap solely with EVs would require more than 350 million on-road EVs (90% of the fleet), half of national electricity demand, and excessive amounts of critical materials to be deployed in 2050. Improving [the] average fuel consumption of fossil fuel–powered vehicles, with stringent standards and weight control, would reduce the requirement for alternative technologies, but is unlikely to fully bridge the mitigation gap. There is therefore a need for a wide range of policies that include measures to reduce vehicle ownership and usage.”
Allocating the limited global battery supply to privately owned electric cars might undermine the deployment of other solutions that also require batteries, but are more effective at avoiding GHG emissions (Castelvecchi, 2021). These could include electric buses, electric rail, and electric bicycles.
left_text_column_width
Mt CO2-eq
0–4
4–8
8–12
12–16
16–20
> 20
No data
Annual road transportation emissions, 2024
Cars are the largest source of vehicle emissions, which are shown here for urban areas.
Kott, T., Foster, K., Villafane-Delgado, M., Loschen, W., Sicurello, P., Ghebreselassie, M., Reilly, E., and Hughes, M. (2024). Transportation sector - Global road emissions. [Data set]. The Johns Hopkins University Applied Physics Laboratory (JHU/APL), Climate TRACE Emissions Inventory. Retrieved March 12, 2025 from https://climatetrace.org
Geographic Guidance Introduction
Electric cars can effectively mitigate climate change in all geographic regions, although there is spatial variability that influences per-pkm effectiveness and potential solution uptake. Effectiveness heavily depends on the carbon intensity of the charging source, which varies greatly between and within countries. The effectiveness of electric cars decreases for larger vehicles, favored in some countries (Jones, 2019; Nguyen et al., 2023).
The uptake of electric cars can be significantly influenced by socioeconomic factors, including the relative costs of fuels and electricity, the capacity of civil society to provide adequate charging infrastructure, and the availability of subsidies for electric vehicles.
Extreme temperatures can negatively impact vehicle range, both by slowing battery chemistry and increasing energy demands for regulating passenger compartment temperature, which can adversely affect consumers’ perceptions of electric car suitability in locations with such climates (International Council on Clean Transportation, 2024).
Electric cars are most effective in regions with low-carbon electricity grids (International Transport Forum, 2020; Verma et al., 2022). This includes countries with high hydro power (including Iceland, Norway, Sweden, and parts of Canada such as British Columbia and Quebec), nuclear energy (such as France), and renewables (including Portugal, New Zealand, and parts of the United States, including California and some of the Northwest) (IEA, 2024). Electric car adoption is growing rapidly in a number of regions. For future scaling, targeting countries with supportive policies, renewable energy potential, and growing urban populations will deliver the greatest climate benefits.
Action Word
Mobilize
Solution Title
Electric Cars
Classification
Highly Recommended
Lawmakers and Policymakers
- Create government procurement policies to transition government fleets to electric cars.
- Provide financial incentives such as tax breaks, subsidies, or grants for electric car production and purchases that gradually reduce as market adoption increases.
- Provide complimentary benefits for electric car drivers, such as privileged parking areas, free tolls, and access schemes.
- Use targeted financial incentives to assist low-income communities in purchasing electric cars and to incentivize manufacturers to produce more affordable options.
- Develop charging infrastructure, ensuring adequate spacing between stations and equitable distribution of stations.
- Invest in R&D or implement regulations to improve manufacturing, adoption, supply chain standards, and circularity of electric cars, particularly batteries.
- Transition fossil fuel electricity production to renewables while promoting the transition to electric cars.
- Disincentivize fossil fuel–powered car ownership by gradually introducing taxes, penalties, buy-back programs, or other mechanisms.
- Offer educational resources and one-stop shops for information on electric vehicles, including demonstrations, cost savings, environmental impact, and maintenance.
- Work with industry and labor leaders to construct new electric car plants and to transition fossil fuel–powered car manufacturing into electric car production.
- Set regulations for sustainable use of electric car batteries and improve recycling infrastructure.
- Join international efforts to promote and ensure that environmental and human rights standards are met for supply chains.
- Incentivize or mandate life-cycle assessments and product labeling (e.g., Environmental Product Declarations).
- Create, support, or join partnerships that offer information, training, and general support for electric car adoption.
Further information:
- Electric vehicle outlook 2024. Bloomberg New Energy Finance (2024)
- Electric vehicles: total cost of ownership tool. International Energy Agency (2022)
- Policies to promote electric vehicle deployment. International Energy Agency (2021)
- Government Relations and Public Policy Job Function Action Guide, Project Drawdown (2022)
- Legal Job Function Action Guide, Project Drawdown (2022)
Practitioners
- Produce and sell affordable electric car models.
- Collaborate with dealers to provide incentives, low-interest financing, or income-based payment options.
- Develop charging infrastructure, ensuring adequate spacing between stations and equitable distribution of stations.
- Invest in R&D to improve manufacturing, adoption, supply chain standards, and circularity of electric cars, particularly batteries.
- Offer educational resources and one-stop shops for information on electric cars, including demonstrations, cost savings, environmental impact, and maintenance.
- Work with policymakers and labor leaders to construct new electric car plants and to transition fossil fuel–powered car manufacturing into electric car production.
- Join international efforts to promote and ensure that environmental and human rights standards are met for supply chains.
- Invest in recycling and circular economy infrastructure.
- Conduct life-cycle assessments and ensure product labeling (e.g., Environmental Product Declarations).
- Create, support, or join partnerships that offer information, training, and general support for electric car adoption.
Further information:
- Electric vehicle outlook 2024. Bloomberg New Energy Finance (2024)
- Electric vehicles: total cost of ownership tool. International Energy Agency (2022)
- Policies to promote electric vehicle deployment. International Energy Agency (2021)
Business Leaders
- Set company procurement policies to transition corporate fleets to electric cars.
- Take advantage of any financial incentives such as tax breaks, subsidies, or grants for electric car purchases.
- Create long-term purchasing agreements with electric car manufacturers to support stable demand and improve economies of scale.
- Install charging stations and offer employee benefits for electric car drivers, such as privileged parking areas.
- Invest in R&D to improve manufacturing, adoption, supply chain standards, and circularity of electric cars, particularly batteries.
- Work with industry and labor leaders to transition fossil fuel–powered car manufacturing into electric car production.
- Advocate for financial incentives and policies that promote electric car adoption.
- Join international efforts to promote and ensure that environmental and human rights standards are met for supply chains.
- Educate customers and investors about the company's transition to electric cars and encourage them to learn more about them.
- Create, support, or join partnerships that offer information, training, and general support for electric car adoption.
Further information:
- Electric vehicle outlook 2024. Bloomberg New Energy Finance (2024)
- Electric vehicles: total cost of ownership tool. International Energy Agency (2022)
- Policies to promote electric vehicle deployment. International Energy Agency (2021)
- Climate Solutions at Work, Project Drawdown (2021)
- Drawdown-Aligned Business Framework, Project Drawdown (2021)
Nonprofit Leaders
- Set organizational procurement policies to transition fleets to electric cars.
- Take advantage of financial incentives such as tax breaks, subsidies, or grants for electric car purchases.
- Advocate for financial incentives and policies that promote electric car adoption.
- Install charging stations and offer employee benefits for electric car drivers, such as privileged parking areas.
- Advocate for or provide improved charging infrastructure.
- Offer workshops or support to low-income communities for purchasing and owning electric cars.
- Work with industry and labor leaders to transition fossil fuel–powered car manufacturing into electric car production.
- Join international efforts to promote and ensure that environmental and human rights standards are met for supply chains.
- Advocate for regulations on lithium-ion batteries and investments in recycling facilities.
- Offer educational resources and one-stop shops for information on electric cars, including demonstrations, cost savings, environmental impact, and maintenance.
- Create, support, or join partnerships that offer information, training, and general support for electric car adoption.
Further information:
- Electric vehicle outlook 2024. Bloomberg New Energy Finance (2024)
- Electric vehicles: total cost of ownership tool. International Energy Agency (2022)
- Policies to promote electric vehicle deployment. International Energy Agency (2021)
- Government Relations and Public Policy Job Function Action Guide, Project Drawdown (2022)
Investors
- Invest in electric car companies.
- Support portfolio companies in transitioning their corporate fleets.
- Invest in companies that provide charging equipment or installation.
- Invest in R&D to improve manufacturing, adoption, supply chain standards, and circularity of electric cars, particularly batteries.
- Invest in electric car companies, associated supply chains, and end-user businesses like rideshare apps.
- Join international efforts to promote and ensure that environmental and human rights standards are met for supply chains.
- Create, support, or join partnerships that offer information, training, and general support for electric car adoption.
Further information:
- Electric vehicle outlook 2024. Bloomberg New Energy Finance (2024)
- Electric vehicles: total cost of ownership tool. International Energy Agency (2022)
- Policies to promote electric vehicle deployment. International Energy Agency (2021)
Philanthropists and International Aid Agencies
- Set organizational procurement policies to transition fleets to electric cars.
- Install charging stations and offer employee benefits for electric car drivers, such as privileged parking areas.
- Take advantage of any financial incentives such as tax breaks, subsidies, or grants for electric car purchases.
- Advocate for financial incentives and policies that promote electric car adoption.
- Advocate for or provide improved charging infrastructure.
- Offer financial services such as low-interest loans or grants for purchasing electric cars and charging equipment.
- Offer workshops or support to low-income communities for purchasing and owning electric cars.
- Work with industry and labor leaders to transition fossil fuel–powered car manufacturing into electric car production.
- Join international efforts to promote and ensure that environmental and human rights standards are met for supply chains.
- Advocate for regulations on lithium-ion batteries and investments in recycling facilities.
- Offer educational resources and one-stop shops for information on electric cars, including demonstrations, cost savings, environmental impact, and maintenance.
- Create, support, or join partnerships that offer information, training, and general support for electric car adoption.
Further information:
- Electric vehicle outlook 2024. Bloomberg New Energy Finance (2024)
- Electric vehicles: total cost of ownership tool. International Energy Agency (2022)
- Policies to promote electric vehicle deployment. International Energy Agency (2021)
- Government Relations and Public Policy Job Function Action Guide, Project Drawdown (2022)
Thought Leaders
- If purchasing a new car, buy an electric car.
- Take advantage of financial incentives such as tax breaks, subsidies, or grants for electric car purchases.
- Share your experiences with electric cars through social media and peer-to-peer networks, highlighting the cost savings, benefits, incentive programs, and troubleshooting tips.
- Advocate for financial incentives and policies that promote electric car adoption.
- Advocate for improved charging infrastructure.
- Help improve the circularity of electric car supply chains through design, advocacy, or implementation.
- Conduct in-depth life-cycle assessments of electric cars in particular geographies.
- Research ways to reduce weight and improve the performance of electric cars while appealing to customers.
- Join international efforts to promote and ensure that environmental and human rights standards are met for supply chains.
- Create, support, or join partnerships that offer information, training, and general support for electric car adoption.
Further information:
- Electric vehicle outlook 2024. Bloomberg New Energy Finance (2024)
- Electric vehicles: total cost of ownership tool. International Energy Agency (2022)
- Policies to promote electric vehicle deployment. International Energy Agency (2021)
Technologists and Researchers
- Improve the circularity of supply chains for electric car components.
- Reduce the amount of critical minerals required for electric car batteries.
- Innovate low-cost methods to improve safety, labor standards, and supply chains in mining for critical minerals.
- Research ways to reduce weight and improve the performance of electric cars while appealing to customers.
- Develop vehicle-grid integration and feasible means of using the electrical capacity of electric cars to manage the broader grid.
- Improve techniques to repurpose used electric car batteries for stationary energy storage.
- Develop methods of converting fossil fuel–powered car manufacturing and infrastructure to electric.
Further information:
- Electric vehicle outlook 2024. Bloomberg New Energy Finance (2024)
- Electric vehicles: total cost of ownership tool. International Energy Agency (2022)
- Policies to promote electric vehicle deployment. International Energy Agency (2021)
Communities, Households, and Individuals
- If purchasing a new car, purchase an electric car.
- Take advantage of any financial incentives such as tax breaks, subsidies, or grants for electric car purchases.
- Share your experiences with electric cars through social media and peer-to-peer networks, highlighting the cost-savings, benefits, incentive programs, and troubleshooting tips.
- Help shift the narrative around electric cars by demonstrating capability and performance.
- Advocate for financial incentives and policies that promote electric car adoption.
- Advocate for improved charging infrastructure.
- Help improve ciricularity of electric car supply chains.
- Join international efforts to promote and ensure that environmental and human rights standards are met for supply chains.
- Create, support, or join partnerships that offer information, training, and general support for electric car adoption.
Further information:
- Electric vehicle outlook 2024. Bloomberg New Energy Finance (2024)
- Electric vehicles: total cost of ownership tool. International Energy Agency (2022)
- Policies to promote electric vehicle deployment. International Energy Agency (2021)
Sources
- Electric vehicle outlook 2024. Bloomberg New Energy Finance (2024)
- The other benefit of electric vehicles. Carey (2023)
- Electric cars and batteries: how will the world produce enough? Castelvecchi (2021)
- Review and meta-analysis of EVs: embodied emissions and environmental breakeven. Dillman (2020)
- Electric vehicles: total cost of ownership tool. International Energy Agency (2022)
- Policies to promote electric vehicle deployment. International Energy Agency (2021)
- If electric cars are the answer, what was the question? Jones (2019)
- Technological learning in the transition to a low-carbon energy system. Kittner (2020)
- Electrification of light-duty vehicle fleet alone will not meet mitigation targets. Milovanoff (2020)
- Assessing and managing the direct and indirect emissions from electric and fossil-powered vehicles. Mofolasayo (2023)
- Assessing the effectiveness of city-level electric vehicle policies in China. Qiu et al. (2019)
- Utilization of electric vehicles for vehicle-to-grid services: progress and perspectives. Ravi (2022)
- Hidden delays of climate mitigation benefits in the race for electric vehicle deployment. Ren (2023)
- Evaluating electric vehicle policy effectiveness and equity. Sheldon (2022).
- The precarious political economy of cobalt: Balancing prosperity, poverty, and brutality in artisanal and industrial mining in the Democratic Republic of the Congo. Sovacool (2019)
- Mapping electric vehicle impacts: greenhouse gas emissions, fuel costs, and energy justice in the United States. Vega-Perkins (2023)
- Life cycle assessment of electric vehicles in comparison to combustion engine vehicles: a review. Verma (2022)
Evidence Base
Consensus of effectiveness in reducing emissions: Mixed
There is a high level of consensus among major organizations and researchers working on climate solutions that electric cars offer a substantial reduction in GHG emissions compared to fossil fuel–powered cars. This advantage is strongest in places where electricity in the grid comes from sources with low GHG emissions, but it persists even if fossil fuels play a major role in energy production.
Major climate research organizations generally see electric cars as the primary means of reducing GHG emissions from passenger transportation. This perspective has received criticism from some scholars who argue that electric cars have been overstated as a climate solution, pointing to supply constraints, embodied emissions, and emissions from electricity generation (Jones, 2019; Milovanoff et al., 2020). Embodied emissions are outside the scope of this assessment.
The Intergovernmental Panel on Climate Change (IPCC) (2022) estimated well-to-wheel (upstream and downstream emissions) GHG emissions intensity from gasoline and diesel cars at 139 g CO₂‑eq/pkm and 107 g CO₂‑eq/pkm, respectively. They estimated that electric cars running on low-carbon electricity (solar, wind, and nuclear sourced) emit 9 g CO₂‑eq/pkm; electric cars running on natural gas electricity emit 104 g CO₂‑eq/pkm; and electric cars running entirely on coal electricity emit 187 g CO₂‑eq/pkm. These estimates include upstream emissions, such as those from oil refining and coal mining.
The International Energy Agency (IEA, 2024) noted that “[a] battery electric car sold in 2023 will emit half as much as fossil fuel–powered equivalents over its lifetime. This includes full life-cycle emissions, including those from producing the car.”
The International Transport Forum (ITF) (2020) estimated that fossil fuel–powered cars emit 162 g CO₂‑eq/pkm, while electric cars emit 125 g CO₂‑eq/pkm. This included embodied and upstream emissions, which are outside the scope of this assessment..
The results presented in this document summarize findings from 15 reviews and meta-analyses and 24 original studies reflecting current evidence from 52 countries, primarily the IEA’s Electric Vehicle Outlook 2024), the Electric Vehicle Database 2024), the International Transportation Forum’s life cycle analysis on sustainable transportation 2020), the Nickel Institute’s cost estimates on electric cars (Nickel Institute, 2021b, 2021c, 2021a). We recognize this limited geographic scope creates bias, and hope this work inspires research and data sharing on this topic in underrepresented regions.
left_text_column_width
Updated Date
Mobilize Electric Bicycles
Sector
Transportation
Mode
Cut Emissions
Image
Image

Coming Soon
Off
Summary
We define the Mobilize Electric Bicycles solution as increased travel by bicycles that have an electric motor to supplement the effort of the rider, but require the rider to turn the pedals to activate the motor. Some sources refer to electric mopeds or motorcycles as electric bicycles, but those modes of transportation fall within Project Drawdown’s Mobilize Electric Scooters & Motorcycles solution and are not covered here. Also known as pedelecs or e-bikes, electric bicycles can be deployed as privately owned electric bicycles or as shared electric bicycles, which are available as part of bicycle sharing networks typically operated at the city level for short-term rental on a per-trip basis.
Overview
Electric bicycles use electric power to supplement the muscular effort of the rider. Like conventional bicycles and other forms of nonmotorized transportation, electric bicycles get some of their motive power from human muscle power, which in turn comes from food calories – a form of closed-loop biomass power with no emissions (see Project Drawdown’s Improve Nonmotorized Transportation solution). Unlike conventional bicycles, however, electric bicycles get additional power from electricity, which comes from the grid and is stored in a battery.
This partial reliance on grid electricity, as well as the production of the battery and electric motors, increases the carbon emissions and cost of an electric bicycle compared to those of a conventional bicycle. Nevertheless, electric bicycle emissions remain far lower than the emissions of cars (including electric cars), meaning that every passenger-kilometer (pkm) moved from a car to an electric bicycle achieves significant GHG emissions savings.
Since the additional electric power enables electric bicycle riders to cover longer distances at greater speeds, climb larger hills, and carry heavier loads – and do it all with substantially less physical effort – electric bicycles can substitute for more car trips than conventional bicycles can. This can amplify electric bicycles’ potential carbon savings relative to conventional bicycles, even if the savings per pkm traveled are lower. Electric bicycles also tend to get used at high rates, and a large proportion of pkm by electric bicycle are pkm that would otherwise have been by car (Bigazzi & Wong, 2020; Bourne et al., 2020; Cairns et al., 2017; Fukushige et al., 2021).
Shared electric bicycles can enhance this effect. The need for docking stations and rebalancing services (i.e., the use of larger vehicles to reposition bicycles to avoid one-way trips that create shortages in some places and surpluses in others) increases the carbon emissions of electric bicycles per pkm compared with private electric bicycles. By renting out electric bicycles one trip at a time, however, bicycle-share systems can make electric bicycles affordable to a larger percentage of the public, further increasing the number of pkm that can be shifted to electric bicycles.
The adoption of electric bicycles reduces emissions of CO₂ and methane from cars by displacing pkm traveled via car. When electric bicycles replace a trip by a gasoline- or diesel-powered car, they also eliminate reliance on fossil fuels to complete that trip. Even if the electricity used to power electric bicycles comes from fossil fuels, those emissions are relatively small and could eventually be replaced with low-emission electricity through the deployment of renewables or similar technologies.
References
Astegiano, P., Fermi, F., & Martino, A. (2019). Investigating the impact of e-bikes on modal share and greenhouse emissions: A system dynamic approach. Transportation Research Procedia, 37, 163-170. https://doi.org/10.1016/j.trpro.2018.12.179
Berjisian, E., & Bigazzi, A. (2019). Summarizing the impacts of electric bicycle adoption on vehicle travel, emissions, and physical activity. UBC REACT LAb. https://civil-reactlab.sites.olt.ubc.ca/files/2019/07/BerjisianBigazzi_ImpactsofE-bikes_Report_July2019.pdf
Bigazzi, A., & Wong, K. (2020). Electric bicycle mode substitution for driving, public transit, conventional cycling, and walking. Transportation Research Part D: Transport and Environment, 85, 102412. https://doi.org/10.1016/j.trd.2020.102412
Bourne, J. E., Cooper, A. R., Kelly, P., Kinnear, F. J., England, C., Leary, S., & Page, A. (2020). The impact of e-cycling on travel behaviour: A scoping review. Journal of Transport & Health, 19, 100910. https://doi.org/10.1016/j.jth.2020.100910
https://doi.org/10.1016/j.rser.2019.109298
Cairns, S., Behrendt, F., Raffo, D., Beaumont, C., & Kiefer, C. (2017). Electrically-assisted bikes: Potential impacts on travel behaviour. Transportation Research Part A: Policy and Practice, 103, 327-342. https://doi.org/10.1016/j.tra.2017.03.007
Carracedo, D., & Mostofi, H. (2022). Electric cargo bikes in urban areas: A new mobility option for private transportation. Transportation Research Interdisciplinary Perspectives, 16, 100705. https://doi.org/10.1016/j.trip.2022.100705
Dekker, P. (2013). Electrification of road transport-An analysis of the economic performance of electric two-wheelers. Utrecht University. https://studenttheses.uu.nl/bitstream/handle/20.500.12932/13022/Thesis%20P.W.K.%20Dekker%2012%20May%202013.pdf?sequence=1&isAllowed=y
eBicycles. (2025a). How much does an electric bike cost? E-bike price breakdown [2025].
https://www.ebicycles.com/how-much-does-an-electric-bike-cost/
eBicycles. (2025b). Useful facts & stats of e-bikes [for 2025] + infographic. https://www.ebicycles.com/ebike-facts-statistics/
Ebike Canada. (2025). The best electric bikes & scooters in canada for 2025. Ebike Canada.
https://ebikecanada.com/best-electric-bike-and-scooter/
Fishman, E., & Cherry, C. (2016). E-bikes in the Mainstream: Reviewing a Decade of Research. Transport Reviews, 36(1), 72-91. https://doi.org/10.1080/01441647.2015.1069907
Fukushige, T., Fitch, D. T., & Handy, S. (2021). Factors influencing dock-less E-bike-share mode substitution: Evidence from Sacramento, California. Transportation Research Part D: Transport and Environment, 99, 102990. https://doi.org/10.1016/j.trd.2021.102990
Galatoulas, N.-F., Genikomsakis, K. N., & Ioakimidis, C. S. (2020). Spatio-Temporal Trends of E-Bike Sharing System Deployment: A Review in Europe, North America and Asia. Sustainability, 12(11), Article 11. https://doi.org/10.3390/su12114611
Gössling, S., Choi, A., Dekker, K., & Metzler, D. (2019). The social cost of automobility, cycling and walking in the European Union. Ecological Economics, 158, 65–74. https://doi.org/10.1016/j.ecolecon.2018.12.016
Guidon, S., Becker, H., Dediu, H., & Axhausen, K. W. (2018). Electric bicycle-sharing: A new competitor in the urban transportation market?: An empirical analysis of transaction data. Arbeitsberichte Verkehrs- Und Raumplanung, 1364. https://doi.org/10.1016/j.ecolecon.2018.12.016
Hanna, J. (2023). Bike Share Toronto 2023 business review.
https://www.toronto.ca/legdocs/mmis/2023/pa/bgrd/backgroundfile-240804.pdf
Helton, J. (2025). Ride with power: The top electric bikes for 2025, as chosen by experts. Road & Track. https://www.roadandtrack.com/gear/lifestyle/g46464030/best-electric-bikes/
Huang, Y., Jiang, L., Chen, H., Dave, K., & Parry, T. (2022). Comparative life cycle assessment of electric bikes for commuting in the UK. Transportation Research Part D: Transport and Environment, 105, 103213. https://doi.org/10.1016/j.trd.2022.103213
Innovation Origins. (2023). The booming rise of shared e-bikes in urban mobility. https://innovationorigins.com/en/the-booming-rise-of-shared-e-bikes-in-urban-mobility/
International Transport Forum. (2020). Good to Go? Assessing the Environmental Performance of New Mobility (Corporate Partnership Board). OECD. https://www.itf-oecd.org/sites/default/files/docs/environmental-performance-new-mobility.pdf
Jones, B. (2019). Electric Bike Maintenance Cost. BicycleVolt. https://bicyclevolt.com/electric-bike-maintenance-cost/
Koning, M., & Conway, A. (2016). The good impacts of biking for goods: Lessons from Paris city. Case Studies on Transport Policy, 4(4), 259-268. https://doi.org/10.1016/j.cstp.2016.08.007
Langford, B. C., Chen, J., & Cherry, C. R. (2015). Risky riding: Naturalistic methods comparing safety behavior from conventional bicycle riders and electric bike riders. Accident Analysis & Prevention, 82, 220-226. https://doi.org/10.1016/j.aap.2015.05.016
Langford, B. C., Cherry, C. R., Bassett, D. R., Fitzhugh, E. C., & Dhakal, N. (2017). Comparing physical activity of pedal-assist electric bikes with walking and conventional bicycles. Journal of Transport & Health, 6, 463–473. https://doi.org/10.1016/j.jth.2017.06.002
Li, Q., Fuerst, F., & Luca, D. (2023). Do shared E-bikes reduce urban carbon emissions? Journal of Transport Geography, 112, 103697. https://doi.org/10.1016/j.jtrangeo.2023.103697
https://luxe.digital/lifestyle/garage/best-electric-bikes/
Matasyan, A. (2015). Technical analysis and market study of electric bicycles. https://upcommons.upc.edu/handle/2117/77272?locale-attribute=en
Mellino, S., Petrillo, A., Cigolotti, V., Autorino, C., Jannelli, E., & Ulgiati, S. (2017). A Life Cycle Assessment of lithium battery and hydrogen-FC powered electric bicycles: Searching for cleaner solutions to urban mobility. International Journal of Hydrogen Energy, 42(3), 1830–1840. https://doi.org/10.1016/j.ijhydene.2016.10.146
Mordor Intelligence. (2022). Asia Pacific e-bike market (2017-2029). https://www.mordorintelligence.com/industry-reports/asia-pacific-e-bike-market
N, A. (2023). Maintenance costs for an electric bike. Bike LVR.
https://bikelvr.com/bikes/e-bikes/maintenance-costs-for-an-electric-bike/
de Nazelle, A., Nieuwenhuijsen, M., Antó, J., Brauer, M., Briggs, D., Charlotte Braun-Fahrlander, C., Cavill, N., Cooper, A., Desqueyroux, H., Fruin, S., Hoek, G., Panis, L., Janssen, N., Jerrett, M., Joffe, M., Andersen, Z., van Kempen, E., Kingham, S., Kubesch, N., Leyden, K., Marshall, J., Matamala, J., Mellios, G., Mendez, M., Nassif, H., Ogilvie, D., Peiró, R., Pérez, K., Rabl, A., Ragettli, M., Rodríguez, D., Rojas, D., Ruiz, P., Sallis, J., Terwoert, J., Toussaint, J., Tuomisto, J., Zuurbier, M., & Lebret, E. (2011). Improving health through policies that promote active travel: A review of evidence to support integrated health impact assessment. Environment International, 37(4), 767-777.
https://doi.org/10.1016/j.envint.2011.02.003
PBSC Urban Solutions. (2022). The Meddin Bike-sharing World Map Report 2022 edition. https://bikesharingworldmap.com/reports/bswm_mid2022report.pdf
Pekow, C. (2024, April 1). E-bikes could cut smog, energy use and congestion globally—But will they? Mongabay Environmental News. https://news.mongabay.com/2024/04/e-bikes-could-cut-smog-energy-use-and-congestion-globally-but-will-they/
Philips, I., Anable, J., & Chatterton, T. (2022). E-bikes and their capability to reduce car CO₂ emissions. Transport Policy, 116, 11-23. https://doi.org/10.1016/j.tranpol.2021.11.019
Platt, S. M., Haddad, I. E., Pieber, S. M., Huang, R.-J., Zardini, A. A., Clairotte, M., Suarez-Bertoa, R., Barmet, P., Pfaffenberger, L., Wolf, R., Slowik, J. G., Fuller, S. J., Kalberer, M., Chirico, R., Dommen, J., Astorga, C., Zimmermann, R., Marchand, N., Hellebust, S., … Prévôt, A. S. H. (2014). Two-stroke scooters are a dominant source of air pollution in many cities. Nature Communications, 5(1), 3749. https://doi.org/10.1038/ncomms4749
Precedence Research. (2024). E-bike market poised for robust expansion | CAGR of 10.16%.
https://www.precedenceresearch.com/insights/e-bike-market
Roberts, C. (2023). Diversity in passenger mobility: Where it went and how to bring it back. One Earth, 6(1), 11-13.
https://doi.org/10.1016/j.oneear.2022.12.008
Roberts, C. (2020). Into a headwind: Canadian cycle commuting and the growth of sustainable practices in hostile political contexts. Energy Research and Social Science, 70. Scopus.
https://doi.org/10.1016/j.erss.2020.101679
Rodriguez Mendez, Q., Fuss, S., Lück, S., & Creutzig, F. (2024). Assessing global urban CO₂ removal. Nature Cities, 1(6), 413-423. https://doi.org/10.1038/s44284-024-00069-x
Shi, Z., Wang, J., Liu, K., Liu, Y., & He, M. (2024). Exploring the usage efficiency of electric bike-sharing from a spatial–temporal perspective. Transportation Research Part D: Transport and Environment, 129, 104139. https://doi.org/10.1016/j.trd.2024.104139
So, A. (2024). Best electric bikes (2025): Hauling, commuting, mountain biking. WIRED. https://www.wired.com/gallery/best-electric-bikes/
Stewart, D., & Ramachandran, K. (2022, March 31). E-bikes merge into the fast lane. Deloitte Insights. https://www2.deloitte.com/us/en/insights/industry/technology/smart-micromobility-e-bikes.html
Strategic Market Research. (2024). E-bikes statistics and trends 2024. https://www.strategicmarketresearch.com/blogs/e-bikes-statistics
Summit Bike Share. (2023). Summit bike share end of year report 2023. https://www.summitcountyutah.gov/2415/Summit-Bike-Share
Teixeira, J. F., Silva, C., & Moura e Sá, F. (2021). Empirical evidence on the impacts of bikesharing: A literature review. Transport Reviews, 41(3), 329-351. https://doi.org/10.1080/01441647.2020.1841328
Thomas, A. (2022). Electric bicycles and cargo bikes—Tools for parents to keep on biking in auto-centric communities? Findings from a US metropolitan area. International Journal of Sustainable Transportation, 16(7), 637-646. https://doi.org/10.1080/15568318.2021.1914787
https://www.ctc-n.org/technologies/promotion-non-motorised-transport
Van Acker, V., & Witlox, F. (2010). Car ownership as a mediating variable in car travel behaviour research using a structural equation modelling approach to identify its dual relationship. Journal of Transport Geography, 18(1), 65-74. https://doi.org/10.1016/j.jtrangeo.2009.05.006
Wamburu, J., Lee, S., Hajiesmaili, M. H., Irwin, D., & Shenoy, P. (2021). Ride Substitution Using Electric Bike Sharing: Feasibility, Cost, and Carbon Analysis. Proc. ACM Interact. Mob. Wearable Ubiquitous Technol., 5(1), 38:1-38:28. https://doi.org/10.1145/3448081
WHO. (2022). Number of registered vehicles. https://www.who.int/data/gho/data/indicators/indicator-details/GHO/number-of-registered-vehicles
WHO. (2023). Despite notable progress, road safety remains urgent global issue. https://www.who.int/news/item/13-12-2023-despite-notable-progress-road-safety-remains-urgent-global-issue
World Bank. (2024). World Development Indicators. https://datacatalog.worldbank.org/search/dataset/0037712/World-Development-Indicators
Weiss, M., Dekker, P., Moro, A., Scholz, H., & Patel, M. K. (2015). On the electrification of road transportation – A review of the environmental, economic, and social performance of electric two-wheelers. Transportation Research Part D: Transport and Environment, 41, 348-366. https://doi.org/10.1016/j.trd.2015.09.007
Yang, Y., Okonkwo, E. G., Huang, G., Xu, S., Sun, W., & He, Y. (2021). On the sustainability of lithium ion battery industry – A review and perspective. Energy Storage Materials, 36, 186-212. https://doi.org/10.1016/j.ensm.2020.12.019
Credits
Lead Fellows
Heather Jones, Ph.D.
Cameron Roberts, Ph.D.
Contributors
Ruthie Burrows, Ph.D.
James Gerber, Ph.D.
Yusuf Jameel, Ph.D.
Daniel Jasper
Heather McDiarmid, Ph.D.
Alex Sweeney
Internal Reviewers
Aiyana Bodi
Hannah Henkin
Ted Otte
Amanda Smith, Ph.D.
Effectiveness
Per 1,000 private electric bicycles, approximately 110.5 t CO₂‑eq/yr is offset by displacing trips taken by higher-emission transportation modes such as cars and public transit (Table 1).
Per 1,000 shared electric bicycles, approximately 14.44 t CO₂‑eq/yr is offset. This lower value is due to the additional emissions produced in the operation of a shared electric-bicycle system (e.g., due to the need to reposition bicycles after they accumulate in some locations while becoming depleted in others). Additionally, other modes of transportation are shifted to shared electric bicycles at different rates than privately owned electric bicycles – notably shifted less from car travel. These factors limit the total GHG emissions reduced per shared electric bicycle.
left_text_column_width
Table 1. Effectiveness at reducing emissions.
Unit: t CO₂‑eq /1,000 electric bicycles, 100-yr basis
| 25th percentile | 58.87 |
| mean | 136.1 |
| median (50th percentile) | 110.5 |
| 75th percentile | 220.5 |
Unit: t CO₂‑eq /1,000 electric bicycles, 100-yr basis
| 25th percentile | 1.415 |
| mean | 14.62 |
| median (50th percentile) | 14.44 |
| 75th percentile | 34.31 |
Left Text Column Width
Cost
Electric bicycles vary significantly in cost, but generally are more expensive than traditional bicycles due to the cost of batteries, motors, and other electronic components, as well as the need for more durable mechanical components.
Private electric bicycles cost about US$2,700, plus another few hundred dollars per year in maintenance costs. All told, assuming a 10-year lifespan, electric bicycles cost about US$600/yr to operate . The average privately owned electric bicycle is ridden 2,400 km/yr; since 28.67% of that distance is shifted from car trips, electric bicycles displace approximately 688 pkm/yr traveled by car. Car travel costs US$0.53/pkm while electric bicycle travel costs US$0.25/pkm, meaning every pkm traveled via electric bicycle saves US$0.28. Multiplied over 688 pkm/yr, this translates to every electric bicycle saving its owner approximately US$193/yr in avoided car trips (Bucher et al., 2019; Carracedo & Mostofi, 2022; eBicycles, 2025a; Ebike Canada, 2025; Gössling et al., 2019; Helton, 2025; Huang et al., 2022; International Transport Forum, 2020; Jones, 2019; Luxe Digital, 2025; Mellino et al., 2017; N, 2023; So, 2024; Weiss et al., 2015).
Most of the costs of riding an electric bicycle are up-front costs. As a result, electric bicycle owners who shift more trips from a car onto their electric bicycle will significantly increase their savings. Privately owned electric bicycles save US$1,748 for every t CO₂‑eq they avoid (Table 2).
Shared electric bicycles are more expensive to the system provider than privately owned electric bicycles due to greater needs for infrastructure, maintenance, operating expenses, and services, such as rebalancing. Shared electric bicycles cost US$2.42/pkm and displace an average of 156 pkm/yr from car trips per bicycle. The same distance traveled by car costs US$83, meaning that shared electric bicycles cost an additional US$295/yr compared to traveling the same distance by car (Gössling et al., 2019; Guidon et al., 2018; Hanna, 2023; Matasyan, 2015; Summit Bike Share, 2023). Shared electric bicycles cost US$22,860/t CO₂‑eq avoided due to their higher costs, higher emissions, and the lower chance that riders on shared electric bicycles would otherwise have been traveling by car.
left_text_column_width
Table 2. Cost per climate impact.
Unit: US$ (2023) per t CO₂‑eq , 100-year basis
| median | -1,748 |
Unit: US$ (2023) per t CO₂‑eq , 100-year basis
| median | 22,860 |
*Cost to the provider of the system, not the user
Left Text Column Width
Learning Curve
Learning rates for electric bicycles are often negative (i.e., prices increase with cumulative production). This is largely because electric bicycle batteries have grown larger over time, causing the bicycles to become more expensive (Dekker, 2013; Weiss et al., 2015). The learning rate per electric bicycle ranges from 15% to –43%(Table 3). This range has improved the general value proposition of electric bicycles, however, since larger batteries enable electric bicycles to go further and faster than before.
To compensate for this, it is useful to calculate the learning rate per kWh battery capacity rather than per bicycle. On this measure, Dekker (2013) calculates a learning rate of 7.9% cost reduction per kWh of electric bicycle battery capacity for every doubling of cumulative production.
These estimates are based on analyses published in 2013 and 2015, respectively, and therefore do not take into account more recent advances in electric bicycle production. More up-to-date research on electric bicycle learning rates is needed to inform future assessments on this topic.
left_text_column_width
Table 3. Learning rate: drop in cost per doubling of cumulative electric bicycle production.*
Unit: %
| 25th percentile | -43.50 |
| mean | -26.86 |
| median (50th percentile) | -36.00 |
| 75th percentile | 15 |
* These data are from 2013 and 2015, due to a lack of available research on this topic.
Unit: %
| 25th percentile | |
| mean | |
| median (50th percentile) | 7.90 |
| 75th percentile |
* These data are from 2013 and 2015, due to a lack of available research on this topic.
Left Text Column Width
Speed of Action
Speed of action refers to how quickly a climate solution physically affects the atmosphere after it is deployed. This is different from speed of deployment, which is the pace at which solutions are adopted.
At Project Drawdown, we define the speed of action for each climate solution as gradual, emergency brake, or delayed.
Mobilize Electric Bicycles is a GRADUAL climate solution. It has a steady, linear impact on the atmosphere. The cumulative effect over time builds as a straight line.
left_text_column_width
Caveats
Electric bicycles do not only compete with cars for the total passenger transport demand; a given electric bicycle trip might also substitute for public transit. This can sometimes still be beneficial since, as electric bicycles often have lower per-kilometer emissions than public transit vehicles (International Transport Forum, 2020). However, an electric bicycle trip might also substitute for a conventional bicycle trip or for a pedestrian journey, in which case electric bicycle usage would actually increase emissions. Finally, some electric bicycle trips are new journeys, meaning that they would not occur at all if the traveler did not have an electric bicycle, which also increases emissions (Astegiano et al., 2019; Berjisian & Bigazzi, 2019; Bourne et al., 2020; Cairns et al., 2017; Dekker, 2013).
Generally speaking however, electric bicycles still shift enough passenger car trips to make up for this effect, although the scale can be more marginal with shared electric bicycle systems. However, electric bicycles are more likely to substitute more for whichever forms of transportation their users were already using previously (Wamburu et al., 2021). This means that wider adoption of electric bicycles in car-dependent North American suburbs, for example, will have a much clearer and more beneficial climate impact than in a dense, pedestrianized European city center, or in a low-income country where most people do not have access to a car (although in these contexts electric bicycles could still produce major social and economic benefits).
Our estimates of the total adoption ceiling potential of electric bicycles (described in the Adoption section) are based on the ratio of adoption between electric bicycles and cars, on the grounds that each electric bicycle avoids some amount of car travel. However, the relationship is not necessarily quite so simple. Car trips with passengers might require more than one electric bicycle trip to replace them (unless the passengers are children, who can be carried as passengers on electric bicycles). On the other side of the equation, some households own more than one car per person. Having more than one electric bicycle per car would therefore not meaningfully reduce car trips. Lastly, our approach of tracking electric bicycle adoption in relation to car ownership neglects people whose use of an electric bicycle enables them to avoid owning a car at all. Estimates of adoption should be taken as rough guesses, rather than authoritative forecasts.
left_text_column_width
Current Adoption
Private electric bicycles have experienced significant growth since 2015. We estimate there are approximately 278 million private electric bicycles in use in the world today (Table 4).
Data on this subject typically include throttle-assisted electric bicycles, e-scooter/trotinettes, and sometimes mopeds and motorcycles; these are not included in this solution. Data from China, the highest adopter of electric bicycles, does not usually distinguish between types of electric two-wheelers. For this reason, we used more conservative estimates, preferring to understate adoption than overstate it. We used several global estimates, data on electric bicycle sales in Canada, the United States, and Europe, and stock estimates from the Asia-Pacific region (eBicycles, 2025b; Mordor Intelligence, 2022; Precedence Research, 2024; Stewart & Ramachandran, 2022;, Strategic Market Research, 2024; The Freedonia Group, 2024). To convert from European and American sales data to stocks data, we assumed that all electric bicycles sold over the past 10 years (the lifespan of an electric bicycle) are still in use today. We then calculated the number of electric bicycles per 1,000 people in each of the three regions, used those three values to calculate a population-weighted global mean adoption rate, and multiplied the result by the number of residents of high- and upper-middle income countries worldwide (where we assume most electric bicycle adoption takes place). This calculation provided a global estimate.
Shared electric bicycle schemes now exist in many cities around the world, with at least 2 million shared electric bicycles currently in use as part of electric bicycle sharing systems (eBicycles, 2025b; Innovation Origins, 2023; PBSC Urban Solutions, 2022; Strategic Market Research, 2024). This is a conservative estimate because research published in a reputable academic journal claimed that China has 8.7 million shared electric bicycles in 2022 (Shi et al., 2024).
left_text_column_width
Table 4. Current (2024) adoption level.
Unit: 1,000 electric bicycles
| mean* | 277,600 |
* Population-weighted
Unit: 1,000 electric bicycles
| mean* | 2,000 |
* Population-weighted
Left Text Column Width
Adoption Trend
Private electric bicycles are being adopted at a rate of about 37 million new bicycles every year (Table 5; eBicycles, 2025b; Mordor Intelligence, 2022; Precedence Research, 2024; Stewart & Ramachandran, 2022; Strategic Market Research, 2024; The Freedonia Group, 2024). Electric bicycles are also attracting interest from consumers who do not normally ride bicycles, including people in rural areas (Philips et al., 2022) and members of vulnerable groups, such as the elderly.
Shared electric bicycles are being added to cities at a rate of approximately 413,000/yr (eBicycles, 2025b; Innovation Origins, 2023; PBSC Urban Solutions, 2022; Strategic Market Research, 2024). Cities and private companies are adding shared electric bicycle systems at a rate of around 30/yr (Galatoulas et al., 2020).Based on these data, we calculate a 37.97% compounding annual growth rate in electric bicycle sharing system installations around the world.
left_text_column_width
Table 5. 2023–2024 adoption trend.
Unit: 1,000 electric bicycles/yr
| 25th percentile | 34,000 |
| population-weighted mean | 37,330 |
| median (50th percentile) | 38,000 |
| 75th percentile | 40,000 |
Unit: 1,000 electric bicycles/yr
| 25th percentile | |
| population-weighted mean | |
| median (50th percentile) | 412.5 |
| 75th percentile |
Left Text Column Width
Adoption Ceiling
Because we model electric bicycles as a solution primarily due to their ability to shift travel from fossil fuel–powered cars, we estimate adoption by reference to the ratio of electric bicycles to cars. This doesn’t mean that people without access to a car won’t use electric bicycles; it means that they are not shifting their pkm from fossil fuel–powered cars and therefore are not included in the calculations of shifting from car to electric bicycle.
Private electric bicycles’ adoption ceiling (Table 6) would be approximately 2 billion around the world: one for every car (World Health Organization, 2021). This would mean that every motorist has an electric bicycle as a ready alternative to a car.
Shared electric bicycles’ adoption ceiling can be measured similarly, except that we assume these systems are only viable in cities. Therefore, we set the maximum adoption ceiling of shared electric bicycles to be 1.3 billion – the number of cars in cities around the world. we estimated by multiplying the global urban population (4.45 billion) by the global average car registrations per 1,000 people (286.2) (World Health Organization, 2021; World Bank, 2024).
This upper-bound scenario faces many of the same caveats as the upper-bound scenario for the Nonmotorized Transportation solution: It would require a revolution in support for electric bicycles:new infrastructure, new traffic laws, a substantial increase in electric battery production capacity, and major changes to built environments, including increases in population and land-use density to make more journeys feasible by electric bicycle. However, this scenario would require less dramatic change than a similar upper-bound scenario for the Improve Nonmotorized Transportation solution because electric bicycles go faster, have higher carrying capacities, can travel longer distances, and are easier to use than nonmotorized travel modes (Weiss et al., 2015).
A limitation of this analysis is that one electric bicycle per car does not necessarily correspond to one electric bicycle per person traveling in a car. For example, it is possible that replacing one car trip with electric bicycles would result in multiple electric bicycle trips in order to carry multiple passengers. Our estimates should therefore be seen as approximate.
It is also possible for total electric bicycle adoption and usage to exceed car use (i.e., electric bicycles also replace other modes of transportation or generate new trips). We do not consider this scenario in our adoption ceiling because additional adoption above car adoption would not produce a major climate benefit.
left_text_column_width
Table 6. Adoption ceiling.
Unit: 1,000 electric bicycles
| Adoption ceiling | 2,022,000 |
Unit: 1,000 electric bicycles
| Adoption ceiling | 1,273,000 |
Left Text Column Width
Achievable Adoption
Private electric bicycles are currently in use across the Asia-Pacific region at a rate of approximately 0.07 electric bicycles for every car. A low achievable adoption rate might see every country in the world achieve this same ratio, which would lead to a global electric bicycle fleet of 421 million (Table 7). For a higher rate of adoption, we posit one electric bicycle in use for every two cars. This would see just more than 1 billion electric bicycles in use worldwide.
Using the median and 75th percentile of the ratio of shared electric bicycles to cars (for which we have data) as the rate of adoption seen in every city in the world leads to 22 to 69 million shared electric bicycles in cities worldwide.
Note: We based these estimates on electric bicycles per car rather than electric bicycles per person because the climate impact of electric bicycle adoption in a given place depends on the availability of cars to replace.
left_text_column_width
Table 7. Range of achievable adoption levels.
Unit: 1,000 electric bicycles
| Current Adoption | 277,600 |
| Achievable – Low | 421,300 |
| Achievable – High | 1,011,000 |
| Adoption Ceiling | 2,022,000 |
Unit: 1,000 electric bicycles
| Current Adoption | 2,000 |
| Achievable – Low | 22,010 |
| Achievable – High | 69,260 |
| Adoption Ceiling | 1,273,000 |
Left Text Column Width
If every motorist had an electric bicycle they used to replace at least some car trips), it would mitigate 224 Mt CO₂‑eq/yr – equal to the total global carbon emissions produced by cars, minus the emissions that would be produced due to electric bicycles traveling the same distance. If there were one electric bicycle for every two cars, it would avoid 117 Mt CO₂‑eq/yr. And if global electric bicycle adoption reached the rate currently seen in the Asia-Pacific region (China, India, Japan, South Korea, Australia, and New Zealand), it would avoid 47 Mt CO₂‑eq/yr (Table 8).
Our Achievable – Low scenario of 22 million shared electric bicycles in cities worldwide would save 284 kt CO₂‑eq/yr. Our Achievable – High scenario of 69.3 million shared electric bicycles worldwide would save 895 kt CO₂‑eq/yr. The maximum possible shared electric bicycle deployment would save approximately 16.6 Mt CO₂‑eq/yr.
left_text_column_width
Table 8. Climate impact at different levels of adoption.
Unit: Gt CO₂-eq/yr, 100-yr basis
| Current Adoption | 0.0307 |
| Achievable – Low | 0.0466 |
| Achievable – High | 0.1117 |
| Adoption Ceiling (Physical limit) | 0.2235 |
Unit: Gt CO₂-eq/yr, 100-yr basis
| Current Adoption | 0.00002584 |
| Achievable – Low | 0.0002844 |
| Achievable – High | 0.0008949 |
| Adoption Ceiling (Physical limit) | 0.01645 |
Left Text Column Width
Additional Benefits
Health
Electric assistance reduces the physical fitness and other health benefits of cycling. However, electric bicycles still require pedaling, and studies show that this level of effort required can still have substantial health benefits (Berjisian & Bigazzii, 2019; Langford et al., 2017). Electric bicycles can also enable people to cycle who might not otherwise be able to (Bourne et al., 2020). Additionally, electric bicycles can reduce total car traffic, which could reduce the risk of injury and death from car crashes, which kill 1.2 million people annually (WHO, 2023). Similarly, electric bicycles can reduce health impacts of traffic noise (de Nazelle et al., 2011).
Income & Work
In addition to being cheaper than car travel, electric bicycles allow people to travel farther and faster than they could on foot, on a conventional bicycle, or (often) on public transit. These time and money savings provide an economic benefit (Bourne, 2020).
Air Quality
The fossil fuel–powered vehicles most similar to electric bicycles (motorcycles, scooters, etc.) are extremely polluting (Platt et al., 2014). Substituting electric bicycles for these can substantially reduce air pollution.
Other
Electric bicycles provide quality-of-life benefits for some people who use them (Bourne, 2020; Carracedo & Mostofi, 2022; Teixeira et al., 2022; Thomas, 2022). Electric bicycles can also reduce traffic congestion and save time (Koning & Conway, 2016).
left_text_column_width
Risks
Electric bicycles pose some safety concerns, centering on an ongoing debate over whether electric cyclists ride more recklessly than other cyclists (Fishman & Cherry, 2016; Langford et al., 2015). While electric bicycles have a lower injury rate than conventional bicycles, when injuries do happen during electric bicycle travel the health consequences tend to be more severe due to the higher speed (Berjisian & Bigazzi, 2019). There may also be risks related to the bicycles’ lithium-ion batteries catching fire. Strong regulations can minimize this risk (Pekow, 2024). Improved infrastructure, such as separated bike lanes and paths, can also reduce the safety risks associated with electric bicycles (Roberts, 2020).
left_text_column_width
Interactions with Other Solutions
Reinforcing
Electric bicycles can complement other forms of low-carbon mobility, especially those that reduce dependence on private cars. People who rely on public transit, conventional travel, pedestrian travel, carpools, or other sustainable modes of transportation for some kinds of trips can use electric bicycles to fill in some of the gaps in their personal transportation arrangements (Roberts, 2023). For public transit in particular, electric bicycles can play an important last-mile role, enabling transit riders to more easily access stops. This is important because research suggests that the key to a low-carbon mobility system is to enable people to live high-quality lives without owning cars (Van Acker & Witlox, 2010).
left_text_column_width
Electric bicycles require a lot less space than private cars. If sufficient adoption of electric bicycles and other alternatives to private cars enables a reduction in car lanes, parking spaces, and related infrastructure, then some of this space could be reallocated to ecosystem conservation through revegetation and other land-based methods of GHG sequestration (Rodriguez Mendez et al., 2024).
left_text_column_width
Competing
Electric bicycles compete with electric and hybrid cars for adoption.
left_text_column_width
Dashboard
Solution Basics
1,000 electric bicycles
t CO₂-eq/unit
110.5
units
Current
277,600421,3001.01×10⁶
Achievable (Low to High)
Climate Impact
Gt CO₂-eq/yr
Current 0.03
0.050.11
US$ per t CO₂-eq
-1,748
Gradual
CO₂, CH₄, N₂O
Solution Basics
1,000 electric bicycles
t CO₂-eq/unit
14.44
units
Current
2,00022,01069,260
Achievable (Low to High)
Climate Impact
Gt CO₂-eq/yr
Current 2.58×10⁻⁵
2.84×10⁻⁴8.95×10⁻⁴
US$ per t CO₂-eq
22,860
Gradual
CO₂, CH₄, N₂O
Trade-offs
If an electric bicycle replaces primarily car trips, it provides an unambiguous climate benefit. If it replaces public transit, the size of the benefit will depend on the specifics of the public transit system it replaces. If it replaces pedestrian trips or conventional cycling trips, or generates new trips, the net climate benefit is negative. Travel survey data suggest that electric bicycles replace enough car journeys to more than offset any journeys by the more sustainable modes of transportation they replace (Bigazzi & Wong, 2020; Bourne et al., 2020; Cairns et al., 2017; Fukushige et al., 2021). However, electric bicycles in cities that already have very low-carbon mobility systems, or in lower-income countries where car ownership is rare, might have a net negative climate impact.
Electric bicycles also require batteries, the production and disposal of which generates pollution (Yang et al., 2021). However, electric bicycles require much less battery capacity than many other electrification technologies, such as electric vehicles (Weiss et al., 2015).
left_text_column_width
Mt CO2–eq
0–4
4–8
8–12
12–16
16–20
> 20
No data
Annual road transportation emissions, 2024
Cars are the largest source of road transportation vehicle emissions, which are shown here for urban areas.
Kott, T., Foster, K., Villafane-Delgado, M., Loschen, W., Sicurello, P., Ghebreselassie, M., Reilly, E., and Hughes, M. (2024). Transportation sector - Global road emissions [Data set]. The Johns Hopkins University Applied Physics Laboratory (JHU/APL), Climate TRACE Emissions Inventory. Retrieved March 12, 2025 from https://climatetrace.org
Geographic Guidance Introduction
Electric bicycle effectiveness in mitigating climate change varies by region, depending on the carbon intensity of the charging electricity, the extent to which they replace higher-emission travel (such as cars, motorcycles, or taxis), and the need and type of vehicle used for rebalancing shared electric bicycles (International Transport Forum, 2020). They are most effective in areas with cleaner electricity grids and where they can substitute for cars.
Since electric bicycles are more effective when replacing cars, this means that wider adoption of electric bicycles in car-dependent regions, such as North American suburbs, will have a much more significant climate impact than in a dense, pedestrianized European city center or in a low-income country where most people do not have access to a car (although in these contexts electric bicycles could still produce significant social and economic benefits) (Wamburu et al., 2021).
Socio-economic and infrastructural factors play a major role in adoption. These include upfront costs of private electric bicycles, availability and affordability of shared electric bicycles, supportive cycling infrastructure, and policies such as subsidies or rebates. In many countries, electric bicycles increase the accessibility of nonmotorized transport to older adults, people with disabilities, and those commuting longer distances or in hilly areas by reducing physical effort (Bourne et al., 2020).
Future geographic targets for scaling adoption with strong climate and equity outcomes include South and Southeast Asian cities (e.g., Dhaka, Jakarta, Ho Chi Minh City) with high trip density, short trip lengths, and growing pollution concerns, all of which make them ideal for adoption. Sub-Saharan African cities (e.g., Kampala, Accra) where electric bicycles could complement or replace informal motorcycle taxis, reducing emissions and improving affordability and safety, are also important targets. North America has potential as both private and shared programs are beginning to expand in urban areas, helped by municipal investment and rising consumer interest.
Action Word
Mobilize
Solution Title
Electric Bicycles
Classification
Highly Recommended
Lawmakers and Policymakers
- Establish policies that reduce the associated time, distance, risk, and risk perception for users and potential users.
- Provide financial incentives such as tax breaks, subsidies, or grants for electric bicycle production and purchases.
- Use targeted financial incentives to assist low-income communities in purchasing electric bicycles and to incentivize manufacturers to produce more affordable options.
- Develop local bicycle and charging infrastructure, such as building physically separated bicycle lanes.
- Have locking posts installed in public spaces that can accommodate electric bicycles.
- Increase maintenance of bicycle infrastructure, such as path clearing.
- Create international standards for the manufacturing and classification of electric bicycles.
- Transition fossil fuel electricity production to renewables while promoting the transition to electric bicycles.
- Offer one-stop shops for information on electric and non-motorized bicycles, including demonstrations and educational resources on cost savings, environmental impact, and maintenance.
- Set regulations for sustainable use of electric bicycle batteries and improve recycling infrastructure.
- Join international efforts to promote and ensure supply chain environmental and human rights standards – particularly, for the production of batteries.
- Create, support, or join partnerships that offer information, training, and general support for electric and non-motorized bicycle adoption.
Further information:
- What do we know about pedal assist E-bikes? A scoping review to inform future directions. Jenkins et al. (2022)
- Government relations and public policy job function action guide. Project Drawdown (2022)
- Legal job function action guide. Project Drawdown (2021)
- Pathway towards sustainability or motorization? A comparative study of e-bikes in China and the Netherlands. Sun et al. (2023)
Practitioners
- Share your experiences with electric bicycles, providing tips and reasons for choosing this mode of transportation..
- Participate in local bike groups, public events, and volunteer opportunities.
- Advocate tor local officials for infrastructure improvements and note specific locations where improvements can be made.
- Encourage local businesses to create employee incentives.
- Provide information and resources to help individuals, households, and business owners take advantage of state and local tax benefits or rebates for electric bicycle purchases.
Further information:
- 5 ways to boost community engagement in bike advocacy. Aguilera et al. (2023)
- Cyclist crash rates and risk factors in a prospective cohort in seven European cities. Branion-Calles et al. (2020).
- How to achieve a walking and cycling transformation in your city. C40 Cities Climate Leadership Group (2019)
- Attributes of a bicycle friendly business. The League of Bicycle Friendly America (n.d.)
- How to develop a non‑motorised transport strategy or policy. United Nations Environment Programme (2019)
- Promotion of non-motorised transport. United Nations Environment Programme et al. (2016)
- Improving non-motorized transportation provision in a socially inclusive way—the case of Cape Town. Vanderschuren et al. (2022)
Business Leaders
- Advocate for better cycling infrastructure and sharing systems with city officials.
- Educate customers about local bicycle infrastructure and encourage them to engage public officials.
- Offer employees who agree to forgo a free parking space the annualized cash value or cost of that parking space as a salary increase.
- Provide battery recycling services.
- Offer free classes for electric bicycle maintenance and repair; educate employees about what they should know before purchasing an electric bicycle.
- Install locking posts, parking, and security for electric bicycles.
- Provide adequate onsite storage and charging, create educational materials on best practices for commuting, and offer pre-tax commuter benefits to encourage employee ridership.
- Encourage electric bicycle use in company fleets by replacing or supplementing vehicles for local deliveries or transiting between office locations.
- Incorporate electric bicycle programs into company sustainability and emission reduction initiatives;communicate how those programs support broader company goals.
Further information:
- Removable, replaceable and repairable batteries report. European Environmental Bureau (2021)
- How bicycle retailers can help grow ridership: foster the community. PeopleForBikes (2019)
- Climate solutions at work. Project Drawdown (2021)
- Drawdown-aligned business framework. Project Drawdown (2021)
- Attributes of a bicycle friendly business. The League of Bicycle-Friendly America (2019)
Nonprofit Leaders
- Inform the public about the health and environmental benefits of electric bicycles.
- Educate the public on government incentives for electric bicycles and how to take advantage of them.
- Provide impartial information on local electric bicycle infrastructure, best practices for maintenance, and factors to consider when renting or buying electric bicycles.
- Advocate to policymakers for improved infrastructure and incentives.
- Administer public initiatives such as ride-share or buy-back programs.
Further information:
- How nonprofits can help expand access to e-mobility. Cloe (2022)
- Climate solutions at work. Project Drawdown (2021)
- Drawdown-aligned business framework. Project Drawdown (2021)
- For advocates. The League of Bicycle-Friendly America (2019)
Investors
- Invest in electric bicycle companies and start-ups, including battery and component suppliers.
- Explore investment opportunities that address supply chain issues such as battery suppliers and maintenance providers.
- Invest in companies conducting R&D to improve electric bicycle performance, decrease the need for materials, and reduce maintenance costs.
- Invest in public or private electric bicycle sharing systems.
- Finance electric bicycle purchases via low-interest loans.
- Invest in charging infrastructure for electric bicycles.
Further information:
- Electric bicycle market size, share, competitive landscape and trend analysis 2022 - 2031. Allied Market Research (2022)
- Electric bike market size, share & industry analysis, by propulsion type. Fortune Business Insights (2025)
- U.S. e-bike market size, share & trends analysis report by propulsion type, by drive type, by application, by battery, by end-use (personal, commercial), and segment forecasts, 2023 - 2030. Grand View Research (2023)
- Electric bicycle market insights from industry experts. People for Bikes (2024)
Philanthropists and International Aid Agencies
- Award grants to local organizations advocating for improved bicycle infrastructure and services.
- Support access through the distribution or discounting of electric bicycles and help educate community members about relevant incentives.
- Strengthen local infrastructure and build local capacity for infrastructure design and construction.
- Ensure that donated bicycles are appropriate for the environment and that recipients have access to maintenance and supplies.
- Sponsor community engagement programs such as group bike rides or free maintenance classes.
- Assist with local policy design.
Further information:
- Bicycle superhighway: An environmentally sustainable policy for urban transport. Agarwal, A. et al. (2020).
- “The bike breaks down. What are they going to do?” Actor-networks and the Bicycles for Development movement. McSweeney et al. (2020)
- For advocates. The League of Bicycle-Friendly America (2019)
- How to develop a non‑motorised transport strategy or policy. United Nations Environment Programme (2019)
Thought Leaders
- Lead by example and use an electric bicycle as a regular means of transport.
- Focus public messages on key decision factors for commuters, such as associated health and fitness benefits, climate and environmental benefits, weather forecasts, and traffic information.
- Showcase principles of safe urban design and highlight dangerous areas.
- Share detailed information on local bike routes, general electric bicycle maintenance tips, items to consider when purchasing a bike, and related educational information.
- Collaborate with schools to teach bicycle instruction, including safe riding habits and maintenance tips.
Further information:
- Influencing transport behaviour: A Bayesian modelling approach for segmentation of social surveys. Dawkins et al. (2018)
- Active mobility versus motorized transport? User choices and benefits for the society. Pisoni et al. (2021)
- Improving non-motorized transportation provision in a socially inclusive way—the case of Cape Town. Vanderschuren et al. (2022)
Technologists and Researchers
- Examine and improve elements of battery design and maintenance.
- Improve electric bicycle infrastructure design.
- Improve circularity, repairability, and ease of disassembly for electric bicycles.
- Increase the physical carrying capacities for users of electric bicycles to facilitate shopping and transporting children, pets, and materials.
- Improve other variables that increase the convenience, safety, and comfort levels of nonmotorized transportation.
Further information:
- Cyclist crash rates and risk factors in a prospective cohort in seven European cities. Branion-Calles et al. (2020)
- How to achieve a walking and cycling transformation in your city. C40 Cities Climate Leadership Group (2019)
- How to develop a non‑motorised transport strategy or policy. United Nations Environment Programme (2019)
- Promotion of non-motorised transport. United Nations Environment Programme et al. (2016)
- Improving non-motorized transportation provision in a socially inclusive way—the case of Cape Town. Vanderschuren et al. (2022)
Communities, Households, and Individuals
- Share your experiences with electric bicycles; provide tips and reasons for choosing this mode of transportation.
- Participate in local bike groups, public events, and volunteer opportunities.
- Advocate to employers and local businesses to provide incentives for electric bicycle usage and help start local initiatives.
- Advocate to local officials for infrastructure improvements and note specific locations where improvements can be made.
- Encourage local businesses to create employee incentives.
Further information:
- 5 ways to boost community engagement in bike advocacy. Aguilera et al. (2023)
- Cyclist crash rates and risk factors in a prospective cohort in seven European cities. Branion-Calles et al. (2020)
- How to achieve a walking and cycling transformation in your city. C40 Cities Climate Leadership Group (2019)
- Attributes of a bicycle friendly business. The League of Bicycle Friendly America (n.d.)
- How to develop a non‑motorised transport strategy or policy. United Nations Environment Programme (2019)
- Promotion of non-motorised transport. United Nations Environment Programme et al. (2016)
- Improving non-motorized transportation provision in a socially inclusive way—the case of Cape Town. Vanderschuren et al. (2022)
Sources
- Bicycle superhighway: an environmentally sustainable policy for urban transport. Agarwal et al. (2020)
- 5 ways to boost community engagement in bike advocacy. Aguilera et al. (2023)
- Cyclist crash rates and risk factors in a prospective cohort in seven European cities. Branion-Calles et al. (2020)
- How to achieve a walking and cycling transformation in your city. C40 Knowledge (2019)
- Influencing transport behaviour: a Bayesian modelling approach for segmentation of social surveys. Dawkins et al. (2018)
- What do we know about pedal assist E-bikes? A scoping review to inform future directions. Jenkins et al. (2022)
- “The bike breaks down. What are they going to do?” Actor-networks and the Bicycles for Development movement. McSweeney et al. (2020)
- Active mobility versus motorized transport? User choices and benefits for the society. Pisoni et al. (2021)
- Pathway towards sustainability or motorization? A comparative study of e-bikes in China and the Netherlands. Sun et al. (2023)
- How to develop a non‑motorised transport strategy or policy. United Nations Environment Programme et al. (2019)
- Promotion of non-motorised transport. United Nations Environment Programme et al. (2016)
- Improving non-motorized transportation provision in a socially inclusive way—the case of Cape Town. Vanderschuren et al. (2022)
Evidence Base
Consensus of effectiveness in reducing emissions: High
When people purchase electric bicycles, they tend to use them often, with many of the trips they take on electric bicycles replacing trips that would otherwise have been taken via private car (Bigazzi & Wong, 2020; Bourne et al., 2020; Cairns et al., 2017; Fukushige et al., 2021). The evidence is similarly conclusive regarding the ability of shared electric bicycles to replace a large number of car trips. However, evidence regarding the carbon benefits of shared electric bicycles is more mixed due to the additional emissions required to run a shared electric-bicycle system.
Berjiisian and Bigazzi (2019) reviewed much of the literature on electric bicycles. and found that electric bicycle trips are shifted from car trips (44%) and transit trips (12%) providing significant emissions benefits. Other net benefits include less travel by cars, lower GHG emissions and more physical activity. “E-bike adoption is expected to provide net benefits in the forms of reduced motor vehicle travel, reduced greenhouse gas emissions, and increased physical activity. A little more than half of e-bike trips are expected to shift travel from motor vehicles (44% car trips and 12% transit trips), which is sufficient to provide significant emissions benefits.”
Weiss et al. (2015) surveyed evidence of the economic, social, and environmental impacts of electric bicycles. They found that electric bicycles are more efficient and less polluting than cars. They reduce exposure to pollution as their environmental impacts come mainly from being produced and the electricity that they use, both of which are usually outside of urban areas.
Philips et al. (2022) investigated the potential for electric bicycles to replace car trips in the UK. Their geospatial model provided a good indication of what might be possible in other places and showed that electric bicycles have considerable potential in rural areas as well as urban ones.
Li et al. (2023) reported that based on the mix of mode share replaced, shared electric bicycle trips decreased carbon emissions by 108–120 g/km carbon emissions than fossil fuel-powered cars per kilometer.”
This research is biased toward high-income countries. While there is substantial research on electric bicycles in China, that country often considers e-scooters (which do not have pedals) and throttle-assisted electric bikes as interchangeable with pedelecs electric bicycles. This made it hard to include Chinese research in our analysis. We recognize this limited geographic scope creates bias, and hope this work inspires research harmonization and data sharing on this topic in underrepresented regions in the future.
left_text_column_width
Updated Date
Enhance Public Transit
Sector
Transportation
Mode
Cut Emissions
Cluster
Shift to Alternatives
Image
Image
Coming Soon
Off
Summary
We define the Enhance Public Transit solution as increasing the use of any form of passenger transportation that uses publicly available vehicles (e.g., buses, streetcars, subways, commuter trains, and ferries) operating along fixed routes. It does not include increasing the use of publicly available forms of transportation without fixed routes, such as taxis, except when these transport options supplement a larger public transit system (for example, to help passengers with disabilities). It also does not include increasing the use of vehicles traveling over long distances, such as intercity trains, intercity buses, or aircraft. The cost per climate unit is the cost to the transit provider, not the passenger.
Overview
Public transit vehicles are far more fuel-efficient – and thus less GHG-intensive – on a per-pkm basis than fossil fuel–powered cars. Diesel-powered buses emit fewer GHGs/pkm than cars because of their much higher occupancy. Electric buses further reduce GHG emissions (Bloomberg New Energy Finance, 2018), as do forms of public transit that already run on electricity. Finally, a fleet of large, centralized public transit vehicles operating along fixed routes is usually easier to electrify than a fleet of fossil fuel–powered cars.
Enhancing public transit to reduce emissions from transportation relies on two processes. First is increasing the modal share of existing public transit networks by encouraging people to travel by public transit rather than car. This requires building new public transit capacity while also overcoming political, sociocultural, economic, and technical hurdles. Second is improving the emissions performance of public transit networks through electrification and efficiency improvements. We accommodate the latter in this solution by assuming that all shifted trips to buses are electric buses.
These two processes are linked in complex ways. For example, construction of the new public transit networks needed to accommodate additional demand creates an opportunity to install low-carbon vehicles and infrastructures, and bringing additional passengers onto an underused public transit network generates close to zero additional GHG emissions. However, since these complexities are difficult to calculate, we assume that all increases in public transit ridership are supported by a linear increase in capacity.
Buses, trains, streetcars, subways, and other public-transit vehicles predate cars. During the 19th century, most cities developed complex and efficient networks of streetcars and rail that carried large numbers of passengers (Norton, 2011; Schrag, 2000). As a result, it’s clear that a good public transit network can provide for the basic mobility needs of most people, and can therefore substitute for most – if not all – transportation that fossil fuel–powered cars currently provide. Today, public transit networks worldwide already collectively deliver trillions of pkm, not only in big cities but also in small towns and rural areas.
We identified several different types of public transit:
Buses
Low-capacity vehicles running on rubber tires on roads. Buses in the baseline are a mix of diesel and electric. For the purposes of this solution, we assume that all buses serving shifted trips are electric.
Trams or streetcars
Mid-capacity vehicles running on steel rails that for at least part of their routes run on roads with traffic, rather than in a dedicated rail corridor or tunnel.
Metros, subways, or light rail
High-capacity urban train systems using their own dedicated right-of-way that may or may not be underground.
Commuter rail
Large trains running mostly on the surface designed to bring large numbers of commuters from the suburbs into the core of a city that often overlap with regional or intercity rail.
Other modes
Ferries, cable cars, funiculars, and other forms of public transit that generally play a marginal role.
We assessed all modes together rather than individually because public transit relies on the interactions among different vehicles to maximize the reach, speed, and efficiency of the system. Public transit reduces emissions of CO₂, methane, and nitrous oxide to the atmosphere by replacing fuel-powered cars, which emit these gases from their tailpipes. Some diesel-powered buses in regions that have low quality diesel emit black carbon. The black carbon global annual total emissions from transportation is negligible compared with carbon emissions and is therefore not quantified in our study.
References
American Public Transit Association. (2020). Economic impact of public transportation investment – American Public Transportation Association. https://www.apta.com/research-technical-resources/research-reports/economic-impact-of-public-transportation-investment/
American Public Transit Association. (2021). National Transit Database Tables. American Public Transportation Association. https://www.apta.com/research-technical-resources/transit-statistics/ntd-data-tables/
Bloomberg New Energy Finance. (2018). Electric buses in cities: Driving towards cleaner air and lower CO₂ .
Börjesson, M., Fung, C. M., & Proost, S. (2020). How rural is too rural for transit? Optimal transit subsidies and supply in rural areas. Journal of Transport Geography, 88, 102859. https://doi.org/10.1016/j.jtrangeo.2020.102859
Brown, A. E. (2017). Car-less or car-free? Socioeconomic and mobility differences among zero-car households. Transport Policy, 60, 152–159. https://doi.org/10.1016/j.tranpol.2017.09.016
Brunner, H., Hirz, M., Hirschberg, W., & Fallast, K. (2018). Evaluation of various means of transport for urban areas. Energy, Sustainability and Society, 8(1), 9. https://doi.org/10.1186/s13705-018-0149-0
Christensen, L., & Vázquez, N. S. (2013). Post-harmonised European National Travel Surveys. Proceedings from the Annual Transport Conference at Aalborg University, 20(1), Article 1. https://doi.org/10.5278/ojs.td.v1i1.5701
Department for Transport. (2024). Transport Statistics Finder: Interactive Dashboard. Department for Transport. https://app.powerbi.com/view?r=eyJrIjoiMGE2YTQ5YTMtMDkwNC00MjBmLWFkNjUtMjBjZjUzZWU0ZjNmIiwidCI6IjI4Yjc4MmZiLTQxZTEtNDhlYS1iZmMzLWFkNzU1OGNlNzEzNiIsImMiOjh9
Ecke, L. (2023, December 19). German Mobility Panel—Startseite (KIT) [Text]. Lisa Ecke. https://mobilitaetspanel.ifv.kit.edu/english/
Federal Highway Administration. (2022). Summary of Travel Trends: 2022 National Household Travel Survey. US Department of Transportation. https://nhts.ornl.gov/assets/2022/pub/2022_NHTS_Summary_Travel_Trends.pdf
Goel, D., & Gupta, S. (2017). The Effect of Metro Expansions on Air Pollution in Delhi. The World Bank Economic Review, 31(1), 271–294. https://doi.org/10.1093/wber/lhv056
Gouldson, A., Sudmant, A., Khreis, H., & Papargyropoulou, E. (2018). The Economic and Social Benefits of Low-Carbon Cities: A Systematic Review of the Evidence. https://urbantransitions.global/en/publication/the-economic-and-social-benefits-of-low-carbon-cities-a-systematic-review-of-the-evidence/
Guo, S., & Chen, L. (2019). Can urban rail transit systems alleviate air pollution? Empirical evidence from Beijing. Growth and Change, 50(1), 130–144. https://doi.org/10.1111/grow.12266
Health Affairs. (2021). Public Transportation in the U.S. RWJF. https://www.rwjf.org/content/rwjf-web/us/en/insights/our-research/2021/07/public-transportation-in-the-us-a-driver-of-health-and-equity.html
Hemmat, W., Hesam, A. M., & Atifnigar, H. (2023). Exploring noise pollution, causes, effects, and mitigation strategies: A review paper. European Journal of Theoretical and Applied Sciences, 1(5), Article 5. https://doi.org/10.59324/ejtas.2023.1(5).86
Ilie, N., Iurie, N., Alexandr, M., & Vitalie, E. (2014). Rehabilitation of the tram DC traction with modern power converters. 2014 International Conference and Exposition on Electrical and Power Engineering (EPE), 704–709. https://doi.org/10.1109/ICEPE.2014.6970000
International Transport Forum. (2020). Good to Go? Assessing the Environmental Performance of New Mobility (Corporate Partnership Board). OECD. https://www.itf-oecd.org/sites/default/files/docs/environmental-performance-new-mobility.pdf
IPCC. (2023). Renewable Energy Sources and Climate Change Mitigation—IPCC. https://www.ipcc.ch/report/renewable-energy-sources-and-climate-change-mitigation/
Kennedy, C. A. (2002). A comparison of the sustainability of public and private transportation systems: Study of the Greater Toronto Area. Transportation, 29(4), 459–493. https://doi.org/10.1023/A:1016302913909
Kuminek, T. (2013). Energy Consumption in Tram Transport. Logistics and Transport. https://www.semanticscholar.org/paper/Energy-Consumption-in-Tram-Transport-Kuminek/2aa2d97130a8e51ea7f64913c2065e8437126774
Lim, L. K., Muis, Z. A., Hashim, H., Ho, W. S., & Idris, M. N. M. (2021). Potential of Electric Bus as a Carbon Mitigation Strategies and Energy Modelling: A Review. Chemical Engineering Transactions, 89, 529–534. https://doi.org/10.3303/CET2189089
Lovasi, G. S., Treat, C. A., Fry, D., Shah, I., Clougherty, J. E., Berberian, A., Perera, F. P., & Kioumourtzoglou, M.-A. (2023). Clean fleets, different streets: Evaluating the effect of New York City’s clean bus program on changes to estimated ambient air pollution. Journal of Exposure Science & Environmental Epidemiology, 33(3), 332–338. https://doi.org/10.1038/s41370-022-00454-5
Litman, T. (2024). Evaluating Public Transit Benefits and Costs.
Loukaitou-Sideris, A. (2014). Fear and safety in transit environments from the women’s perspective. Security Journal, 27(2), 242–256. https://doi.org/10.1057/sj.2014.9
Mahmoud, M., Garnett, R., Ferguson, M., & Kanaroglou, P. (2016). Electric buses: A review of alternative powertrains. Renewable and Sustainable Energy Reviews, 62, 673–684. https://doi.org/10.1016/j.rser.2016.05.019
Mees, P. (2010). Transport for Suburbia: Beyond the Automobile Age. Earthscan.
Norton, P. D. (2011). Fighting Traffic: The Dawn of the Motor Age in the American City. MIT Press.
Ortiz, F. (2002). Biodiversity, the City, and Sprawl. Boston University Law Review, 82(1), 145–194.
Padeiro, M., Louro, A., & da Costa, N. M. (2019). Transit-oriented development and gentrification: A systematic review. Transport Reviews, 39(6), 733–754. https://doi.org/10.1080/01441647.2019.1649316
Prieto-Curiel, R., & Ospina, J. P. (2024). The ABC of mobility. Environment International, 185, 108541. https://doi.org/10.1016/j.envint.2024.108541
Qi, Y., Liu, J., Tao, T., & Zhao, Q. (2023). Impacts of COVID-19 on public transit ridership. International Journal of Transportation Science and Technology, 12(1), 34–45. https://doi.org/10.1016/j.ijtst.2021.11.003
Rodrigues, A. L. P., & Seixas, Sonia. R. C. (2022). Battery-electric buses and their implementation barriers: Analysis and prospects for sustainability. Sustainable Energy Technologies and Assessments, 51, 101896. https://doi.org/10.1016/j.seta.2021.101896
Rodriguez Mendez, Q., Fuss, S., Lück, S., & Creutzig, F. (2024). Assessing global urban CO₂ removal. Nature Cities, 1(6), 413–423. https://doi.org/10.1038/s44284-024-00069-x
Schaller, B. (2017). Unsustainable? The Growth of App-Based Ride Services and Traffic, Travel and the Future of New York City. Schaller Consulting.
Schrag, Z. M. (2000). “The Bus Is Young and Honest”: Transportation Politics, Technical Choice, and the Motorization of Manhattan Surface Transit, 1919-1936. Technology and Culture, 41(1), 51–79.
Sertsoz, M., Kusdogan, S., & Altuntas, O. (2013). Assessment of Energy Efficiencies and Environmental Impacts of Railway and Bus Transportation Options. In I. Dincer, C. O. Colpan, & F. Kadioglu (Eds.), Causes, Impacts and Solutions to Global Warming (pp. 921–931). Springer. https://doi.org/10.1007/978-1-4614-7588-0_48
Statistics Netherlands. (2024, July 4). Mobility; per person, personal characteristics, modes of travel and regions [Webpagina]. Statistics Netherlands. https://www.cbs.nl/en-gb/figures/detail/84709ENG
UITP. (2024). A global analysis of transit data. CityTransit Data. https://citytransit.uitp.org
US Department of Transportation. (2010). Public transportation’s role in responding to climate change. US Department of Transportation. https://www.transit.dot.gov/sites/fta.dot.gov/files/docs/PublicTransportationsRoleInRespondingToClimateChange2010.pdf
Van Acker, V., & Witlox, F. (2010). Car ownership as a mediating variable in car travel behaviour research using a structural equation modelling approach to identify its dual relationship. Journal of Transport Geography, 18(1), 65–74. https://doi.org/10.1016/j.jtrangeo.2009.05.006
Credits
Lead Fellow
Cameron Roberts
Contributors
Ruthie Burrows
James Gerber
Yusuf Jameel
Daniel Jasper
Heather Jones
Alex Sweeney
Internal Reviewers
Aiyana Bodi
Hannah Henkin
Ted Otte
Amanda Smith
Tina Swanson
Effectiveness
Our calculations suggest that an efficiently designed public transit system using the best available vehicle technologies (especially battery-electric buses) would save 58.26 t CO₂‑eq /million pkm (0.000058 t CO₂‑eq /pkm) on a 100-yr basis compared with fossil fuel–powered cars, in line with the estimates by other large transportation focused organizations (International Transport Forum, 2020; US Department of Transportation, 2010). This number is highly sensitive to public transit vehicle occupancy, which we estimated using the most recent available data (American Public Transit Association, 2021). Increasing the number of trips taken via public transit would likely increase occupancy, although ideally not to the point of passenger discomfort. This elevated ridership would significantly reduce public transit’s pkm emissions.
To arrive at this figure, we first estimated the emissions of fossil fuel–powered cars as 115 t CO₂‑eq /million pkm (0.000115 t/pkm, 100-yr basis). We then separately calculated the emissions of commuter rail, metros and subways, trams and light rail systems, and electric buses. We used data on the modal share of different vehicles within public transit systems around the world (although much of the available data are biased towards systems in the United States and Europe) to determine what each transit system’s emissions would be per million pkm given our per-million-pkm values for different transit vehicles (UITP, 2024). The median of these city-level values is 58 t CO₂‑eq /pkm (0.000058 t/pkm, 100-yr basis). Subtracting this value from the per-pkm emissions for cars gives us the public transit GHG savings figure cited above. Note that none of these values includes embodied emissions (such as emissions from producing cars, buses, trains, roads, etc.), or upstream emissions (such as those from oil refineries).
Pessimistic assumptions regarding the emissions and occupancy of public transit vehicles, and optimistic assumptions about emissions from cars, can suggest a much more marginal climate benefit from public transit (see the 25th percentile row in Table 1). In most cases, however, well-managed public transit is likely to produce a meaningful climate benefit. Such an outcome will depend on increasing the average occupancy of vehicles, which faces a challenge because transit has seen declining occupancies since the COVID-19 pandemic (Qi et al., 2023). For this reason, encouraging additional use of public transit networks without expanding these networks can have an outsized impact because it will allow the substitution of fossil fuel–powered car trips by trips on public transit vehicles for which emissions would not change meaningfully as a result of adding passengers.
left_text_column_width
Table 1. Effectiveness at reducing emissions.
Unit: t CO₂‑eq/million pkm, 100-yr basis
| 25th percentile | 0.127 |
| mean | 61.76 |
| median (50th percentile) | 58.27 |
| 75th percentile | 106.7 |
The extremely large range of values between the 25th and 75th percentile is the result of 1) the large diversity of public transit systems in the world and 2) multiplying multiple layers of uncertainty (e.g., varying estimates for occupancy, energy consumption per vehicle kilometer (vkm), percent of pkm reliant on buses vs. trains).
Left Text Column Width
Cost
Under present-day public transit costs and revenues, it costs the transit provider US$0.23 to transport a single passenger one kilometer. In comparison, travel by car costs the consumer US$0.42/pkm. On a per passenger basis, for the transit provider, public transit is almost 50% cheaper than car transportation, costing US$0.20/pkm less. Combined with the emissions reductions from using public transit, this means that the emissions reductions from shifting people out of cars onto public transit has a net negative cost, saving US$3,300/t CO₂‑eq mitigated (Table 2).
This figure includes all relevant direct costs for travel by public transit and by car, including the costs of infrastructure, operations, vehicle purchase, and fuel. It does not include external costs, such as medical costs resulting from car crashes. Capital costs (i.e., the large fixed costs of building public transit infrastructure) are accounted for via the annualized capital costs listed in public transit agencies’ financial reports.
A very large proportion of the total costs of providing public transit is labor (e.g., wages for bus drivers and station attendants). This cost is unlikely to come down as a result of technological innovations (Bloomberg New Energy Finance, 2018).
For an individual passenger, however, the marginal costs of public transit (i.e., the fares they pay) can sometimes be higher than the marginal costs of driving. This is in large part due to many external costs of driving which are borne by society at large (Litman, 2024). However, increasing the public transit availability would likely increase occupancy, which would in turn drive costs down.
left_text_column_width
Table 2. Cost per unit of climate impact.
Unit: 2023 US$/t CO₂‑eq , 100-yr basis
| median | -3300 |
Transit provider cost, not passenger cost.
Left Text Column Width
Learning Curve
Public transit is a largely mature technology with limited opportunities for radical cost-saving innovation. While our research did not find any papers reporting a learning curve in public transit as a whole, battery-electric buses are in fact subject to many of the same experience effects of other battery-electric vehicles. Although there are no studies assessing declines in the cost of electric buses as a whole, there are studies assessing learning curves for their batteries, which is the most costly component. The cost of batteries used in battery-electric buses has declined 19.25% with each doubling of installed capacity (Table 3).
left_text_column_width
Table 3. Learning rate: drop in cost per doubling of the installed solution base.
Unit: %
| 25th percentile | 18.63 |
| mean | 19.25 |
| median (50th percentile) | 19.25 |
| 75th percentile | 19.88 |
This applies only to the cost of batteries in electric buses, not to public transportation as a whole.
Left Text Column Width
Speed of Action
Speed of action refers to how quickly a climate solution physically affects the atmosphere after it is deployed. This is different from speed of deployment, which is the pace at which solutions are adopted.
At Project Drawdown, we define the speed of action for each climate solution as gradual, emergency brake, or delayed.
Enhance Public Transit is a GRADUAL climate solution. It has a steady, linear impact on the atmosphere. The cumulative effect over time builds as a straight line.
left_text_column_width
Caveats
Public transit competes for passengers not just with cars, but also with other transportation modes – some of which have lower emissions on average. If an increase in public transit’s modal share comes at the expense of nonmotorized transportation (i.e., pedestrian travel or cycling), or electric bicycles, this will result in a net increase in emissions. Similarly, public transit could generate additional trips that would not have occurred if the public transit network those trips were taken on did not exist. Under this scenario, a net increase in emissions would occur; however, these new trips might bring additional social benefits that would outweigh these new emissions.
Low occupancy could also diminish the climate benefit of enhancing public transit. While it is certainly possible to build effective and efficient public transit networks in suburban and rural areas, there is a risk that such networks could have high per-pkm GHG emissions if they have low average occupancy (Mees, 2010). It is therefore important to efficiently plan public transit networks, ensure vehicles are right-sized and have efficient powertrains, and promote high levels of ridership even in rural areas to maximize the climate benefit of these kinds of networks.
Upscaling public transit networks – and, crucially, convincing more motorists to use them – is an enduring challenge that faces cultural resistance in some countries, issues with cost, and sometimes a lack of political will. Successfully enhancing public transit will require that these hurdles are overcome.
left_text_column_width
Current Adoption
In cities around the world surveyed over the last 15 years, public transit has an average modal share of approximately 26.2% of trips. In comparison, fossil fuel–powered cars account for 51.4% of all trips, while nonmotorized transportation accounts for 22.4% (Prieto-Curiel & Ospina, 2024). The 26.2% of trips taken via public transit corresponds to approximately 16.7 trillion pkm traveled on public transit in cities every year (Table 4).
These numbers are calculated from modal share data (i.e., the percentage of trips in a given city that are taken via various modes of transportation). We estimated total pkm traveled by assuming a global average daily distance traveled, using travel surveys from the United States as well as several European countries (Christensen & Vázquez, 2013; Department for Transport, 2024; Ecke, 2023; Federal Highway Administration, 2022; Statistics Netherlands, 2024). We used Prieto-Curiel and Ospina’s (2024) global population-weighted mean modal share as our global adoption value. The other statistical measures in Table 4 reflect the distribution of estimates drawn from the literature, most of which do not account for population, and therefore give too much weight to small cities, skewing the results.
We assumed that Prieto-Curiel and Ospina’s data refers only to urban modal share. While the database does include some small towns and rural areas, most of the modal share data we found comes from cities. Public transit can be useful in rural areas (Börjesson et al, 2020), but we did not attempt to estimate rural public transit adoption in this assessment .
left_text_column_width
Table 4. Current (2024) adoption level.
Unit: million pkm/yr
| 25th percentile | 512,900 |
| Population-weighted mean | 16,720,000 |
| median (50th percentile) | 5,106,000 |
| 75th percentile | 15,080,000 |
We used the population-weighted mean calculated by Prieto-Curiel and Ospina (2024) as our authoritative estimate to carry forward to other calculations.
Left Text Column Width
Adoption Trend
Based on data from Prieto-Curiel and Ospina (2024) and the UITP (2024) for 1,097 cities worldwide, the rate of adoption of public transit has not changed since 2010, with the median annual growth rate equal to 0 (Table 5). This was calculated using all of the cities in Prieto-Curiel and Ospina’s (2024) database for which modal share data exist.
Despite the lack of a global trend in public transit use, some cities, including Amsterdam, Edinburgh, and Leeds, report double-digit growth rates in the use of public transit.
left_text_column_width
Table 5. 2023–2024 adoption trend.
Unit: million pkm/yr
| 25th percentile | -697,100 |
| mean | 71,490 |
| median (50th percentile) | 0.00 |
| 75th percentile | 1,791,000 |
Left Text Column Width
Adoption Ceiling
Public transit could theoretically replace all trips currently undertaken by fossil fuel–powered cars. This would amount to 75 trillion pkm on public transit annually, worldwide (Table 6). This would not be feasible to achieve in practice, as it would require construction of new public transit vehicles and infrastructure on an unfeasibly large scale, and massive changes to living patterns for many people. It would also be much more expensive than we calculated above, because such a change would require extending public transit coverage into areas where it would be highly uneconomic. Public transit is capable of providing a good transportation option in rural areas, but there is a limit to its benefits when population densities are low even by rural standards. Even in cities, this scenario would require a radical redesign of some neighborhoods to prioritize public transit. Such large public transit coverage would also inevitably shift other modes of transportation, such as pedestrian travel and cycling, leading to an even higher pkm total than that suggested by current adoption of fossil fuel–powered cars.
left_text_column_width
Table 6. Adoption ceiling.
Unit: million pkm/yr
| median (50th percentile) | 75,000,000 |
Left Text Column Width
Achievable Adoption
The achievable range of public transit adoption is 22.2–41.9 trillion pkm traveled by public transit in cities globally.
To estimate the upper bound of achievable adoption, we assumed that urban trips taken by fossil fuel–powered car (currently 51.4% of trips globally) can be shifted to public transit until public transit increases to 76.6% of trips (the current highest modal share of public transit in any city with a population of more than 1 million) or until car travel decreases to 12.0% of trips (the current lowest modal share of fossil fuel–powered cars in any city with a population of more than 1 million). This equals a shift of 25.2 trillion pkm from fossil fuel–powered car travel to public transit, which, added to present-day public transit trips (16.7 trillion trips/yr), equals 41.9 trillion pkm/yr (Table 7).
To set the lower bound, we performed the same calculation as above, but on a regional basis, adding up all the resultant modal shifts to get a global figure. For example, every northern European city might reach the public transit modal share of London (44.5% of trips), while every South Asian city might reach that of Mumbai (52.0% of trips). Having done that, we then added together the public transit adoption rates from all world regions, apart from three (Polynesia, Micronesia, and Melanesia) for which we did not find any modal share data. This corresponds to a shift of 5.5 trillion pkm/yr from cars to public transit, and a total achievable public transit adoption rate of 22.2 trillion pkm/yr.
Achieving both of these levels of adoption would require not only major investments in expanding public transit networks, but also major changes in how cities are planned so as to allow more areas to be effectively served by transit. These levels of adoption would also require overcoming cultural and political resistance to abandoning cars in favor of public modes. However, unlike the scenario discussed under Adoption Ceiling, these scenarios are feasible, since they are based on real achievements by cities around the world.
left_text_column_width
Table 7. Range of achievable adoption levels.
Unit: million pkm/yr
| Current Adoption | 16,720,000 |
| Achievable – Low | 21,980,000 |
| Achievable – High | 41,910,000 |
| Adoption Ceiling | 75,000,000 |
Left Text Column Width
If all public transit trips were taken by fossil fuel–powered cars instead of by public transit, they would result in an additional 0.97 Gt CO₂‑eq/yr of emissions (Table 8).
The global potential climate impact of enhancing public transit, if all car trips were shifted onto public transit systems, is 4.37 Gt. As discussed under Adoption Ceiling, this is an unrealistic scenario.
In a more realistic scenario, if every city in the world shifted car traffic onto public transit until it reached the public transit modal share of Hong Kong (i.e., the high estimate of achievable adoption), it would save 2.44 Gt CO₂‑eq/yr globally. Meanwhile, if every city shifts car trips to public transit until it reaches the car modal share of the region’s least car-dependent city (i.e., the low estimate of achievable adoption), it would save 1.28 Gt CO₂‑eq/yr.
left_text_column_width
Table 8. Climate impact at different levels of adoption.
Unit: Gt CO₂‑eq/yr, 100-yr basis
| Current Adoption | 0.97 |
| Achievable – Low | 1.28 |
| Achievable – High | 2.44 |
| Adoption Ceiling | 4.37 |
Left Text Column Width
Additional Benefits
Air Quality
GHG emissions from transportation are often emitted with other harmful air pollutants. Consequently, reducing fuel consumption by replacing transport by fossil fuel–powered cars with public transit can lead to cleaner air. The scale of this benefit varies by location and is influenced by differences in emission levels between private and public transit travels and the relative demand substitutability between modes (Beaudoin et al., 2015). For U.S. cities, significant investment in public transit could cut pollution around 1.7% on average (Borck, 2019). The benefits are more significant in low- and middle-income countries, where fossil fuel–powered cars are more polluting due to lenient air quality regulations (Goel & Gupta, 2017; Guo & Chen, 2019).
Health Benefits
Improved air quality due to enhanced public transit has direct health benefits, such as lowering cardiovascular disease risk, and secondary health benefits, such as increased physical activity (Xiao et al., 2019), fewer traffic-related injuries, lower rates of cancer, and enhanced access to health-care facilities and nutritious food (Gouldson et al., 2018; Health Affairs, 2021).
Equality
Limited access to transportation restricts labor participation, particularly for women. Expanding public transit can foster gender equity by improving women’s access to employment opportunities. For example, in Peru expansion of public transit has led to improvements in women’s employment and earnings (Martinez et al., 2020). Similarly, in India, the extension of the light rail system in Delhi has increased women’s willingness to commute for work (Tayal & Mehta, 2021).
Public transit enhances community connectivity by providing accessible transportation options. Expanded mobility allows individuals to reach employment, health-care, education, and recreational sites with greater ease, heightening social inclusion. The social equity benefits of public transit are especially significant for low-income people in terms of time and cost savings and safety and health benefits (Serulle & Cirillo, 2016; Venter et al., 2017).
Income & Work
Investment in enhancing public transit can also generate substantial economic returns. The APTA estimated that each US$1 billion invested in transit can create 49,700 jobs and yield a five-to-one economic return (APTA, 2020). According to another study, shifting 50% of highway funds to mass transit systems in 20 U.S. metropolises could generate more than 1 million new transit jobs within five years (Swanstrom et al., 2010).
Nature Protection
An indirect benefit of enhanced public transit is its contribution to reducing resource consumption, such as the minerals used in manufacturing personal vehicles. Enhanced public transit can also improve land-use efficiency by curbing urban sprawl, which helps reduce pollution and limit biodiversity loss (Ortiz, 2002).
left_text_column_width
Risks
If expanded service on high-quality public transit systems replaced journeys from nonmotorized transportation or electric bicycles rather than from cars – or if expanded service on high-quality public transit systems generated journeys that would not have otherwise happened – this will have a net-negative climate impact, since public transit has higher per-pkm GHG emissions than electric bicycles or not traveling (International Transport Forum, 2020).
There may be cases where public transit networks cannot be implemented efficiently enough to provide a meaningful benefit compared to fossil fuel–powered cars in terms of GHG emissions. This would occur in places where there are so few potential riders that most trips would have a very low occupancy. The result would be a much higher rate of emissions per pkm. However, effective public transit networks can be built in suburban and even rural areas (Börjesson et al., 2020; Mees, 2010).
Finally, expanding public transit networks has proven very difficult in recent years. Entrenched preferences for car travel, reluctance on the part of governments to invest heavily in new transit infrastructure, and local political challenges over land use, noise, gentrification, and similar issues are all obstacles to increased public transit use. Public transit expansion has faced stronger headwinds in recent years in particular, due to both the impact of the COVID-19 pandemic and competition from new (and mostly less sustainable) mobility services, such as app-based ride-hailing (Shaller, 2017).
left_text_column_width
Interactions with Other Solutions
Reinforcing
For people living without cars, public transit provides a crucial service that is hard to replace for certain kinds of trips, such as trips over long distances, with small children, or carrying large objects. As a result, public transit plays a large role in making it more viable for people to live without owning a car (Brown, 2017). Research suggests that the key to a low-carbon mobility system is to reduce the need for people to own cars altogether (Van Acker & Witlox, 2010).
left_text_column_width
Public transit requires a lot less space than cars. Some of this space could be reallocated to ecosystem conservation through revegetation and other land-based methods of GHG sequestration (Rodriguez Mendez et al., 2024).
left_text_column_width
Competing
Electric cars and public transit compete for pkm. Consequently, increased use of public transit could reduce kilometers traveled using electric cars.
left_text_column_width
Dashboard
Solution Basics
million passenger kilometers (million pkm)
t CO₂-eq/unit/yr
58.27
units/yr
Current
1.67×10⁷2.2×10⁷4.19×10⁷
Achievable (Low to High)
Climate Impact
Gt CO₂-eq/yr
Current 0.97
1.282.44
US$ per t CO₂-eq
-3,300
Gradual
CO₂, CH₄, N₂O
Trade-offs
Public transit vehicles are sometimes unsafe, particularly for vulnerable groups such as women (Loukaitou-Sideris, 2014). In some circumstances – although this remains controversial – new public transit routes can also lead to gentrification of neighborhoods, forcing people to move far away from city centers and use cars for travel (Padeiro et al., 2019).
Expansion of public transit networks could also have negative consequences in areas directly adjacent to transit infrastructure. Diesel buses create air pollution (Lovasi et al., 2022), and public transit networks of all types can create noise pollution (Hemmat et al., 2023).
left_text_column_width
Population (millions)
1
10
30
Active Mobility
Public Transport
Private Cars
Primary mode of transport
Mapping the primary mode of transportation reveals mobility patterns and opportunities to shift travel toward lower-emitting modes.
Prieto-Curiel, R. and Ospina, Juan P. (2024). The ABC of mobility [Data set]. Environmental International, https://doi.org/10.1016/j.envint.2024.108541. Retrieved May 9, 2025 from https://github.com/rafaelprietocuriel/ModalShare/tree/main
Geographic Guidance Introduction
Public transit is most effective in urban areas with high population density, where buses, subways, trams, and commuter rail can efficiently carry large numbers of passengers. Electrified or low-emission transit modes achieve the greatest climate impact, especially in regions with clean electricity grids (Bloomberg New Energy Finance, 2018). However, even diesel-based public transit systems can outperform fossil fuel-powered cars on a per-pkm basis if they have high ridership and operate efficiently.
Socioeconomic and political factors, including investment capacity, institutional coordination, and public perceptions of reliability, safety, and comfort, highly influence the adoption and effectiveness of public transit. Regions with well-funded public infrastructure, integrated fare systems, and strong governance tend to have the highest adoption and climate benefits. Conversely, underinvestment, informal transit dominance, or poorly maintained systems can undermine public transit’s potential (Börjesson et al., 2020; Mees, 2010).
High public transit adoption is seen in Western and Northern Europe, Post-Soviet countries, East Asia (including Japan, South Korea, and China), and some Latin American cities, like Bogotá and Santiago. In contrast, many developing regions face barriers to public transit expansion, such as inadequate funding, urban sprawl, or a reliance on informal minibus systems. However, these same areas offer some of the highest potential for impact. Rapid urbanization, growing demand for mobility, and severe air quality challenges create strong incentives to expand and modernize transit networks.
Action Word
Enhance
Solution Title
Public Transit
Classification
Highly Recommended
Lawmakers and Policymakers
- Use public transit and create incentive programs for government employees to use public transit.
- Improve and invest in local public transit infrastructure, increasing routes and frequency while improving onboard safety, especially for women.
- Electrify public buses, vans, and other vehicles used in the public transit system.
- Implement the recommendations of transit-oriented development, such as increasing residential and commercial density, placing development near stations, and ensuring stations are easily accessible.
- Provide online information, ticketing, and payment services.
- Implement regional or nationwide public transit ticketing systems.
- Consider a wide range of policy options that include demand-side options, such as free fare or fare reductions, and that are informed by citizen-centered approaches.
- Create dedicated coordinating bodies across government agencies, businesses, and the public to develop public transit.
- Disincentivize car trips in areas serviced by public transit through reduced access, increases in parking fares, congestion charges, taxes, or other means.
- Incorporate social signaling in public transit information and signage, such as smiley faces and “sustainable transport” labels.
- Develop public transit awareness campaigns – starting from early childhood – focusing on internally motivating factors such as money saved, health benefits, reduced pollution, free time while traveling, and lifestyle sustainability.
Further information:
- How to prioritize walking and cycling. United Nations Environment Programme (2024)
- Share the road design guidelines. United Nations Environment Programme (2018)
- Transport. United Nations Environment Programme (n.d.)
- Government relations and public policy job function action guide. Project Drawdown (2022)
- Legal job function action guide. Project Drawdown (2022)
Practitioners
- Use public transit and create incentive programs for government employees to utilize public transit.
- Increase routes and frequency while also improving onboard safety, especially for women.
- Electrify public buses, vans, and other vehicles used in the public transit system.
- Incorporate social signaling in public transit information and signage, such as smiley faces and “sustainable transport” labels.
- Provide online information, ticketing, and payment services
- Implement regional or nationwide public transit ticketing systems.
- Consider a wide range of policy options that include demand-side options, such as free fare or fare reductions, and that are informed through citizen-centered approaches.
- Create dedicated coordinating bodies across government agencies, businesses, and the public to develop public transit.
- Develop public transit awareness campaigns – starting from early childhood – focusing on internally motivating factors such as money saved, health benefits, reduced pollution, free time while traveling, and a sustainable lifestyle.
Further information:
- How to prioritize walking and cycling. United Nations Environment Programme (2024)
- Share the road design guidelines. United Nations Environment Programme (2018)
- Transport. United Nations Environment Programme (n.d.)
Business Leaders
- Use public transit and encourage employees to do so when feasible.
- Encourage public transit use for company purposes.
- Offer employees who agree to forego a free parking space the annualized cash value or cost of that parking space as a salary increase.
- Incorporate company policies on public transit use into company sustainability and emission reduction initiatives and communicate how they support broader company goals.
- Ensure your business is accessible via public transit and offer information on nearest access points both online and in person.
- Offer employees pre-tax commuter benefits to include reimbursement for public transit expenses.
- Create and distribute educational materials for employees on commuting best practices.
- Partner with, support, and/or donate to infrastructure investments and public transit awareness campaigns.
- Advocate for better public transit systems with city officials.
Further information:
- How to prioritize walking and cycling. United Nations Environment Programme (2024)
- Share the road design guidelines. United Nations Environment Programme (2018)
- Transport. United Nations Environment Programme (n.d.)
- Drawdown-aligned business framework. Project Drawdown (2021)
Nonprofit Leaders
- Use public transit and encourage staff to do so when feasible.
- Offer staff pre-tax commuter benefits to include reimbursement for public transit expenses.
- Offer employees who agree to forego a free parking space the annualized cash value or cost of that parking space as a salary increase.
- Expand access to underserved communities by providing fare assistance through microgrants and/or public-private partnerships.
- Create, support, or partner with existing public transit awareness campaigns that – starting from early childhood – focus on internally motivating factors such as money saved, health benefits, reduced pollution, free time while traveling, and a sustainable lifestyle.
- Ensure your office is accessible via public transit and offer information – online and in person – on the nearest access points.
- Advocate to policymakers for improved infrastructure and incentives for riders.
- Advocate for infrastructure improvements and note specific locations where improvements can be made.
- Encourage local businesses to create employee incentives.
- Host or support community participation in local public transit infrastructure design.
- Join public-private partnerships to encourage, improve, or operate public transit.
Further information:
- How to prioritize walking and cycling. United Nations Environment Programme (2024)
- Share the road design guidelines. United Nations Environment Programme (2018)
- Transport. United Nations Environment Programme (n.d.)
- Climate Solutions at Work. Project Drawdown (2021)
- Drawdown-aligned business framework. Project Drawdown (2021)
Investors
- Use public transit and encourage staff to do so when feasible.
- Encourage public transit use for company purposes.
- Invest in electric battery and component suppliers for public buses and vehicle fleets.
- Deploy capital to efforts that improve public transit comfort, convenience, access, and safety.
- Seek investment opportunities that reduce material and maintenance costs for public transit.
Further information:
- How to prioritize walking and cycling. United Nations Environment Programme (2024)
- Share the road design guidelines. United Nations Environment Programme (2018)
- Transport. United Nations Environment Programme (n.d.)
Philanthropists and International Aid Agencies
- Use public transit and encourage staff to do so when feasible.
- Award grants to local organizations advocating for improved public transit and services.
- Expand access to underserved communities by providing fare assistance through microgrants and/or public-private partnerships.
- Improve and finance local infrastructure and public transit capacity.
- Build local capacity for infrastructure design, maintenance, and construction.
- Assist with local policy design or provide means for assessments, data collection, citizen participation, and other steps in the policymaking process.
- Create, support, or partner with existing public transit awareness campaigns that – starting from early childhood – focus on internally motivating factors such as money saved, health benefits, reduced pollution, free time while traveling, and a sustainable lifestyle.
Further information:
- How to prioritize walking and cycling. United Nations Environment Programme (2024)
- Share the road design guidelines. United Nations Environment Programme (2018)
- Transport. United Nations Environment Programme (n.d.)
Thought Leaders
- Lead by example and use public transit regularly.
- Create, support, or partner with existing public transit awareness campaigns that – starting from early childhood – focus on internally motivating factors such as money saved, health benefits, reduced pollution, free time while traveling, and a sustainable lifestyle.
- Share detailed information on local public transit routes.
- Assist with local policy design or provide means for assessments, data collection, citizen participation, and other steps in the policymaking process.
- Advocate to policymakers for improved infrastructure, noting specific locations that need improvements and incentives for riders.
Further information:
- How to prioritize walking and cycling. United Nations Environment Programme (2024)
- Share the road design guidelines. United Nations Environment Programme (2018)
- Transport. United Nations Environment Programme (n.d.)
Technologists and Researchers
- Use public transit and encourage your colleagues to use public transit when feasible.
- Improve electric batteries and electrification infrastructure for public buses and vehicles.
- Develop models for policymakers to demonstrate the impact of public transit policies on pollutant emissions, health, and other socioeconomic variables.
- Conduct randomized control trials and collect longitudinal data on the impacts of interventions to increase public transit usage.
- Innovate better, faster, and cheaper public transit networks – focusing on infrastructure, operations, and public transit vehicles.
Further information:
- How to prioritize walking and cycling. United Nations Environment Programme (2024)
- Share the road design guidelines. United Nations Environment Programme (2018)
- Transport. United Nations Environment Programme (n.d.)
Communities, Households, and Individuals
- Use public transit and encourage your household and neighbors to use public transit when feasible.
- Share your experiences with public transit, as well as tips and reasons for choosing this mode of transportation.
- Advocate to local officials for infrastructure improvements and note specific locations where improvements can be made.
- Advocate to employers and local businesses to provide incentives and start local initiatives.
Further information:
- How to prioritize walking and cycling. United Nations Environment Programme (2024)
- Share the road design guidelines. United Nations Environment Programme (2018)
- Transport. United Nations Environment Programme (n.d.)
Sources
- Adapting to the new normal: understanding public transport use and willingness-to-pay for social distancing during a pandemic context. Filgueiras et al. (2024)
- Transport. Jaramillo (2022)
- An option generation tool for potential urban transport policy packages. May et al. (2012)
- A method for evaluating the effectiveness of improving public transport services, parking fee policies, and park-and-ride facilities in order to encourage the use of public transport. Nguyen (2024)
- Towards smart transportation: the impact of transportation policies on mobility in the outskirts (case study: Mijen suburban area in Semarang City). Purwantoro et al. (2024)
- Transport. Sims et al. (2014)
- Enhancing public transport use: the influence of soft pull interventions. Zarabi et al. (2024)
Evidence Base
Consensus of effectiveness in reducing transportation emissions: High
Experts agree that public transit usually produces fewer GHG/pkm than fossil fuel–powered cars (Bloomberg New Energy Finance, 2018; Brunner et al., 2018; Ilie et al., 2014; International Transport Forum, 2020; Kennedy, 2002; Kuminek, 2013; Lim et al., 2021; Mahmoud et al., 2016; Rodrigues & Seixas, 2022; Sertsoz et al., 2013). There is also consensus on two points: First, shifting people from cars to public transit even under status-quo emissions levels will reduce transport emissions overall; second, opportunities exist to decarbonize the highest-emitting parts of public transit systems through electrification, especially buses (Bloomberg New Energy Finance, 2018).
According to the Intergovernmental Panel on Climate Change (IPCC, 2023), public transit can help decrease vehicle travel and lower GHG emissions by reducing both the number and length of trips made in fossil fuel–powered cars (medium confidence). Adjustments to public transportation operations – such as increasing bus stop density, reducing the distance between stops and households, improving trip duration and frequency, and lowering fares – can encourage a shift from fossil fuel–powered car use to public transit.
Bloomberg New Energy Finance (2018) provides a good overview of the state of electric buses – a technology crucial to reduce the public transit fleet’s fossil fuel consumption, and help transition these fleets entirely to electric power. It determined that electric buses have significantly lower operating costs and can be more cost-effective than conventional buses when considering total ownership costs.
Litman (2024) found that “High quality (relatively fast, convenient, comfortable, and integrated) transit can attract discretionary passengers who would otherwise drive, which reduces traffic problems including congestion, parking costs, accidents, and pollution emissions. This provides direct user benefits, since they would not change mode if they did not consider themselves better off overall.”
The results presented in this document summarize findings from 28 reviews and meta-analyses and 23 original studies reflecting current evidence from 32 countries, primarily the American Public Transit Association (APTA, 2020), Bloomberg New Energy Finance (2018), International Transport Forum (2020), and UITP (2024). We recognize this limited geographic scope creates bias, and hope this work inspires research and data sharing on this topic in underrepresented regions.
left_text_column_width
Updated Date
Improve Nonmotorized Transportation
Sector
Transportation
Mode
Cut Emissions
Cluster
Shift to Alternatives
Image
Image

Coming Soon
Off
Summary
We define Improve Nonmotorized Transportation as increasing any form of travel that does not use a motor or engine. In theory, this includes a huge range of transportation modes, including horses, cross-country skis, sailboats, hand-operated rickshaws, and animal-drawn carriages. In practice, pedestrian travel and cycling account for most nonmotorized utilitarian passenger travel.
Overview
Travel shifted from motorized to nonmotorized transportation saves GHG emissions – mostly CO₂, but also small amounts of nitrous oxide and methane (Center for Sustainable Systems, 2023) – that a fossil fuel-powered car would otherwise emit. Nonmotorized transportation uses human muscle power to move people from place to place.
We divided nonmotorized transportation into three subcategories: 1) pedestrian travel, including walking and the use of mobility aids such as wheelchairs; 2) private bicycles owned by the user, meaning that they are typically used for both the outgoing and return legs of a trip; and 3) shared bicycles, which are sometimes used for only one leg of a trip and so have to be repositioned by other means.
Pedestrian travel
Pedestrian travel (including both walking and travel using mobility aids such as wheelchairs) has the advantage of being something that most people can do and often does not require special equipment or dedicated infrastructure (although some infrastructure, such as sidewalks, can be helpful). Pedestrian travel is 81.7% of global urban nonmotorized pkm.
Private bicycles
Private bicycles cost money and require maintenance but enable travel at much faster speeds and therefore longer distances. Private bicycles are 13% of global urban nonmotorized pkm.
Shared bicycles
Shared bicycles eliminate the financial overhead of bicycle ownership, but usually only permit travel within specific urban areas and sometimes between established docking stations. Shared bicycles are 5.1% of global urban nonmotorized pkm.
Note that we did not include electric bicycles in this analysis. Electric bicycles are analyzed as a separate solution.
While improving nonmotorized transportation can be a valuable climate solution virtually anywhere, we limit our analysis to cities due to the high number of relatively short-distance trips and the abundance of available data compared with rural locations.
The fuel for cycling and pedestrian travel is the food the traveler eats. When the traveler metabolizes the food, they produce CO₂. Some studies factor the GHG emissions produced by the additional metabolism required by nonmotorized transportation into its climate impact because of the emissions that come from the food system (Mizdrak et al., 2020). This is controversial, however, because it is unclear whether pedestrians and cyclists have a higher calorie intake than people who travel in other ways (Noussan et al., 2022). Furthermore, additional food eaten to fuel physical labor is not typically counted in life-cycle analyses. This analysis, therefore, does not consider the upstream climate impacts of food calories that fuel cycling, pedestrian travel, driving, or any other activity.
References
AAA. (2024). AAA’s Your driving costs – AAA Exchange. https://exchange.aaa.com/automotive/aaas-your-driving-costs/
Adamos, G., Nathanail, E., Theodoridou, P., & Tsolaki, T. (2020). Investigating the effects of active travel in health and quality of life. Transport and Telecommunication Journal, 21(3), 221–230. https://doi.org/10.2478/ttj-2020-0018
Autocosts.org. (2024). World statistics of car costs. Autocosts.Info. https://autocosts.info/worldstats
Blondiau, T., van Zeebroeck, B., & Haubold, H. (2016). Economic benefits of increased cycling. Transportation Research Procedia, 14, 2306–2313. https://doi.org/10.1016/j.trpro.2016.05.247
Bonilla-Alicea, R. J., Watson, B. C., Shen, Z., Tamayo, L., & Telenko, C. (2020). Life cycle assessment to quantify the impact of technology improvements in bike-sharing systems. Journal of Industrial Ecology, 24(1), 138–148. https://doi.org/10.1111/jiec.12860
Bopp, M., Sims, D., & Piatkowski, D. (2018). Benefits and risks of bicycling. 21–44. https://doi.org/10.1016/B978-0-12-812642-4.00002-7
Brand, C., Dons, E., Anaya-Boig, E., Avila-Palencia, I., Clark, A., de Nazelle, A., Gascon, M., Gaupp-Berghausen, M., Gerike, R., Götschi, T., Iacorossi, F., Kahlmeier, S., Laeremans, M., Nieuwenhuijsen, M. J., Pablo Orjuela, J., Racioppi, F., Raser, E., Rojas-Rueda, D., Standaert, A., … Int Panis, L. (2021). The climate change mitigation effects of daily active travel in cities. Transportation Research Part D: Transport and Environment, 93, 102764. https://doi.org/10.1016/j.trd.2021.102764
Burnham, A., Gohlke, D., Rush, L., Stephens, T., Zhou, Y., Delucci, M. A., Birky, A., Hunter, C., Lin, Z., Ou, S., Xie, F., Proctor, C., Wiryadinata, S., Liu, N., & Boloor, M. (2021). Comprehensive total cost of ownership quantifications for vehicles with different size classes and powertrains (ANL/ESD-21/4). Argonne National Laoratory. https://publications.anl.gov/anlpubs/2021/05/167399.pdf
Center for Sustainable Systems. (2023). Personal transportation factsheet (CSS01-07). University of Michigan. https://css.umich.edu/publications/factsheets/mobility/personal-transportation-factsheet
Christensen, L., & Vázquez, N. S. (2013). Post-harmonised european national travel surveys. Proceedings from the Annual Transport Conference at Aalborg University, 20(1), Article 1. https://doi.org/10.5278/ojs.td.v1i1.5701
CityTransit Data. (2025). A global analysis of transit data. CityTransit Data. https://citytransit.uitp.org/
DeMaio, P. (2009). Bike-sharing: History, impacts, models of provision, and future. Journal of Public Transportation, 12(4), 41–56. https://doi.org/10.5038/2375-0901.12.4.3
Department for Transport. (2024). Department for transport statistics NTS 0101: Trips, distance travelled, and time taken: England, 1972 onwards [Dataset]. https://app.powerbi.com/view?r=eyJrIjoiMGE2YTQ5YTMtMDkwNC00MjBmLWFkNjUtMjBjZjUzZWU0ZjNmIiwidCI6IjI4Yjc4MmZiLTQxZTEtNDhlYS1iZmMzLWFkNzU1OGNlNzEzNiIsImMiOjh9
European Commission. (2019). Handbook on the external costs of transport. European Commission. https://cedelft.eu/wp-content/uploads/sites/2/2021/03/CE_Delft_4K83_Handbook_on_the_external_costs_of_transport_Final.pdf
Federal Highway Administration. (2022). Summary of travel trends: 2022 National Household Travel Survey. US Department of Transportation. https://nhts.ornl.gov/assets/2022/pub/2022_NHTS_Summary_Travel_Trends.pdf
Fishman, E., & Schepers, P. (2016). Global bike share: What the data tells us about road safety. Journal of Safety Research, 56, 41–45. https://doi.org/10.1016/j.jsr.2015.11.007
Flanagan, E., Lachapelle, U., & El-Geneidy, A. (2016). Riding tandem: Does cycling infrastructure investment mirror gentrification and privilege in Portland, OR and Chicago, IL? Research in Transportation Economics, 60, 14–24. https://doi.org/10.1016/j.retrec.2016.07.027
Glazener, A., & Khreis, H. (2019). Transforming our cities: Best practices towards clean air and active transportation. Current Environmental Health Reports, 6(1), 22–37. https://doi.org/10.1007/s40572-019-0228-1
Gössling, S., Neger, C., Steiger, R., & Bell, R. (2023). Weather, climate change, and transport: A review. Natural Hazards, 118(2), 1341–1360. https://doi.org/10.1007/s11069-023-06054-2
Gössling, S., Choi, A., Dekker, K., & Metzler, D. (2019). The social cost of automobility, cycling and walking in the European Union. Ecological Economics, 158, 65–74. https://doi.org/10.1016/j.ecolecon.2018.12.016
Günther, M., & Krems, J. (2022). The liveable city—How effective planning for infrastructure and personal mobility can improve people’s experiences of urban life. 13th International Conference on Applied Human Factors and Ergonomics (AHFE 2022). https://doi.org/10.54941/ahfe1002372
International Transport Forum. (2020). Good to go? Assessing the environmental performance of new mobility (Corporate Partnership Board). OECD. https://www.itf-oecd.org/sites/default/files/docs/environmental-performance-new-mobility.pdf
International Transport Forum. (2021). ITF Transport Outlook 2021. OECD. https://www.itf-oecd.org/itf-transport-outlook-2021
Hymel, K. M., Small, K. A., & Dender, K. V. (2010). Induced demand and rebound effects in road transport. Transportation Research Part B: Methodological, 44(10), 1220–1241. https://doi.org/10.1016/j.trb.2010.02.007
IPCC. (2023). Renewable energy sources and climate change mitigation—IPCC. https://www.ipcc.ch/report/renewable-energy-sources-and-climate-change-mitigation/
Litman, T. (2011). Environmental reviews & case studies: Why and how to reduce the amount of land paved for roads and parking facilities. Environmental Practice, 13(1), 38–46. https://doi.org/10.1017/S1466046610000530
Litman, T. (2024). Evaluating active transport benefits and costs: Guide to valuing walking and cycling improvements and encouragement programs. Victoria Transport Policy Institute. https://www.vtpi.org/nmt-tdm.pdf
Mailloux, N. A., Henegan, C. P., Lsoto, D., Patterson, K. P., West, P. C., Foley, J. A., & Patz, J. A. (2021). Climate solutions double as health interventions. International Journal of Environmental Research and Public Health, 18(24), Article 24. https://doi.org/10.3390/ijerph182413339
Mizdrak, A., Cobiac, L. J., Cleghorn, C. L., Woodward, A., & Blakely, T. (2020). Fuelling walking and cycling: Human powered locomotion is associated with non-negligible greenhouse gas emissions. Scientific Reports, 10(1), Article 1. https://doi.org/10.1038/s41598-020-66170-y
Montoya-Torres, J., Akizu-Gardoki, O., & Iturrondobeitia, M. (2023). Measuring life-cycle carbon emissions of private transportation in urban and rural settings. Sustainable Cities and Society, 96, 104658. https://doi.org/10.1016/j.scs.2023.104658
Mueller, N., Rojas-Rueda, D., Cole-Hunter, T., de Nazelle, A., Dons, E., Gerike, R., Götschi, T., Int Panis, L., Kahlmeier, S., & Nieuwenhuijsen, M. (2015). Health impact assessment of active transportation: A systematic review. Preventive Medicine, 76, 103–114. https://doi.org/10.1016/j.ypmed.2015.04.010
Münzel, T., Molitor, M., Kuntic, M., Hahad, O., Röösli, M., Engelmann, N., Basner, M., Daiber, A., & Sørensen, M. (2024). Transportation noise pollution and cardiovascular health. Circulation Research, 134(9), 1113–1135. https://doi.org/10.1161/CIRCRESAHA.123.323584
de Nazelle, A., Nieuwenhuijsen, M., Antó, J., Brauer, M., Briggs, D., Charlotte Braun-Fahrlander, C., Cavill, N., Cooper, A., Desqueyroux, H., Fruin, S., Hoek, G., Panis, L., Janssen, N., Jerrett, M., Joffe, M., Andersen, Z., van Kempen, E., Kingham, S., Kubesch, N., Leyden, K., Marshall, J., Matamala, J., Mellios, G., Mendez, M., Nassif, H., Ogilvie, D., Peiró, R., Pérez, K., Rabl, A., Ragettli, M., Rodríguez, D., Rojas, D., Ruiz, P., Sallis, J., Terwoert, J., Toussaint, J., Tuomisto, J., Zuurbier, M., & Lebret, E. (2011). Improving health through policies that promote active travel: A review of evidence to support integrated health impact assessment. Environment International, 37(4), 767-777.
https://doi.org/10.1016/j.envint.2011.02.003
Noussan, M., Campisi, E., & Jarre, M. (2022). Carbon intensity of passenger transport modes: A review of emission factors, their variability and the main drivers. Sustainability, 14(17), Article 17. https://doi.org/10.3390/su141710652
Prieto-Curiel, R., & Ospina, J. P. (2024). The ABC of mobility. Environment International, 185, 108541. https://doi.org/10.1016/j.envint.2024.108541
Pro Cycling Coaching. (2025). Bike Time Calculator: How Long Does It Take to Bike Any Distance. https://www.procyclingcoaching.com/resources/bike-time-calculator
Rodriguez Mendez, Q., Fuss, S., Lück, S., & Creutzig, F. (2024). Assessing global urban CO₂ removal. Nature Cities, 1(6), 413–423. https://doi.org/10.1038/s44284-024-00069-x
Roser, M. (2024). Data review: How many people die from air pollution? Our World in Data. https://ourworldindata.org/data-review-air-pollution-deaths
Seum, S., Schulz, A., & Phleps, P. (2020). The future of driving in the BRICS countries (study update 2019). Institute for Mobility Research. https://www.semanticscholar.org/paper/The-Future-of-Driving-in-the-BRICS-Countries-(Study-Seum-Schulz/707da41b03f064dea00e7d35124b1c51bfd78053
Shindell, D. T., Lee, Y., & Faluvegi, G. (2016). Climate and health impacts of US emissions reductions consistent with 2 °C. Nature Climate Change, 6(5), 503–507. https://doi.org/10.1038/nclimate2935
Staatsen, B., Nijland, H., Kempen, E., van Hollander, A., de Franssen, A., & Kamp, I. (n.d.). Assessment of health impacts and policy options in relation to transport-related noise exposures (815120002).
State of Colorado. (2016). Economic and health benefits of cycling and walking. Colorado Office of Economic Development and International Trade. https://choosecolorado.com/wp-content/uploads/2016/06/Economic-and-Health-Benefits-of-Bicycling-and-Walking-in-Colorado-4.pdf
Statistics Netherlands. (2024, July 4). Mobility; per person, personal characteristics, modes of travel and regions [Webpagina]. Statistics Netherlands. https://www.cbs.nl/en-gb/figures/detail/84709ENG
TNMT. (2021). The environmental impact of today’s transport types. TNMT. https://tnmt.com/infographics/carbon-emissions-by-transport-type/
Van Acker, V., & Witlox, F. (2010). Car ownership as a mediating variable in car travel behaviour research using a structural equation modelling approach to identify its dual relationship. Journal of Transport Geography, 18(1), 65–74. https://doi.org/10.1016/j.jtrangeo.2009.05.006
Verma, S., Dwivedi, G., & Verma, P. (2022). Life cycle assessment of electric vehicles in comparison to combustion engine vehicles: A review. Materials Today: Proceedings, 49, 217–222. https://doi.org/10.1016/j.matpr.2021.01.666
Volker, J. M. B., & Handy, S. (2021). Economic impacts on local businesses of investments in bicycle and pedestrian infrastructure: A review of the evidence. Transport Reviews, 41(4), 401–431. https://doi.org/10.1080/01441647.2021.1912849
WHO. (2023). Despite notable progress, road safety remains urgent global issue. https://www.who.int/news/item/13-12-2023-despite-notable-progress-road-safety-remains-urgent-global-issue
Xia, T., Zhang, Y., Crabb, S., & Shah, P. (2013). Cobenefits of replacing car trips with alternative transportation: A review of evidence and methodological issues. Journal of Environmental and Public Health, 2013(1), 797312. https://doi.org/10.1155/2013/797312
Credits
Lead Fellows
Heather Jones, Ph.D.
Cameron Roberts, Ph.D.
Contributors
James Gerber, Ph.D.
Yusuf Jameel , Ph.D.
Daniel Jasper
Heather McDiarmid, Ph.D.
Alex Sweeney
Internal Reviewers
Aiyana Bodi
Hannah Henkin
Yusuf Jameel, Ph.D.
Heather McDiarmid, Ph.D.
Ted Otte
- Amanda Smith, Ph.D.
Effectiveness
Nonmotorized transportation can save 115.6 t CO₂‑eq /million pkm, compared with fossil fuel–powered cars (Table 1). This makes it a highly effective climate solution. Every trip shifted from a fossil fuel–powered car to cycling or pedestrian travel avoids most, if not all, of the GHG emissions associated with car travel. Nonmotorized transportation effectiveness is calculated by taking the share of each mode and multiplying it by its effectiveness, and adding this value from all three modes.
Cars produce 116 t CO₂‑eq /million pkm (International Transport Forum, 2020; IPCC, 2023; Montoya-Torres et al., 2023; TNMT, 2021; Verma et al., 2022). Note that this value does not correspond directly to the estimates arrived at in most of these references because it is common practice to include embodied and upstream emissions in life-cycle calculations. Because we do not include embodied and upstream emissions (which are accounted for in other solutions), our estimate for the current emissions from the global vehicle fleet comes from an original calculation using values from these sources and arrives at a lower figure than they do.
Pedestrian travel and private bicycles have negligible direct emissions (Bonilla-Alicea et al., 2020; Brand et al., 2021; International Transport Forum, 2020; Noussan et al., 2022; TNMT, 2021). This means people avoid all direct GHG emissions from driving fossil fuel–powered cars when they use nonmotorized transportation instead. Thus, shifting from cars to nonmotorized transportation saves 116 t CO₂‑eq /million pkm, not including indirect emissions, such as those from manufacturing the equipment and infrastructure necessary for those forms of mobility. Life-cycle emissions from cycling are approximately 12 t CO₂‑eq /million pkm, most of which come from manufacturing bicycles (Bonilla-Alicea et al., 2019; Brand et al., 2021; ITF, 2020; Montoya-Torres et al., 2023; Noussan et al., 2020; TNMT, 2021), while emissions from pedestrian travel are negligible (TNMT, 2021). These life-cycle emissions are not quantified for this analysis, but may be addressed by other solutions in the industrial sector.
Shared bicycles provide fewer emissions savings than privately owned bicycles do. Shared bicycle schemes have direct GHG emissions of 7.49 t CO₂‑eq /million pkm, about 109 fewer than the average fossil fuel-powered car. Because people sometimes use shared bicycles for one-way trips, the bike-sharing system can become unbalanced, with fewer bicycles in places where people start their journeys and more bicycles in places where people end them. This is fixed by driving the shared bicycles from places with surplus to places with shortage, which increases emissions. The total increase in emissions caused by this can be mitigated through measures such as using electric vehicles to reposition the bikes or incentivizing riders to reposition the bicycles themselves without the use of a vehicle.
left_text_column_width
Table 1. Effectiveness at reducing emissions.
Unit: t CO₂‑eq /million pkm, 100-yr basis
| 25th percentile | 99.33 |
| mean | 118.8 |
| median (50th percentile) | 115.6 |
| 75th percentile | 136.9 |
Left Text Column Width
Cost
Driving a fossil fuel–powered car has private costs (i.e., those that accrue to the motorist themselves) of US$0.25/pkm and public costs (for roads, lights, traffic enforcement, etc.) of US$0.11/pkm. It generates public revenues of US$0.03/pkm from taxes, fees, fines, etc. (AAA, 2024; Autocosts.org, 2024; Burnham et al., 2021; Gössling et al., 2019). This means that its net cost to the passenger is US$0.32/pkm. Cars also have externality costs, such as the cost of health care due to road injuries or air pollution (Litman, 2024). We do not factor these externalities into our cost analysis.
Nonmotorized transportation (costs weighted by mode share) has private costs of US$0.08/pkm and public costs US$0.04/pkm. It produces no revenues to the user. It has a net cost of US$0.12/pkm and saves US$0.21/pkm compared with car travel. This equals a savings of US$1,771/t CO₂‑eq (Table 2).
Pedestrian travel has private costs of US$0.09/pkm (mostly for shoes) and public costs of US$0.1/pkm (for sidewalks, staircases, bridges, etc.). It produces no new revenues. It has a net cost of US$0.10/pkm and saves US$0.23/pkm compared to car travel (Gössling et al., 2019; Litman, 2024).
Private bicycles have private costs of US$0.06/pkm (for the cost of the bicycle itself, as well as repairs, clothing, etc.) and public costs of US$0.002/pkm (for bike lanes and other infrastructure). They produce no new revenues. They have net costs of US$0.07/pkm and save US$0.26/pkm compared to car travel (Gössling et al., 2019; Litman, 2024). These costs are cheaper than those of pedestrian travel on a per-pkm basis because, while a bicycle costs more than a pair of shoes, it can also travel much farther.
Shared bicycle systems have different cost structures. They can be very expensive (US$9.00/km in London), free (Buenos Aires) and very inexpensive (less than US$0.00 in Tehran) based on what operators charge users. Rides are usually priced by time rather than distance (DeMaio, 2009). Calculations were made as to distance covered by time to arrive at a price per km (CityTransit Data, 2025; Fishman & Schepers, 2016; Pro Cycling Coaching, 2025). Assuming that this roughly covered operating costs, it means that these systems cost US$0.22/pkm more than car travel.
An important consideration for each of these is that we must divide the cost of a bicycle, car, pair of shoes, or piece of infrastructure (road, bike lane, sidewalk) by the pkm of travel it supports over its lifespan. This means that nonmotorized transportation, which is cheaper but slower than cars, can have less of a cost advantage per pkm than might seem intuitive, and is part of the reason why cycling is cheaper per pkm than pedestrian travel. In addition, all of these estimates are based on very limited data and research and should be treated as approximate. Lastly, per-pkm infrastructural costs of cycling and pedestrian travel will decrease as cyclists and pedestrians use the infrastructure more intensively.
left_text_column_width
Table 2. Cost per unit of climate impact.
Unit: 2023 US$/t CO₂‑eq , 100-yr basis
| median | -1,771 |
Left Text Column Width
Learning Curve
Walking and cycling are mature technologies, so the concept of a learning rate is not applicable.
There is also limited opportunity for cost reductions in cycling or pedestrian infrastructure built using construction techniques very similar to those used in the road industry. However, while learning effects might not do much to reduce the costs of nonmotorized transportation infrastructure, they could do a great deal to improve its effectiveness. Safe cycling infrastructure, in particular, has improved considerably over the past few decades. This could continue into the future as best practices are further improved.
left_text_column_width
Speed of Action
Speed of action refers to how quickly a climate solution physically affects the atmosphere after it is deployed. This is different from speed of deployment, which is the pace at which solutions are adopted.
At Project Drawdown, we define the speed of action for each climate solution as gradual, emergency brake, or delayed.
Improve Nonmotorized Transportation is a GRADUAL climate solution. It has a steady, linear impact on the atmosphere. The cumulative effect over time builds as a straight line.
left_text_column_width
Caveats
Increases to the modal share of nonmotorized transportation only have the benefits discussed here if they replace travel by car. Replacing public transit travel with travel using nonmotorized transportation will have a much smaller climate benefit. The climate benefit of nonmotorized mobility will also diminish if the average emissions of the global car fleet shrink, for example, due to the wider adoption of electric vehicles.
There are also uncertainties around trip length. A small number of long trips taken by car will not be replaceable by nonmotorized transportation. Replacing the average trip by car with cycling or pedestrian travel will, in many cases, require that trip to be shortened (for example, by placing businesses closer to people’s homes). If this is not possible, increased adoption of nonmotorized transportation will apply to only some trips, reducing the impact on both emissions and costs.
Weather and climate pose significant challenges and risks for nonmotorized transportation. Extreme heat or cold, wind, rain, or storms can make people reluctant to travel without the protection of a vehicle and, in some cases, can make doing so unsafe (Gössling et al., 2023). This will reduce the adoption of nonmotorized transportation in some places, although it can be mitigated through measures such as providing information and subsidies for proper clothing, removing or grooming snow on bicycle paths, and providing indoor/covered paths that allow pedestrians to travel through a city without exposure to the elements.
left_text_column_width
Current Adoption
Analysts most frequently report adoption of nonmotorized transportation as a percentage modal share of all trips taken in a city. Cities around the world have radically different modal shares of bicycle and pedestrian trips. Cities in LMICs often have a high nonmotorized modal share because many people cannot afford cars. Cities in high-income countries are often difficult to navigate without a car, resulting in low modal shares for nonmotorized transportation (Prieto-Curiel & Ospina, 2024).
Prieto-Curiel and Ospina (2024) estimated that northern North America (the United States and Canada) had the lowest modal share of nonmotorized transportation, at 3.5%. Western Europe reached 29% modal share, while Western and Eastern Africa reached 42.9% and 46%, respectively.
Converting these numbers into vehicle-kilometers traveled on a national level for various countries requires assumptions. A population-weighted average of data available from the United States and several Western European countries finds that people take approximately three 13.2 km trips per day, totaling 39.7 km of daily travel with considerable variation between countries (Christensen & Vázquez, 2013; Department for Transport, 2024; Federal Highway Administration, 2022; Statistics Netherlands, 2024). For example, English people in 2022 traveled an average of 25.5 km/day, while Americans in 2020 traveled 53.5 km/day. The value we use in our analysis comes from a population-weighted average that excludes data from 2020 and 2021 to exclude data skewed by the COVID-19 pandemic. Because the United States has by far the highest population of the countries for which we found data, it skews the average much higher than many of the European countries. World data (ITF, 2021) reports that nonmotorized transportation is 14.4% of all urban pkm.
We assumed that in urban environments, each trip taken by nonmotorized transportation corresponds to one fewer car trip of this average length. This implies that nonmotorized transportation currently shifts approximately 12.9 trillion pkm from cars (Table 3). However, it should be noted that this figure includes low-income countries, where some residents have less access to private vehicles.
left_text_column_width
Table 3. Current (2024) adoption level.
Unit: million pkm/yr*
| 25th percentile | 1,913,000 |
| mean | 12,860,000 |
| median (50th percentile) | 8,617,000 |
| 75th percentile | 22,340,000 |
*These data are extrapolated from a range of individual city estimates from 2010 to 2020 and are limited by the fact that not all cities have accurate data on passenger travel modal share. We used the mean value from Prieto-Curiel and Ospina (2024) as the authoritative estimate of current adoption here and for calculations in future sections.
Left Text Column Width
Adoption Trend
In all cities for which appropriate data exist, nonmotorized transportation showed a growth rate of 0.45% of all passenger trips per year (Prieto-Curiel & Ospina, 2024). This amounts to 114 billion pkm (Table 4) according to our estimation procedure outlined above. In some cities, adoption has grown much more quickly. For example, Hanover, Germany, achieved an average growth of 7.8%/yr in 2011–2017, which amounts to approximately 593 million additional pkm traveled by bicycle every year during that time. However, the rate of adoption is extremely variable. The 25th percentile of estimates shows a global decline in nonmotorized transportation to the tune of 312 billion fewer pkm shifted to nonmotorized modes every year.
Adoption rates of nonmotorized transportation vary widely within a country and between different years within the same city (Prieto-Curiel & Ospina, 2024).
Many people, particularly in LMICs, walk or cycle because they have limited access to a vehicle. When countries become wealthier, travel often shifts from nonmotorized transportation to cars (Seum et al., 2020). If transportation policy in these countries prioritizes car-free mobility, high levels of nonmotorized transportation adoption could potentially be preserved even as living standards increase.
left_text_column_width
Table 4. 2023–2024 adoption trend.
Unit: million pkm/yr
| 25th percentile | -311,800 |
| mean | 68,450 |
| median (50th percentile) | 114,400 |
| 75th percentile | 687,200 |
Left Text Column Width
Adoption Ceiling
We estimated that 20.2% of all trips in cities worldwide, or approximately 12.9 trillion pkm/yr, are traveled by nonmotorized transportation, while 66.2%, or approximately 42.2 trillion pkm/yr, are traveled by fossil fuel–powered car. This suggests that switching all urban trips currently taken by car to nonmotorized transportation would lead to a nonmotorized modal share of 86.4% in cities globally, or 55 trillion pkm/yr (Table 5).
This calculation uses the same assumptions discussed under Current Adoption above. In this case, however, our assumption that every nonmotorized trip is shifted from a car trip of the same length requires further justification. We are not assuming that very long car trips, trips on highways, etc., are replaced directly by bicycle or pedestrian trips. Instead, we assume that shorter nonmotorized trips can substitute for longer car trips with appropriate investment in better urban planning and infrastructure. So, for example, a 10 km drive to a large grocery store could be replaced by a 1 km walk to a neighborhood grocery store.
This would require replanning many cities so they better accommodate shorter trips. It would also require improving options for people with disabilities or those carrying heavy loads. And it would face climatic and topographic constraints. Furthermore, it is unlikely that all car traffic would ever be substituted by any single alternative mode. Other sustainable modes, particularly public transit, are likely to play a role.
It is also possible for rural trips to be undertaken by nonmotorized transportation. Indeed, this is already very common in low-and middle-income countries. However, rural data are sparse, and discerning how many trips could be shifted to nonmotorized travel in these areas is highly speculative. Therefore, we omit rural areas from our analysis.
left_text_column_width
Table 5. Adoption ceiling.
Unit: million pkm/yr
| median (50th percentile) | 55,090,000 |
Left Text Column Width
Achievable Adoption
To estimate the upper bound of feasible adoption, we assumed that urban trips taken by fossil fuel–powered cars can be shifted to nonmotorized transportation until the latter accounts for 65% of trips (the current highest modal share of nonmotorized transportation in any city with a population of more than one million) or until car travel decreases to 7% of trips (the current lowest modal share of fossil fuel–powered cars in any city with a population of more than one million).
The global modal share of car travel is 51.4% of trips, or 37.6 trillion pkm/yr, and the global modal share of nonmotorized transportation in cities is 22.4% of trips, or 12.9 trillion pkm/yr. If we shift modal share from cars to nonmotorized transportation until it reaches 65% of travel in cities, that leaves the modal share of cars in cities at 8.8%, still higher than the 7% modal share mentioned above. This amounts to a total modal share shift of 42.6% in all global cities. Multiplying this by the global urban population of 4.4 billion and factoring in the average annual travel distance per capita of 16,590 pkm/yr results in a total of 31.2 million pkm/yr shifted from car travel to nonmotorized transportation in cities around the world, for a total of 41.5 trillion pkm/yr (Table 6).
To set the lower bound, we do the same calculation as above, but for each individual region, adding up all the resultant modal shifts to get a global figure. So, for example, every East Asian city might reach the nonmotorized transportation modal share of Singapore (23% of trips), while every northern European city might reach that of Copenhagen, Denmark (41% of trips). This corresponds to a total achievable nonmotorized transportation modal share of 28.6 trillion pkm/yr.
left_text_column_width
Table 6. Range of achievable adoption levels.
Unit: million pkm/yr
| Current Adoption | 12,860,000 |
| Achievable – Low | 28,630,000 |
| Achievable – High | 41,490,000 |
| Adoption Ceiling | 55,090,000 |
Left Text Column Width
If all cycling and pedestrian trips undertaken today would otherwise have happened by car, they are currently displacing approximately 1.5 Gt CO₂‑eq/yr emissions (Table 7). This is an overestimate, however, since this figure includes data from places where most people have low access to cars.
Walking and private bicycles have a different effectiveness than shared bicycles. To calculate the climate impacts of different levels of adoption, we applied the effectiveness in the share of each mode of nonmotorized transportation. Walking and private bicycling are 94.4% of nonmotorized pkm and shared bicycling is 5.3%. This gives nonmotorized transportation effectiveness at reducing emissions 115.6 t CO₂‑eq /million pkm.
On the lower end, if every city achieved a pedestrian and cycling modal share equivalent to the least-motorized city in its region, it would save 3.3 Gt CO₂‑eq/yr. On the higher end, if every city shifted enough passenger car traffic to achieve a car modal share as low as Hong Kong, China, it would save 4.8 Gt CO₂‑eq/yr. If all trips taken by car were shifted onto nonmotorized transportation (an unrealistic scenario), it would save 6.4 Gt CO₂‑eq/yr.
left_text_column_width
Table 7. Climate impact at different levels of adoption.
Unit: Gt CO₂‑eq/yr, 100-yr basis
| Current Adoption | 1.487 |
| Achievable – Low | 3.310 |
| Achievable – High | 4.797 |
| Adoption Ceiling | 6.370 |
Left Text Column Width
Additional Benefits
Air Pollution and Health
Air pollution kills approximately 7 million people yearly (Roser, 2024). By reducing vehicle emissions, nonmotorized transportation can alleviate related air pollution (Mailloux et al., 2021) and thereby reduce premature deaths. For example, cutting U.S. transportation emissions by 75% by 2030 could prevent 14,000 premature deaths annually due to decreased exposure to PM2.5 and ozone (Shindell et al., 2016).
Nonmotorized transportation has other health and safety benefits (Blondiau et al., 2016; European Commission, 2019; Glazener & Khreis, 2019; Gössling et al., 2023; Mueller et al., 2015; State of Colorado, 2016; Xia et al., 2013). Switching from driving to walking or cycling boosts health by promoting physical activity and decreasing risks of cardiovascular issues, diabetes, and mental disorders (Mailloux et al., 2021).
Noise pollution from motorized vehicles has significant impacts on cardiovascular health, mental health, and sleep disturbances, contributing to 1.6 million lost healthy life years in 2004 and up to 1,100 deaths attributable to hypertension in Europe in 2024 (Staatsen et al., 2004; Munzel et al., 2024). Enhancing nonmotorized transportation can reduce the health impacts of traffic noise (de Nazelle et al., 2011).
Finally, nonmotorized transportation improves quality of life. It increases opportunities for human connection, integrates physical activity and fun into daily commutes, and increases the autonomy of less mobile groups such as children and elders. Cities with high modal shares for nonmotorized transportation generally have high quality of life (Adamos et al., 2020; Günther & Krems, 2022; Glazener and Khreis, 2019).
The use of nonmotorized transportation can reduce car crashes, which kill around 1.2 million people annually (WHO, 2023).
Income and Work
Nonmotorized transportation infrastructure tends to be good for local businesses. Cyclists and pedestrians are more likely to stop at businesses they pass and therefore spend more money locally, creating more jobs (Volker & Handy, 2021).
Nature Protection
In 2011, roads and associated infrastructure accounted for 10–30% of land in residential areas and 50–70% of land in commercial areas (Litman, 2011). Transforming these lands into green spaces could provide additional habitats and reduce biodiversity loss while increasing the protection of land, soil, and water resources (European Commission, 2019).
left_text_column_width
Risks
Some literature suggested that nonmotorized transportation can lead to gentrification because bike lanes and pleasant walkable streets can increase property values, driving people who used to live in a neighborhood into other places that might still be car-dependent (Flanagan et al., 2016). This risk can be addressed by ensuring that nonmotorized transportation infrastructure is built in an equitable way, connecting different neighborhoods regardless of their social and economic status. Increasing the number of neighborhoods accessible without a car will mean that people do not have to pay a premium to live in those neighborhoods. This will avoid making accessibility without a car a privilege that only the wealthy can afford.
Cycling in a city with lots of traffic and poor cycling infrastructure puts cyclists at risk of injury from collisions with cars. This risk, however, comes mainly from the presence of cars on roads. Reducing the number of cars on the road by shifting trips to other modes can improve safety for cyclists and pedestrians (Bopp et al., 2018).
The positive impacts that nonmotorized transportation have on traffic congestion could be self-defeating if not managed well. This is because less congestion will make driving more appealing, which can, in turn, lead to additional induced demand, increasing car use and congestion (Hymel et al., 2010).
left_text_column_width
Interactions with Other Solutions
Reinforcing
Nonmotorized transportation can help passengers access public transit systems, train stations, and carpool pickup points. This is important because research suggests that the key to a low-carbon mobility system is to reduce the need for people to own cars (Van Acker & Witlox, 2010).
left_text_column_width
Electric bicycles use the same infrastructure as nonmotorized transportation – especially conventional bicycles. Building bike lanes, bike paths, mixed-use paths, and similar infrastructure for cyclists and pedestrians can also help with the uptake of electric bicycles. This is even more true for shared electric bicycles, which can and often do use the same sharing systems as shared conventional bicycles.
left_text_column_width
One way to encourage the adoption of electric cars is through electric car–sharing services, in which people can access a communal electric car when they need it. This has the additional benefit of reducing the need for car ownership, which is closely correlated with car use (Van Acker and Witlox, 2010). Good nonmotorized transportation infrastructure can make it easier for users of these services to access shared vehicles parked at central locations.
left_text_column_width
Nonmotorized transportation requires a lot less space than cars. Some of this space could be reallocated to ecosystem conservation and other land-based methods of GHG sequestration. In 2011, roads and parking accounted for 10–30% of land in residential areas and 50–70% of land in commercial areas (Litman, 2011). Transforming 35% of the land area of European cities alone into green spaces could sequester an additional 26 Mt CO₂‑eq/yr. Globally, this kind of effort could sequester 0.1–0.3 Gt CO₂‑eq/yr (Rodriguez Mendez et al., 2024).
left_text_column_width
Competing
Electric cars, hybrid cars, and nonmotorized transportation compete for the same pool of total pkm. Increased use of nonmotorized transportation could reduce kilometers traveled using electric cars.
left_text_column_width
Consensus
Consensus of effectiveness in decarbonizing the transport sector: High
The large reductions in emissions that come from shifting passenger transportation from fossil fuel-powered cars to nonmotorized modes are not controversial. There is some disagreement, however, over how many pkm traveled by car can be realistically shifted to nonmotorized transportation.
Brand et al. (2021) compared the GHG emissions of active transportation with those of cars. They concluded that “locking in, investing in and promoting active travel should be a cornerstone of sustainability strategies, policies and planning.”
The Intergovernmental Panel on Climate Change (IPCC, 2023) sixth assessment report mentioned nonmotorized transportation as a solution in its transportation chapter. The authors expressed high confidence in the potential of these transportation modes to reduce emissions and recommended policy and infrastructural measures to support them.
Litman’s (2024) study of the costs and benefits of active transportation summarized the direct financial costs as well as externalities associated with pedestrian and bicycle travel compared with travel by fossil fuel–powered car. Litman noted that “active transport can provide relatively large energy savings if it substitutes for short urban trips that have high emission rates per mile due to cold starts (engines are inefficient during the first few minutes of operation) and congestion. As a result, each 1% shift from automobile to active travel typically reduces fuel consumption 2–4%.”
This research is, unfortunately, heavily biased toward richer countries, especially in Europe and North America, even though nonmotorized transportation plays a very important role in low- and middle-income countries (LMICs). The research on this topic is also biased toward cities, even though nonmotorized transportation can be a valuable means of mobility in rural areas.
The results presented in this document summarize findings from 19 reviews and meta-analyses and 14 original studies reflecting current evidence from 84 countries, primarily the United States, the United Kingdom, and the European Union. We recognize this limited geographic scope creates bias, and hope this work inspires research and data sharing on this topic in underrepresented regions.
left_text_column_width
Dashboard
Solution Basics
one million passenger-kilometers (pkm)
t CO₂-eq/unit
115.6
units/yr
Current
1.29×10⁷2.86×10⁷4.15×10⁷
Achievable (Low to High)
Climate Impact
Gt CO₂-eq/yr
Current 1.49
3.314.8
US$ per t CO₂-eq
-1,771
Gradual
CO₂, CH₄, N₂O
Trade-offs
Production of equipment (such as bicycles) and infrastructure (such as sidewalks) creates some emissions, but these are small when divided by the total distance traveled by pedestrians and cyclists. On a per-pkm basis, this makes little difference in the emissions saved by nonmotorized transportation.
left_text_column_width
% population
0–20
20–40
40–60
60–80
> 80
Percentage of city population living near protected bikeways, 2023
Proximity to related infrastructure, such as protected bikeways, facilitates the safe and convenient use of nonmotorized modes of transportation.
Reich, D. T. & Braga, K. (2024). Atlas of Sustainable City Transport [Data set]. Institute for Transportation and Development Policy. Retrieved June 2, 2025 from atlas.itdp.org
Geographic Guidance Introduction
Nonmotorized transportation effectiveness is high across all geographic regions, though the built environment, safety, and socio-cultural norms heavily shape its adoption and impact. Key determinants of effectiveness include the extent of safe and connected infrastructure (e.g., sidewalks, bike lanes, protected intersections), land-use patterns supporting short trips, and public policies prioritizing nonmotorized transportation.
Overall, effectiveness depends on adoption. In many cities across Europe and Asia, walking and cycling remain integral to daily travel. Cities like Amsterdam, Copenhagen, and Tokyo have successfully integrated nonmotorized modes into their broader transport systems through dedicated infrastructure and supportive urban design. In contrast, cities in North America, Sub-Saharan Africa, and parts of Latin America often lack safe, accessible infrastructure, which limits adoption.
Socioeconomic factors, including income levels, urban design, and perceptions of status, also influence the adoption of nonmotorized transport. In wealthier regions, cycling may be viewed as a lifestyle choice or an environmental statement, whereas in lower-income settings, it may be perceived as a necessity or even a sign of economic disadvantage, influencing user behavior and policy support (Seum et al., 2020).
Although shared bicycles have a lower effectiveness than walking or private bicycles, they are much more effective than cars. Increasing the number of shared bicycle systems in any geographic area can increase adoption and, therefore, make them more effective. This is particularly effective in lower-income areas where owning a private bicycle might be cost-prohibitive (Litman, 2024). Increasing shared systems in less urban and more suburban areas can be more effective, as they often replace trips made by car (Brand et al., 2021).
Nonmotorized modes are generally resilient and functional in a wide range of climates. Extreme weather conditions, including high heat, heavy rainfall, or snow, can reduce walking and cycling, although these can be mitigated through appropriate infrastructure (e.g., shaded or covered walkways, snow clearing, bike shelters).
Action Word
Improve
Solution Title
Nonmotorized Transportation
Classification
Highly Recommended
Lawmakers and Policymakers
- Use nonmotorized transportation.
- Reduce the associated time, distance, risk, and risk perception of nonmotorized transportation.
- Improve infrastructure such as sidewalks, footpaths, and bike lanes.
- Implement traffic-calming methods such as speed bumps.
- Increase residential and commercial density.
- Use a citizen-centered approach when designing infrastructure.
- Enact infrastructure standards for nonmotorized transportation, such as curb ramp designs, and train contractors to implement them.
- Establish public bike-sharing programs.
- Create dedicated coordinating bodies across government agencies, businesses, and the public to develop nonmotorized infrastructure.
- Disincentivize car ownership through reduced access, increases in parking fares, taxes, or other means.
Further information:
- How to achieve a walking and cycling transformation in your city. C40 Cities Climate Leadership Group (2019)
- Government relations and public policy job function action guide. Project Drawdown (2022)
- Legal job unction action guide. Project Drawdown (2022)
- Putting people at the center of urban transformation. The 15-minute city (n.d.)
- How to develop a non‑motorised transport strategy or policy. United Nations Environment Programme (2019)
Practitioners
- Use nonmotorized transportation.
- Share your experiences, tips, and reasons for choosing your modes of transportation.
- Participate in local bike groups, public events, and volunteer opportunities.
- Advocate to local officials for infrastructure improvements and note specific locations for improvements.
- Encourage local businesses to create employee incentives.
- Create “bike buses” or “walking buses” for the community and local schools.
Further information:
- 5 Ways to boost community engagement in bike advocacy. Aguilera et al. (2023)
- How to achieve a walking and cycling transformation in your city. C40 Cities Climate Leadership Group (2019)
- Putting people at the center of urban transformation. The 15-minute city (n.d.)
- Attributes of a Bicycle Friendly Business. The League of American Bicyclists (n.d.)
- How to develop a non‑motorised transport strategy or policy. United Nations Environment Programme (2019)
Business Leaders
- Use nonmotorized transportation.
- Ensure your business is accessible via nonmotorized transportation.
- Advocate for better infrastructure for nonmotorized transportation.
- Educate customers about the local infrastructure.
- Partner with other businesses to encourage employees to cycle or walk.
- Encourage employees to walk or cycle to and from work as their circumstances allow.
- Create educational materials for employees on commuting best practices.
- Offer employees pre-tax commuter benefits to include reimbursement for nonmotorized travel expenses.
- Organize staff bike rides to increase familiarity and comfort with bicycling.
- Install adequate bike storage, such as locking posts.
- Emphasize walking and biking as part of company-wide sustainability initiatives and communicate how walking and biking support broader GHG emission reduction efforts.
Further information:
- 5 Ways to boost community engagement in bike advocacy. Aguilera et al. (2023)
- How to achieve a walking and cycling transformation in your city. C40 Cities Climate Leadership Group (2019)
- Climate solutions at work. Project Drawdown (2021)
- Drawdown-aligned business framework. Project Drawdown (2021)
- Putting people at the center of urban transformation. The 15-minute city (n.d.)
- Attributes of a Bicycle Friendly Business. The League of American Bicyclists (n.d.)
- How to develop a non‑motorised transport strategy or policy. United Nations Environment Programme (2019)
Nonprofit Leaders
- Use nonmotorized transportation.
- Ensure your office is accessible to nonmotorized transportation.
- Advocate for infrastructure improvements and note specific locations where improvements can be made.
- Encourage local businesses to create employee incentives.
- Create “bike buses” or “walking buses” for the community and/or local schools.
- Offer free classes on subjects such as bike maintenance, local bike routes, or what to know before purchasing a bike.
- Host or support community participation in local infrastructure design.
- Join public-private partnerships to encourage biking and walking, emphasizing the health and savings benefits.
Further information:
- 5 Ways to boost community engagement in bike advocacy. Aguilera et al.. (2023)
- How to achieve a walking and cycling transformation in your city. C40 Cities Climate Leadership Group (2019)
- Government relations and public policy job function action guide. Project Drawdown (2022)
- Putting people at the center of urban transformation. The 15-minute city (n.d.)
- How to develop a non‑motorised transport strategy or policy. United Nations Environment Programme (2019)
Investors
- Use nonmotorized transportation.
- Deploy capital to efforts that improve bicycle and walking comfort, convenience, access, and safety.
- Invest in public or private bike-sharing systems.
- Invest in local supply chains for bicycles and other forms of nonmotorized transportation.
- Seek investment opportunities that reduce material and maintenance costs for bicycles.
- Finance bicycle purchases via low-interest loans.
- Consider investments in nonmotorized transportation start-ups.
Further information:
- How to achieve a walking and cycling transformation in your city. C40 Cities Climate Leadership Group (2019)
- Putting people at the center of urban transformation. The 15-minute city (n.d.)
- How to develop a non‑motorised transport strategy or policy. United Nations Environment Programme (2019)
Philanthropists and International Aid Agencies
- Use nonmotorized transportation.
- Award grants to local organizations advocating for improved walking and bicycle infrastructure.
- Build capacity for walking and bicycle infrastructure design and construction.
- Support organizations that distribute, refurbish, and/or donate bikes in your community.
- Facilitate access to bicycle maintenance and supplies.
- Host or support community education or participation efforts.
- Donate fixtures such as street lights, guardrails, and road signs.
- Educate the public and policymakers on the benefits and best practices of nonmotorized transportation.
Further information:
- 5 Ways to boost community engagement in bike advocacy. Aguilera et al. (2023)
- How to achieve a walking and cycling transformation in your city. C40 Cities Climate Leadership Group (2019)
- Government relations and public policy job function action guide. Project Drawdown (2022)
- Putting people at the center of urban transformation. The 15-minute city (n.d.)
- How to develop a non‑motorised transport strategy or policy. United Nations Environment Programme (2019)
Thought Leaders
- Use nonmotorized transportation.
- Focus messages on key decision factors for nonmotorized commuters, such as the associated health benefits and importance of fitness, climate and environmental benefits, weather forecasts, and traffic information.
- Highlight principles of safe urban design and point out dangerous areas.
- Share information on local bike and walking routes, general bike maintenance tips, items to consider when purchasing a bike, and related educational information.
- Collaborate with schools on bicycle instruction, including safe riding habits and maintenance.
Further information:
- 5 Ways to boost community engagement in bike advocacy. Aguilera et al. (2023)
- How to achieve a walking and cycling transformation in your city. C40 Cities Climate Leadership Group (2019)
- Putting people at the center of urban transformation. The 15-minute city (n.d.)
- How to develop a non‑motorised transport strategy or policy. United Nations Environment Programme (2019)
Technologists and Researchers
- Use nonmotorized transportation.
- Examine and improve elements of infrastructure design.
- Improve circularity, repairability, and ease of disassembly for bikes.
- Increase the physical carrying capacities (storage) for walkers and bicyclists to facilitate shopping and transporting children, pets, and materials.
- Identify and encourage the deployment of messaging that enhances nonmotorized transportation use.
Further information:
- How to achieve a walking and cycling transformation in your city. C40 Cities Climate Leadership Group (2019)
- Putting people at the center of urban transformation. The 15-minute city (n.d.)
- How to develop a non‑motorised transport strategy or policy. United Nations Environment Programme (2019)
Communities, Households, and Individuals
- Use nonmotorized transportation.
- Share your experiences, tips, and reasons for choosing nonmotorized transportation.
- Participate in local bike groups, public events, and volunteer opportunities.
- Advocate to local officials for infrastructure improvements and note specific locations where improvements can be made.
- Encourage local businesses to create employee incentives for using nonmotorized transportation.
- Create “bike buses” or “walking buses” for the community and local schools.
Further information:
- How to achieve a walking and cycling transformation in your city. C40 Cities Climate Leadership Group (2019)
- Putting people at the center of urban transformation. The 15-minute city (n.d.)
- How to develop a non‑motorised transport strategy or policy. United Nations Environment Programme (2019)
Sources
- Bicycle superhighway: an environmentally sustainable policy for urban transport. Agarwal et al. (2020)
- 5 ways to boost community engagement in bike advocacy. Aguilera et al. (2023)
- Cyclist crash rates and risk factors in a prospective cohort in seven European cities. Branion-Calles et al. (2020)
- How to achieve a walking and cycling transformation in your city. C40 Knowledge (2019)
- Going a long way? On your bike! Comparing the distances for which public bicycle sharing system and private bicycles are used. Castillo-Manzano (2016)
- Influencing transport behaviour: a Bayesian modelling approach for segmentation of social surveys. Dawkins et al. (2018)
- Transport mode choice and body mass index: cross-sectional and longitudinal evidence from a European-wide study. Dons et al. (2018)
- Rogue drivers, typical cyclists, and tragic pedestrians: a critical discourse analysis of media reporting of fatal road traffic collisions. Fevyer et al. (2022)
- Understanding economic and business impacts of street improvements for bicycle and mobility – a multi-city multi-approach exploration. Liu et al. (2020)
- “The bike breaks down. What are they going to do?” Actor-networks and the bicycles for development movement. McSweeney et al. (2020)
- How bicycle retailers can help grow ridership: foster the community. PeopleForBikes (2019)
- Active mobility versus motorized transport? User choices and benefits for the society. Pisoni et al. (2021)
- How to design policy packages for sustainable transport: Balancing disruptiveness and implementability. Thaller et al. (2021)
- Attributes of a bicycle friendly business. The League of American Bicyclists (n.d.)
- A paradigm shift in urban mobility: policy insights from travel before and after COVID-19 to seize the opportunity. Thombre et al. (2021)
- Small cities, big needs: urban transport planning in cities of developing countries. Thondoo et al. (2020)
- East Village shoppers study: a snapshot of travel and spending patterns of residents and visitors in the east village. Transportation Alternatives (2012)
- How to develop a non‑motorised transport strategy or policy. United Nations Environment Programme et al. (n.d.).
- Promotion of non-motorised transport. United Nations Environment Programme et al. (n.d.)
- Improving non-motorized transportation provision in a socially inclusive way—the case of Cape Town. Vanderschuren et al. (2022)
Updated Date
Deploy Alternative Insulation Materials
Sector
Industry, Materials & Waste
Mode
Cut Emissions
Cluster
Improve Materials
Image
Image

Coming Soon
Off
Summary
Deploy Alternative Insulation Materials is defined as using alternative building insulation materials in place of conventional ones. In particular, we highlight the impact of using cellulose instead of glass, mineral, or plastic insulation in new and retrofit buildings. Cellulose insulation manufacture and installation emits fewer GHGs to reach the same operational insulating performance than does manufacture and installation of conventional materials.
Overview
Thermal insulation materials are used in the walls, roofs, and floors of buildings to help maintain comfortable indoor temperatures. However, manufacture and installation of insulation materials produces GHG emissions. These are called embodied emissions because they occur before the insulation is used in buildings. Insulation embodied emissions offset a portion of the positive climate impacts from using insulation to reduce heating and cooling demand. A Canadian study found that over 25% of residential embodied emissions from manufacturing building materials can be due to insulation (Magwood et al., 2022). Using cellulose insulation made primarily from recycled paper avoids some embodied emissions associated with conventional insulation.
Insulation is manufactured in many different forms, including continuous blankets or boards, loose fill, and sprayed foam (Types of Insulation, n.d.). Most conventional insulation materials are nonrenewable inorganic materials such as stone wool and fiberglass. These require high temperatures (>1,300 °C) to melt the raw ingredients, consuming thermal energy and releasing CO₂ from fossil fuel combustion or grid power generation (Schiavoni et al., 2016). Other common insulations are plastics, including expanded polystyrene (EPS), extruded polystyrene (XPS), polyurethane (PUR), and polyisocyanurate (PIR). Producing these plastics requires the extraction of fossil fuels – primarily petroleum – for feedstocks, as well as high amounts of energy for processing (Harvey, 2007).
F-gases are often used as blowing agents to manufacture rigid foam board insulation or install sprayed foam insulation (Figure 1). F-gases are GHGs with GWPs that can be hundreds or thousands of times higher than CO₂. High-GWP F-gases used in foam production are released into the atmosphere during all subsequent stages of the foam’s life cycle (Biswas et al., 2016; Waldman et al., 2023). The climate benefits of this solution during the installation stage are primarily due to avoiding these blowing agents.
Alternative insulation is produced from plant or animal biomass (bio-based materials, see Figure 2) or waste products (recycled materials). Alternative insulation materials provide climate benefits by consuming less manufacturing energy, using renewable materials in place of fossil fuels, and eliminating high-GWP blowing agents (Sustainable Traditional Buildings Alliance, 2024).
Figure 3 compares a variety of conventional and alternative insulation materials. While many bio-based and recycled materials could be used as alternatives to these conventional materials, this solution focuses on cellulose due to its effectiveness in avoiding emissions, low cost, and wide availability. Cellulose insulation is made primarily from recycled paper fibers, newsprint, and cardboard. These products are made into fibers and blended with fire retardants to produce loose or batt cellulose insulation (Figure 4) (Waldman et al., 2023; Wilson, 2021).
Figure 1. Properties and adoption of conventional and alternative insulation materials. Costs and emissions will vary from the values here depending on the insulation form (board, blanket, loose-fill, etc.).
| Category | Material | High-GWP F-gases used? | Median manufacturing and installation emissions* | Mean product and installation cost** | Estimated market share (% by mass) |
|---|---|---|---|---|---|
| Conventional materials | Stone wool | No | 0.31 | 623 | 20 |
| Glass wool (fiberglass) | No | 0.29 | 508 | 34 | |
| EPS | No | 0.38 | 678 | 22 | |
| XPS | Yes, sometimes | 9.44 | 702 | 7 | |
| PUR/PIR | Yes, sometimes | 6.14 | 1,000 | 11 | |
| Alternative materials | Cellulose | No | 0.05 | 441 | 2–13 |
| Cork | No | 0.30 | 1,520 | Commercially available, not widely used | |
| Wood fiber | No | 0.13 | 814 | Commercially available, not widely used | |
| Plant fibers (kenaf, hemp, jute) | No | 0.18 | 467 | Commercially available, not widely used | |
| Sheep’s wool | No | 0.14 | 800 | Commercially available, not widely used | |
| Recycled PET plastic | No | 0.12 | 2,950 | Commercially available, not widely used |
*t CO₂‑eq (100-yr) to insulate 100m² to 1m²·K/W
**2023 US$ to insulate 100m² to 1m²·K/W. We use mean values for cost analysis to better capture the limited data and wide range of reported costs.
Although we are estimating the impact of using cellulose insulation in all buildings, the unique circumstances of each building are important when choosing the most appropriate insulation material. In this solution, we don’t distinguish between residential and commercial buildings, retrofit or new construction, different building codes, or different climates, but these would be important areas of future study.
In this solution, the effectiveness, cost, and adoption are calculated over a specified area (100 m2) and thermal resistance (1 m2·K/W). The chosen adoption unit ensures that all data are for materials with the same insulating performance. Due to limited material information, we assumed that insulation mass scales linearly with thermal resistance.
To better understand the adoption unit, a one-story residential building of 130 m2 floor area would require approximately 370 m2 of insulation area (RSMeans from The Gordian Group, 2023). For a cold climate like Helsinki, Finland, code requires insulation thermal resistance of 11 m2·K/W (The World Bank, n.d.). For a warm climate like Jerusalem, Israel, envelope thermal resistance requirements average 1.1 m2·K/W (The World Bank, n.d.). Therefore, depending on the location, anywhere from approximately 4–40 adoption units insulating 100 m2 to 1 m2·K/W may be needed to insulate a small single-story home to the appropriate area and insulation level.
Take Action Intro
Would you like to help deploy alternative insulation? Below are some ways you can make a difference, depending on the roles you play in your professional or personal life.
These actions are meant to be starting points for involvement and may or may not be the most important, impactful, or doable actions you can take. We encourage you to explore, get creative, and take a step that is right for you!
References
Forestry Production and Trade. (2023). [Dataset]. FAOSTAT. https://www.fao.org/faostat/en/#data/FO
Credits
Lead Fellow
Sarah Gleeson, Ph.D.
Contributors
Ruthie Burrows, Ph.D.
James Gerber, Ph.D.
Yusuf Jameel, Ph.D.
Daniel Jasper
Alex Sweeney
Internal Reviewers
Aiyana Bodi
Hannah Henkin
Ted Otte
Amanda Smith, Ph.D.
Tina Swanson, Ph.D.
Effectiveness
To insulate 100 m2 to a thermal resistance of 1 m2·K/W using entirely cellulose insulation in place of the current baseline mix of insulation materials is expected to avoid 1.59 t CO₂‑eq on a 100-yr basis (Table 1). Effectiveness for this solution measures the one-time reduced emissions from manufacturing and installing insulation. Insulation also reduces the energy used while a building is operating, but those emissions are addressed separately in the Improve Building Envelopes solution.
Conventional insulation cost was considered to be a weighted average cost of the current baseline insulation mix, including a small amount of cellulose insulation currently in use.
The largest contributor to conventional insulation embodied emissions is using high-GWP blowing agents to manufacture or install XPS, PUR, or PIR foam. We assumed the use of F-gas blowing agents for all foams, although these are already being regulated out of use globally (Amendment to the Montreal Protocol on Substances That Deplete the Ozone Layer, 2016) and an unknown amount of low-GWP blowing agents are currently use (such as hydrocarbons or CO₂ ). Therefore, we anticipate the effectiveness of this solution will decrease as F-gases are used less in the future. We assumed that 100% of blowing agents are emitted over the product lifetime.
Cellulose has the greatest avoided emissions of all of the alternative materials we evaluated (Figure 1). The next most effective materials were recycled PET, wood fibers, and sheep’s wool. Conventional materials like XPS, PUR, and PIR that are foamed with F-gases had the highest GHG emissions. For bio-based materials, we did not consider biogenic carbon as a source of carbon sequestration due to quantification and permanence concerns.
left_text_column_width
Table 1. Effectiveness at reducing emissions.
Unit: t CO₂‑eq /insulation required to insulate 100 m2 to a thermal resistance of 1 m2·K/W, 100-yr basis
| 25th percentile | 0.98 |
| mean | 1.34 |
| median (50th percentile) | 1.59 |
| 75th percentile | 1.81 |
Left Text Column Width
Cost
Available cost data are variable for all materials, particularly those in early-stage commercialization. The mean cost of purchasing and installing cellulose insulation is less than that of any other conventional or alternative insulation material (Figure 1). Compared with the average cost of conventional insulation, the mean cost savings for cellulose insulation is US$193/100 m2 insulated to a thermal resistance of 1 m2·K/W. Since most buildings are insulated over greater areas to higher thermal resistances, these savings would quickly add up. When considering the mean cost per median climate impact, cellulose insulation saves US$121/t CO₂‑eq (100-yr basis), making it an economically and environmentally beneficial alternative (Table 2).
We considered conventional insulation cost to be a weighted average cost of the current baseline insulation mix, including a small amount of cellulose insulation currently in use.
For conventional insulation, material costs of purchasing the insulation are higher than costs for installation (US$540 and US$97, respectively, to insulate 100 m2 to a thermal resistance of 1 m2·K/W). Cellulose has a lower product cost and comparable installation costs to conventional materials. We considered all costs to be up-front and not spread over the lifetime of the material or building. For each material type, cost will vary based on the form of the insulation (board, loose, etc.) and this should be accounted for when comparing insulation options for a particular building.
We determined net costs of insulation materials by adding the mean cost to purchase the product and the best estimation of installation costs based on available information. Installation costs were challenging to find data on and therefore represent broad assumptions of installation type and labor. Cost savings were determined by subtracting the weighted average net cost of conventional materials to the net cost of an alternative material. Although we used median values for other sections of this assessment, the spread of data was large for product cost estimates and the mean value was more appropriate in the expert judgment of our reviewers.
left_text_column_width
Table 2. Cost per unit of climate impact.
Unit: 2023 US$/t CO₂‑eq, 100-yr basis
| estimate | -121 |
Left Text Column Width
Learning Curve
Little information is available about the learning rate for new insulation materials. Mályusz and Pém (2013) evaluated how labor time decreased with repetitive cycles for installing roof insulation. They found a learning rate of ~90%, but only for this specific insulation scenario, location, and material. Additionally, this study does not include any product or manufacturing costs that may decrease with scale.
In general, labor time for construction projects decreases with repetitive installation, including improved equipment and techniques and increased construction crew familiarity with the process (SaravanaPrabhu & Vidjeapriya, 2021). However, Malhotra and Schmidt (2020) classify building envelope retrofits as technologies that are highly customized based on user requirements, regulations, physical conditions, and building designs, likely leading to learning rates that are slow globally but where local expertise could reduce installation costs.
left_text_column_width
Speed of Action
Speed of action refers to how quickly a climate solution physically affects the atmosphere after it is deployed. This is different from speed of deployment, which is the pace at which solutions are adopted.
At Project Drawdown, we define the speed of action for each climate solution as gradual, emergency brake, or delayed.
Deploy Alternative Insulation Materials is an EMERGENCY BRAKE climate solution. It has the potential to deliver a more rapid impact than nominal and delayed solutions. Because emergency brake solutions can deliver their climate benefits quickly, they can help accelerate our efforts to address dangerous levels of climate change. For this reason, they are a high priority.
left_text_column_width
Caveats
Manufacturing and installation emissions reductions due to the use of alternative building thermal insulation materials are both permanent and additional.
Permanence: There is a low risk of the emissions reductions for this solution being reversed. By using cellulose insulation instead of inorganic or plastic-based insulation, a portion of the manufacturing and installation emissions are never generated in the first place, making this a permanent reduction. Emissions from high-temperature manufacturing, petroleum extraction, and blowing agent use are all reduced through this approach.
Additionality: The GHG emissions reductions from alternative insulation materials are additional because they are calculated here relative to a baseline insulation case. This includes a small amount of cellulose materials included in baseline building insulation. Therefore, avoided emissions represent an improvement of the current emissions baseline that would have occurred in the absence of this solution.
left_text_column_width
Current Adoption
Adoption data are extremely limited for alternative insulation materials. All adoption data and estimates are assumed to apply to both residential and commercial buildings, although in reality the uptake of alternative insulation materials will vary by building type due to differences in structures, climate, use type, and regulations. We assume that future uptake of alternative insulation is used only during retrofit or new construction, or when existing insulation is at the end of its functional lifetime.
European sources report that 2–13% of the insulation market is alternative materials. Depending on the source, this could include renewable materials, bio-based insulation, or recycled materials. In 2018 in the United States, 5% of total insulation area in new single-family homes was insulated with cellulose (Insulation Choices Revealed in New Study, 2019).
To convert estimated cellulose adoption percentage into annual insulation use, we estimated 26 Mt of all installed global insulation materials in 2023 based on a report from The Freedonia Group (2024). We calculated an annual use of approximately 1.7 billion insulation units of 100 m2 at a thermal resistance of 1 m2·K/W. Therefore, the median cellulose adoption is 140 million units/yr at 100 m2 at 1 m2·K/W, calculated from the median of the 2–13% adoption range.
Since this calculation is based on more alternative materials than just cellulose and is heavily reliant on European data where we assume adoption is higher, this estimate of current adoption (Table 3) is most likely an overestimate.
The little adoption data that were considered in this section are mostly for Europe, and some for the United States. We recognize this limited geographic scope creates bias, and hope this work inspires research and data sharing on this topic in underrepresented regions.
left_text_column_width
Table 3. Current (2017–2022) adoption level.
Unit: units of insulation/yr installed to insulate 100 m2 to a thermal resistance of 1 m2·K/W
| 25th percentile | 9000000 |
| mean | 130000000 |
| median (50th percentile) | 140000000 |
| 75th percentile | 170000000 |
Left Text Column Width
Adoption Trend
Very few data are available that quantify adoption trends. In a regional study of several bio-based insulation materials, Rabbat et al. (2022) estimated French market annual growth rates of 4–10%, with cellulose estimated at 10%. Petcu et al. (2023) estimated the European adoption of recycled plastic and textile insulation, biomass fiber insulation, and waste-based insulation to have increased from 6% to 10% between 2012 and 2020.
When accounting for the calculated current adoption, these growth rates mean a median estimated annual increase of 500,000 insulation units/yr required to insulate 100 m2 to a thermal resistance of 1 m2·K/W. The increasing adoption of biobased insulation decreases the use of conventional insulation materials in those regions.
This adoption trend (Table 4) is likely an overestimate, as it is biased by high European market numbers and based on the likely high estimate we made for current adoption.
left_text_column_width
Table 4. 2012–2020 adoption trend.
Unit: annual change in units of insulation/yr installed to insulate 100 m2 to a thermal resistance of 1 m2·K/W
| 25th percentile | 500000 |
| mean | 800000 |
| median (50th percentile) | 500000 |
| 75th percentile | 1300000 |
Left Text Column Width
Adoption Ceiling
No estimates have been found for the adoption ceiling of this solution, although we expect it to be high given low rates of current adoption and projected increases in building construction in the coming decades [International Energy Agency (IEA), International Renewable Energy Agency, & United Nations Climate Change High-Level Champions, 2023]. Two physical factors that could influence adoption are availability of alternative materials and thickness of insulation.
For cellulose insulation, availability does not seem to limit adoption. The Food and Agriculture Organization of the United Nations (2023) reports that there is a much higher annual production of cellulose-based materials (>300 Mt annually of cartonboard, newsprint, and recycled paper) than the overall demand for insulation globally (>25 Mt annual demand; Global Insulation Report, 2024). However, other uses for cellulose products may create competition for this supply.
Increased thickness of insulation could also be a limiting factor since this would reduce adoption by decreasing building square footage, in particular making retrofits more challenging and expensive. Deer et al. (2007) reported that the average cellulose thermal resistance is similar to mineral and glass wool, and lower than plastic insulations made of polystyrene and other foams. If we assume that 50% of plastic insulation cannot be replaced with cellulose due to thickness limitations, this would represent ~20% of current insulation that could not be replaced without structural changes to the building. Therefore, we calculate the adoption ceiling to be 80% of the current insulation that would be reasonably replaceable or 140 million units/yr required to insulate 100 m2 to a thermal resistance of 1 m2·K/W (Table 5).
Uptake of celllose insulation could also be limited by its susceptibility to absorbing moisture, limiting its use in wet climates or structures that retain moisture, such as flat roofs. Commercialization of alternative insulation materials beyond cellulose and in many different forms (e.g., board, loose-fill) will increase the adoption ceiling across more building types.
left_text_column_width
Table 5. Adoption ceiling.
Unit: units of insulation installed to insulate 100 m2 to a thermal resistance of 1 m2·K/W/yr.
| 25th percentile | N/A |
| mean | N/A |
| median (50th percentile) | 140000000 (estimate) |
| 75th percentile | N/A |
Left Text Column Width
Achievable Adoption
No estimates have been found for feasible global adoption of this solution. Rabbat et al. (2022) estimated the adoption levels of several bio-based insulation materials in France in 2050. For cellulose wadding, this was estimated to be 2.1 times the commercialized volume in France in 2020. Although we do not expect France to be representative of the rest of the world, if the predicted adoption trend holds across the world then we expect low adoption in 2050 to be 2.1 times greater than 2023 adoption. This is 29 million units/yr to insulate 100 m2 to a thermal resistance of 1 m2·K/W (Table 6).
The IEA (2023) claims that building envelopes need to have their retrofit rate increase by 2.5 times over the current rate in order to meet net zero targets (2023). This is a reasonable high-adoption scenario. Assuming that more retrofits of buildings occur and greater amounts of alternative insulation are installed in new buildings, we estimate that high future adoption of new insulation could occur at 2.5 times the rate of the low-adoption scenario. This is 73 million units/yr to insulate 100 m2 to a thermal resistance of 1 m2·K/W (Table 6).
Adoption will be facilitated or limited by local regulations around the world. Building codes will determine the location and extent of use of cellulose or other bio-based insulation. We expect uptake to be different between residential and commercial buildings, but due to insufficient data, we have grouped them in our adoption estimates.
left_text_column_width
Table 6. Range of achievable adoption levels.
Unit: units of insulation installed to insulate 100 m2 to a thermal resistance of 1 m2·K/W/yr
| Current Adoption | 14000000 |
| Achievable – Low | 29000000 |
| Achievable – High | 73000000 |
| Adoption Ceiling | 140000000 |
Left Text Column Width
The climate impacts for this solution are modest compared to current global GHG emissions. Not all conventional insulations have a high environmental impact due to the use of a wide range of materials, forms, and installation methods as well as the recent adoption of lower-GWP blowing agents. Therefore, the potential for further emissions savings is limited.
We quantified the effectiveness and adoption of cellulose insulation, which has the lowest emissions and, therefore, the highest climate impacts of the insulation materials we evaluated. With high adoption, 1.2 Gt CO₂‑eq on a 100-yr basis could be avoided over the next decade (Table 7).
While we only considered the adoption of cellulose insulation in this analysis, a realistic future for lowering the climate impact of insulation may include other bio-based materials, too. Utilizing a greater range of materials should increase adoption and climate impact due to more available forms, sources, and thermal resistance values of bio-based insulation.
Note that the current climate impact is calculated using a current materials baseline that includes a small fraction of cellulose. This means that the reported current adoption impact is a slight underestimate compared with the impacts for replacing entirely conventional insulation with the current amount of cellulose insulation in use.
left_text_column_width
Table 7. Climate impact at different levels of adoption.
Unit: Gt CO₂‑eq/yr, 100-yr basis
| Current Adoption | 0.022 |
| Achievable – High | 0.046 |
| Achievable – Low | 0.12 |
| Achievable Ceiling | 0.22 |
Left Text Column Width
Additional Benefits
Income & Work
Some alternative insulations can be cheaper than conventional materials. Although there is large variation in evaluation methods and reported costs, our analysis found that cellulose and plant fibers are cheaper than conventional insulation materials such as stone wool, glass wool, and EPS (Figure 1). Depending on the applicable climate conditions and insulation form, switching to alternative insulation materials can result in cost savings for consumers, including homeowners and business owners.
Health
Conventional insulation materials may contribute to poor indoor air quality, especially during installation, and contribute to eye, skin, and lung irritation (Naldzhiev et al., 2020; Stamm et al., 2022; Wi et al., 2021). Additionally, off-gassing of flame retardants and other volatile organic compounds and by-products of conventional insulation can occur shortly after installation (Naldzhiev et al., 2020). Using bio-based alternative insulation products can minimize the health risks during and after installation (McGrath et al., 2023).
Water Resources
Although there is not a scientifically consistent approach to compare the environmental impacts of conventional and alternative insulation materials, a review analysis of 47 studies on insulation concluded that bio-based insulation materials generally have lower impacts as measured through acidification, eutrophication, and photochemical ozone creation potentials compared than do conventional materials (Füchsl et al., 2022). Other alternative materials such as wood fiber and miscanthus also tend to have a lower environmental footprint (Schulte et al., 2021). The water demand for wood and cellulose is significantly lower than that for EPS (about 2.8 and 20.8 l/kg respectively compared with 192.7 l/kg for EPS) (Zabalza Bribián et al., 2011). While the limited evidence suggests that the alternative material tends to be better environmentally, there is an urgent need to conduct life cycle assessments using a consistent approach to estimate the impact of these materials.
left_text_column_width
Risks
Cellulose insulation is susceptible to water absorption, which can lead to mold growth in wet or humid environments (Andersen & Rasmussen, 2025; Petcu et al., 2023). Mitigating this risk either requires an antifungal treatment for the material or limits adoption to particular climates. The thermal performance of cellulose insulation can decrease over time due to water absorption, settling, or temperature changes, but installing it as dense-packed or damp-spray can mitigate this (Wang & Wang, 2023; Wilson, 2021).
Bio-based insulation materials tend to be combustible, meaning they contribute more to the spread of a fire than non-combustible stone or glass insulation. Some bio-based materials are classified as having minimal contribution to a fire, such as some cellulose forms, rice husk, and flax (Kumar et al., 2020). These materials are less likely to contribute to a fire than very combustible plastic insulation such as EPS, XPS, and PUR. Fire codes – as well as other building and energy codes – could limit adoption, risking a lack of solution uptake due to regulatory setbacks (Northeast Bio-Based Materials Collective 2023 Summit Proceedings, 2023).
Additives such as fire retardants and anti-fungal agents are added to bio-based insulation along with synthetic binders, which can lead to indoor air pollution from organic compounds, although likely in low concentrations (Maskell et al., 2015; Rabbat et al., 2022).
left_text_column_width
Interactions with Other Solutions
Reinforcing
Upgrading insulation to lower-cost and lower-emitting alternative materials should increase the adoption of other building envelope solutions as they can be installed simultaneously to optimize cost and performance.
left_text_column_width
Increasing the manufacturing of cellulose insulation, which contains large amounts of recycled paper, could increase the revenues for paper recycling.
left_text_column_width
Competing
The use of biomass as raw material for insulation will reduce the availability and increase the cost of using it for other applications. For cellulose, global production of cellulose materials (>300 Mt annually of cartonboard, newsprint, and recycled paper (Forestry Production and Trade, 2023)) is an order of magnitude higher than the demand for insulation materials (>25 Mt annual demand (The Freedonia Group, 2024)), so the overall impact should be small.
left_text_column_width
Reducing the demand for conventional insulation products and instead making insulation that produces fewer GHGs during manufacturing would slightly reduce the global climate impact of other industrial manufacturing solutions. This is because less energy overall would be used for manufacturing, and therefore other technologies for emissions reductions would be less impactful for insulation production.
left_text_column_width
Dashboard
Solution Basics
(insulation units of 100 m2 and 1 m2·K/W)/yr
t CO₂-eq/unit
1.59
units
Current
1.4×10⁷2.9×10⁷7.3×10⁷
Achievable (Low to High)
Climate Impact
Gt CO₂-eq/yr
Current 0.02
0.050.12
US$ per t CO₂-eq
-121
Emergency Brake
CO₂, F-gas
Trade-offs
Bio-based insulation materials including cellulose often have lower thermal resistance than some conventional insulation materials. In particular, bio-based materials may require a thicker layer than plastic insulation to reach the same insulating performance (Esau et al., 2021; Rabbat et al., 2022). Usable floor area within a building would need to be sacrificed to accommodate thicker insulation, which would potentially depreciate the structure or impact the aesthetic value (Jelle, 2011). This would be a more significant trade-off for retrofit construction and buildings in densely developed urban areas.
Sourcing bio-based materials has environmental trade-offs that come from cultivating biomass, such as increased land use, fertilizer production, and pesticide application (Schulte et al., 2021). Using waste or recycled materials could minimize these impacts. Binders and flame-retardants may also be required in the final product, leading to more processing and material use (Sustainable Traditional Buildings Alliance, 2024).
left_text_column_width
Geographic Guidance Introduction
The effectiveness of deploying alternative insulation is not inherently dependent on geographic factors since it addresses emissions embodied in the manufacture and deployment of insulation materials. However, due to a lack of related data, we assumed a consistent global breakdown of currently used insulation materials when in reality, the exact mix of insulation currently used in different geographic locations will affect the emissions impact of switching to alternative materials.
Building insulation is used in higher quantities in cold or hot climates, so deploying alternative insulation is more likely to be relevant and adopted in such climates. Other geographic factors also impact adoption: Areas with higher rates of new construction will be better able to design for cellulose or other alternative insulation materials, and drier climates will face a lower risk of mold growth on these materials. Local building codes, including fire codes, can also affect the adoption of alternative materials.
There are no maps for the Alternative Insulation solution. It is intended to address emissions embodied in the manufacture and deployment of insulation materials and has no intrinsic dependence on geographic factors.
Action Word
Deploy
Solution Title
Alternative Insulation Materials
Classification
Highly Recommended
Nonprofit Leaders
- Advocate for financial incentives, improved building and fire codes, and educational programs for alternative insulation.
- Conduct research to improve alternative insulation materials’ manufacturing, adoption, supply chain access, and circularity.
- Offer educational resources, one-stop shops for retrofitting and weatherization, installation demonstrations, and tours of model builds for commercial and private developers, highlighting the cost savings and environmental benefits of alternative insulation.
- Create, join, or administer green building certification schemes and/or public-private partnerships that offer information, training, and general support for alternative insulation.
Further information:
- Biomass. Building Materials and the Climate (2022)
- Building envelopes. IEA (2023)
- Embodied carbon. Urban Land Institute (n.d.)
- Bringing embodied carbon upfront. World Green Building Council, et al. (2019)
Philanthropists and International Aid Agencies
- Finance only new construction and retrofits that utilize alternative insulation and other low-carbon practices.
- Offer grants for developers utilizing alternative insulation and other climate-friendly practices.
- Create financing programs for private construction in low-income or under-resourced communities.
- Create new contractual terms that require embodied emissions data from materials and methods.
- Advocate for financial incentives, improved building and fire codes, and educational programs for alternative insulation.
- Fund research to improve alternative insulation materials’ manufacturing, adoption, supply chain access, and circularity.
- Offer educational resources, one-stop shops for retrofitting and weatherization, installation demonstrations, and tours of model builds for commercial and private developers, highlighting the cost savings and environmental benefits of alternative insulation.
- Create or join green building certification schemes and/or public-private partnerships that offer information, training, and general support for alternative insulation.
Further information:
- Biomass. Building Materials and the Climate (2022)
- Building envelopes. IEA (2023)
- Embodied carbon. Urban Land Institute (n.d.)
- Bringing embodied carbon upfront. World Green Building Council, et al. (2019)
Technologists and Researchers
- Develop and improve existing alternative insulation materials or innovate new materials with enhanced insulation performance.
- Investigate ways to increase the durability of alternative insulation, such as resistance to moisture, pests, and fire.
- Find uses for recycled materials in alternative insulation and ways to improve the circular economy.
- Innovate new manufacturing methods that reduce electricity use and emissions.
- Design new application systems for alternative insulation that can be done without much additional training or licensing/certification.
- Create new methods of disposal for conventional insulation during demolitions.
- Research adoption rates of alternative insulation materials across regions and environments.
Further information:
- Biomass. Building Materials and the Climate (2022)
- Building envelopes. IEA (2023)
- Embodied carbon. Urban Land Institute (n.d.)
- Bringing embodied carbon upfront. World Green Building Council, et al. (2019)
Communities, Households, and Individuals
- Finance or develop only new construction and retrofits that utilize alternative insulation and other low-carbon practices.
- Take advantage of financial incentives such as subsidies, tax credits, and grants for installing alternative insulation.
- Whenever possible, install insulation that does not use F-gas blowing agents.
- Advocate for financial incentives, improved building and fire codes, and educational programs for alternative insulation.
- Conduct local research to improve alternative insulation materials’ manufacturing, adoption, supply chain access, and circularity.
- Organize local “green home tours” and open houses to showcase climate-friendly builds and foster demand by highlighting cost savings and environmental benefits of alternative insulation.
- Create or join green building certification schemes, green building councils, and/or public-private partnerships that offer information, training, and general support for alternative insulation.
- Capture community feedback and share it with local policymakers to address barriers such as permitting logistics or upfront costs, helping to share policies that drive adoption.
Further information:
- Biomass. Building Materials and the Climate (2022)
- Building envelopes. IEA (2023)
- Embodied carbon. Urban Land Institute (n.d.)
- Bringing embodied carbon upfront. World Green Building Council, et al. (2019)
Sources
- EU tighten up legislation on F-Gas and Ozone depleting substances. Barbour Consolidated (2024)
- Biomass. Building Materials and the Climate (2022)
- Putting a stop to energy waste how building insulation can reduce fossil fuel imports and boost eu energy security. Buildings Performance Institute Europe (2022)
- Advanced insulation materials for building envelopes. Buildings Performance Institute Europe (2016)
- Strategies for promoting green building technologies adoption in the construction industry—an international study. Chan et al. (2017)
- Modeling thermal insulation investment choice in the EU via a behaviourally informed agent-based model. Chersoni et al. (2022)
- Reducing embodied carbon in buildings: low-cost, high-value opportunities. Esau et al. (2021)
- Building envelopes. IEA (2023)
- Selected EU policies and initiatives impacting the transition of the construction sector. Jacquemont et al. (2024)
- Study on policy marking of passive level insulation standards for non-residential buildings in South Korea. Kim et al. (2018)
- The role of policy instruments in supporting the development of mineral wool insulation in Germany, Sweden and the United Kingdom. Kiss et al. (2013)
- Accelerating low-carbon innovation. Malhotra et al. (2020)
- The need for comprehensive and well-targeted instrument mixes to stimulate energy transitions: the case of energy efficiency policy. Rosenow et al. (2017)
- Understanding the dynamics of sustainability transitions: the home insulation program. Smoleniec (2017)
- Embodied carbon. Urban Land Institute (n.d.)
- Bringing embodied carbon upfront. World Green Building Council et al. (2019)
- Industry experts’ perspectives on the difficulties and opportunities of the integration of bio-based insulation materials in the european construction sector. Zerari et al. (2024)
Evidence Base
Consensus of effectiveness in reducing building sector emissions: Mixed
There is scientific consensus that using building insulation with lower embodied emissions will reduce GHG emissions, but expert opinions about the magnitude of possible emissions reductions as well as the accuracy of determining these reductions are mixed.
Biswas et al. (2016) determined that, for insulation, avoided emissions from reduced heating and cooling energy tend to outweigh the embodied emissions. However, others emphasize that as buildings become more energy-efficient, material embodied emissions become a larger factor in their carbon footprint (Cabeza et al., 2021; Grazieschi et al., 2021). Embodied emissions from insulation can be substantial: Esau et al. (2021) analyzed a mixed-use multifamily building and found that selecting low-embodied-carbon insulation could reduce building embodied emissions by 16% at no cost premium.
Multiple studies have found that some sustainable insulation materials have lower manufacturing emissions than traditional insulation materials (Asdrubali et al., 2015; Füchsl et al., 2022; Kumar et al., 2020; Schiavoni et al., 2016). However, researchers have highlighted the difficulty in evaluating environmental performance of different insulation materials (Cabeza et al., 2021; Grazieschi et al., 2021). Gelowitz and McArthur (2017) found that construction product Environmental Product Declarations contain many errors and discrepancies due to self-contradictory or missing data. Füschl et al. (2022) conducted a meta-analysis and cautioned that “it does not appear that a definitive ranking [of insulation materials] can be drawn from the literature.” In our analysis, we attempt to compare climate impact between materials but acknowledge that this can come from flawed and inconsistent data.
Despite the difficulties in comparing materials, there is high consensus that cellulose is a strong low-emissions insulation option due to its low embodied carbon, high recycled content, and good thermal insulating performance (Wilson, 2021).
The results presented in this document summarize findings from four reviews and meta-analyses, 14 original studies, three reports, 27 Environmental Product Declarations, and two commercial websites reflecting current evidence from eight countries as well as data representing global, North American, or European insulation materials. We recognize this limited geographic scope creates bias, and hope this work inspires research and data sharing on this topic in underrepresented regions.
left_text_column_width
Updated Date
Improve Cement Production
Sector
Industry, Materials & Waste
Mode
Cut Emissions
Cluster
Improve Materials
Image
Image

Coming Soon
Off
Summary
Cement is a key ingredient of concrete, a manufactured material used in massive quantities around the world. Cement production generates high CO₂ emissions from the production of clinker, a binding ingredient. These emissions come from not only the chemical reaction that produces clinker, but also burning fossil fuels to provide heat for this reaction. We define the Improve Cement Production solution as reducing GHG emissions related to cement manufacturing by substituting other materials for clinker, using alternative fuels, and improving process efficiency.
Overview
Concrete production requires the manufacturing of 4 Gt of cement annually (U.S. Geological Survey, 2024). Roughly 85% of cement industry GHG emissions come from the production of a key cement component called clinker. Both the clinker formation chemical reaction and fuel combustion for high-temperature clinker kilns release GHGs (Goldman et al., 2023). Figure 1 illustrates the manufacturing steps responsible for these emissions and highlights how three approaches – clinker material substitution, use of alternative fuels, and process efficiency upgrades – could mitigate emissions.
Figure 1. Cement production GHG emissions. Some 85% of GHGs emitted during cement production are released when clinker is produced in high-temperature kilns. The three approaches analyzed in this solution – clinker material substitution, alternative fuels, and process efficiency upgrades – aim to mitigate such emissions. Modified from Goldman et al. (2023).
Image

Source: Goldman, S., Majsztrik, P., Sgro Rojas, I., Gavvalapalli, M., Gaikwad, R., Feric, T., Visconti, K., & McMurty, B. (2023). Pathways to commercial liftoff: Low-carbon cement. U.S. Department of Energy. https://liftoff.energy.gov/wp-content/uploads/2023/09/20230918-Pathways-to-Commercial-Liftoff-Cement.pdf
Clinker material substitution replaces a portion of the clinker used in cement with alternative materials, thus reducing the amount of clinker manufactured. This decreases the amount of CO₂ emitted by the chemical reaction and fuel combustion. Clinker is made by heating limestone to convert it to lime. This reaction releases CO₂. Some of the CO₂ production can be eliminated by replacing some of the clinker with substitute materials such as industrial waste products, other cementitious compounds, or available minerals. Clinker material substitution also reduces energy demand, lowering emissions from burning fossil fuels. Clinker fraction in cement is often expressed as a clinker-to-cement ratio, which ranges from 0 (no clinker) to 1 (entirely clinker). The most common type of cement, Portland cement, typically has a clinker-to-cement ratio of 0.95, meaning the cement is 95% clinker by mass.
Alternative fuels that can be used to heat cement kilns in place of fossil fuels are typically biomass and waste-based fuels. Cement production uses two kilns, one heated to ~700 °C and the other to ~1,400 °C (U.S. Department of Energy, 2022). The energy needed to provide this heat typically comes from burning fossil fuels such as oil, gas, coal, and petroleum coke on-site, which emits CO₂ as well as small amounts of other GHGs, including methane and nitrous oxide, and air pollutants, including nitrogen oxides, sulfur oxides, and particulate matter (Hottle et al., 2022; Miller & Moore, 2020). Switching to alternative fuels decreases emissions by reducing the mining and combustion of fossil fuels and recovering energy from waste streams that would have otherwise released GHG during decomposition or incineration (Georgiopoulou & Lyberatos, 2018).
Process efficiency upgrades include a broad suite of technologies such as improved controls, electrically efficient equipment (e.g., mills, fans, and motors), thermally efficient and multistage kilns, and waste heat recovery. These improvements lead to less wasted heat and input energy, and therefore require less fossil fuel burning during manufacturing. In particular, upgrading kilns has the potential for high emissions mitigation (Mokhtar & Nasooti, 2020; Morrow III et al., 2014). Kiln upgrades can include processing dry raw material (which is more efficient than expending energy to remove moisture from wet feedstock), adding a preheater that uses kiln exhaust gas to dry and preheat raw material, and adding a precalciner kiln that uses some of the fuel to partially calcinate raw material at a lower temperature (European Cement Research Academy, 2022; Schorcht et al., 2013). Each study included in our analysis for effectiveness and cost included a set group of technologies that were considered to be process efficiency upgrades.
The cost and avoided emissions from each approach vary depending on the other technologies in use at a particular cement plant (Glenk et al., 2023). While coupling the impacts of the approaches would provide the most accurate representation of this solution, that analysis is complex and outside the scope of this assessment. Therefore, we will consider the three approaches separately.
Take Action Intro
Would you like to help reduce the climate impacts of cement production? Below are some ways you make a difference, depending on the roles you play in your professional or personal life.
These actions are meant to be starting points for involvement and may or may not be the most important, impactful, or doable actions you can take. We encourage you to explore, get creative, and take a step that is right for you!
References
Afsah, S. (2004). CDM potential in the cement sector: The challenge of demonstrating additionality. Performeks LLC. https://www.performeks.com/media/downloads/CDM-Cement%20Sector_May%202004.pdf
Cannon, C., Guido, V., & Wright, L. (2021). Concrete solutions guide: Mix it up: Supplementary cementitious materials (SCMs). RMI. https://rmi.org/wp-content/uploads/2021/08/ConcreteGuide2.pdf
Cao, Z., Masanet, E., Tiwari, A., and Akolawala, S. (2021). Decarbonizing concrete: Deep decarbonization pathways for the cement and concrete cycle in the United States, India, and China. Industrial Sustainability Analysis Laboratory. https://www.climateworks.org/wp-content/uploads/2021/03/Decarbonizing_Concrete.pdf
Cavalett, O., Watanabe, M. D. B., Voldsund, M., Roussanaly, S., & Cherubini, F. (2024). Paving the way for sustainable decarbonization of the European cement industry. Nature Sustainability, 7, 568–580. https://doi.org/10.1038/s41893-024-01320-y
CEMBUREAU. (n.d.) Clinker substitution. Retrieved August 7, 2024, from https://lowcarboneconomy.cembureau.eu/5-parallel-routes/resource-efficiency/clinker-substitution/
Clark, G., Davis, M., Shibani, & Kumar, A. (2024). Assessment of fuel switching as a decarbonization strategy in the cement sector. Energy Conversion and Management, 312, 118585. https://doi.org/10.1016/j.enconman.2024.118585
ClimeCo. (2022). Low carbon cement production. https://www.climateactionreserve.org/wp-content/uploads/2022/10/Low-Carbon-Cement-Issue-Paper-05-20-2022_final.pdf
Daehn, K., Basuhi, R., Gregory, J., Berlinger, M., Somjit, V., & Olivetti, E. A. (2022). Innovations to decarbonize materials industries. Nature Reviews Materials, 7, 275–294. https://doi.org/10.1038/s41578-021-00376-y
de Puy Kamp, M. (2021, July 9). How marginalized communities in the South are paying the price for ‘green energy’ in Europe. CNN. https://edition.cnn.com/interactive/2021/07/us/american-south-biomass-energy-invs/
European Cement Research Academy. (2022). The ECRA technology papers 2022: State of the art cement manufacturing, current technologies and their future development. https://api.ecra-online.org/fileadmin/files/tp/ECRA_Technology_Papers_2022.pdf
Georgiopoulou, M., & Lyberatos, G. (2018). Life cycle assessment of the use of alternative fuels in cement kilns: A case study. Journal of Environmental Management, 216, 224–234. https://doi.org/10.1016/j.jenvman.2017.07.017
Glenk, G., Kelnhofer, A., Meier, R., & Reichelstein, S. (2023). Cost-efficient pathways to decarbonizing Portland cement production. ZEW - Centre for European Economic Research Discussion Paper No. 23-023. https://doi.org/10.2139/ssrn.4434830
Global Cement and Concrete Association. (2021). Concrete future: The GCCA 2050 cement and concrete industry roadmap for net zero concrete. https://gccassociation.org/concretefuture/wp-content/uploads/2021/10/GCCA-Concrete-Future-Roadmap-Document-AW.pdf
Goldman, S., Majsztrik, P., Sgro Rojas, I., Gavvalapalli, M., Gaikwad, R., Feric, T., Visconti, K., & McMurty, B. (2023). Pathways to commercial liftoff: Low-carbon cement. U.S. Department of Energy. https://liftoff.energy.gov/wp-content/uploads/2023/09/20230918-Pathways-to-Commercial-Liftoff-Cement.pdf
Gómez, D. R., & Watterson, J. D., et al. (2006). Stationary combustion. In S. Eggelston, L. Buendia, K. Miwa, T. Ngara, & K. Tanabe (Eds.), 2006 IPCC guidelines for national greenhouse gas inventories (Vol. 2). Institute for Global Environmental Strategies (IGES) for the IPCC. https://www.ipcc-nggip.iges.or.jp/public/2006gl/pdf/2_Volume2/V2_2_Ch2_Stationary_Combustion.pdf
Griffiths, S., Sovacool, B. K., Furszyfer Del Rio, D. D., Foley, A. M., Bazilian, M. D., Kim, J., & Uratani, J. M. (2023). Decarbonizing the cement and concrete industry: A systematic review of socio-technical systems, technological innovations, and policy options. Renewable and Sustainable Energy Reviews, 180, 113291. https://doi.org/10.1016/j.rser.2023.113291
Habert, G., Miller, S. A., John, V. M., Provis, J. L., Favier, A., Horvath, A., & Scrivener, K. L. (2020). Environmental impacts and decarbonization strategies in the cement and concrete industries. Nature Reviews Earth & Environment, 1, 559–573. https://doi.org/10.1038/s43017-020-0093-3
Hottle, T., Hawkins, T. R., Chiquelin, C., Lange, B., Young, B., Sun, P., Elgowainy, A., & Wang, M. (2022). Environmental life-cycle assessment of concrete produced in the United States. Journal of Cleaner Production, 363, 131834. https://doi.org/10.1016/j.jclepro.2022.131834
International Energy Agency. (2018). Technology roadmap: Low-carbon transition in the cement industry. https://www.iea.org/reports/technology-roadmap-low-carbon-transition-in-the-cement-industry
International Energy Agency. (2023a). CO₂ emitted and captured in the cement sector and clinker-to-cement ratio in the Net Zero Scenario, 2015–2030. https://www.iea.org/data-and-statistics/charts/co2-emitted-and-captured-in-the-cement-sector-and-clinker-to-cement-ratio-in-the-net-zero-scenario-2015-2030
International Energy Agency. (2023b). Global cement production in the Net Zero Scenario, 2010–2030. https://www.iea.org/data-and-statistics/charts/global-cement-production-in-the-net-zero-scenario-2010-2030-5260
International Energy Agency. (2023c). Global thermal energy intensity of clinker production by fuel in the Net Zero Scenario, 2010–2030. https://www.iea.org/data-and-statistics/charts/global-thermal-energy-intensity-of-clinker-production-by-fuel-in-the-net-zero-scenario-2010-2030
Isabirye, A., & Sinha, A. (2023). Manufacturing sector: Cement manufacturing emissions. ClimateTRACE. https://github.com/climatetracecoalition/methodology-documents/blob/main/2023/Manufacturing/Manufacturing%20and%20Industrial%20Processes%20sector-%20Cement%20Manufacturing%20Emissions%20methodology.docx.pdf
Juenger, M. C. G., Snellings, R., & Bernal, S. A. (2019). Supplementary cementitious materials: New sources, characterization, and performance insights. Cement and Concrete Research, 122, 257–273. https://doi.org/10.1016/j.cemconres.2019.05.008
Miller, S. A., & Moore, F. C. (2020). Climate and health damages from global concrete production. Nature Climate Change, 10(5), 439–443. https://doi.org/10.1038/s41558-020-0733-0
Mokhtar, A., & Nasooti, M. (2020). A decision support tool for cement industry to select energy efficiency measures. Energy Strategy Reviews, 28, 100458. https://doi.org/10.1016/j.esr.2020.100458
Morrow III, W. R., Hasanbeigi, A., Sathaye, J., & Xu, T. (2014). Assessment of energy efficiency improvement and CO₂ emission reduction potentials in India's cement and iron & steel industries. Journal of Cleaner Production, 65, 131–141. https://doi.org/10.1016/j.jclepro.2013.07.022
Rissman, J., Bataille, C., Masanet, E., Aden, N., Morrow III, W. R., Zhou, N., Elliott, N., Dell, R., Heeren, N., Huckestein, B., Cresko, J., Miller, S. A., Roy, J., Fennell, P., Cremmins, B., Blank, T. K., Hone, D., Williams, E. D., de la Rue du Can, S., …Helseth, J. (2020). Technologies and policies to decarbonize global industry: Review and assessment of mitigation drivers through 2070. Applied Energy, 266, 114848. https://doi.org/10.1016/j.apenergy.2020.114848
Schorcht, F., Kourti, I., Scalet, B. M., Roudier, S., & Delgado Sancho L. (2013). Best available techniques (BAT) reference document for the production of cement, lime and magnesium oxide – Industrial Emissions Directive 2010/75/EU (integrated pollution prevention and control) (Joint Research Center publication JRC 83006). European Commission, Joint Research Centre, Institute for Prospective Technological Studies. https://doi.org/10.2788/12850
Shah, I. H., Miller, S. A., Jiang, D., & Myers, R. J. (2022). Cement substitution with secondary materials can reduce annual global CO₂ emissions by up to 1.3 gigatons. Nature Communications, 13, 5758. https://doi.org/10.1038/s41467-022-33289-7
Sinha, A., and Crane, V. (2024). Manufacturing and industrial processes sector: Cement manufacturing emissions. TransitionZero, UK, Climate TRACE Emissions Inventory. https://climatetrace.org
Snellings, R. (2016). Assessing, understanding and unlocking supplementary cementitious materials. RILEM Technical Letters, 1, 50–55. https://doi.org/10.21809/rilemtechlett.2016.12
Snellings, R., Suraneni, P., & Skibsted, J. (2023). Future and emerging supplementary cementitious materials. Cement and Concrete Research, 171, 107199. https://doi.org/10.1016/j.cemconres.2023.107199
U.S. Department of Energy. (2022). Industrial decarbonization roadmap. https://www.energy.gov/sites/default/files/2022-09/Industrial%20Decarbonization%20Roadmap.pdf
U.S. Environmental Protection Agency. (2016). Greenhouse gas inventory guidance: Direct emissions from stationary combustion sources. https://www.epa.gov/sites/default/files/2016-03/documents/stationaryemissions_3_2016.pdf
U.S. Federal Highway Administration. (n.d.). Use of supplementary cementitious materials (SCMs) in concrete mixtures (FHWA-HIF-19-054). U.S. Department of Transportation. https://www.fhwa.dot.gov/pavement/concrete/trailer/resources/hif19054.pdf
U.S. Geological Survey. (2024). Mineral commodity summaries 2024. https://doi.org/10.3133/mcs2024
Yang, X., Teng, F., & Wang, G. (2013). Incorporating environmental co-benefits into climate policies: A regional study of the cement industry in China. Applied Energy, 112, 1446–1453. https://doi.org/10.1016/j.apenergy.2013.03.040
Zhang, S., Ren, H., Zhou, W., Yu, Y., & Chen, C. (2018). Assessing air pollution abatement co-benefits of energy efficiency improvement in cement industry: A city level analysis. Journal of Cleaner Production, 185, 761–771. https://doi.org/10.1016/j.jclepro.2018.02.293
Zhang, S., Worrell, E., & Crijns-Graus, W. (2015). Evaluating co-benefits of energy efficiency and air pollution abatement in China’s cement industry. Applied Energy, 147, 192–213. https://doi.org/10.1016/j.apenergy.2015.02.081
Zhang, S., Xie, Y., Sander, R., Yue, H., & Shu, Y. (2021). Potentials of energy efficiency improvement and energy–emission–health nexus in Jing-Jin-Ji’s cement industry. Journal of Cleaner Production, 278, 123335. https://doi.org/10.1016/j.jclepro.2020.123335
Credits
Lead Fellow
Sarah Gleeson, Ph.D.
Contributors
James Gerber, Ph.D.
Yusuf Jameel, Ph.D.
Daniel Jasper
Alex Sweeney
Internal Reviewers
Aiyana Bodi
Hannah Henkin
Ted Otte
Amanda Smith, Ph.D.
Tina Swanson, Ph.D.
Effectiveness
Cement production currently emits 760,000 t CO₂‑eq /Mt cement produced, based on our analysis. With global cement production exceeding 4 Gt/yr (U.S. Geological Survey, 2024), the scale of emissions to be mitigated is large.
Clinker material substitution is the most effective of the three approaches at reducing emissions, eliminating approximately 240,000 t CO₂‑eq /Mt cement produced. This is equivalent to 690,000 t CO₂‑eq /Mt clinker avoided (Table 1a). This estimate is based on expert predictions of GHG savings for realistic target levels of clinker replacement with material substitutes.
Alternative fuels and process efficiency upgrades ) have carbon abatement potentials of 96,000 and 90,000 t CO₂‑eq /Mt cement produced, respectively, when calculated based on production levels (Table 1b). Since the units of adoption for process efficiency upgrades are GJ thermal energy input, when calculating climate impact we used an effectiveness per GJ of thermal energy, calculated using an emission factor for fuel combustion. This effectiveness is 0.0847 t CO₂ /GJ thermal energy input (Table 1c) (Gómez & Watterson et al., 2006; IEA, 2023c).
We calculated the effectiveness of these three approaches separately. Because the implementation of each affects the effectiveness potential of the others (Glenk et al., 2023), the actual effectiveness will be lower when the approaches are implemented together.
Emissions reductions from these approaches can be directly related to how the approach impacts GHG emissions from clinker production and fossil fuel burning. However, sourcing, processing, and transporting clinker substitutes and alternative fuels also produces GHGs. Our data sources did not always report whether such indirect emissions were accounted for, so our analysis primarily focuses on direct emissions. Further analysis of other life-cycle emissions considerations would be valuable in future research; however, indirect emission levels for both clinker substitutes and alternative fuels are reportedly small compared to direct emissions (European Cement Research Academy, 2022; Shah et al., 2022).
Additionally, cement industry members sometimes assume that there are no direct emissions from burning biomass fuels (Goldman et al., 2023). As a result, we assume that direct emissions from biomass are not fully accounted for in the data and therefore that the climate benefit of using alternative fuels may be exaggerated.
While other GHGs, including methane and nitrous oxide, are also released during cement manufacturing, these gases represent a small fraction (<3% combined) of overall CO₂‑eq emissions so we considered them negligible in our calculations (U.S. Environmental Protection Agency, 2016; Hottle et al., 2022).
left_text_column_width
Table 1. Effectiveness at reducing emissions.
Unit: t CO₂‑eq /Mt cement produced (100-year basis)
| 25th percentile | 540,000 |
| mean | 710,000 |
| median (50th percentile) | 690,000 |
| 75th percentile | 860,000 |
Unit: t CO₂‑eq /Mt cement produced (100-year basis)
| 25th percentile | 77,000 |
| mean | 94,000 |
| median (50th percentile) | 96,000 |
| 75th percentile | 99,000 |
Unit: t CO₂‑eq /Mt cement produced (100-year basis)
| calculated value | 0.0847 |
Cost
All three approaches to mitigating cement emissions result in cost savings by our analysis. Despite high initial costs, when considering the long technology lifetime and annual operational savings, the net lifetime and annualized costs are lower than conventional cement production.
Clinker material substitution has the highest net savings of the three approaches, with US$7 million/Mt cement produced generating savings of US$30/t CO₂‑eq . While initial and operating costs may vary between different substitute materials, we averaged all material types for each cost estimate. Goldman et al. (2023) and the European Cement Research Academy (2022) offer breakdowns of cost by material type.
Alternative fuels generate savings of US$5 million/Mt cement, or US$50/t CO₂‑eq mitigated. For both clinker material substitution and alternative fuels, cost and emissions will vary based on local material availability (Cannon et al., 2021). We assumed equivalent costs for all alternative fuel types.
Process efficiency upgrades save US$6 million/Mt cement and have the highest cost savings per unit climate impact (US$60/t CO₂‑eq ). While process efficiency upgrades encompass many different technologies, this cost estimate incorporates the costs of two of the technologies yielding high avoided emissions – replacing long kilns with preheater/precalciner kilns and implementing efficient clinker cooler technology. Between these technologies, upgrading to preheater/precalciner kilns represents most of the initial cost increase and the operational cost savings (European Cement Research Academy, 2022).
The costs of each approach (Table 2) were calculated as amortized initial costs of upgrading plants, added to the expected changes in annual operational costs. Only very limited data are available for price premiums on low-carbon cement. Therefore, we did not include any revenues for low-carbon cement.
While we calculated these costs separately, in reality the cost for implementing multiple approaches will be different due to interactions between technologies (Glenk et al., 2023). For example, material processing equipment could change based on the type of clinker substitute materials. We do not expect the costs to be additive as we assumed in our analysis, and limited cost data means that this estimate is based on limited sources.
left_text_column_width
Table 2: Cost per unit climate impact.
Unit: 2023 US$/t CO₂‑eq (100-yr basis)
| Clinker material substitution | -30 |
| Alternative fuels | -50 |
| Process efficiency upgrades | -60 |
Negative values reflect cost savings.
Learning Curve
The technologies needed for all approaches in this solution are well developed and ready to deploy at scale, so we did not consider learning curves.
We did not find any global data on cost changes related to adoption levels for equipment, including energy-efficient processing technologies, dry-process kilns, or material storage. A portion of the solution’s initial costs come from plant downtimes, which would not be impacted by the technology learning curve. For feedstock components of the solution, including alternative fuels and clinker material substitutes, the costs will be subject to material availability, market prices, and transportation, and therefore will not necessarily decrease with adoption.
left_text_column_width
Speed of Action
Speed of action refers to how quickly a climate solution physically affects the atmosphere after it is deployed. This is different from speed of deployment, which is the pace at which solutions are adopted.
At Project Drawdown, we define the speed of action for each climate solution as gradual, emergency brake, or delayed.
Improve Cement Production is a GRADUAL climate solution. It has a steady, linear impact on the atmosphere. The cumulative effect over time builds as a straight line.
left_text_column_width
Caveats
Manufacturing emissions reductions due to clinker material substitution, alternative fuels, and process efficiency upgrades are both permanent and additional.
Permanence
There is a low risk that the emission reductions this solution generates will be reversed in the next 100 years. This approach calls for reduced burning of fossil fuels and less calcination of limestone into clinker, thereby avoiding emissions from these activities. Meanwhile, carbon that is not released as CO₂ due to these technologies will remain stable in limestone or fossil fuel reserves indefinitely, making the emissions mitigation permanent.
Additionality
These cement emissions reductions are additional if they are adopted in amounts higher than what is currently required and used in local or regional cement manufacturing. Afsah (2004) assessed additionality based on whether it represents “not common practice” from a national standpoint of market share or adoption. ClimeCo (2022) suggested that for clinker material substitutes to be considered additional, the substitute needs to meet two criteria: The replacement is not mandated by law, and new or emerging materials are used.
left_text_column_width
Current Adoption
Few global data are available for current adoption. Most data are from regional sources, typically the United States or Europe. As a result, we do not expect these data to be representative at the global level – China and India alone produce more than 60% of the world’s cement (U.S. Geological Survey, 2024). Therefore, we quantified adoption only from a limited number of worldwide sources, using the adoption units listed in Figure 2.
Clinker material substitution is challenging to assess for adoption, since it is implemented with a broad range of materials and replacement fractions. We therefore simplified adoption in this analysis by quantifying it as the amount of global cement material that is not clinker. The adoption tonnage (Table 3a) represents Mt of clinker production avoided, using conventional Portland cement (5% non-clinker) as a baseline (CEMBUREAU, n.d.). Note that this is different from the way we considered cement tonnage for effectiveness and cost. There, we calculated emissions reductions for a Mt of cement produced including substituted material. For adoption, however, we considered tonnage to be clinker avoided (based on amount replaced with other materials).
The IEA (2023a) and the European Cement Research Academy (2022) estimated the global clinker-to-cement ratio to be approximately 0.72, meaning that 28% of cement composition is material other than clinker. This correlates to 980 Mt clinker avoided/yr used over the Portland cement baseline.
Alternative fuels are currently used to replace approximately 7% of fossil fuels in global cement production (Global Cement and Concrete Association, 2021; IEA, 2023c). We assumed this means approximately 300 Mt cement/yr are currently produced with biomass and waste fuels (Table 3b).
Process efficiency upgrades encompass dozens of technological improvements, which – along with a paucity of available data – make adoption levels challenging to assess. To estimate the current state of energy usage in the cement industry, we used the IEA (2023c) estimate of 3,550,000 GJ/Mt clinker as the 2022 benchmark thermal energy input for clinker production. This value does not include electrical efficiency and can vary based on fuel mix, but approximates the current state of energy use. We converted it to GJ/yr using amounts of annual clinker production, yielding 10.5 billion GJ thermal energy consumed each year for clinker production. Since there is no baseline for efficiency, we consider this value to be the zero adoption scenario and 0 GJ/yr are saved (Table 3c).
For the other approaches, there is a clear baseline case of “zero adoption” where no substitutes or alternative fuels are in use. However, thermal energy input is an energy use indicator that represents a continuum with no clear baseline. We therefore had to benchmark future energy savings against an initial value, which we chose as 2022 since it provided the most recent available data. All future estimates represent annual GHG savings relative to global cement production’s 2022 GHG emissions levels.
left_text_column_width
Table 3. Current adoption level (2022).
Unit: Mt clinker avoided/yr
| median (50th percentile) | 980 |
Unit: Mt cement produced using alternative fuels/yr
| median (50th percentile) | 300 |
Unit: GJ thermal energy input/yr saved
| median (50th percentile) | 0 |
Left Text Column Width
Adoption Trend
Clinker material substitution has experienced relatively unchanged adoption worldwide in recent years (Table 4a). Since 2016, there has been a small increase in clinker-to-cement ratio, indicating a slight decrease in adoption of this approach (IEA, 2023a). This corresponds to 40 Mt fewer clinker material substitutes being used each year, on average.
Alternative fuels adoption is slowly on the rise as percent of fuel mix (Table 4b). According to the IEA (2023c), the percentage of global clinker produced by bioenergy and waste fuels increased from 6.5% in 2015 to 8.5% in 2022. This corresponds to a median annual increase of 12 Mt cement/yr produced by alternative fuels.
The IEA (2023c) reported process efficiency upgrades to have led to a median annual decrease of 5,000 GJ/Mt clinker from 2011 to 2022, representing a –0.14% annual change in energy input. This indicates that processes consuming thermal energy have become slightly more efficient in recent years. When converted to GJ/yr, this is 15 million fewer GJ thermal energy consumed each year (Table 4c).
left_text_column_width
Table 4. Adoption trend.
Unit: change in Mt clinker avoided/yr
| median (50th percentile) | –40 |
2016–2022 adoption trend
Unit: change in Mt cement produced using alternative fuels/yr
| median (50th percentile) | 12 |
2015–2022 adoption trend
Unit: annual change in GJ thermal energy input/yr
| median (50th percentile) | -15,000,000 |
2011–2022 adoption trend
Left Text Column Width
Adoption Ceiling
The adoption ceiling (Table 5a, Table 5b, Table 5c) is high for all approaches within this solution.
Clinker material substitution adoption is likely to be limited primarily by material standards and availability. Across literature, the median adoption ceiling is considered to be 3,000 Mt clinker avoided/yr beyond the Portland cement baseline, yielding a clinker-to-cement ratio of 0.2. Snellings (2016) calculated the worldwide amount of clinker materials substitutes and found that a maximum of ~2,000 Mt/yr would be available, which would result in a clinker-to-cement ratio of approximately 0.5. In the future, some waste materials – like fly ash and ground granulated blast furnace slag – are likely to be less available so increasing the possible substitute amounts would require research on new materials or cement properties.
Alternative fuels are typically assumed to be applicable to roughly 90% of cement production globally, or approximately 4,000 Mt cement/yr at 2022 global production levels (Daehn et al., 2022). In theory, kilns can use 100% alternative fuels, although composition of the fuel can influence the trace elements or calorific value (European Cement Research Academy, 2022). In particular, several analyses point to the lower calorific value of alternative fuels as an adoption-limiting factor. Cavalett et al. (2024) considered 90% to be the maximum. A separate analysis of Canadian cement production determined that 65% is the threshold due to lower-calorie fuels only being applicable in a precalciner kiln – the equipment where fuel is used to begin decomposing limestone through the calcination process (Clark et al., 2024).
Process efficiency upgrades have their adoption ceiling limited by the minimum thermal energy demand needed to run cement kilns. The European Cement Research Academy estimates this lower threshold of energy input to be approximately 2,300,000 GJ/Mt clinker, considering chemical reaction and evaporation energy needs (European Cement Research Academy, 2022). This converts to 6.9 billion GJ thermal energy used each year, or 3.6 billion GJ/yr saved over current thermal energy efficiency levels (Table 5c).
left_text_column_width
Table 5. Adoption ceiling.
Unit: Mt clinker avoided/yr
| median (50th percentile) | 3,000 |
Unit: Mt cement produced using alternative fuels/yr
| median (50th percentile) | 4,000 |
Unit: GJ thermal energy input/yr saved over current levels
| median (50th percentile) | 3,600,000,000 |
Lower limit for energy input
Left Text Column Width
Achievable Adoption
Clinker material substitution achievable adoption (Table 6a) is primarily limited by material availability and initial costs. Global estimates generally expect 30–50% of total substituted material to be reasonable, which correlates to a clinker-to-cement ratio of 0.4–0.6 and 1,000–2,000 Mt clinker avoided/yr (Habert et al., 2020; European Cement Research Academy, 2022). In a separate U.S.-specific analysis, the substitute amount was projected to vary from 5% to 45% depending on the availability and performance of the material substitute (Goldman et al., 2023).
Alternative fuels are projected to account for roughly 40% of the cement fuel mix in 2050 for both global and North American estimates. Taking the median of the global achievable adoption estimates, this correlates to 2,000 Mt cement/yr that would be produced using alternative kiln fuels. As a low estimate, if the current adoption trend holds, approximately 16% of global cement fuel (producing 610 Mt cement/yr) will come from biomass and waste (IEA, 2023c). A reasonable adoption range is 610–2,000 Mt cement/yr (Table 6b), although some European countries currently have ~80% adoption of alternative fuels, meaning that >40% adoption in an aggressive 2050 scenario may be feasible (Cavalett et al., 2024).
Little information exists on projected global adoption of process efficiency upgrades between now and 2050. In an analysis of a fraction of cement plants in China, India, and the U.S., it was estimated that these three countries – which represent more than 70% of current cement production worldwide – could reach a thermal energy input of 3.15–3.25 million GJ/Mt clinker by 2060, or 9.30–9.59 billion GJ/yr, which is 0.886–1.18 billion GJ/yr saved over current adoption levels (Table 6c; Cao et al., 2021). Meanwhile, in a European analysis, the European Cement Research Academy found the same range to be possible by 2050 (European Cement Research Academy, 2022). This is not significantly lower than the current state due to the fact that the highest-producing countries – China and India – have newer manufacturing facilities with more efficient equipment today. Countries with more room to improve in thermal energy efficiency – such as the U.S. – produce only a small fraction of the world’s cement. Approximately 92% of global plants are estimated to use more efficient dry kiln technology, indicating that some of the more energy-saving equipment upgrades are already highly adopted (Isabirye & Sinha, 2023). Therefore, there is less room for increased adoption in kiln technologies worldwide, although electrical efficiency measures could further improve these values.
While the estimates for tonnage of cement impacted by these approaches are based on 2022 global production numbers, cement production will change through 2050, meaning the impacted mass of cement will also change as these emissions-reducing measures are adopted (IEA, 2023b).
left_text_column_width
Table 6. Range of achievable adoption levels.
Unit: Mt clinker avoided/yr
| Current Adoption | 980 |
| Achievable – Low | 1,000 |
| Achievable – High | 2000 |
| Adoption Ceiling | 3000 |
Unit: Mt cement produced using alternative fuels/yr
| Current Adoption | 300 |
| Achievable – Low | 610 |
| Achievable – High | 2,000 |
| Adoption Ceiling | 4,000 |
Unit: GJ thermal energy input/yr saved over current adoption levels
| Current Adoption | 0 |
| Achievable – Low | 886,000,000 |
| Achievable – High | 1,180,000,000 |
| Adoption Ceiling | 3,600,000,000 |
Note: High adoption in this case results in lower energy use for each unit of clinker produced, and thus better efficiency.
Left Text Column Width
Improved cement production has high potential for climate impact. Since cement production is responsible for 7–8% of global GHG emissions, mitigating even a portion of these emissions will meaningfully reduce the world’s carbon output.
Clinker material substitution has the highest current and potential GHG emissions savings of the three approaches (Table 7a). To calculate the climate impact, we used effectiveness and adoption on the basis of Mt clinker avoided. Climate impact was calculated as:
CO₂ abatedyear =CO₂ abatedclinker avoidedx clinker avoidedyear
- Current GHG savings: 0.67 Gt CO₂‑eq/yr
- GHG savings ceiling: 2 Gt CO₂‑eq/yr
- Achievable GHG savings range: 0.7–1 Gt CO₂‑eq/yr
Alternative fuels have a low current climate impact but possess the potential to be adopted for a much greater fraction of the global kiln fuel mix (Table 7b). However, alternative fuels’ potential GHG emissions savings are lower than those for clinker material substitutes because alternative fuels have a lower CO₂ mitigation effectiveness. Climate impact is calculated as:
CO₂ abatedyear =CO₂ abatedcement producedx cement producedyear
- Current GHG savings: 0.03 Gt CO₂‑eq/yr
- GHG savings ceiling: 0.4 Gt CO₂‑eq/yr
- Achievable GHG savings range: 0.06–0.2 Gt CO₂‑eq/yr
Process efficiency upgrades are the most challenging to assess for climate impact because they represent a broad range of equipment upgrades with no clear baseline efficiency. We considered adoption to be energy savings from the current (2022) baseline in GJ thermal energy input/yr. We converted adoption to climate impact using the emission factor of 0.0847 t CO₂‑eq /GJ thermal energy input (calculated using data from Gómez & Watterson et al., 2006 and IEA, 2023c). The resulting calculation is as follows:
CO₂ abatedyear =CO₂ emissionsthermal energyx thermal energy savings from 2022 baselineyr
- Current GHG savings: N/A (we consider the current adoption to be the baseline)
- GHG savings ceiling: 0.31 Gt CO₂‑eq/yr less than 2022
- Achievable GHG savings range: 0.0760–0.101 Gt CO₂‑eq/yr less than 2022
While clinker material substitution, alternative fuels, and process efficiency upgrades are quantified separately here, the adoption of any of these approaches will reduce the climate impact of the others. In particular, the climate impacts for technologies that reduce emissions per Mt of clinker (such as alternative fuels and process efficiency upgrades) will be lower when implemented along with technologies that reduce the amount of clinker used (such as clinker material substitution), and vice versa (Glenk et al., 2023). Therefore, these impacts will not be additive, although they will contribute to reduced emissions when implemented together.
While our analysis found clinker material substitution to have the highest climate impact, cement manufacturers will have to prioritize these technologies depending on their plant’s existing equipment, local availability of materials, and regional cement standards.
left_text_column_width
Table 7. Climate impact at different levels of adoption.
Unit: Gt CO₂‑eq/yr, 100-yr basis
| Current Adoption | 0.67 |
| Achievable – Low | 0.7 |
| Achievable – High | 1 |
| Adoption Ceiling | 2 |
Unit: Gt CO₂‑eq/yr, 100-yr basis
| Current Adoption | 0.03 |
| Achievable – Low | 0.06 |
| Achievable – High | 0.2 |
| Adoption Ceiling | 0.4 |
Unit: Gt CO₂‑eq/yr, 100-yr basis
| Current Adoption | N/A |
| Achievable – Low | 0.075 |
| Achievable – High | 0.100 |
| Adoption Ceiling | 0.31 |
Left Text Column Width
Additional Benefits
The main non-climate benefits of improved cement production are reduced air pollution and improved public health.
Air Quality
Cement production is a major contributor to air pollution. Globally, concrete production accounts for approximately 8% of nitrogen oxide emissions, 5% of sulfur oxide emissions, and 5% of particulate matter emissions, with a significant portion of all these emissions stemming exclusively from cement production (Miller & Moore, 2020). Cement-related air pollution is especially acute in China, which produces over 50% of the world’s cement (U.S. Geological Survey, 2024). In 2009, China's cement industry emitted 3.59 Mt of particulate matter, making the industry the leading source of particulate matter emissions in the country (Yang et al., 2013). China also released 0.88 Mt of sulfur dioxide, accounting for about 4% of the national total, and emitted 1.7 Mt of nitrogen oxides (Yang et al., 2013). Process efficiency upgrades in cement manufacturing can reduce these harmful emissions. For example, implementing energy efficiency measures in China’s cement industry could reduce particulate matter by more than 3%, lower sulfur dioxide emissions by more than 15%, and decrease nitrogen oxide emissions by more than 12% by 2030 (Zhang et al., 2015). In Jiangsu province, which is the largest cement producer in China, energy and CO₂ reduction techniques could cut particulate matter and nitrogen oxide emissions by 30% and 56%, respectively, by 2030 (Zhang et al., 2018).
Health
Miller & Moore (2020) estimated that the health damages associated with cement production amounted to approximately US$60 billion globally in 2015. These health damages are due to air pollutants produced during cement manufacturing, which would be reduced by this solution as described above. In China, one study estimated that improving energy efficiency in the Jing Jin Ji region’s cement industry could prevent morbidity in 17,000 individuals (Zhang et al., 2021).
left_text_column_width
Risks
According to the U.S. Federal Highway Administration (n.d.), the use of clinker material substitutes in cement slows concrete curing times. Additionally, some clinker material substitutes, such as fly ash, raise ecotoxicity concerns and require safe handling (U.S. Department of Energy, 2022). Robust research and development is needed for new compositions of cement to accelerate testing, standardization, and adoption (Griffiths et al., 2023). Since regional standards vary for cement and concrete, policy and regulatory support designed for specific locations will be necessary to influence adoption levels and rates.
Most clinker material substitutes have limited or regional availability, leading to shortages, high costs, and transportation emissions (Habert et al., 2020). Because some substitute materials are sourced from the waste streams of other industries, such as the coal and steel industries, the long-term feasibility of sourcing these materials is uncertain (Goldman et al., 2023; Juenger et al., 2019). However, one study found that most leading cement-producing countries have substitute materials available in sufficient quantities to replace at least half of their current clinker usage (Shah et al., 2022).
In terms of risks associated with alternative fuels, they can be subject to regional scarcity. Lack of available waste fuel in particular could risk non-waste biomass burning, leading to deforestation and high net emissions (de Puy Kamp, 2021). In addition, waste fuels can have varying compositions that can lead to different heats of combustion, kiln compatibility, or emitted pollutants (Griffiths et al., 2023). Finally, the use of waste products requires cement plants to be situated near industrial waste sources, risking low adoption for cement plants that are not located near a waste source.
left_text_column_width
Interactions with Other Solutions
Reinforcing
Lower-carbon cement will improve the effectiveness and enhance the net climate impact of any solutions that might require new construction. The embodied emissions from the cement and concrete used for new built structures or roads will be reduced.
left_text_column_width
Technological advancements and increased adoption of efficient cement manufacturing equipment will improve the rate and cost of scaling similar high-efficiency machinery.
left_text_column_width
Industrial electrification in cement plants will be faster and easier to adopt if the plants’ energy demands are lowered via reduced clinker production and more efficient processes.
left_text_column_width
Competing
All of these solutions rely on biomass as a raw material or feedstock. For that reason, the use of biomass as an alternative kiln fuel or a source of ash for clinker substitutes will reduce the overall availability of biomass and increase the cost of using it for other applications.
left_text_column_width
Dashboard
Solution Basics
Mt clinker avoided/yr
t CO₂-eq/unit
690,000
units
Current
9801,0002,000
Achievable (Low to High)
Climate Impact
Gt CO₂-eq/yr
Current 0.67
0.71
US$ per t CO₂-eq
-30
Gradual
CO₂
Solution Basics
Mt cement produced using alternative fuels/yr
t CO₂-eq/unit
96,000
units
Current
3006102,000
Achievable (Low to High)
Climate Impact
Gt CO₂-eq/yr
Current 0.03
0.060.2
US$ per t CO₂-eq
-50
Gradual
CO₂
Solution Basics
GJ thermal energy input/yr reduced
t CO₂-eq/unit
0.08
units
Current
08.86×10⁸1.18×10⁹
Achievable (Low to High)
Climate Impact
Gt CO₂-eq/yr
0.080.1
US$ per t CO₂-eq
-60
Gradual
CO₂
Trade-offs
Wider adoption of clinker material substitutes, alternative fuels, and process efficiency upgrades could generate new GHG emissions, including emissions stemming from the transportation of clinker material substitutes and alternative fuels as well as embodied emissions from manufacturing and installing new cement plant equipment. Nevertheless, the overall solution effectiveness is not expected to be significantly impacted. In some of the largest cement-producing countries, the emissions from transport of clinker material substitutes has been calculated to be an order of magnitude less than the emissions savings from the use of those substitutes in place of clinker (Shah et al., 2022).
In terms of environmental impact, some clinker substitutes such as calcined clays and natural pozzolans can increase water use (Juenger et al., 2019; Snellings et al., 2023). Additionally, the use of biomass as an alternative fuel source could lead to trade-offs – such as increased water use and land use, or diminished resource availability – although the risk of this outcome is low since biomass for kiln fuels tends to be agricultural by-products or other waste (Clark et al., 2024; Georgiopoulou & Lyberatos, 2018).
left_text_column_width
Mt CO2-eq
< 2
2 - 4
4 - 6
6 - 8
8 - 10
> 10
Annual cement plant emissions, 2024
Cement production is responsible for approximately 4% of global GHG emissions. This is partly due to burning fossil fuels to run kilns and partly due to CO2 emissions associated with the chemistry of producing clinker, a key component of cement.
Sinha, A. and Crane, V. (2024). Manufacturing and industrial processes sector: Cement manufacturing emissions [Data set]. TransitionZero, Climate TRACE Emissions Inventory. Retrieved February 11, 2025, from https://climatetrace.org
Geographic Guidance Introduction
There are no location-specific constraints to the effectiveness of the Improve Cement Production solution as there are for solutions dependent on climatic factors. However, there is geographic variation associated with current uptake of solutions and feasibility/expense of future uptake. Moreover, the distribution of cement-producing facilities around the world is non-uniform, thus the solution set naturally has the greatest applicability in regions with the greatest concentration of cement production. China and India have particularly high production of cement at 51% and 8% of global totals in 2024, respectively (Sinha & Crane, 2024).
Newer cement plants are more likely to have high thermal efficiencies, and the age of cement plants varies around the world, with average ages of cement plants less than 20 years in much of Asia, and greater than 40 years in much of the US and Europe.
Uptake of alternative fuels is relatively high in Europe and low in the Americas.
While use of clinker substitutes is in principle possible anywhere, the materials themselves are not readily available everywhere, thus transportation costs and associated emissions can place constraints on their viability (Shah et al., 2022).
Action Word
Improve
Solution Title
Cement Production
Current State Introduction
Our analysis of the current state of solutions for improved cement production included three separate approaches to reducing emissions: clinker material substitution, alternative fuels, and process efficiency upgrades. Each approach had adoption units chosen based on data availability and consistency between calculated values. Figure 2 summarizes the units and conversions used for all approaches (Habert et al., 2020).
left_text_column_width
Figure 2: Units of quantification used in the Current State, Adoption, and Impacts analyses below.
| Approach | Clinker material substitution | Alternative fuels | Process efficiency upgrades |
|---|---|---|---|
| Effectiveness | t CO₂-eq abated/Mt clinker avoided* t CO₂ abated/Mt cement produced* |
t CO₂-eq abated/Mt cement produced | t CO₂-eq abated/GJ thermal energy input** t CO₂-eq abated/Mt cement produced** |
| Cost | US$/Mt cement produced | US$/Mt cement produced | US$/Mt cement produced |
| Adoption | Mt clinker avoided/yr | Mt cement/yr produced using alternative fuels | GJ thermal energy input saved/yr |
| Climate impact | Gt CO₂-eq/yr | Gt CO₂-eq/yr | Gt CO₂-eq/yr |
*Clinker material substitution effectiveness was calculated in two different adoption units using the same source data. Effectiveness in t CO₂‑eq abated/Mt cement produced was used to calculate cost per climate impact. Effectiveness was converted to t CO₂‑eq abated/Mt clinker avoided using the clinker-to-cement ratio for each individual study in the analysis, and this was used to calculate climate impact.
**Process efficiency upgrades effectiveness in units of t CO₂‑eq abated/Mt cement produced was used to calculate cost per climate impact. Separately, a calculated fuel emission factor effectiveness in units of t CO₂‑eq abated/GJ thermal energy was used to quantify climate impact.
Enable Download
On
Classification
Highly Recommended
Lawmakers and Policymakers
- Hold cement manufacturers accountable for safety standards.
- Regulate clinker material substitution, alternative fuel usage, and process efficiency upgrades.
- Set standards for low-carbon cement and reporting on embodied carbon for new projects.
- Provide financial incentives such as grants, subsidies, and/or carbon taxes.
- Set low-carbon cement standards for public procurement.
- Implement building codes and standards that allow for the safe, tested use of low-clinker cement while accounting for regional variability in cement compositions.
- When possible integrate low-carbon cement standards into industry standards such as LEED certification or CALGreen.
- Increase investment in research and development of clinker material substitutes.
- Promote a circular economy by creating reverse supply chains to collect industrial and biomass waste to be used as feedstocks for cement kilns and products.
- Require labels for low-carbon products and materials.
- Engage impacted communities and incorporate public feedback into policy design.
- Ensure permit processes for mining or collecting clinker substitutes allow local supply chains to develop.
- Integrate water management into policy planning when adopting new cement technologies, especially in drought-prone areas.
Further information:
- GCCA 2050 cement and concrete industry roadmap for net zero concrete. Global Cement and Concrete Association (2022)
- Making concrete change: Innovation in low-carbon cement and concrete. Lehne et al. (2018)
- Government relations and public policy job function action guide. Project Drawdown (2022)
- Legal job function action guide. Project Drawdown (2022)
- Industrial decarbonization roadmap. U.S. Department of Energy (2022)
Practitioners
- Increase the fraction of clinker substitutes in cement, which will reduce production costs.
- Use alternative fuels as manufacturing energy sources, ideally from renewable sources when possible, which will reduce production costs.
- Upgrade equipment and production process to be more efficient, which will reduce production costs.
- Invest in research and development for clinker material substitutes and process improvements.
- Work to form national and regional industrial strategies for low-carbon cement.
- Engage with local community members and use their feedback to create safer and healthier production facilities.
- Increase transparency and reporting around energy usage, fuel composition, and the material composition of cement products.
- Integrate water management safeguards when adopting new cement technologies, especially in drought-prone areas.
- Join, create, or participate in partnerships or certification programs dedicated to improving cement production.
Further information:
- GCCA 2050 cement and concrete industry roadmap for net zero concrete. Global Cement and Concrete Association (2022)
- Making concrete change: Innovation in low-carbon cement and concrete. Lehne et al. (2018)
- Industrial decarbonization roadmap. U.S. Department of Energy (2022)
Business Leaders
- Source from low-carbon cement producers.
- Advocate for low-carbon cement during project design and construction.
- Promote concrete alternatives in high-profile projects.
- Purchase, promote, and/or invest in local manufacturing and supply chains not only for materials and equipment used to make low-carbon cement, but also for low-carbon cementitious products.
- Create off-take agreements for emerging cement technologies.
- Create training and capacity-building programs for industry professionals related to the use and benefits of low-carbon cement and concrete.
- Launch education and awareness campaigns that share case studies and pilot projects with industry media and other key stakeholders.
- Leverage carbon markets to help subsidize the cost of low-carbon cement.
- Work with governments and financial institutions to establish standards and incentives for utilizing low-carbon materials.
Further information:
- GCCA 2050 cement and concrete industry roadmap for net zero concrete. Global Cement and Concrete Association (2022)
- Making concrete change: Innovation in low-carbon cement and concrete. Lehne et al. (2018)
- Industrial decarbonization roadmap. U.S. Department of Energy (2022)
- Drawdown-aligned business framework. Project Drawdown (2021)
Nonprofit Leaders
- Assist with monitoring and reporting related to energy usage, fuel composition, and the material composition of cement products.
- Help design policies and regulations that support low-carbon cement production.
- Educate the public about the urgent need for low-carbon cement while showcasing its many benefits.
- Encourage policymakers to create ambitious targets and regulations.
- Encourage cement manufacturers to improve their practices.
- Join, create, or participate in partnerships or certification programs dedicated to improving cement production.
Further information:
- GCCA 2050 cement and concrete industry roadmap for net zero concrete. Global Cement and Concrete Association (2022)
- Making concrete change: Innovation in low-carbon cement and concrete. Lehne et al. (2018)
- Industrial decarbonization roadmap. U.S. Department of Energy (2022)
Investors
- Invest in low-carbon cement producers, low-carbon cement research and development, and shared recycling infrastructure for cement materials.
- Invest in supply chains for new clinker substitutes, alternative fuels, and technologies that improve production efficiency.
- Encourage portfolio companies to produce low-carbon cement or source from low-carbon cement producers, noting that low-carbon retrofits will save money for producers.
- Seek impact investment opportunities, such as low-interest loans for construction or renovation projects that use low-carbon cement, or favorable loans for entities that set low-carbon cement policies or targets.
Further information:
- Low-carbon cement: Key considerations for investors. Third Derivative (2024)
- GCCA 2050 cement and concrete industry roadmap for net zero concrete. Global Cement and Concrete Association (2022)
- Making concrete change: Innovation in low-carbon cement and concrete. Lehne et al. (2018)
- Industrial decarbonization roadmap. U.S. Department of Energy (2022)
Philanthropists and International Aid Agencies
- Set low-carbon cement standards for construction-related grants, loans, and awards.
- Provide capital for local supply chains and the acquisition or production of clinker material substitutes.
- Support global, national, and local policies that promote low-carbon cement use.
- Explore opportunities to fund low-carbon cement start-ups.
- Advance awareness of the public health and climate benefits of low-carbon cement.
- Join, create, or participate in partnerships or certification programs dedicated to improving cement production.
Further information:
- GCCA 2050 cement and concrete industry roadmap for net zero concrete. Global Cement and Concrete Association (2022)
- Making concrete change: Innovation in low-carbon cement and concrete. Lehne et al. (2018)
- Industrial decarbonization roadmap. U.S. Department of Energy (2022)
Thought Leaders
- Provide technical assistance (e.g., circular economy design) to producers, government agencies, and other entities working to reduce cement emissions.
- Help design policies and regulations that support the adoption of low-carbon cement.
- Educate the public through campaigns emphasizing the urgent need to reduce cement production emissions.
- Encourage policymakers to create more ambitious targets and regulations.
- Pressure the cement industry to improve its production practices.
- Join, create, or participate in partnerships or certification programs dedicated to improving cement production.
Further information:
- GCCA 2050 cement and concrete industry roadmap for net zero concrete. Global Cement and Concrete Association (2022)
- Making concrete change: Innovation in low-carbon cement and concrete. Lehne et al. (2018)
- Industrial decarbonization roadmap. U.S. Department of Energy (2022)
Technologists and Researchers
- Develop new separation technology for recycling cement material.
- Assess new clinker substitutes and improve supply chains for known substitutes.
- Improve the efficiency of processing technology and equipment.
- Increase the safety of extraction, transport, handling, and processing of clinker material substitutes.
- Develop on-site testing and reporting methods for tracking the energy use of manufacturing processes, fuel composition, and the material composition of cement products.
- Examine and refine understandings of the potential revenue and price premiums of low-carbon cement products.
Further information:
- GCCA 2050 Cement and concrete industry roadmap for net zero concrete. Global Cement and Concrete Association (2022)
- Making concrete change: Innovation in low-carbon cement and concrete. Lehne et al. (2018)
- Industrial decarbonization roadmap. U.S. Department of Energy (2022)
Communities, Households, and Individuals
- Purchase low-carbon cement and concrete products when possible.
- Document your experiences if harmful cement production practices impact you. Share documentation of harmful cement production practices and/or other key messages with policymakers, the media, and your community.
- Encourage policymakers to improve regulations related to cement production.
- Support public education efforts to raise awareness about the urgent need to make cement production practices more environmentally sustainable.
- Pressure the cement industry to improve its production practices.
Further information:
- GCCA 2050 Cement and concrete industry roadmap for net zero concrete. Global Cement and Concrete Association (2022)
- Making concrete change: Innovation in low-carbon cement and concrete. Lehne et al. (2018)
- Industrial decarbonization roadmap. U.S. Department of Energy (2022)
Sources
- Decarbonising cement and concrete production: Strategies, challenges and pathways for sustainable development. Barbhuiya, S. et al. (2024)
- A sustainable future for the European cement and concrete industry: Technology assessment for full decarbonisation of the industry by 2050. Favier, A. et al. (2018)
- Pathways to commercial liftoff: Low-carbon cement. Goldman, S. et al. (2023)
- Decarbonizing the cement and concrete industry: A systematic review of socio-technical systems, technological innovations, and policy options. Griffiths, S. et al. (2023)
- Environmental impacts and decarbonization strategies in the cement and concrete industries. Habert, G. et al. (2020)
- Cement. International Energy Agency (2023)
- Making net-zero concrete and cement possible An industry-backed 1.5°C-aligned transition strategy. Mission Possible Partnership (2023)
- Technologies and policies to decarbonize global industry: Review and assessment of mitigation drivers through 2070. Rissman, J. et al. (2020)
- Industrial decarbonization roadmap. U.S. Department of Energy (2022)
Evidence Base
Consensus of effectiveness in reducing cement industry emissions: High
The cement industry produces an estimated 7–8% of global CO₂ emissions (Goldman et al., 2023), so this is an important area to target. There is high scientific consensus that clinker material substitution, alternative fuels, and process efficiency upgrades can be immediately and effectively implemented. Other emissions reduction strategies – including hydrogen kiln fuel, electrification, and carbon capture and storage technologies – have generated mixed scientific opinions on their potential for immediate impact and were not considered in this analysis.
The U.S. Department of Energy (2022) highlighted cement as one of five high-emitting industries with potential for mitigation. The technologies identified as having the highest level of maturity and market readiness were energy efficiency measures, biomass and natural gas fuels, material efficiency measures, and blended-material cements.
An extensive review of industrial decarbonization points to four technologies that could be implemented in the near term across global industries: electrification, material efficiency, energy efficiency, and circularity (Rissman et al., 2020). The European Cement Research Academy (2022) classified the three cement industry approaches considered in this solution – clinker material substitution, alternative fuels, and process efficiency upgrades – as meeting the highest technology readiness level.
Goldman et al. (2023) identified clinker material substitution, alternative fuels, and efficiency improvements as deployable today, estimating that these three approaches could abate 30% of U.S. cement industry emissions by 2030. Habert et al. (2020) proposed technologies that could reduce emissions up to 50% in the next few decades, including “cement improvements” of supplementary clinker materials, alternative fuels, and more efficient technologies. The International Energy Agency (IEA, 2018) estimated that clinker material replacement, alternative fuels, and efficiency improvements could provide 37%, 12%, and 3% of cement emissions savings by 2050, respectively.
The results presented in this document summarize findings from two reviews and meta-analyses, eight original studies, nine reports, and several data sets reflecting current evidence from 33 countries, primarily high cement-producing countries in North America, Europe, and Asia. We recognize this limited geographic scope creates bias, and hope this work inspires research and data sharing on this topic in underrepresented regions.
left_text_column_width
Updated Date