Agriculture is the dominant source of human-caused emissions of nitrous oxide (Figure 1; Tian et al., 2020). Nitrogen is critical for plant growth and is added to croplands in synthetic forms, such as urea, ammonium nitrate, or anhydrous ammonia; in organic forms, such as manure or compost; and by growing legume crops, which host microbes that capture nitrogen from the air and add it to the soil (Adalibieke et al., 2023; Ludemann et al., 2024). If more nitrogen is added than crops can use, the excess can be converted to other forms, including nitrous oxide, through microbial processes called denitrification and nitrification (Figure 2; Reay et al., 2012).
Improve Nutrient Management
Mode
Cut Emissions
Cluster
Shift Agriculture Practices
Image
Image
Coming Soon
Off
Summary
We define the Improve Nutrient Management solution as reducing excessive nitrogen use on croplands. Nitrogen is critical for crop production and is added to croplands as synthetic or organic fertilizers and through microbial activity. However, farmers often add more nitrogen to croplands than crops can use. Some of that excess nitrogen is emitted to the atmosphere as nitrous oxide, a potent GHG.
Overview
Figure 1. The agricultural nitrogen cycle represents the key pathways by which nitrogen is added to croplands and lost to the environment, including as nitrous oxide. The “4R” nutrient management principles – right source, right rate, right time, right place – increase the proportion of nitrogen taken up by the plant, therefore reducing nitrogen losses to the environment.
Image
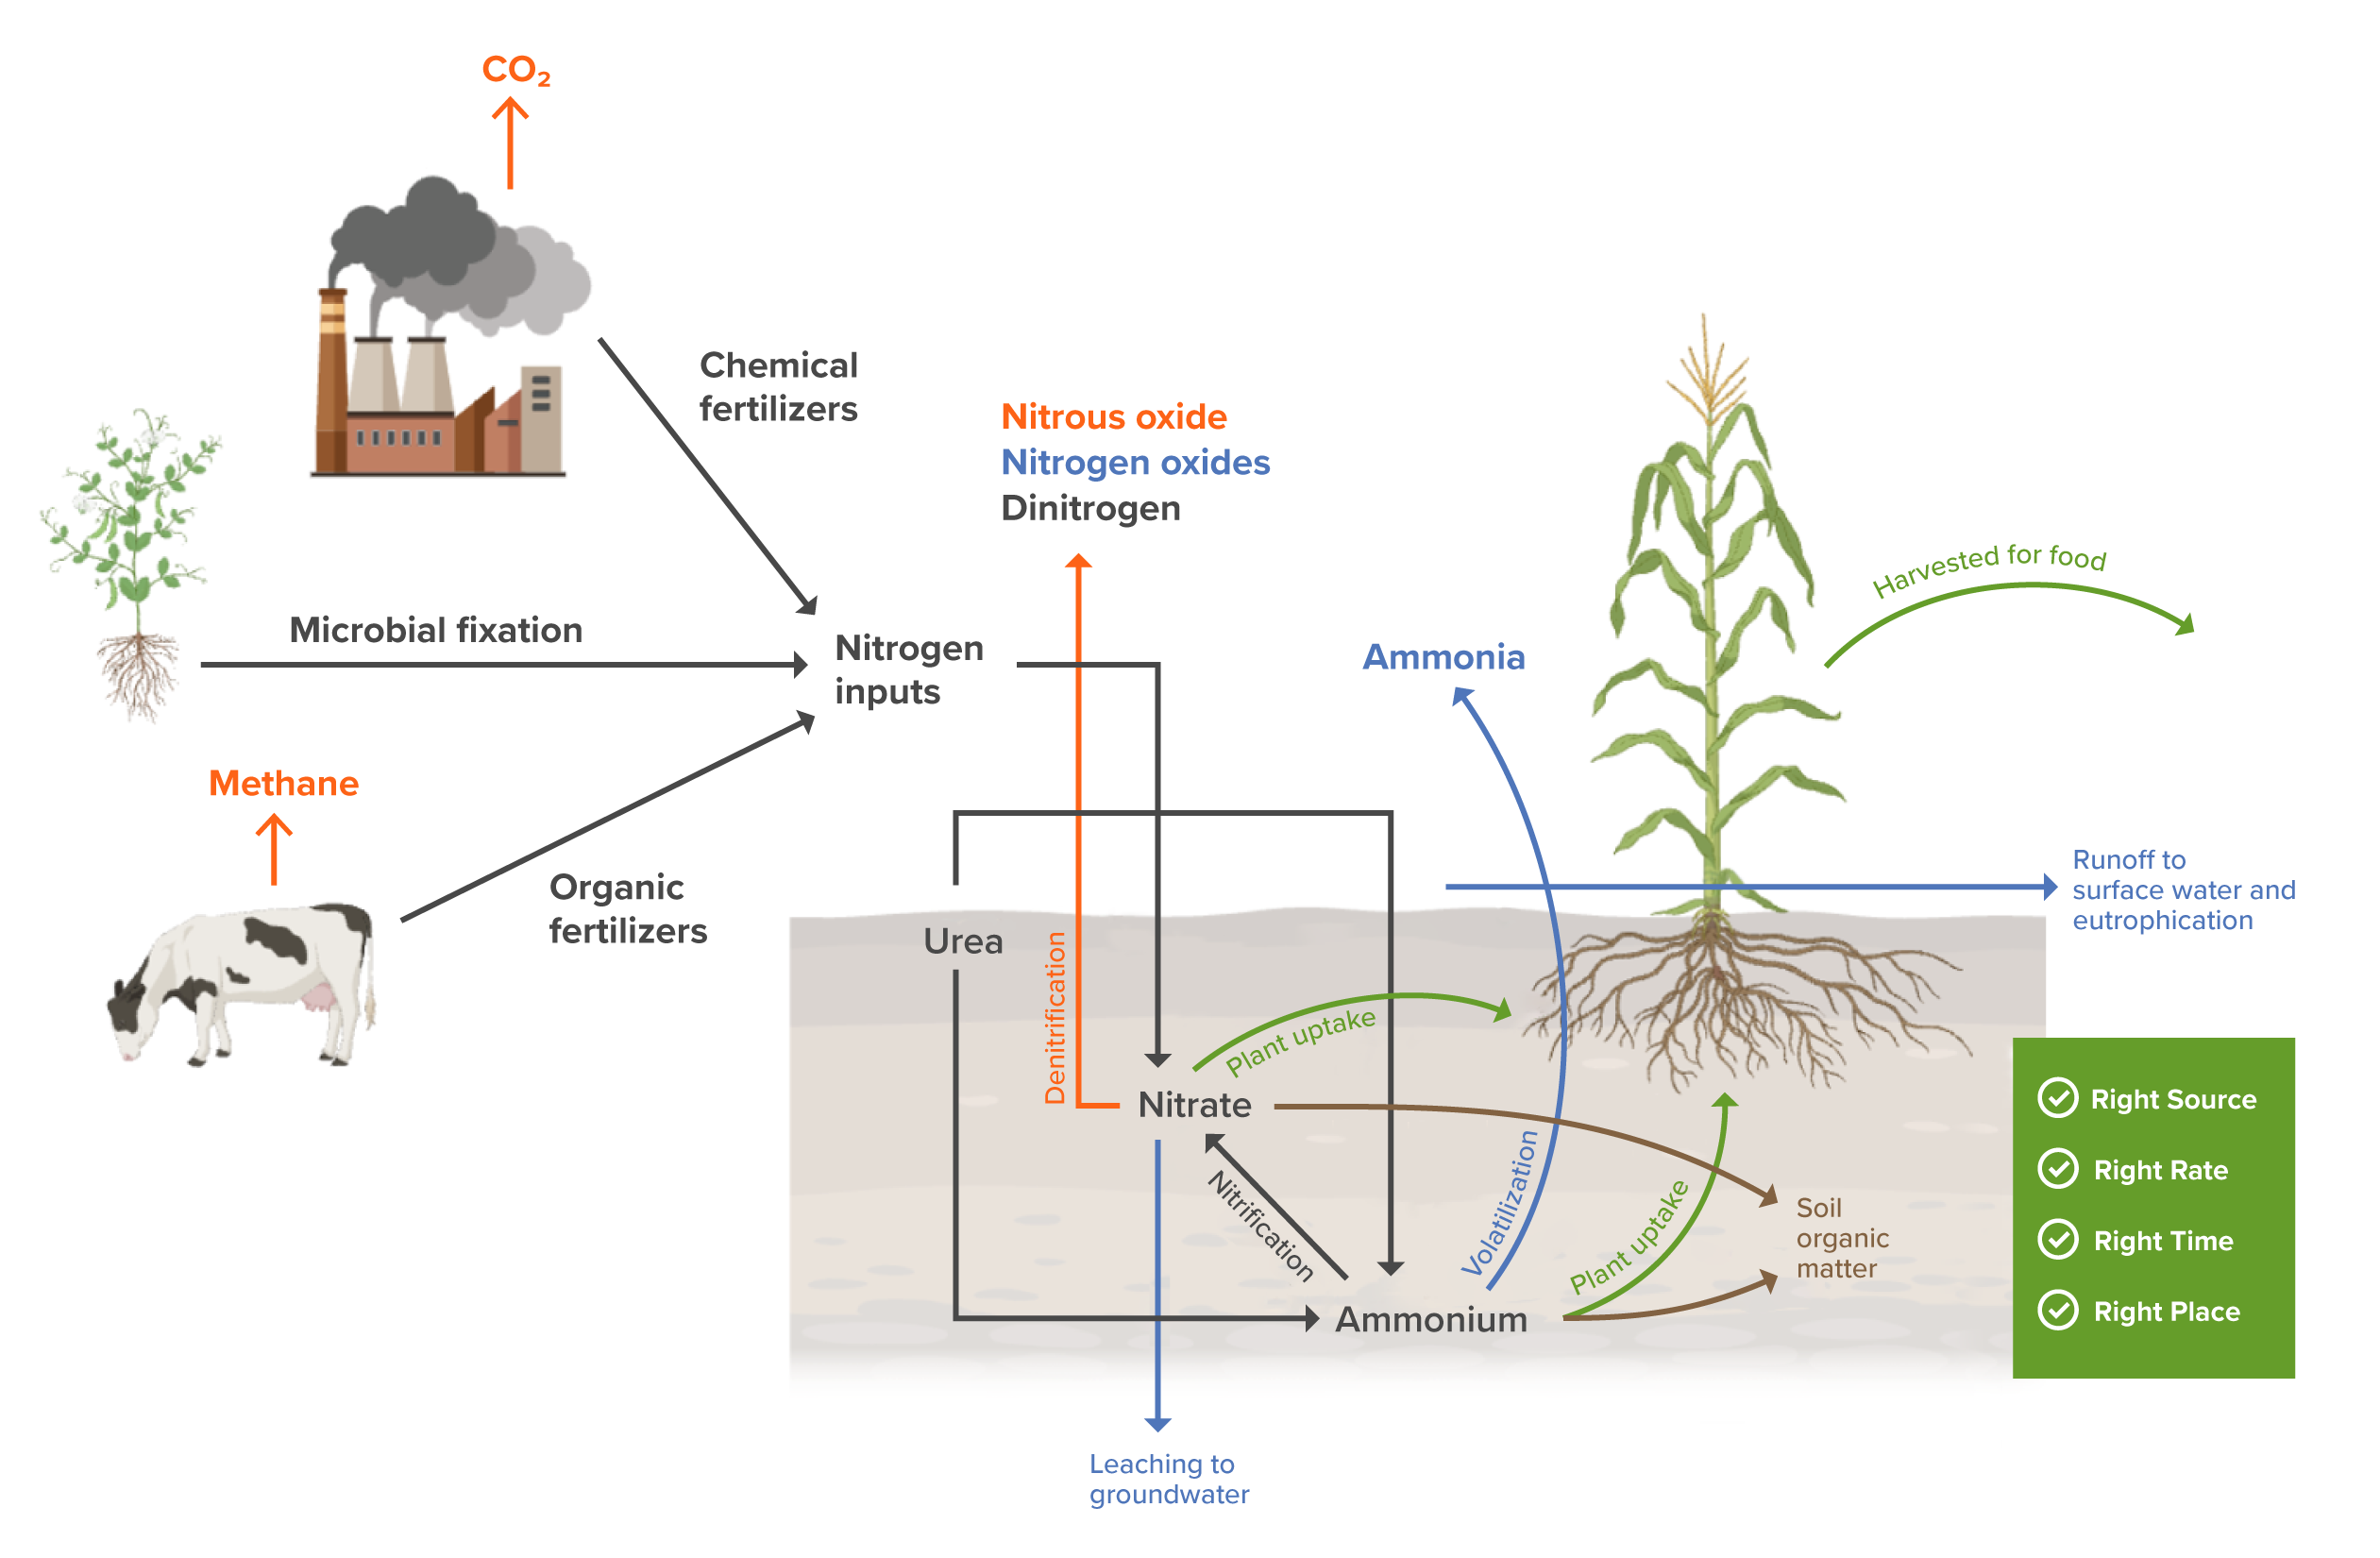
Illustrations: BioRender CC-BY 4.0
Farmers can reduce nitrous oxide emissions from croplands by using the right amount and the right type of fertilizer at the right time and in the right place (Fixen, 2020; Gao & Cabrera Serrenho, 2023). Together, these four “rights” increase nitrogen use efficiency – the proportion of applied nitrogen that the crop uses (Congreves et al., 2021). Improved nutrient management is often a win-win for the farmer and the environment, reducing fertilizer costs while also lowering nitrous oxide emissions (Gu et al., 2023).
Improving nutrient management involves reducing the amount of nitrogen applied to match the crop’s requirements in areas where nitrogen is currently overapplied. A farmer can implement the other three principles – type, time, and place – in a number of ways. For example, fertilizing just before planting instead of after the previous season’s harvest better matches the timing of nitrogen addition to that of plant uptake, reducing nitrous oxide emissions before the crop is planted. Certain types of fertilizers are better suited for maximizing plant uptake, such as extended-release fertilizers, which allow the crop to steadily absorb nutrients over time. Techniques such as banding, in which farmers apply fertilizers in concentrated bands close to the plant roots instead of spreading them evenly across the soil surface, also reduce nitrous oxide emissions. Each of these practices can increase nitrogen use efficiency and decrease the amount of excess nitrogen lost as nitrous oxide (Gao & Cabrera Serrenho, 2023; Gu et al., 2023; Wang et al., 2024; You et al., 2023).
For this solution, we estimated a target rate of nitrogen application for major crops as the 20th percentile of the current rate of nitrogen application (in tN/t crop) in areas where yields are near a realistic ceiling. Excess nitrogen was defined as the amount of nitrogen applied beyond the target rate (see Adoption and Appendix for more details). Our emissions estimates include nitrous oxide from croplands, fertilizer runoff, and fertilizer volatilization. They do not include emissions from fertilizer manufacturing, which are addressed in the Deploy Low-Emission Industrial Feedstocks and Increase Industrial Efficiency solutions. We excluded nutrient management on pastures from this solution due to data limitations, and address nutrient management in paddy rice systems in the Improve Rice Management solution instead.
References
Adalibieke, W., Cui, X., Cai, H., You, L., & Zhou, F. (2023). Global crop-specific nitrogen fertilization dataset in 1961–2020. Scientific Data, 10(1), 617. https://doi.org/10.1038/s41597-023-02526-z
Almaraz, M., Bai, E., Wang, C., Trousdell, J., Conley, S., Faloona, I., & Houlton, B. Z. (2018). Agriculture is a major source of NOx pollution in California. Science Advances, 4(1), eaao3477. https://doi.org/10.1126/sciadv.aao3477
Antil, R. S., & Raj, D. (2020). Integrated nutrient management for sustainable crop production and improving soil health. In R. S. Meena (Ed.), Nutrient Dynamics for Sustainable Crop Production (pp. 67–101). Springer. https://doi.org/10.1007/978-981-13-8660-2_3
Bijay-Singh, & Craswell, E. (2021). Fertilizers and nitrate pollution of surface and ground water: An increasingly pervasive global problem. SN Applied Sciences, 3(4), 518. https://doi.org/10.1007/s42452-021-04521-8
Chivenge, P., Saito, K., Bunquin, M. A., Sharma, S., & Dobermann, A. (2021). Co-benefits of nutrient management tailored to smallholder agriculture. Global Food Security, 30, 100570. https://doi.org/10.1016/j.gfs.2021.100570
Deng, J., Guo, L., Salas, W., Ingraham, P., Charrier-Klobas, J. G., Frolking, S., & Li, C. (2018). Changes in irrigation practices likely mitigate nitrous oxide emissions from California cropland. Global Biogeochemical Cycles, 32(10), 1514–1527. https://doi.org/10.1029/2018GB005961
Domingo, N. G. G., Balasubramanian, S., Thakrar, S. K., Clark, M. A., Adams, P. J., Marshall, J. D., Muller, N. Z., Pandis, S. N., Polasky, S., Robinson, A. L., Tessum, C. W., Tilman, D., Tschofen, P., & Hill, J. D. (2021). Air quality–related health damages of food. Proceedings of the National Academy of Sciences, 118(20), e2013637118. https://doi.org/10.1073/pnas.2013637118
Elberling, B. B., Kovács, G. M., Hansen, H. F. E., Fensholt, R., Ambus, P., Tong, X., Gominski, D., Mueller, C. W., Poultney, D. M. N., & Oehmcke, S. (2023). High nitrous oxide emissions from temporary flooded depressions within croplands. Communications Earth & Environment, 4(1), 1–9. https://doi.org/10.1038/s43247-023-01095-8
Fixen, P. E. (2020). A brief account of the genesis of 4R nutrient stewardship. Agronomy Journal, 112(5), 4511–4518. https://doi.org/10.1002/agj2.20315
Foley, J. A., Ramankutty, N., Brauman, K. A., Cassidy, E. S., Gerber, J. S., Johnston, M., Mueller, N. D., O’Connell, C., Ray, D. K., West, P. C., Balzer, C., Bennett, E. M., Carpenter, S. R., Hill, J., Monfreda, C., Polasky, S., Rockström, J., Sheehan, J., Siebert, S., … Zaks, D. P. M. (2011). Solutions for a cultivated planet. Nature, 478(7369), 337–342. https://doi.org/10.1038/nature10452
Gao, Y., & Cabrera Serrenho, A. (2023). Greenhouse gas emissions from nitrogen fertilizers could be reduced by up to one-fifth of current levels by 2050 with combined interventions. Nature Food, 4(2), 170–178. https://doi.org/10.1038/s43016-023-00698-w
Gerber, J. S., Carlson, K. M., Makowski, D., Mueller, N. D., Garcia de Cortazar-Atauri, I., Havlík, P., Herrero, M., Launay, M., O’Connell, C. S., Smith, P., & West, P. C. (2016). Spatially explicit estimates of nitrous oxide emissions from croplands suggest climate mitigation opportunities from improved fertilizer management. Global Change Biology, 22(10), 3383–3394. https://doi.org/10.1111/gcb.13341
Gerber, J. S., Ray, D. K., Makowski, D., Butler, E. E., Mueller, N. D., West, P. C., Johnson, J. A., Polasky, S., Samberg, L. H., & Siebert, S. (2024). Global spatially explicit yield gap time trends reveal regions at risk of future crop yield stagnation. Nature Food, 5(2), 125–135. https://doi.org/10.1038/s43016-023-00913-8
Gong, C., Tian, H., Liao, H., Pan, N., Pan, S., Ito, A., Jain, A. K., Kou-Giesbrecht, S., Joos, F., Sun, Q., Shi, H., Vuichard, N., Zhu, Q., Peng, C., Maggi, F., Tang, F. H. M., & Zaehle, S. (2024). Global net climate effects of anthropogenic reactive nitrogen. Nature, 632(8025), 557–563. https://doi.org/10.1038/s41586-024-07714-4
Gu, B., Zhang, X., Lam, S. K., Yu, Y., van Grinsven, H. J. M., Zhang, S., Wang, X., Bodirsky, B. L., Wang, S., Duan, J., Ren, C., Bouwman, L., de Vries, W., Xu, J., Sutton, M. A., & Chen, D. (2023). Cost-effective mitigation of nitrogen pollution from global croplands. Nature, 613(7942), 77–84. https://doi.org/10.1038/s41586-022-05481-8
Hergoualc’h, K., Akiyama, H., Bernoux, M., Chirinda, N., del Prado, A., Kasimir, Å., MacDonald, J. D., Ogle, S. M., Regina, K., & van der Weerden, T. J. (2019). Chapter 11: nitrous oxide Emissions from managed soils, and CO₂ emissions from lime and urea application (2019 Refinement to the 2006 IPCC Guidelines for National Greenhouse Gas Inventories). Intergovernmental Panel on Climate Change. https://www.ipcc-nggip.iges.or.jp/public/2019rf/pdf/4_Volume4/19R_V4_Ch11_Soils_nitrous oxide_CO₂. pdf
Hergoualc’h, K., Mueller, N., Bernoux, M., Kasimir, Ä., van der Weerden, T. J., & Ogle, S. M. (2021). Improved accuracy and reduced uncertainty in greenhouse gas inventories by refining the IPCC emission factor for direct nitrous oxide emissions from nitrogen inputs to managed soils. Global Change Biology, 27(24), 6536–6550. https://doi.org/10.1111/gcb.15884
IPCC, 2019: Summary for Policymakers. In: Climate Change and Land: an IPCC special report on climate change, desertification, land degradation, sustainable land management, food security, and greenhouse gas fluxes in terrestrial ecosystems [P.R. Shukla, J. Skea, E. Calvo Buendia, V. Masson-Delmotte, H.-O. Pörtner, D. C. Roberts, P. Zhai, R. Slade, S. Connors, R. van Diemen, M. Ferrat, E. Haughey, S. Luz, S. Neogi, M. Pathak, J. Petzold, J. Portugal Pereira, P. Vyas, E. Huntley, K. Kissick, M. Belkacemi, J. Malley, (eds.)].
Lam, S. K., Suter, H., Mosier, A. R., & Chen, D. (2017). Using nitrification inhibitors to mitigate agricultural nitrous oxide emission: A double-edged sword? Global Change Biology, 23(2), 485–489. https://doi.org/10.1111/gcb.13338
Lawrence, N. C., Tenesaca, C. G., VanLoocke, A., & Hall, S. J. (2021). Nitrous oxide emissions from agricultural soils challenge climate sustainability in the US Corn Belt. Proceedings of the National Academy of Sciences, 118(46), e2112108118. https://doi.org/10.1073/pnas.2112108118
Ludemann, C. I., Wanner, N., Chivenge, P., Dobermann, A., Einarsson, R., Grassini, P., Gruere, A., Jackson, K., Lassaletta, L., Maggi, F., Obli-Laryea, G., van Ittersum, M. K., Vishwakarma, S., Zhang, X., & Tubiello, F. N. (2024). A global FAOSTAT reference database of cropland nutrient budgets and nutrient use efficiency (1961–2020): Nitrogen, phosphorus and potassium. Earth System Science Data, 16(1), 525–541. https://doi.org/10.5194/essd-16-525-2024
Menegat, S., Ledo, A., & Tirado, R. (2022). Greenhouse gas emissions from global production and use of nitrogen synthetic fertilisers in agriculture. Scientific Reports, 12(1), 14490. https://doi.org/10.1038/s41598-022-18773-w
Michaelowa, A., Hermwille, L., Obergassel, W., & Butzengeiger, S. (2019). Additionality revisited: Guarding the integrity of market mechanisms under the Paris Agreement. Climate Policy, 19(10), 1211–1224. https://doi.org/10.1080/14693062.2019.1628695
Mueller, N. D., Gerber, J. S., Johnston, M., Ray, D. K., Ramankutty, N., & Foley, J. A. (2012). Closing yield gaps through nutrient and water management. Nature, 490(7419), Article 7419. https://doi.org/10.1038/nature11420
Patel, N., Srivastav, A. L., Patel, A., Singh, A., Singh, S. K., Chaudhary, V. K., Singh, P. K., & Bhunia, B. (2022). Nitrate contamination in water resources, human health risks and its remediation through adsorption: A focused review. Environmental Science and Pollution Research, 29(46), 69137–69152. https://doi.org/10.1007/s11356-022-22377-2
Pinder, R. W., Davidson, E. A., Goodale, C. L., Greaver, T. L., Herrick, J. D., & Liu, L. (2012). Climate change impacts of US reactive nitrogen. Proceedings of the National Academy of Sciences, 109(20), 7671–7675. https://doi.org/10.1073/pnas.1114243109
Porter, E. M., Bowman, W. D., Clark, C. M., Compton, J. E., Pardo, L. H., & Soong, J. L. (2013). Interactive effects of anthropogenic nitrogen enrichment and climate change on terrestrial and aquatic biodiversity. Biogeochemistry, 114(1), 93–120. https://doi.org/10.1007/s10533-012-9803-3
Qiao, C., Liu, L., Hu, S., Compton, J. E., Greaver, T. L., & Li, Q. (2015). How inhibiting nitrification affects nitrogen cycle and reduces environmental impacts of anthropogenic nitrogen input. Global Change Biology, 21(3), 1249–1257. https://doi.org/10.1111/gcb.12802
Qin, Z., Deng, S., Dunn, J., Smith, P., & Sun, W. (2021). Animal waste use and implications to agricultural greenhouse gas emissions in the United States. Environmental Research Letters, 16(6), 064079. https://doi.org/10.1088/1748-9326/ac04d7
Reay, D. S., Davidson, E. A., Smith, K. A., Smith, P., Melillo, J. M., Dentener, F., & Crutzen, P. J. (2012). Global agriculture and nitrous oxide emissions. Nature Climate Change, 2(6), 410–416. https://doi.org/10.1038/nclimate1458
Rockström, J., Williams, J., Daily, G., Noble, A., Matthews, N., Gordon, L., Wetterstrand, H., DeClerck, F., Shah, M., Steduto, P., de Fraiture, C., Hatibu, N., Unver, O., Bird, J., Sibanda, L., & Smith, J. (2017). Sustainable intensification of agriculture for human prosperity and global sustainability. Ambio, 46(1), 4–17. https://doi.org/10.1007/s13280-016-0793-6
Rurinda, J., Zingore, S., Jibrin, J. M., Balemi, T., Masuki, K., Andersson, J. A., Pampolino, M. F., Mohammed, I., Mutegi, J., Kamara, A. Y., Vanlauwe, B., & Craufurd, P. Q. (2020). Science-based decision support for formulating crop fertilizer recommendations in sub-Saharan Africa. Agricultural Systems, 180, 102790. https://doi.org/10.1016/j.agsy.2020.102790
Scavia, D., David Allan, J., Arend, K. K., Bartell, S., Beletsky, D., Bosch, N. S., Brandt, S. B., Briland, R. D., Daloğlu, I., DePinto, J. V., Dolan, D. M., Evans, M. A., Farmer, T. M., Goto, D., Han, H., Höök, T. O., Knight, R., Ludsin, S. A., Mason, D., … Zhou, Y. (2014). Assessing and addressing the re-eutrophication of Lake Erie: Central basin hypoxia. Journal of Great Lakes Research, 40(2), 226–246. https://doi.org/10.1016/j.jglr.2014.02.004
Selim, M. M. (2020). Introduction to the integrated nutrient management strategies and their contribution to yield and soil properties. International Journal of Agronomy, 2020(1), 2821678. https://doi.org/10.1155/2020/2821678
Shcherbak, I., Millar, N., & Robertson, G. P. (2014). Global metaanalysis of the nonlinear response of soil nitrous oxide (nitrous oxide) emissions to fertilizer nitrogen. Proceedings of the National Academy of Sciences, 111(25), 9199–9204. https://doi.org/10.1073/pnas.1322434111
Shindell, D. T., Faluvegi, G., Koch, D. M., Schmidt, G. A., Unger, N., & Bauer, S. E. (2009). Improved attribution of climate forcing to emissions. Science, 326(5953), 716–718. https://doi.org/10.1126/science.1174760
Sobota, D. J., Compton, J. E., McCrackin, M. L., & Singh, S. (2015). Cost of reactive nitrogen release from human activities to the environment in the United States. Environmental Research Letters, 10(2), 025006. https://doi.org/10.1088/1748-9326/10/2/025006
Tian, H., Xu, R., Canadell, J. G., Thompson, R. L., Winiwarter, W., Suntharalingam, P., Davidson, E. A., Ciais, P., Jackson, R. B., Janssens-Maenhout, G., Prather, M. J., Regnier, P., Pan, N., Pan, S., Peters, G. P., Shi, H., Tubiello, F. N., Zaehle, S., Zhou, F., … Yao, Y. (2020). A comprehensive quantification of global nitrous oxide sources and sinks. Nature, 586(7828), 248–256. https://doi.org/10.1038/s41586-020-2780-0
van Grinsven, H. J. M., Bouwman, L., Cassman, K. G., van Es, H. M., McCrackin, M. L., & Beusen, A. H. W. (2015). Losses of ammonia and nitrate from agriculture and their effect on nitrogen recovery in the European Union and the United States between 1900 and 2050. Journal of Environmental Quality, 44(2), 356–367. https://doi.org/10.2134/jeq2014.03.0102
Vanlauwe, B., Descheemaeker, K., Giller, K. E., Huising, J., Merckx, R., Nziguheba, G., Wendt, J., & Zingore, S. (2015). Integrated soil fertility management in sub-Saharan Africa: Unravelling local adaptation. SOIL, 1(1), 491–508. https://doi.org/10.5194/soil-1-491-2015
Wang, C., Shen, Y., Fang, X., Xiao, S., Liu, G., Wang, L., Gu, B., Zhou, F., Chen, D., Tian, H., Ciais, P., Zou, J., & Liu, S. (2024). Reducing soil nitrogen losses from fertilizer use in global maize and wheat production. Nature Geoscience, 17(10), 1008–1015. https://doi.org/10.1038/s41561-024-01542-x
Wang, Y., Li, C., Li, Y., Zhu, L., Liu, S., Yan, L., Feng, G., & Gao, Q. (2020). Agronomic and environmental benefits of Nutrient Expert on maize and rice in Northeast China. Environmental Science and Pollution Research, 27(22), 28053–28065. https://doi.org/10.1007/s11356-020-09153-w
Ward, M. H., Jones, R. R., Brender, J. D., de Kok, T. M., Weyer, P. J., Nolan, B. T., Villanueva, C. M., & van Breda, S. G. (2018). Drinking water nitrate and human health: an updated review. International Journal of Environmental Research and Public Health, 15(7), 1557. https://doi.org/10.3390/ijerph15071557
Withers, P. J. A., Neal, C., Jarvie, H. P., & Doody, D. G. (2014). Agriculture and eutrophication: where do we go from here? Sustainability, 6(9), Article 9. https://doi.org/10.3390/su6095853
You, L., Ros, G. H., Chen, Y., Shao, Q., Young, M. D., Zhang, F., & de Vries, W. (2023). Global mean nitrogen recovery efficiency in croplands can be enhanced by optimal nutrient, crop and soil management practices. Nature Communications, 14(1), 5747. https://doi.org/10.1038/s41467-023-41504-2
Zaehle, S., Ciais, P., Friend, A. D., & Prieur, V. (2011). Carbon benefits of anthropogenic reactive nitrogen offset by nitrous oxide emissions. Nature Geoscience, 4(9), 601–605. https://doi.org/10.1038/ngeo1207
Zhang, X., Fang, Q., Zhang, T., Ma, W., Velthof, G. L., Hou, Y., Oenema, O., & Zhang, F. (2020). Benefits and trade-offs of replacing synthetic fertilizers by animal manures in crop production in China: A meta-analysis. Global Change Biology, 26(2), 888–900. https://doi.org/10.1111/gcb.14826
Credits
Lead Fellow
Avery Driscoll, Ph.D.
Contributors
Ruthie Burrows, Ph.D.
James Gerber, Ph.D.
Yusuf Jameel, Ph.D.
Daniel Jasper
Alex Sweeney
Eric Toensmeier
Internal Reviewers
Aiyana Bodi
Hannah Henkin
Ted Otte
Effectiveness
We relied on the 2019 IPCC emissions factors to calculate the emissions impacts of improved nutrient management. These are disaggregated by climate zone (“wet” vs. “dry”) and by fertilizer type (“organic” vs. “synthetic”). Nitrogen use reductions in wet climates, which include ~65% of the cropland area represented in this analysis (see Appendix for details), have the largest impact. In these areas, a 1 t reduction in nitrogen use reduces emissions by 8.7 t CO₂‑eq on average for synthetic fertilizers and by 5.0 t CO₂‑eq for organic fertilizers. Emissions savings are lower in dry climates, where a 1 t reduction in nitrogen use reduces emissions by 2.4 t CO₂‑eq for synthetic fertilizers and by 2.6 t CO₂‑eq for organic fertilizers. While these values reflect the median emissions reduction for each climate zone and fertilizer type, they are associated with large uncertainties because emissions are highly variable depending on climate, soil, and management conditions.
Based on our analysis of the adoption ceiling for each climate zone and fertilizer type (see Appendix), we estimated that a 1 t reduction in nitrogen use reduces emissions by 6.0 t CO₂‑eq at the global average (Table 1). This suggests that ~1.4% of the applied nitrogen is emitted as nitrous oxide at the global average, which is consistent with existing estimates (IPCC, 2019).
left_text_column_width
Table 1. Effectiveness at reducing emissions.
Unit: t CO₂‑eq /tN, 100-yr basis
| 25th percentile | 4.2 |
| median (50th percentile) | 6.0 |
| 75th percentile | 7.7 |
Left Text Column Width
Cost
Improving nutrient management typically reduces fertilizer costs while maintaining or increasing yields, resulting in a net financial benefit to the producer. Gu et al. (2023) found that a 21% reduction in global nitrogen use would be economically beneficial, notably after accounting for increased fertilizer use in places that do not currently have adequate access. Using data from their study, we evaluated the average cost of reduced nitrogen application considering the following nutrient management practices: increased use of high-efficiency fertilizers, organic fertilizers, and/or legumes; optimizing fertilizer rates; altering the timing and/or placement of fertilizer applications; and use of buffer zones. Implementation costs depend on the strategy used to improve nutrient management. For example, optimizing fertilizer rates requires soil testing and the ability to apply different fertilizer rates to different parts of a field. Improving timing can involve applying fertilizers at two different times during the season, increasing labor and equipment operation costs. Furthermore, planting legumes incurs seed purchase and planting costs.
Gu et al. (2023) estimated that annual reductions of 42 Mt of nitrogen were achievable globally using these practices, providing total fertilizer savings of US$37.2 billion and requiring implementation costs of US$15.9 billion, adjusted for inflation to 2023. A 1 t reduction in excess nitrogen application, therefore, was estimated to provide an average of US$507.80 of net cost savings, corresponding to a savings of US$85.21 per t CO₂‑eq of emissions reductions (Table 2).
left_text_column_width
Table 2. Cost per unit of climate impact, 100-yr basis.
Unit: 2023 US$/t CO₂‑eq
| mean | -85.21 |
Left Text Column Width
Methods and Supporting Data
Abatzoglou, J. T., Dobrowski, S. Z., Parks, S. A., & Hegewisch, K. C. (2018). TerraClimate, a high-resolution global dataset of monthly climate and climatic water balance from 1958–2015. Scientific Data, 5(1), 170191. https://doi.org/10.1038/sdata.2017.191
Adalibieke, W., Cui, X., Cai, H., You, L., & Zhou, F. (2023). Global crop-specific nitrogen fertilization dataset in 1961–2020. Scientific Data, 10(1), 617. https://doi.org/10.1038/s41597-023-02526-z
Gerber, J. S., Ray, D. K., Makowski, D., Butler, E. E., Mueller, N. D., West, P. C., Johnson, J. A., Polasky, S., Samberg, L. H., & Siebert, S. (2024). Global spatially explicit yield gap time trends reveal regions at risk of future crop yield stagnation. Nature Food, 5(2), 125–135. https://doi.org/10.1038/s43016-023-00913-8
IPCC, 2019: Summary for Policymakers. In: Climate Change and Land: an IPCC special report on climate change, desertification, land degradation, sustainable land management, food security, and greenhouse gas fluxes in terrestrial ecosystems [P.R. Shukla, J. Skea, E. Calvo Buendia, V. Masson-Delmotte, H.-O. Pörtner, D. C. Roberts, P. Zhai, R. Slade, S. Connors, R. van Diemen, M. Ferrat, E. Haughey, S. Luz, S. Neogi, M. Pathak, J. Petzold, J. Portugal Pereira, P. Vyas, E. Huntley, K. Kissick, M. Belkacemi, J. Malley, (eds.)].
Mehta, P., Siebert, S., Kummu, M., Deng, Q., Ali, T., Marston, L., Xie, W., & Davis, K. F. (2024). Half of twenty-first century global irrigation expansion has been in water-stressed regions. Nature Water, 2(3), 254–261. https://doi.org/10.1038/s44221-024-00206-9
Learning Curve
The improved nutrient management strategies considered for this solution are already well-established and widely deployed (Fixen, 2020). Large nitrogen excesses are relatively easy to mitigate through simple management changes with low implementation costs. As nitrogen use efficiency increases, further reductions may require increasingly complex mitigation practices and increasing marginal costs. Therefore, a learning curve was not quantified for this solution.
left_text_column_width
Speed of Action
Speed of action refers to how quickly a climate solution physically affects the atmosphere after it is deployed. This is different from speed of deployment, which is the pace at which solutions are adopted.
At Project Drawdown, we define the speed of action for each climate solution as gradual, emergency brake, or delayed.
Improve Nutrient Management is a GRADUAL climate solution. It has a steady, linear impact on the atmosphere. The cumulative effect over time builds as a straight line.
left_text_column_width
Caveats
Emissions reductions from improved nutrient management are permanent, though they may not be additional in all cases.
Permanence
As this solution reduces emissions rather than enhancing sequestration, permanence is not applicable.
Additionality
Additionality requires that the emissions benefits of the practice are attributable to climate-related incentives and would not have occurred in the absence of incentives (Michaelowa et al., 2019). If they are not contingent on external incentives, fertilizer use reductions implemented solely to maximize profits do not meet the threshold for additionality. However, fertilizer reductions may be additional if incentives are required to provide access to the technical knowledge and soil testing required to identify optimal rates. Other forms of nutrient management (e.g., applying nitrification inhibitors, using extended-release or organic fertilizers, or splitting applications between two time points) may involve additional costs, substantial practice change, and technical expertise. Thus, these practices are likely to be additional.
left_text_column_width
Current Adoption
Given that improved nutrient management takes a variety of forms and data on the adoption of individual practices are very limited, we leveraged several global datasets related to nitrogen use and yields to directly assess improvements in nitrogen use efficiency (see Appendix for details).
First, we calculated nitrogen use per t of crop produced using global maps of nitrogen fertilizer use (Adalibieke et al., 2023) and global maps of crop yields (Gerber et al., 2024) for 17 major crops (see Appendix). Next, we determined a target nitrogen use rate (t N/t crop) for each crop, corresponding to the 20th percentile of nitrogen use rates observed in croplands with yield gaps at or below the 20th percentile, meaning that actual yields were close to an attainable yield ceiling (Gerber et al., 2024). Areas with large yield gaps were excluded from the calculation of target nutrient use efficiency because insufficient nitrogen supply may be compromising yields (Mueller et al., 2012). Yield data were not available for a small number of crops; for these, we assumed reductions in nitrogen use to be proportional to those of other crops.
We considered croplands that had achieved the target rate and had yield gaps lower than the global median to have adopted the solution. We calculated the amount of excess nitrogen use avoided from these croplands as the difference in total nitrogen use under current fertilization rates relative to median fertilizer application rates. As of 2020, croplands that had achieved the adoption threshold for improved nutrient management avoided 10.45 Mt of nitrogen annually relative to the median nitrogen use rate (Table 3), equivalent to 11% of the adoption ceiling.
left_text_column_width
Table 3. Current (2020) adoption level.
Unit: tN/yr
| estimate | 10,450,000 |
Left Text Column Width
Adoption Trend
Global average nitrogen use efficiency increased from 47.7% to 54.6% between 2000 and 2020, a rate of approximately 0.43%/yr (Ludemann et al., 2024). This increase accelerated somewhat in the latter decade, from an average rate of 0.38%/yr to 0.53%/yr. Underlying this increase were increases in both the amount of nitrogen used and the amount of excess nitrogen. Total nitrogen additions increased by approximately 2.64 Mt/yr, with the amount of nitrogen used increasing more rapidly (1.99 Mt/yr) than the amount of excess nitrogen (0.65 Mt/yr) between 2000 and 2020 (Ludemann et al., 2024). Although nitrogen use increased between 2000 and 2020 as yields increased, the increase in nitrogen use efficiency suggests uptake of this solution.
left_text_column_width
Adoption Ceiling
We estimated the adoption ceiling of improved nutrient management to be 95.13 Mt avoided excess nitrogen use/year (Table 4), including current adoption. This value reflects our estimate of the maximum potential reduction in nitrogen application while avoiding large yield losses and consists of the potential to avoid 62.25 Mt of synthetic nitrogen use and 32.88 Mt of manure and other organic nitrogen use, in addition to current adoption. In total, this is equivalent to an additional 68% reduction in global nitrogen use. The adoption ceiling was calculated as the difference between total nitrogen use at the current rate and total nitrogen use at the target rate (as described in Current Adoption), assuming no change in crop yields. For nitrogen applied to crops for which yield data were not available, the potential reduction in nitrogen use was assumed to be proportional to that of crops for which full data were available.
left_text_column_width
Table 4. Adoption ceiling.
Unit: tN/yr
| estimate | 105,580,000 |
Left Text Column Width
Achievable Adoption
We estimated that fertilizer use reductions of 69.85–91.06 Mt of nitrogen are achievable, reflecting current adoption plus nitrogen savings due to the achievement of nitrogen application rates equal to the median and 30th percentile of nitrogen application rates occurring in locations where yield gaps are small (Table 5).
This range is more ambitious than a comparable recent estimate by Gu et al. (2023), who found that reductions of approximately 42 Mt of nitrogen are avoidable via cost-effective implementation of similar practices. Differences in target nitrogen use efficiencies underlie differences between our estimates and those of Gu et al., whose findings correspond to an increase in global average cropland nitrogen use efficiency from 42% to 52%. Our estimates reflect higher target nitrogen use efficiencies. Nitrogen use efficiencies greater than 52% have been widely achieved through basic practice modification without compromising yields or requiring prohibitively expensive additional inputs. For instance, You et al. (2023) estimated that the global average nitrogen use efficiency could be increased to 78%. Similarly, cropland nitrogen use efficiency in the United States in 2020 was estimated to be 71%, and substantial opportunities for improved nitrogen use efficiency are still available within the United States (Ludemann et al., 2024), though Lu et al. (2019) and Swaney et al. (2018) report slightly lower estimates. These findings support our slightly more ambitious range of achievable nitrogen use reductions for this solution.
left_text_column_width
Table 5. Range of achievable adoption levels.
Unit: tN/yr
| Current Adoption | 10,450,000 |
| Achievable – Low | 69,850,000 |
| Achievable – High | 91,060,000 |
| Adoption Ceiling | 105,580,000 |
Left Text Column Width
We estimated that improved nutrient management has the potential to reduce emissions by 0.63 Gt CO₂‑eq/yr, with achievable emissions reductions of 0.42–0.54 Gt CO₂‑eq/yr (Table 6). This is equivalent to an additional 56–76% reduction in total nitrous oxide emissions from fertilizer use, based on the croplands represented in our analysis.
We estimated avoidable emissions by multiplying our estimates of adoption ceiling and achievable adoption by the relevant IPCC 2019 emissions factors, disaggregated by climate zone and fertilizer type. Under the adoption ceiling scenario, approximately 70% of emissions reductions occurred in wet climates, where emissions per t of applied fertilizer are higher. Reductions in synthetic fertilizer use, which are larger than reductions in organic fertilizer use, contributed about 76% of the potential avoidable emissions. We estimated that the current implementation of improved nutrient management was associated with 0.06 Gt CO₂‑eq/yr of avoided emissions.
Our estimates are slightly more optimistic but well within the range of the IPCC 2021 estimates, which found that improved nutrient management could reduce nitrous oxide emissions by 0.06–0.7 Gt CO₂‑eq/yr.
left_text_column_width
Table 6. Climate impact at different levels of adoption.
Unit: Gt CO₂-eq/yr, 100-yr basis
| Current Adoption | 0.06 |
| Achievable – Low | 0.42 |
| Achievable – High | 0.54 |
| Adoption Ceiling | 0.63 |
Left Text Column Width
Additional Benefits
Food Security
While excessive nutrients cause environmental problems in some parts of the world, insufficient nutrients are a significant problem in others, resulting in lower agricultural yields (Foley et al., 2011). Targeted, site-specific, efficient use of fertilizers can improve crop productivity (Mueller et al., 2012; Vanlauwe et al., 2015), improving food security globally.
Health
Domingo et al. (2021) estimated about 16,000 premature deaths annually in the United States are due to air pollution from the food sector and found that more than 3,500 premature deaths per year could be avoided through reduced use of ammonia fertilizer, a secondary particulate matter precursor. Better agriculture practices overall can reduce particulate matter-related premature deaths from the agriculture sector by 50% (Domingo et al., 2021). Nitrogen oxides from fertilized croplands is another source of agriculture-based air pollution, and improved management can lead to decreased respiratory and cardiovascular disease (Almarez et al., 2018; Sobota et al., 2015).
Nitrate contamination of drinking water due to excessive runoff from agriculture fields has been linked to several health disorders, including methemoglobinemia and cancer (Patel et al., 2022; Ward et al., 2018). Reducing nutrient runoff through better management is critical to minimize these risks (Ward et al., 2018).
Income and Work
Better nutrient management reduces farmers' input costs and increases profitability (Rurinda et al., 2020; Wang et al., 2020). It is especially beneficial to smallholder farmers in sub-Saharan Africa, where site-specific nutrient management programs have demonstrated a significant increase in yield (Chivenge et al., 2021). A review of 61 studies across 11 countries showed that site-specific nutrient management resulted in an average increase in yield by 12% and increased farmer’s’ income by 15% while improving nitrogen use efficiency (Chivenge et al., 2021).
Nature protection
Nutrient runoff from agricultural systems is a major driver of water pollution globally, leading to eutrophication and hypoxic zones in aquatic ecosystems (Bijay-Singh & Craswell, 2021). Nitrogen pollution also harms terrestrial biodiversity through soil acidification and increases productivity of fast-growing species, including invasives, which can outcompete native species (Porter et al., 2013). Improved nutrient management is necessary to reduce nitrogen and phosphorus loads to water bodies (Withers et al., 2014; van Grinsven et al., 2019) and terrestrial ecosystems (Porter et al., 2013). These practices have been effective in reducing harmful algal blooms and preserving biodiversity in sensitive water systems (Scavia et al., 2014).
Resilience to Drought
Balanced nutrient concentration contributes to long-term soil fertility and improved soil health by enhancing organic matter content, microbial diversity, and nutrient cycling (Antil & Raj, 2020; Selim, 2020). Healthy soil experiences reduced erosion and has higher water content, which increases its resilience to droughts and extreme heat (Rockström et al., 2017).
left_text_column_width
Risks
Although substantial reductions in nitrogen use can be achieved in many places with no or minimal impacts on yields, reducing nitrogen application by too much can lead to yield declines, which in turn can boost demand for cropland, causing GHG-producing land use change. Reductions in only excess nitrogen application will prevent substantial yield losses.
left_text_column_width
Some nutrient management practices are associated with additional emissions. For example, nitrification inhibitors reduce direct nitrous oxide emissions (Qiao et al., 2014) but can increase ammonia volatilization and subsequent indirect nitrous oxide emissions (Lam et al., 2016). Additionally, in wet climates, nitrous oxide emissions may be reduced through the use of manure instead of synthetic fertilizers (Hergoualc’h et al., 2019), though impacts vary across sites and studies (Zhang et al., 2020). Increased demand for manure could increase livestock production, which has high associated GHG emissions. Emissions also arise from transporting manure to the site of use (Qin et al., 2021).
Although nitrous oxide has a strong direct climate-warming effect, fertilizer use can cool the climate through emissions of other reactive nitrogen-containing compounds (Gong et al., 2024). First, aerosols from fertilizers scatter heat from the sun and cool the climate (Shindell et al., 2009; Gong et al., 2024). Moreover, other reactive nitrogen compounds from fertilizers shorten the lifespan of methane in the atmosphere, reducing its warming effects (Pinder et al., 2012). Finally, nitrogen fertilizers that leave farm fields through volatilization or runoff are ultimately deposited elsewhere, enhancing photosynthesis and sequestering additional carbon in plants and soils (Zaehle et al., 2011; Gong et al., 2024). Improved nutrient management would reduce these cooling effects.
left_text_column_width
Interactions with Other Solutions
Reinforcing
Improved nutrient management will reduce emissions from the production phase of biomass crops, increasing their benefit.
left_text_column_width
Competing
Improved nutrient management will reduce the GHG production associated with each calorie and, therefore, the impacts of the Improve Diets and Reduce Food Loss and Waste solutions will be reduced
left_text_column_width
Each of these solutions could decrease emissions associated with fertilizer production, but improved nutrient management will reduce total demand for fertilizers.
left_text_column_width
Dashboard
Solution Basics
t avoided excess nitrogen application/yr
tCO2-eq/unit
6
units
Current
1.05×10⁷6.99×10⁷9.11×10⁷
Achievable (Low to High)
Climate Impact
GtCO2-eq/yr
Current 0.06
0.420.54
US$ per tCO2-eq
-85
Gradual
N₂O
tCO2-eq/ha
The Problem — Emissions of Nitrous Oxide Coming from Over-fertilized Soils
The world’s agricultural lands can emit high levels of nitrous oxide (N2O), the third most powerful greenhouse gas. These emissions stem from overusing nitrogen-based fertilizers, especially in regions in China, India, Western Europe, and central North America (in red). While crops absorb some of the nitrogen fertilizer we apply, much of what remains is lost to the atmosphere as nitrous oxide pollution or to local waterways as nitrate pollution. Using fertilizers more wisely can dramatically reduce greenhouse gas emissions and water pollution while maintaining high levels of crop production.
Analysis: Project Drawdown; Driscoll et al, In prep.
Geographic Guidance Introduction
Improved nutrient management will have the greatest emissions reduction if it is targeted at areas with the largest excesses of nitrogen fertilizer use. In 2020, China, India, and the United States alone accounted for 52% of global excess nitrogen application (Ludemann et al., 2024). Improved nutrient management could be particularly beneficial in China and India, where nutrient use efficiency is currently lower than average (Ludemann et al., 2024). You et al. (2023) also found potential for large increases in nitrogen use efficiency in parts of China, India, Australia, Northern Europe, the United States Midwest, Mexico, and Brazil under standard best management practices. Gu et al. (2024) found that nitrogen input reductions are economically feasible in most of Southern Asia, Northern and Western Europe, parts of the Middle East, North America, and Oceania.
In addition to regional patterns in the adoption ceiling, greater nitrous oxide emissions reductions are possible in wet climates or on irrigated croplands compared to dry climates. Nitrous oxide emissions tend to peak when nitrogen availability is high and soil moisture is in the ~70–90% range (Betterbach-Bahl et al., 2013; Elberling et al., 2023; Hao et al., 2025; Lawrence et al., 2021), though untangling the drivers of nitrous oxide emissions is complex (Lawrence et al., 2021). Water management to avoid prolonged periods of soil moisture in this range is an important complement to nutrient management in wet climates and on irrigated croplands (Deng et al., 2018).
Importantly, improved nutrient management, as defined here, is not appropriate for implementation in areas with nitrogen deficits or negligible nitrogen surpluses, including much of Africa. In these areas, crop yields are constrained by nitrogen availability, and an increase in nutrient inputs may be needed to achieve target yields. Additionally, nutrient management in paddy (flooded) rice systems is not included in this solution but rather in the Improve Rice Production solution.
Action Word
Improve
Solution Title
Nutrient Management
Classification
Highly Recommended
Lawmakers and Policymakers
- Focus policies and regulations on the four nutrient management principles – right rate, type, time, and place.
- Create dynamic nutrient management policies that account for varying practices, environments, drainage, historical land use, and other factors that may require adjusting nutrient regulations.
- Offer financial assistance responsive to local soil and weather conditions, such as grants and subsidies, insurance programs, and tax breaks, to encourage farmers to comply with regulations.
- Mandate insurance schemes that allow farmers to reduce fertilizer use.
- Mandate nutrient budgets or ceilings that are responsive to local yield, weather, and soil conditions.
- Require farmers to formulate nutrient management and fertilizer plans.
- Mandate efficiency rates for manure-spreading equipment.
- Ensure access to and require soil tests to inform fertilizer application.
- Invest in research on alternative organic nutrient sources.
- Create and expand education programs and extension services that highlight the problems that arise from the overuse of fertilizers, benefits of soil management such as cost-savings, and penalties for non-compliance
- Create ongoing support groups among farmers.
Further information:
- Nutrient management, Watershed Agricultural Council
- Nutrient management, U.S. Department of Agriculture
- Toolbox, Global Partnership on Nutrient Management
- Government relations and public policy job function action guide. Project Drawdown (2022)
- Legal job function action guide. Project Drawdown (2022)
Practitioners
- Use the four nutrient management principles – right rate, type, time, and place – to guide fertilizer application.
- Utilize or advocate for financial assistance and tax breaks for farmers to improve nutrient management techniques.
- Create and adhere to nutrient and fertilizer management plans.
- Conduct soil tests to inform fertilizer application.
- Use winter cover crops, crop rotations, residue retention, and split applications for fertilizer.
- Improve the efficiency of, and regularly calibrate, manure-spreading equipment.
- Leverage agroecological practices such as nutrient recycling and biological nitrogen fixation.
- Join, create, or participate in partnerships or certification programs dedicated to improving nutrient management.
- Take advantage of education programs, support groups, and extension services focused on improved nutrient management.
Further information:
- Nutrient management, Watershed Agricultural Council
- Nutrient management, U.S. Department of Agriculture
- Toolbox, Global Partnership on Nutrient Management
Business Leaders
- Provide incentives for farmers in primary sourcing regions to adopt best management practices for reducing nitrogen application.
- Invest in companies that use improved nutrient management techniques or produce equipment or research for fertilizer application and testing.
- Advocate to policymakers for improved nutrient management techniques, incentives, and regulations.
- Join, create, or participate in partnerships or certification programs dedicated to improving nutrient management practices.
- Promote products produced with improved nutrient management techniques and educate consumers about the importance of the practice.
- Create or support education programs and extension services that highlight the problems that arise from the overuse of fertilizers, benefits of soil management such as cost-savings, and penalties for non-compliance.
- Create ongoing support groups among farmers.
Further information:
- Nutrient management, Watershed Agricultural Council
- Nutrient management, U.S. Department of Agriculture
- Toolbox, Global Partnership on Nutrient Management
- Climate solutions at work, Project Drawdown (2021)
- Drawdown-aligned business framework, Project Drawdown (2021)
Nonprofit Leaders
- Start model farms to demonstrate improved nutrient management techniques, conduct experiments, and educate local farmers.
- Conduct and share research on improved nutrient management techniques, alternative organic fertilizers, or local policy options.
- Advocate to policymakers for improved nutrient management techniques, incentives, and regulations.
- Engage with businesses to encourage corporate responsibility and/or monitor water quality and soil health.
- Join, create, or participate in partnerships or certification programs dedicated to improving nutrient management practices.
- Create or support education programs and extension services that highlight the problems that arise from the overuse of fertilizers, benefits of soil management such as cost-savings, and penalties for non-compliance.
- Create ongoing support groups among farmers.
Further information:
- Nutrient management, Watershed Agricultural Council
- Nutrient management, U.S. Department of Agriculture
- Toolbox, Global Partnership on Nutrient Management
Investors
- Invest in companies developing technologies that support improved nutrient management such as precision fertilizer applicators, alternative fertilizers, soil management equipment, and software.
- Invest in ETFs and ESG funds that hold companies committed to improved nutrient management techniques in their portfolios.
- Encourage companies in your investment portfolio to adopt improved nutrient management.
- Provide access to capital at reduced rates for farmers adhering to improved nutrient management.
Further information:
- Nutrient management, Watershed Agricultural Council
- Nutrient management, U.S. Department of Agriculture
- Toolbox, Global Partnership on Nutrient Management
Philanthropists and International Aid Agencies
- Provide financing for farmers to improve nutrient management.
- Start model farms to demonstrate nutrient management techniques, conduct experiments, and educate local farmers.
- Conduct and share research on improved nutrient management, alternative organic fertilizers, or local policy options.
- Advocate to policymakers for improved nutrient management techniques, incentives, and regulations.
- Engage with businesses to encourage corporate responsibility and/or monitor water quality and soil health.
- Join, create, or participate in partnerships or certification programs dedicated to improving nutrient management practices.
- Create or support education programs and extension services that highlight the problems that arise from the overuse of fertilizers, benefits of soil management such as cost-savings, and penalties for non-compliance.
- Create ongoing support groups among farmers.
Further information:
- Nutrient management, Watershed Agricultural Council
- Nutrient management, U.S. Department of Agriculture
- Toolbox, Global Partnership on Nutrient Management
Thought Leaders
- Start model farms to demonstrate techniques, conduct experiments, and educate local farmers.
- Conduct and share research on improved nutrient management, alternative organic fertilizers, or local policy options.
- Advocate to policymakers for improved nutrient management techniques, incentives, and regulations.
- Engage with businesses to encourage corporate responsibility and/or monitor water quality and soil health.
- Join, create, or participate in partnerships dedicated to improving nutrient management practices.
- Create or support education programs and extension services that highlight the problems that arise from the overuse of fertilizers, benefits of soil management such as cost-savings, and penalties for non-compliance.
- Create ongoing support groups among farmers.
Further information:
- Nutrient management, Watershed Agricultural Council
- Nutrient management, U.S. Department of Agriculture
- Toolbox, Global Partnership on Nutrient Management
Technologists and Researchers
- Improve technology and cost-effectiveness of precision fertilizer application, slow-release fertilizer, alternative organic fertilizers, nutrient recycling, and monitoring equipment.
- Create tracking and monitoring software to support farmers' decision-making.
- Research and develop the application of AI and robotics for precise fertilizer application.
- Improve data and analytics to monitor soil and water quality, assist farmers, support policymaking, and assess the impacts of policies.
- Develop education and training applications to promote improved nutrient management and provide real-time feedback.
Further information:
- Nutrient management, Watershed Agricultural Council
- Nutrient management, U.S. Department of Agriculture
- Toolbox, Global Partnership on Nutrient Management
Communities, Households, and Individuals
- Create or join community-supported agriculture programs that source from farmers who used improved nutrient management practices.
- Conduct soil tests on your lawn and garden and reduce fertilizer use if you are over-fertilizing.
- Volunteer for soil and water quality monitoring and restoration projects.
- Start model farms to demonstrate techniques, conduct experiments, and educate local farmers.
- Advocate to policymakers for improved nutrient management techniques, incentives, and regulations.
- Engage with businesses to encourage corporate responsibility and/or monitor water quality and soil health.
- Join, create, or participate in partnerships dedicated to improving nutrient management.
- Create or support education programs and extension services that highlight the problems that arise from the overuse of fertilizers, benefits of soil management such as cost-savings, and penalties for non-compliance.
- Create ongoing support groups among farmers.
Further information:
- Nutrient management, Watershed Agricultural Council
- Nutrient management, U.S. Department of Agriculture
- Toolbox, Global Partnership on Nutrient Management
Sources
- Which factors influence farmers’ intentions to adopt nutrient management planning?, Daxini, A., et al. (2018)
- Quantification of environmental-economic trade-offs in nutrient management policies, Kaye-Blake, et al. (2019)
- Regulating farmer nutrient management: A three-state case study on the Delmarva Peninsula, Perez, M. R. (2015)
- Promise and performance of agricultural nutrient management policy: lessons from the Baltic Sea, Thorsøe, M. H., et al. (2021)
- Exploring nutrient management options to increase nitrogen and phosphorus use efficiencies in food production of China, Wang, M., et al. (2018)
- Quantifying nutrient budgets for sustainable nutrient management, Zhang, X., et al. (2020)
Evidence Base
There is high scientific consensus that reducing nitrogen surpluses through improved nutrient management reduces nitrous oxide emissions from croplands.
Nutrient additions to croplands produce an estimated 0.9 Gt CO₂‑eq/yr (range 0.7–1.1 Gt CO₂ -e/yr) of direct nitrous oxide emissions from fields, plus approximately 0.3 Gt CO₂‑eq/yr of indirect emissions from fertilizers that runoff into waterways or erode (Tian et al., 2020). Nitrous oxide emissions from croplands are directly linked to the amount of nitrogen applied. Furthermore, the amount of nitrous oxide emitted per unit of applied nitrogen is well quantified for a range of different nitrogen sources and field conditions (Reay et al., 2012; Shcherbak et al., 2014; Gerber et al., 2016; Intergovernmental Panel on Climate Change [IPCC], 2019; Hergoualc’h et al., 2021). Tools to improve nutrient management have been extensively studied, and practices that improve nitrogen use efficiency through right rate, time, place, and type principles have been implemented in some places for several decades (Fixen, 2020; Ludemann et al., 2024).
Recently, Gao & Cabrera Serrenho (2023) estimated that fertilizer-related emissions could be reduced up to 80% by 2050 relative to current levels using a combination of nutrient management and new fertilizer production methods. You et al. (2023) found that adopting improved nutrient management practices would increase nitrogen use efficiency from a global average of 48% to 78%, substantially reducing excess nitrogen. Wang et al. (2024) estimated that the use of enhanced-efficiency fertilizers could reduce nitrogen losses to the environment 70–75% for maize and wheat systems. Chivenge et al. (2021) found comparable results in smallholder systems in Africa and Asia.
The results presented in this document were produced through analysis of global datasets. We recognize that geographic biases can influence the development of global datasets and hope this work inspires research and data sharing on this topic in underrepresented regions.
left_text_column_width
Appendix
In this analysis, we calculated the potential for reducing crop nitrogen inputs and associated nitrous oxide emissions by integrating spatially explicit, crop-specific data on nitrogen inputs, crop yields, attainable yields, irrigated extent, and climate. Broadly, we calculated a “target” yield-scaled nitrogen input rate based on pixels with low yield gaps and calculated the difference between nitrous oxide emissions under the current rate and under the hypothetical target emissions rate, using nitrous oxide emissions factors disaggregated by fertilizer type and climate.
Emissions factors
We used Tier 1 emissions factors from the IPCC 2019 Refinement to the 2006 Guidelines for National Greenhouse Gas Inventories, including direct emissions factors as well as indirect emissions from volatilization and leaching pathways. Direct emissions factors represent the proportion of applied nitrogen emitted as nitrous oxide, while we calculated volatilization and leaching emissions factors by multiplying the proportion of applied nitrogen lost through these pathways by the proportion of volatilized or leached nitrogen ultimately emitted as nitrous oxide. Including both direct and indirect emissions, organic and synthetic fertilizers emit 4.97 kg CO₂‑eq/kg nitrogen and 8.66 kg CO₂‑eq/kg nitrogen, respectively, in wet climates, and 2.59 kg CO₂‑eq/kg nitrogen and 2.38 kg CO₂‑eq/kg nitrogen in dry climates. We included uncertainty bounds (2.5th and 97.5th percentiles) for all emissions factors.
We classified each pixel as “wet” or “dry” using an aridity index (AI) threshold of 0.65, calculated as the ratio of annual precipitation to potential evapotranspiration (PET) from TerraClimate data (1991–2020), based on a threshold of 0.65. For pixels in dry climates that contained irrigation, we took the weighted average of wet and dry emissions factors based on the fraction of cropland that was irrigated (Mehta et al., 2024). We excluded irrigated rice from this analysis due to large differences in nitrous oxide dynamics in flooded rice systems.
Current, target, and avoidable nitrogen inputs and emissions
Using highly disaggregated data on nitrogen inputsfrom Adalibieke et al. (2024) for 21 crop groups (Table S1), we calculated total crop-specific inputs of synthetic and organic nitrogen. We then averaged over 2016–2020 to reduce the influence of interannual variability in factors like fertilizer prices. These values are subsequently referred to as “current” nitrogen inputs. We calculated nitrous oxide emissions under current nitrogen inputs as the sum of the products of nitrogen inputs and the climatically relevant emissions factors for each fertilizer type.
Next, we calculated target nitrogen application rates in terms of kg nitrogen per ton of crop yield using data on actual and attainable yields for 17 crops from Gerber et al., 2024 (Table S1). For each crop, we first identified pixels in which the ratio of actual to attainable yields was above the 80th percentile globally. The target nitrogen application rate was then calculated as the 20th percentile of nitrogen application rates across low-yield-gap pixels. Finally, we calculated total target nitrogen inputs as the product of actual yields and target nitrogen input rates. We calculated hypothetical nitrous oxide emissions from target nitrogen inputs as the product of nitrogen inputs and the climatically relevant emissions factor for each fertilizer type.
The difference between current and target nitrogen inputs represents the amount by which nitrogen inputs could hypothetically be reduced without compromising crop productivity (i.e., “avoidable” nitrogen inputs). We calculated avoidable nitrous oxide emissions as the difference between nitrous oxide emissions with current nitrogen inputs and those with target nitrogen inputs. For crops for which no yield or attainable yield data were available, we applied the average percent reduction in nitrogen inputs under the target scenario from available crops to the nitrogen input data for missing crops to calculate the avoidable nitrogen inputs and emissions.
This simple and empirically driven method aimed to identify realistically low but nutritionally adequate nitrogen application rates by including only pixels with low yield gaps, which are unlikely to be substantially nutrient-constrained. We did not control for other factors affecting nitrogen availability, such as historical nutrient application rates or depletion, rotation with nitrogen fixing crops, or tillage and residue retention practices.
left_text_column_width
Table S1. Crops represented by the source data on nitrogen inputs (Adalibieke et al., 2024) and estimated and attainable yields (Gerber et al., 2024). Crop groups included consistently in both datasets are marked as “both,” and crop groups represented in the nitrogen input data but not in the yield datasets are marked as “nitrogen only.”
| Crop | Dataset(s) |
|---|---|
| Barley | Both |
| Cassava | Both |
| Cotton | Both |
| Maize | Both |
| Millet | Both |
| Oil Palm | Both |
| Potato | Both |
| Rice | Both |
| Rye | Both |
| Rapeseed | Both |
| Sorghum | Both |
| Soybean | Both |
| Sugarbeet | Both |
| Sugarcane | Both |
| Sunflower | Both |
| Sweet Potato | Both |
| Wheat | Both |
| Groundnut | Nitrogen only |
| Fruits | Nitrogen only |
| Vegetables | Nitrogen only |
| Other | Nitrogen only |
Left Text Column Width
Updated Date