Surface, ground, and rainwater used for ecological and human use

Icon

Improve Annual Cropping

Image
Coming Soon
Off
Summary

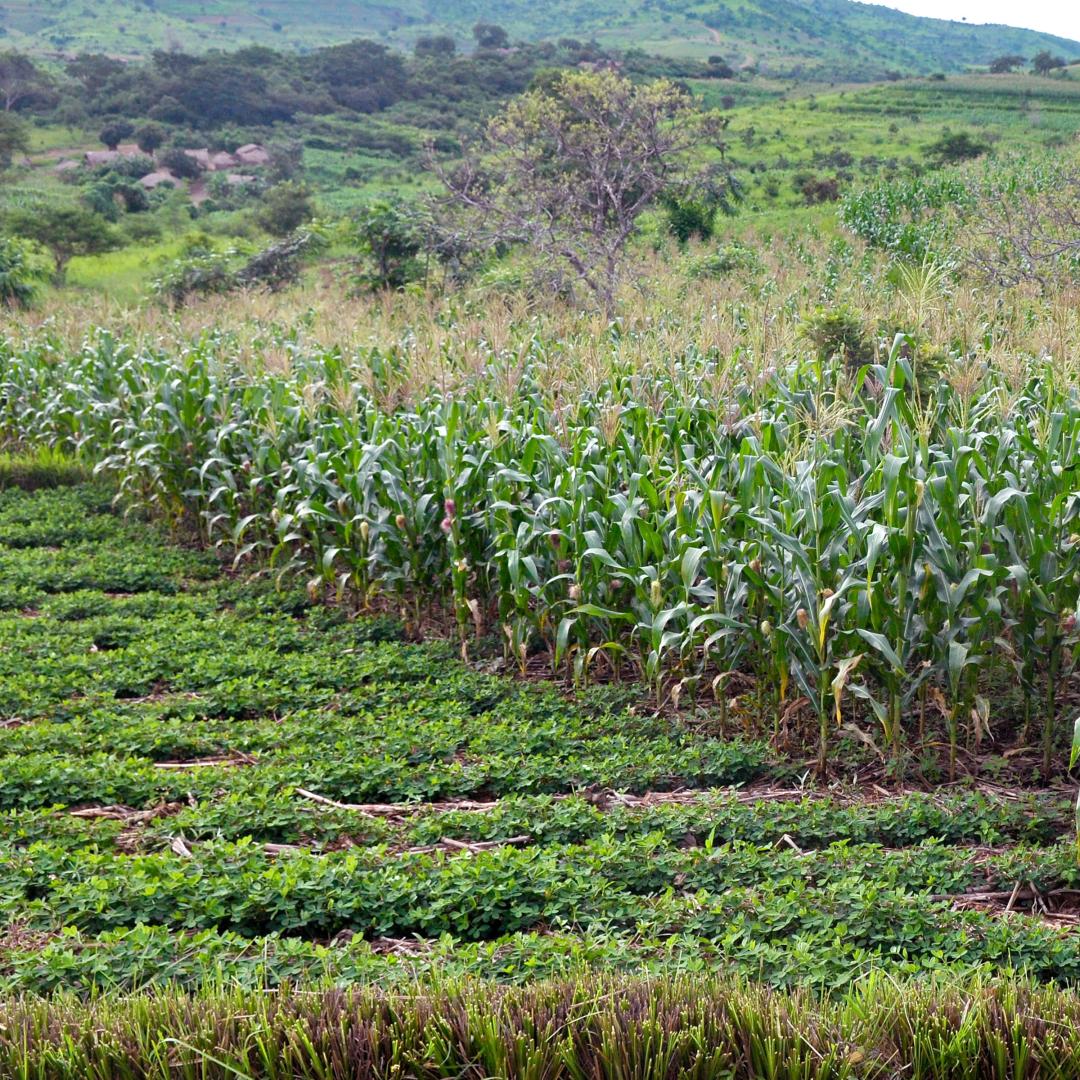
Farmers on much of the world’s 1.4 billion ha of cropland grow and harvest annual crops – crops like wheat, rice, and soybeans that live for one year or less. After harvest, croplands are often left bare for the rest of the year and sometimes tilled, exposing the soil to wind and rain. This keeps soil carbon levels low and can lead to soil erosion. There are many ways to improve annual cropping to protect or enhance the health of the soil and increase soil organic matter. Project Drawdown’s Improve Annual Cropping solution is a set of practices that protects soils by minimizing plowing (no-till/reduced tillage) and maintaining continuous soil cover (by retaining crop residues or growing cover crops). This increases soil carbon sequestration and reduces nitrous oxide emissions. These techniques are commonly used in conservation agriculture, regenerative, and agro-ecological cropping systems. Other annual cropping practices with desirable climate impacts – including compost application and crop rotations – are omitted here due to lack of data and much smaller scale of adoption. 

Overview

The Improve Annual Cropping solution incorporates several practices that minimize soil disturbance and introduce a physical barrier meant to prevent erosion to fragile topsoils. Our definition includes two of the three pillars of conservation agriculture: minimal soil disturbance and permanent soil cover (Kassam et al., 2022).

Minimal Soil Disturbance

Soil organic carbon (SOC) – which originates from decomposed plants – helps soils hold moisture and provides the kinds of chemical bonding that allow nutrients to be stored and exchanged easily with plants. Soil health and productivity depend on microbial decomposition of plant biomass residues, which mobilizes critical nutrients in soil organic matter (SOM) and builds SOC. Conventional tillage inverts soil, buries residues, and breaks down compacted soil aggregates. This process facilitates microbial activity, weed removal, and water infiltration for planting. However, tillage can accelerate CO₂ fluxes as SOC is lost to oxidation and runoff. Mechanical disturbance further exposes deeper soils to the atmosphere, leading to radiative absorption, higher soil temperatures, and catalyzed biological processes – all of which increase oxidation of SOC (Francaviglia et al., 2023).

Reduced tillage limits soil disturbance to support increased microbial activity, moisture retention, and stable temperature at the soil surface. This practice can increase carbon sequestration, at least when combined with cover cropping. These effects are highly contextual, depending on tillage intensity and soil depth as well as the practice type, duration, and timing. Reduced tillage further reduces fossil fuel emissions from on-farm machinery. However, this practice often leads to increased reliance on herbicides for weed control (Francaviglia et al., 2023).

Permanent Soil Cover

Residue retention and cover cropping practices aim to provide permanent plant cover to protect and improve soils. This can improve aggregate stability, water retention, and nutrient cycling. Farmers practicing residue retention leave crop biomass residues on the soil surface to suppress weed growth, improve water infiltration, and reduce evapotranspiration from soils (Francaviglia et al., 2023).

Cover cropping includes growth of spontaneous or seeded plant cover, either during or between established cropping cycles. In addition to SOC, cover cropping can help decrease nitrous oxide emissions and bind nitrogen typically lost via oxidation and leaching. Leguminous cover crops can also fix atmospheric nitrogen, reducing the need for fertilizer. Cover cropping can further be combined with reduced tillage for additive SOC and SOM gains (Blanco-Canqui et al., 2015; Francaviglia et al., 2023).

Improved annual cropping practices can simultaneously reduce GHG emissions and improve SOC stocks. However, there are biological limits to SOC stocks – particularly in mineral soils. Environmental benefits are impermanent and only remain if practices continue long term (Francaviglia et al., 2023).

References

Abdalla, M., Hastings, A., Cheng, K., Yue, Q., Chadwick, D., Espenberg, M., Truu, J., Rees, R. M., & Smith, P. (2019). A critical review of the impacts of cover crops on nitrogen leaching, net greenhouse gas balance and crop productivity. Global Change Biology, 25(8), 2530–2543. https://doi.org/10.1111/gcb.14644 

Arslan, A., McCarthy, N., Lipper, L., Asfaw, S., Cattaneo, A., & Kokwe, M. (2015). Climate smart agriculture? Assessing the adaptation implications in Zambia. Journal of Agricultural Economics66(3), 753-780.

Bai, X., Huang, Y., Ren, W., Coyne, M., Jacinthe, P.-A., Tao, B., Hui, D., Yang, J., & Matocha, C. (2019). Responses of soil carbon sequestration to climate-smart agriculture practices: A meta-analysis. Global Change Biology25(8), 2591–2606. https://doi.org/10.1111/gcb.14658

Blanco‐Canqui, H., Shaver, T. M., Lindquist, J. L., Shapiro, C. A., Elmore, R. W., Francis, C. A., & Hergert, G. W. (2015). Cover crops and ecosystem services: Insights from studies in temperate soils. Agronomy journal107(6), 2449-2474.

Blanco-Canqui, H., & Francis, C. A. (2016). Building resilient soils through agroecosystem redesign under fluctuating climatic regimes. Journal of Soil and Water Conservation, 71(6), 127A-133A. https://doi.org/10.2489/jswc.71.6.127A 

Cai, A., Han, T., Ren, T., Sanderman, J., Rui, Y., Wang, B., Smith, P., Xu, M., & Li, Y. (2022). Declines in soil carbon storage under no tillage can be alleviated in the long run. Geoderma, 425, 116028. https://doi.org/10.1016/j.geoderma.2022.116028 

Clapp, J. (2021). Explaining growing glyphosate use: The political economy of herbicide-dependent agriculture. Global Environmental Change67, 102239.

Cui, Y., Zhang, W., Zhang, Y., Liu, X., Zhang, Y., Zheng, X., Luo, J., & Zou, J. (2024). Effects of no-till on upland crop yield and soil organic carbon: A global meta-analysis. Plant and Soil499(1), 363–377. https://doi.org/10.1007/s11104-022-05854-y

Damania, R., Polasky, S., Ruckelshaus, M., Russ, J., Amann, M., Chaplin-Kramer, R., ... & Zaveri, E. (2023). Nature's Frontiers: Achieving Sustainability, Efficiency, and Prosperity with Natural Capital. World Bank Publications.

Dupraz, C., and Liagre, F. (2011). Agroforesterie: des arbres et des cultures. France Agricole Editions, 2011. 

Fitton, N., Alexander, P., Arnell, N., Bajzelj, B., Calvin, K., Doelman, J., Gerber, J. S., Havlik, P., Hasegawa, T., Herrero, M., Krisztin, T., van Meijl, H., Powell, T., Sands, R., Stehfest, E., West, P. C., and Smith, P. (2019). The vulnerabilities of agricultural land and food production to future water scarcity. Global Environmental Change, 58:101944. https://doi.org/10.1016/j.gloenvcha.2019.101944 

Francaviglia, R., Almagro, M., & Vicente-Vicente, J. L. (2023). Conservation Agriculture and Soil Organic Carbon: Principles, Processes, Practices and Policy Options. Soil Systems, 7(1), 17. https://doi.org/10.3390/soilsystems7010017 

Griscom, B. W., Adams, J., Ellis, P. W., Houghton, R. A., Lomax, G., Miteva, D. A., ... & Fargione, J. (2017). Natural climate solutions. Proceedings of the National Academy of Sciences114(44), 11645-11650.

Hassan, M. U., Aamer, M., Mahmood, A., Awan, M. I., Barbanti, L., Seleiman, M. F., ... & Huang, G. (2022). Management strategies to mitigate N₂O emissions in agriculture. Life12(3), 439.

Hu, Q., Thomas, B. W., Powlson, D., Hu, Y., Zhang, Y., Jun, X., Shi, X., & Zhang, Y. (2023). Soil organic carbon fractions in response to soil, environmental and agronomic factors under cover cropping systems: A global meta-analysis. Agriculture, Ecosystems & Environment355, 108591. https://doi.org/10.1016/j.agee.2023.108591

Jat, H. S., Choudhary, K. M., Nandal, D. P., Yadav, A. K., Poonia, T., Singh, Y., Sharma, P. C., & Jat, M. L. (2020). Conservation Agriculture-based Sustainable Intensification of Cereal Systems Leads to Energy Conservation, Higher Productivity and Farm Profitability. Environmental Management, 65(6), 774–786. https://doi.org/10.1007/s00267-020-01273-w

Jayaraman, S., Dang, Y. P., Naorem, A., Page, K. L., & Dalal, R. C. (2021). Conservation Agriculture as a System to Enhance Ecosystem Services. Agriculture, 11(8), 718. https://doi.org/10.3390/agriculture11080718

Jian, J., Du, X., Reiter, M. S., & Stewart, R. D. (2020). A meta-analysis of global cropland soil carbon changes due to cover cropping. Soil Biology and Biochemistry143, 107735. https://doi.org/10.1016/j.soilbio.2020.107735

Joshi, D. R., Sieverding, H. L., Xu, H., Kwon, H., Wang, M., Clay, S. A., Johnson, J. M., Thapa, R., Westhoff, S., & Clay, D. E. (2023). A global meta-analysis of cover crop response on soil carbon storage within a corn production system. Agronomy Journal115(4), 1543–1556. https://doi.org/10.1002/agj2.21340

Kan, Z.-R., Liu, W.-X., Liu, W.-S., Lal, R., Dang, Y. P., Zhao, X., & Zhang, H.-L. (2022). Mechanisms of soil organic carbon stability and its response to no-till: A global synthesis and perspective. Global Change Biology28(3), 693–710. https://doi.org/10.1111/gcb.15968

Kassam, A., Friedrich, T., & Derpsch, R. (2022). Successful Experiences and Lessons from Conservation Agriculture Worldwide. Agronomy12(4), Article 4. https://doi.org/10.3390/agronomy12040769

Lal, R., Smith, P., Jungkunst, H. F., Mitsch, W. J., Lehmann, J., Nair, P. R., ... & Ravindranath, N. H. (2018). The carbon sequestration potential of terrestrial ecosystems. Journal of soil and water conservation73(6), 145A-152A.

Lessmann, M., Ros, G. H., Young, M. D., & de Vries, W. (2022). Global variation in soil carbon sequestration potential through improved cropland management. Global Change Biology28(3), 1162–1177. https://doi.org/10.1111/gcb.15954

Luo, Z., Wang, E., & Sun, O. J. (2010). Can no-tillage stimulate carbon sequestration in agricultural soils? A meta-analysis of paired experiments. Agriculture, Ecosystems & Environment139(1), 224–231. https://doi.org/10.1016/j.agee.2010.08.006

Martínez-Mena, M., Carrillo-López, E., Boix-Fayos, C., Almagro, M., García Franco, N., Díaz-Pereira, E., Montoya, I., & De Vente, J. (2020). Long-term effectiveness of sustainable land management practices to control runoff, soil erosion, and nutrient loss and the role of rainfall intensity in Mediterranean rainfed agroecosystems. CATENA, 187, 104352. https://doi.org/10.1016/j.catena.2019.104352

McClelland, S. C., Paustian, K., & Schipanski, M. E. (2021). Management of cover crops in temperate climates influences soil organic carbon stocks: A meta-analysis. Ecological Applications31(3), e02278. https://doi.org/10.1002/eap.2278

Moukanni, N., Brewer, K. M., Gaudin, A. C. M., & O’Geen, A. T. (2022). Optimizing Carbon Sequestration Through Cover Cropping in Mediterranean Agroecosystems: Synthesis of Mechanisms and Implications for Management. Frontiers in Agronomy, 4. https://doi.org/10.3389/fagro.2022.844166 

Mrabet, R., Singh, A., Sharma, T., Kassam, A., Friedrich, T., Basch, G., Moussadek, R., & Gonzalez-Sanchez, E. (2023). Conservation Agriculture: Climate Proof and Nature Positive Approach. In G. Ondrasek & L. Zhang (Eds.), Resource Management in Agroecosystems. IntechOpen. https://doi.org/10.5772/intechopen.108890

Nabuurs, G-J., R. Mrabet, A. Abu Hatab, M. Bustamante, H. Clark, P. Havlík, J. House, C. Mbow, K.N. Ninan, A. Popp, S. Roe, B. Sohngen, S. Towprayoon, 2022: Agriculture, Forestry and Other Land Uses (AFOLU). In IPCC, 2022: Climate Change 2022: Mitigation of Climate Change. Contribution of Working Group III to the Sixth Assessment Report of the Intergovernmental Panel on Climate Change [P.R. Shukla, J. Skea, R. Slade, A. Al Khourdajie, R. van Diemen, D. McCollum, M. Pathak, S. Some, P. Vyas, R. Fradera, M. Belkacemi, A. Hasija, G. Lisboa, S. Luz, J. Malley, (eds.)]. Cambridge University Press, Cambridge, UK and New York, NY, USA. https://doi.org/10.1017/9781009157926.009

Nyagumbo, I., Mupangwa, W., Chipindu, L., Rusinamhodzi, L., & Craufurd, P. (2020). A regional synthesis of seven-year maize yield responses to conservation agriculture technologies in Eastern and Southern Africa. Agriculture, Ecosystems & Environment, 295, 106898. https://doi.org/10.1016/j.agee.2020.106898

Ogle, S. M., Alsaker, C., Baldock, J., Bernoux, M., Breidt, F. J., McConkey, B., Regina, K., & Vazquez-Amabile, G. G. (2019). Climate and Soil Characteristics Determine Where No-Till Management Can Store Carbon in Soils and Mitigate Greenhouse Gas Emissions. Scientific Reports9(1), 11665. https://doi.org/10.1038/s41598-019-47861-7

Paustian, K., Larson, E., Kent, J., Marx, E., & Swan, A. (2019). Soil C Sequestration as a Biological Negative Emission Strategy. Frontiers in Climate, 1, 8. https://doi.org/10.3389/fclim.2019.00008 

Pittelkow, C. M., Liang, X., Linquist, B. A., van Groenigen, K. J., Lee, J., Lundy, M. E., van Gestel, N., Six, J., Venterea, R. T., & van Kessel, C. (2015). Productivity limits and potentials of the principles of conservation agriculture. Nature517(7534), Article 7534. https://doi.org/10.1038/nature13809

Poeplau, C., & Don, A. (2015). Carbon sequestration in agricultural soils via cultivation of cover crops–A meta-analysis. Agriculture, Ecosystems & Environment200, 33-41.

Powlson, D. S., Stirling, C. M., Jat, M. L., Gerard, B. G., Palm, C. A., Sanchez, P. A., & Cassman, K. G. (2014). Limited potential of no-till agriculture for climate change mitigation. Nature Climate Change4(8), 678–683. https://doi.org/10.1038/nclimate2292

Prestele, R., Hirsch, A. L., Davin, E. L., Seneviratne, S. I., & Verburg, P. H. (2018). A spatially explicit representation of conservation agriculture for application in global change studies. Global Change Biology24(9), 4038–4053. https://doi.org/10.1111/gcb.14307

Project Drawdown (2020) Farming Our Way Out of the Climate Crisis. Project Drawdown.

Quintarelli V, Radicetti E, Allevato E, Stazi SR, Haider G, Abideen Z, Bibi S, Jamal A, Mancinelli R. Cover crops for sustainable cropping systems: a review. Agriculture. 2022 Dec 3;12(12):2076.

Rosa, L. (2022). Adapting agriculture to climate change via sustainable irrigation: Biophysical potentials and feedbacks. Environmental Research Letters, 17: 063008. https://doi.org/10.1088/1748-9326/ac7408 

Searchinger, T., R. Waite, C. Hanson, and J. Ranganathan. (2019). World Resources Report: Creating a Sustainable Food Future. Washington, DC: World Resources Institute. https://research.wri.org/sites/default/files/2019-07/ WRR_Food_Full_Report_0.pdf.

Stavi, I., Bel, G., & Zaady, E. (2016). Soil functions and ecosystem services in conventional, conservation, and integrated agricultural systems. A review. Agronomy for Sustainable Development, 36(2), 32. https://doi.org/10.1007/s13593-016-0368-8

Su, Y., Gabrielle, B., Beillouin, D., & Makowski, D. (2021). High probability of yield gain through conservation agriculture in dry regions for major staple crops. Scientific Reports, 11(1), 3344. https://doi.org/10.1038/s41598-021-82375-1

Sun, W., Canadell, J. G., Yu, L., Yu, L., Zhang, W., Smith, P., Fischer, T., & Huang, Y. (2020). Climate drives global soil carbon sequestration and crop yield changes under conservation agriculture. Global Change Biology, 26(6), 3325–3335. https://doi.org/10.1111/gcb.15001 

Tambo, J. A., & Mockshell, J. (2018). Differential Impacts of Conservation Agriculture Technology Options on Household Income in Sub-Saharan Africa. Ecological Economics, 151, 95–105. https://doi.org/10.1016/j.ecolecon.2018.05.005

Tiefenbacher, A., Sandén, T., Haslmayr, H.-P., Miloczki, J., Wenzel, W., & Spiegel, H. (2021). Optimizing Carbon Sequestration in Croplands: A Synthesis. Agronomy, 11(5), Article 5. https://doi.org/10.3390/agronomy11050882

Toensmeier, E. (2016). The Carbon Farming Solution: A Global Toolkit of Perennial Crops and Regenerative Agriculture Practices for Climate Change Mitigation and Food Security. Green Publishing. https://www.chelseagreen.com/product/the-carbon-farming-solution/?srsltid=AfmBOoqsMoY569HfsXOdBsRguOzsDLlRZKOnyM4nyKwZoIALvPoohZlq 

Vendig, I., Guzman, A., De La Cerda, G., Esquivel, K., Mayer, A. C., Ponisio, L., & Bowles, T. M. (2023). Quantifying direct yield benefits of soil carbon increases from cover cropping. Nature Sustainability6(9), 1125–1134. https://doi.org/10.1038/s41893-023-01131-7

WCCA (2021). The future of farming: Profitable and sustainable farming with conservation agriculture. 8th World Congress on Conservation Agriculture, Vern Switzerland.

Wooliver, R., & Jagadamma, S. (2023). Response of soil organic carbon fractions to cover cropping: A meta-analysis of agroecosystems. Agriculture, Ecosystems & Environment351, 108497. https://doi.org/10.1016/j.agee.2023.108497

Xing, Y., & Wang, X. (2024). Impact of agricultural activities on climate change: a review of greenhouse gas emission patterns in field crop systems. Plants13(16), 2285.

Credits

Lead Fellows

  • Avery Driscoll

  • Erika Luna

  • Megan Matthews, Ph.D.

  • Eric Toensmeier

  • Aishwarya Venkat, Ph.D.

Contributors

  • Ruthie Burrows, Ph.D.

  • James Gerber, Ph.D.

  • Yusuf Jameel, Ph.D.

  • Daniel Jasper

  • Alex Sweeney

Internal Reviewers

  • Aiyana Bodi

  • Emily Cassidy, Ph.D.

  • James Gerber, Ph.D.

  • Hannah Henkin

  • Zoltan Nagy, Ph.D.

  • Ted Otte

  • Paul West, Ph.D.

Effectiveness

Based on seven reviews and meta-analyses, which collectively analyzed over 500 studies, we estimate that this solution’s SOC sequestration potential is 1.28 t CO₂‑eq/ha/yr. This is limited to the topsoil (>30 cm), with minimal effects at deeper levels (Sun et al., 2020; Tiefenbacher et al., 2021). Moreover, carbon sequestration potential isn't constant over time. The first two decades show the highest increase, followed by an equilibrium or SOC saturation (Cai, 2022; Sun et al., 2020).

The effectiveness of the Improve Annual Cropping solution heavily depends on local geographic conditions (e.g., soil properties, climate), crop management practices, cover crop biomass, cover crop types, and the duration of annual cropping production – with effects typically better assessed in the long term (Abdalla et al., 2019; Francaviglia et al., 2023; Moukanni et al., 2022; Paustian et al., 2019).

Based on reviewed literature (three papers, 18 studies), we estimated that improved annual cropping can potentially reduce nitrous oxide emissions by 0.51 t CO₂‑eq/ha/yr (Table 1). Cover crops can increase direct nitrous oxide emissions by stimulating microbial activity, but – compared with conventional cropping – lower indirect emissions allow for reduced net nitrous oxide emissions from cropland (Abdalla et al., 2019). 

Nitrogen fertilizers drive direct nitrous oxide emissions, so genetic optimization of cover crops to increase nitrogen-use efficiencies and decrease nitrogen leaching could further improve mitigation of direct nitrous oxide emissions (Abdalla et al., 2019). 

left_text_column_width

Table 1. Effectiveness at reducing emissions and removing carbon.

Unit: t CO₂‑eq/ha/yr

25th percentile 0.29
median (50th percentile) 0.51
75th percentile 0.80

Unit: t CO₂‑eq/ha/yr

25th percentile 0.58
median (50th percentile) 1.28
75th percentile 1.72

Unit: t CO₂‑eq/ha/yr

25th percentile 0.88
median (50th percentile) 1.80
75th percentile 2.52
Left Text Column Width
Cost

Because baseline (conventional) annual cropping systems are already extensive and well established, we assume there is no cost to establish new baseline cropland. In the absence of global datasets on costs and revenues of cropping systems, we used data on the global average profit per ha of cropland from Damiana et al. (2023) to create a weighted average profit US$76.86/ha.

Based on 13 data points (of which seven were from the United States), the median establishment cost of the Improve Annual Cropping Solution is $329.78/ha. Nine data points (three from the United States) provided a median increase in profitability of US$86.01/ha. 

The net net cost of the Improve Annual Cropping solution is US$86.01. The cost per t CO2 -eq is US$47.80 (Table 2).

left_text_column_width

Table 2. Cost per unit climate impact.

Unit: 2023 US$/t CO₂‑eq, 100-yr basis

median 47.80
Left Text Column Width
Learning Curve

We found limited information on this solution’s learning curve. A survey of farmers in Zambia found a reluctance to avoid tilling soils because of the increased need for weeding or herbicides and because crop residues may need to be used for livestock feed (Arslan et al., 2015; Searchinger et al., 2019).

left_text_column_width
Speed of Action

Speed of action refers to how quickly a climate solution physically affects the atmosphere after it is deployed. This is different from speed of deployment, which is the pace at which solutions are adopted.

At Project Drawdown, we define the speed of action for each climate solution as gradualemergency brake, or delayed.

Improve Annual Cropping is a DELAYED climate solution. It works more slowly than nominal or emergency brake solutions. Delayed solutions can be robust climate solutions, but it’s important to recognize that they realize their full potential for some time.

left_text_column_width
Caveats

As with other biosequestration solutions, carbon stored in soils via improved annual cropping is not permanent. It can be lost quickly through a return to conventional agriculture practices like plowing, and/or through a regional shift to a drier climate or other human- or climate change–driven disturbances. Carbon sequestration also only continues for a limited time, estimated at 20–50 years (Lal et al., 2018)).

left_text_column_width
Current Adoption

Kassam et al. (2022) provided regional adoption from 2008–2019. We used a linear forecast to project 2025 adoption. This provided a figure of 267.4 Mha in 2025 (Table 3).

left_text_column_width

Table 3. Current (2025) adoption level.

Unit: Mha of improved annual cropping installed

Drawdown estimate 267.4
Left Text Column Width
Adoption Trend

Between 2008–2009 and 2018–2019 (the most recent data available), the cropland area under improved annual cropping practices nearly doubled globally, increasing from 10.6 Mha to 20.5 Mha at an average rate of 1.0 Mha/yr (Kassam et al., 2022), equivalent to a 9.2% annual increase in area relative to 2008–2009 levels. Adoption slowed slightly in the latter half of the decade, with an average increase of 0.8 Mha/yr- between 2015–2016 and 2018–2019, equivalent to 4.6% annual increase in area relative to 2015–2016 levels. 

Median adoption is 1.11 ha/yr. The median, mean, and 25th and 75th percentiles are shown in Table 4.

left_text_column_width

Table 4. 2008–2009 to 2018–2019 adoption trend.

Unit: Mha adopted/yr

25th percentile 0.54
mean 1.41
median (50th percentile) 1.11
75th percentile 2.04
Left Text Column Width
Adoption Ceiling

Griscom et al. (2017) estimate that 800 Mha of global cropland are suitable – but not yet used for – cover cropping, in addition to 168 Mha already in cover crops (Popelau and Don, 2015). We update the 168 Mha in cover crops to 267 Mha based on Kassam (2022). Griscom et al.’s estimate is based on their analysis that much cropland is unsuitable because it already is used to produce crops during seasons in which cover crops would be grown. Their estimate thus provides a maximum technical potential of 1,067 Mha (Table 5). 

left_text_column_width

Table 5. Adoption ceiling.

Unit: Mha

Adoption ceiling 1,067
Left Text Column Width
Achievable Adoption

The 8th World Congress on Conservation Agriculture (8WCCA) set a goal to achieve adoption of improved annual cropping on 50% of available cropland by 2050 (WCCA 2021). That provides an adoption ceiling of 700 Mha – though this is not a biophysical limit. 

We used the 2008–2019 data from Kassam (2022) to calculate average annual regional growth rates. From these we selected the 25th percentile as our low achievable level (Table 6).

left_text_column_width

Table 6. Range of achievable adoption levels.

Unit: Mha installed

Current Adoption 267.4
Achievable – Low 331.7
Achievable – High 700.0
Adoption Ceiling 1,067.0

Unit: Mha installed

Current Adoption 0.00
Achievable – Low 64.2
Achievable – High 432.6
Adoption Ceiling 868.6
Left Text Column Width

Carbon sequestration continues only for a period of decades; because adoption of improved annual cropping was already underway in the 1970s (Kassam et al., 2022), we could not assume that previously adopted hectares continue to sequester carbon indefinitely. Thus we make the conservative choice to calculate carbon sequestration only for newly adopted hectares. We use the same conservative assumption for nitrous oxide emissions. 

Combined effect is 0.0 Gt CO₂‑eq/yr for current adoption, 0.12 for Achievable – Low, 0.78 for Achievable – High, and 1.56 for our Adoption Ceiling.

left_text_column_width

Table 8. Climate impact at different levels of adoption.

Unit: Gt CO₂‑eq/yr, 100-yr basis

Current Adoption 0.00
Achievable – Low 0.03
Achievable – High 0.22
Adoption Ceiling 0.45

(from nitrous oxide)

Unit: Gt CO₂‑eq/yr, 100-yr basis

Current Adoption 0.00
Achievable – Low 0.08
Achievable – High 0.56
Adoption Ceiling 1.12

(from SOC)

Unit: Gt CO₂‑eq/yr, 100-yr basis

Current Adoption 0.00
Achievable – Low 0.12
Achievable – High 0.78
Adoption Ceiling 1.56
Left Text Column Width
Additional Benefits

Extreme weather events

The soil and water benefits of this solution can lead to agricultural systems that are more resilient to extreme weather events (Mrabet et al., 2023). These agricultural systems have improved uptake, conservation, and use of water, so they are more likely to successfully cope and adapt to drought and dry conditions (Su et al., 2021). Additionally, more sustained year-round plant cover can increase the capacity of cropping systems to adapt to high temperatures and extreme rainfall (Blanco-Canqui & Francis, 2016; Martinez-Mena et al., 2020).

Droughts

Increased organic matter due to improved annual cropping increases soil water holding capacity. This increases drought resilience (Su et al., 2021). 

Income & work

Conservation agriculture practices can reduce costs on fuel, fertilizer, and pesticides (Stavi et al., 2016). The highest revenues from improved annual cropping are often found in drier climates where higher yields are more likely. Nyagumbo et al. (2020) found that smallholder farms in sub-Saharan Africa using conservation agriculture had the highest returns on crop yields when rainfall was low. Tambo et al. (2018) found when smallholder farmers in sub-Saharan Africa jointly employed the three aspects of conservation agriculture – reduced tillage, cover crops, and crop rotation – households and individuals saw the largest income gains.

Food security

Improved annual cropping can improve food security by increasing the amount and the stability of crop yields. A meta-analysis of studies of South Asian cropping systems found that those following conservation agriculture methods had 5.8% higher mean yield than cropping systems with more conventional agriculture practices (Jat et al., 2020). Evidence supports that conservation agriculture practices especially improve yields in water scarce areas (Su et al., 2021). Nyagumbo et al. (2020) found that smallholder farmers in sub-Saharan Africa experienced reduced yield variability when using conservation agriculture practices.

Nature protection

Improved annual cropping can increase biodiversity below and above soils (Mrabet et al., 2023). Increased vegetation cover improves habitats for arthropods, which help with pest and pathogen management (Stavi et al., 2016).

Land resources

Improved annual cropping methods can lead to improved soil health through the increased stability of soil structure, increased soil nutrients, and improved soil water storage (Francaviglia et al., 2023). This can reduce soil degradation and erosion (Mrabet et al., 2023). Additionally, more soil organic matter can lead to additional microbial growth and nutrient availability for crops (Blanco-Canqui & Francis, 2016). 

Water quality

Runoff of soil and other agrochemicals can be minimized through conservation agricultural practices (Jayaraman et al., 2021), reducing the amount of nitrate and phosphorus that leach into waterways and contribute to algal blooms and eutrophication (Jayaraman et al., 2021). Abdalla et al. (2019) found that cover crops reduced nitrogen leaching.

left_text_column_width
Risks

Herbicides – in place of tillage – are used in many but not all no-till cropping systems to kill (terminate) the cover crop. The large-scale use of herbicides in improved annual cropping systems can produce a range of environmental and human health consequences. Agricultural impacts can include development of herbicide-resistant weeds (Clapp, 2021). 

If cover crops are not fully terminated before establishing the main crop, there is a risk that cover crop can compete with the main crop (Quintarelli et al., 2022). 

left_text_column_width
Interactions with Other Solutions

Improved annual cropping has competing interactions with several other solutions related to shifting annual practices. For each of these other solutions, the Improve Annual Cropping solution can reduce the area on which the solution can be applied or the nutrient excess available for improved management. 

left_text_column_width

COMPETING

In no-till systems, cover crops are typically terminated with herbicides, often preventing incorporation of trees depending on the type of herbicide used.

left_text_column_width

Land managed under the Improve Annual Cropping solution is not available for perennial crops.

left_text_column_width

Improved annual cropping typically reduces fertilizer demand, reducing the scale of climate impact under improved nutrient management. 

left_text_column_width

Our definition of improved annual cropping requires residue retention, limiting the additional area available for deployment of reduced burning.

left_text_column_width
Dashboard

Solution Basics

1 ha of cropland

tCO2-eq/unit/yr
1.8
units
Current 06.42×10⁷4.33×10⁸
Achievable (Low to High)

Climate Impact

GtCO2-eq/yr
Current 0 0.120.78
US$ per tCO2-eq
48
Delayed

CO₂, N₂O

Trade-offs

Some studies have found that conservation tillage without cover crops can reduce soil carbon stocks in deeper soil layers. They caution against overreliance on no-till as a sequestration solution in the absence of cover cropping. Reduced tillage should be combined with cover crops to ensure carbon sequestration (Luo et al., 2010; Ogle et al., 2019; Powlson et al., 2014).

left_text_column_width
tCO2-eq/ha
0400

Millennia of agricultural land use have removed nearly 500 Gt CO2-eq from soils

Agriculture has altered the soil carbon balance around the world, resulting in changes (mostly losses) of soil carbon. Much of the nearly 500 Gt CO2-eq lost in the last 12,000 years is now in the atmosphere in the form of CO2.

Sanderman, J. et al. (2017). The soil carbon debt of 12,000 years of human land use [Data set]. PNAS 114(36): 9575–9580. doi:10.1073/pnas.1706103114

Geographic Guidance Introduction

Adoption of this solution varies substantially across the globe. Currently, improved annual cropping practices are widely implemented in Australia and New Zealand (74% of annual cropland) and Central and South America (69%), with intermediate adoption in North America (34%) and low adoption in Asia, Europe, and Africa (1–5%) (Kassam et al., 2022), though estimates vary (see also Prestele et al., 2018). Future expansion of this solution is most promising in Asia, Africa, and Europe, where adoption has increased in recent years. Large areas of croplands are still available for implementation in these regions, whereas Australia, New Zealand, and Central and South America may be reaching a saturation point, and these practices may be less suitable for the relatively small area of remaining croplands.

The carbon sequestration effectiveness of this solution also varies across space. Drivers of soil carbon sequestration rates are complex and interactive, with climate, initial soil carbon content, soil texture, soil chemical properties (such as pH), and other land management practices all influencing the effectiveness of adopting this solution. Very broadly, the carbon sequestration potential of improved annual cropping tends to be two to three times higher in warm areas than cool areas (Bai et al., 2019; Cui et al., 2022; Lessmann et al., 2021). Warm and humid conditions enable vigorous cover crop growth, providing additional carbon inputs into soils. Complicating patterns of effectiveness, however, arid regions often experience increased crop yields following adoption of this solution whereas humid regions are more likely to experience yield losses (Pittelkow et al., 2015). Yield losses may reduce adoption in humid areas and can lead to cropland expansion to compensate for lower production. 

Uptake of this solution may be constrained by spatial variation in places where cover cropping is suitable. In areas with double or triple cropping, there may not be an adequate interval for growth of a cover crop between harvests. In areas with an extended dry season, there may be inadequate moisture to grow a cover crop.

Action Word
Improve
Solution Title
Annual Cropping
Classification
Highly Recommended
Lawmakers and Policymakers
  • Provide local and regional institutional guidance for improving annual cropping that adapts to the socio-environmental context.
  • Integrate soil protection into national climate mitigation and adaptation plans.
  • Remove financial incentives, such as subsidies, for unsustainable practices and replace them with financial incentives for carbon sequestration practices.
  • Place taxes or fines on emissions and related farm inputs (such as nitrogen fertilizers).
  • Reform international agricultural trade, remove subsidies for emissions-intensive agriculture, and support climate-friendly practices.
  • Strengthen and support land tenure for smallholder farmers.
  • Mandate insurance schemes that allow farmers to use cover crops and reduce tillage.
  • Support, protect, and promote traditional and Indigenous knowledge of land management practices.
  • Set standards for measuring, monitoring, and verifying impacts on SOC accounting for varying socio-environmental conditions.
  • Develop economic budgets for farmers to adopt these practices.
  • Invest in or expand extension services to educate farmers and other stakeholders on the economic and environmental benefits of improved annual cropping.
  • Create, support, or join education campaigns and/or public-private partnerships that facilitate stakeholder discussions.
Practitioners
  • Implement no-till practices and use cover crops.
  • Utilize or advocate for financial assistance and tax breaks for farmers to use improved annual cropping techniques.
  • Adjust the timing and dates of the planting and termination of the cover crops in order to avoid competition for resources with the primary crop.
  • Find opportunities to reduce initial operation costs of no-tillage and cover crops, such as selling cover crops as forage or grazing.
  • Take advantage of education programs, support groups, and extension services focused on improved annual cropping methods.
  • Create, support, or join stakeholder discussions, especially around standardized monitoring frameworks, ROI, and climate benefits.
Business Leaders
  • Source from producers implementing improved annual cropping practices, create programs that directly engage and educate farmers, and promote inspiring case studies with the industry and wider public.
  • Create sustainability goals and supplier requirements that incorporate this solution and offer pricing incentives for compliant suppliers.
  • Invest in companies that utilize improved annual cropping techniques or produce the necessary inputs.
  • Promote and develop markets for products that employ improved annual cropping techniques and educate consumers about the importance of the practice.
  • Stay abreast of recent scientific findings and use third-party verification to monitor sourcing practices.
  • Offer financial services – including low-interest loans, micro-financing, and grants – to support low-carbon agriculture (e.g., sustainable land management systems).
  • Support high-integrity carbon markets, institutions, rules, and norms to cultivate the demand for high-quality carbon credits.
  • Create, support, or join education campaigns and/or public-private partnerships that facilitate stakeholder discussions, especially around standardized monitoring frameworks, ROI, and climate benefits.
Nonprofit Leaders
  • Start model farms to demonstrate techniques, conduct experiments, and educate local farmers.
  • Conduct and share research on improving annual cropping techniques and local policy options.
  • Advocate to policymakers for improving annual cropping techniques, incentives, and regulations.
  • Educate farmers on sustainable means of agriculture and support implementation.
  • Help integrate improved annual cropping practices as part of the broader climate agenda.
  • Engage with businesses to encourage corporate responsibility and/or monitor soil health.
  • Offer resources and training in financial planning and yield risk management to farmers adopting improved annual cropping approaches.
  • Partner with research institutions and businesses to co-develop and distribute region-specific best practices.
  • Create, support, or join stakeholder discussions, especially around standardized monitoring frameworks, ROI, and climate benefits.
Investors
  • Integrate science-based due diligence on improved annual cropping techniques and soil health measures into all farming and agritech investments.
  • Encourage companies in your investment portfolio to adopt improved annual cropping practices.
  • Offer access to capital, such as low-interest loans, micro-financing, and grants to improve annual cropping.
  • Invest in companies developing technologies that improve annual cropping, such as soil management equipment and related software.
  • Create, support, or join stakeholder discussions, especially around standardized monitoring frameworks, ROI, and climate benefits.
Philanthropists and International Aid Agencies
  • Start model farms to demonstrate techniques, conduct experiments, and educate local farmers.
  • Offer access to capital, such as low-interest loans, micro-financing, and grants to support improving annual cropping, (e.g., traditional land management).
  • Conduct and share research on improved annual cropping techniques and local policy options.
  • Advocate to policymakers for improved annual cropping techniques, incentives, and regulations.
  • Educate farmers on traditional means of agriculture and support implementation.
  • Help integrate improved annual cropping practices as part of the broader climate agenda.
  • Engage with businesses to encourage corporate responsibility and/or monitor soil health.
  • Offer resources and training in financial planning and yield risk management to farmers adopting improved annual cropping approaches.
  • Partner with research institutions and businesses to co-develop and distribute region-specific best practices.
  • Create, support, or join stakeholder discussions, especially around standardized monitoring frameworks, ROI, and climate benefits.
  • Invest in companies developing technologies that improve annual cropping, such as soil management equipment and related software.
Thought Leaders
  • Start model farms to demonstrate techniques, conduct experiments, and educate local farmers.
  • Conduct and share research on improved annual cropping techniques and local policy options.
  • Advocate to policymakers for improved annual cropping techniques, incentives, and regulations.
  • Educate farmers on traditional means of agriculture and support implementation.
  • Engage with businesses to encourage corporate responsibility and/or monitor soil health.
  • Research the regional impacts of cover crops on SOC and SOM and publish the data.
  • Partner with research institutions and businesses to co-develop and distribute region-specific best practices.
  • Create, support, or join stakeholder discussions, especially around standardized monitoring frameworks, ROI, and climate benefits.
  • Work with farmers and other private organizations to improve data collection on uptake of improved annual cropping techniques, effectiveness, and regional best practices.
Technologists and Researchers
  • Help develop standards for measuring, monitoring, and verifying impacts on SOC accounting for varying socio-environmental conditions.
  • Research the regional impacts of cover crops (particularly outside the United States) on SOC and SOM, and publish the data.
  • Create tracking and monitoring software to support farmers' decision-making.
  • Research the application of AI and robotics for crop rotation.
  • Improve data and analytics to monitor soil and water quality, assist farmers, support policymaking, and assess the impacts of policies.
  • Develop education and training applications to improve annual cropping techniques and provide real-time feedback.
Communities, Households, and Individuals
  • Participate in urban agriculture or community gardening programs that implement these practices.
  • Engage with businesses to encourage corporate responsibility and/or monitor soil health.
  • Work with farmers and other private organizations to improve data collection on uptake of improved annual cropping techniques, effectiveness, and regional best practices.
  • Advocate to policymakers for improved annual cropping techniques, incentives, and regulations.
  • Start model farms to demonstrate techniques, conduct experiments, and educate local farmers.
  • Educate farmers on traditional means of agriculture and support implementation.
  • Create, support, or join stakeholder discussions, especially around standardized monitoring frameworks, ROI, and climate benefits.
Evidence Base

Carbon sequestration from cover cropping: High consensus

The impacts of improved annual cropping practices on soil carbon sequestration have been extensively studied, and there is high consensus that adoption of cover crops can increase carbon sequestration in soils. However, estimates of how much carbon can be sequestered vary substantially, and sequestration rates are strongly influenced by factors such as climate, soil properties, time since adoption, and how the practices are implemented.

The carbon sequestration benefits of cover cropping are well established. They have been documented in reviews and meta-analyses including Hu et al. (2023) and Vendig et al. (2023). 

Carbon sequestration from reduced tillage: Mixed

Relative to conventional tillage, estimates of soil carbon gains in shallow soils under no-till management include average increases of 5–20% (Bai et al., 2019; Cui et al., 2022; Kan et al., 2022). Lessmann et al. (2021) estimated that use of no-till is associated with an average annual increase in carbon sequestration of 0.88 t CO₂‑eq /ha/yr relative to high-intensity tillage. 

Nitrous oxide reduction: Mixed

Consensus on nitrous oxide reductions from improved annual cropping is mixed. Several reviews have demonstrated a modest reduction in nitrous oxide from cover cropping (Abdalla et al., 2019; Xing & Wang, 2024). Reduced tillage can result in either increased or decreased nitrous oxide emissions (Hassan et al., 2022). 

The results presented in this document summarize findings from 10 reviews and meta-analyses reflecting current evidence at the global scale. Nonetheless, not all countries are represented. We recognize this limited geographic scope creates bias, and hope this work inspires research and data sharing on this topic in underrepresented regions.

left_text_column_width
Updated Date

Deploy Alternative Insulation Materials

Image
Image
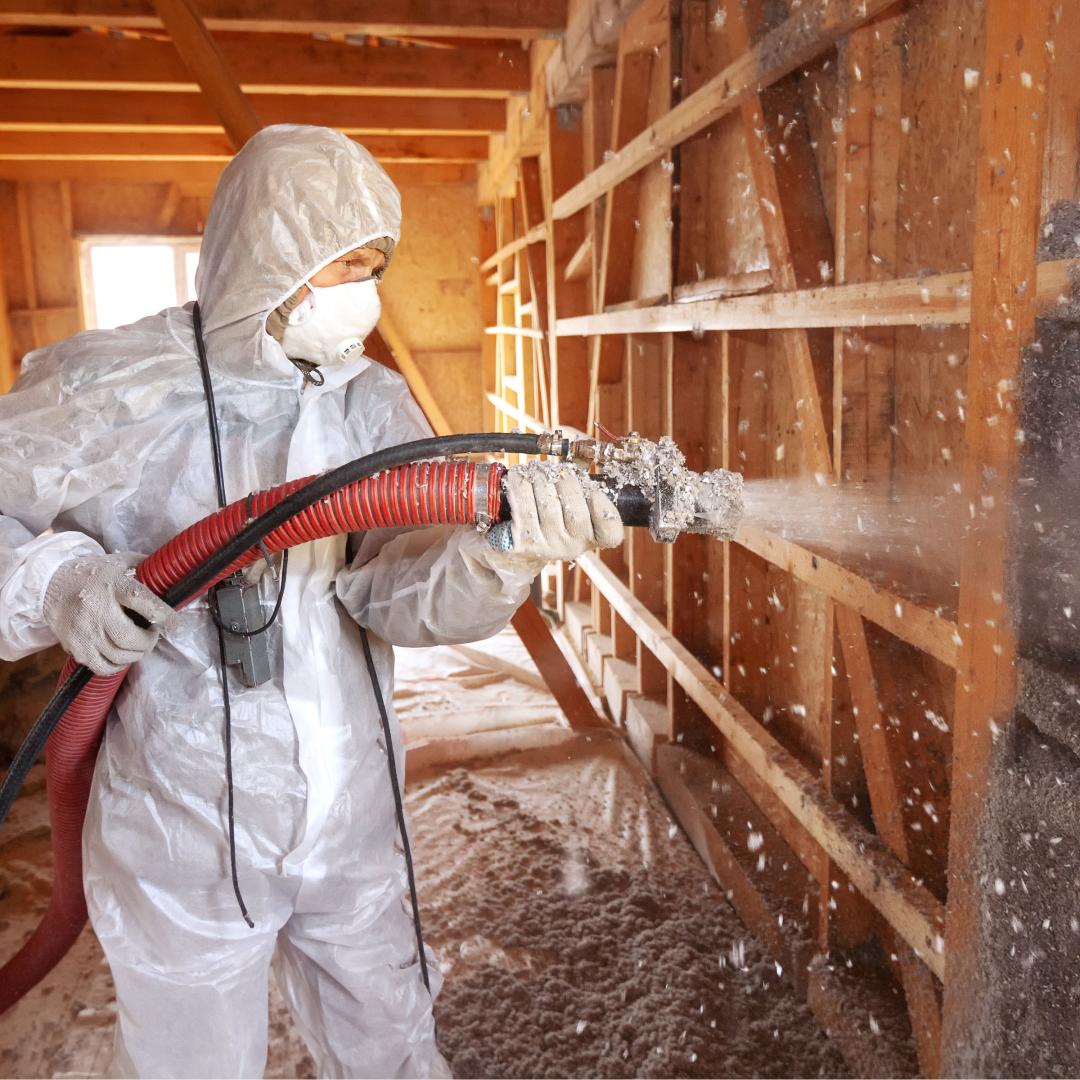
Worker sprays insulation in building frame.
Coming Soon
Off
Summary

Deploy Alternative Insulation Materials is defined as using alternative building insulation materials in place of conventional ones. In particular, we highlight the impact of using cellulose instead of glass, mineral, or plastic insulation in new and retrofit buildings. Cellulose insulation manufacture and installation emits fewer GHGs to reach the same operational insulating performance than does manufacture and installation of conventional materials.

Overview

Thermal insulation materials are used in the walls, roofs, and floors of buildings to help maintain comfortable indoor temperatures. However, manufacture and installation of insulation materials produces GHG emissions. These are called embodied emissions because they occur before the insulation is used in buildings. Insulation embodied emissions offset a portion of the positive climate impacts from using insulation to reduce heating and cooling demand. A Canadian study found that over 25% of residential embodied emissions from manufacturing building materials can be due to insulation (Magwood et al., 2022). Using cellulose insulation made primarily from recycled paper avoids some embodied emissions associated with conventional insulation.

Insulation is manufactured in many different forms, including continuous blankets or boards, loose fill, and sprayed foam (Types of Insulation, n.d.). Most conventional insulation materials are nonrenewable inorganic materials such as stone wool and fiberglass. These require high temperatures (>1,300 °C) to melt the raw ingredients, consuming thermal energy and releasing CO₂ from fossil fuel combustion or grid power generation (Schiavoni et al., 2016). Other common insulations are plastics, including expanded polystyrene (EPS), extruded polystyrene (XPS), polyurethane (PUR), and polyisocyanurate (PIR). Producing these plastics requires the extraction of fossil fuels – primarily petroleum – for feedstocks, as well as high amounts of energy for processing (Harvey, 2007)

F-gases are often used as blowing agents to manufacture rigid foam board insulation or install sprayed foam insulation (Figure 1). F-gases are GHGs with GWPs that can be hundreds or thousands of times higher than CO₂. High-GWP F-gases used in foam production are released into the atmosphere during all subsequent stages of the foam’s life cycle (Biswas et al., 2016; Waldman et al., 2023). The climate benefits of this solution during the installation stage are primarily due to avoiding these blowing agents. 

Alternative insulation is produced from plant or animal biomass (bio-based materials, see Figure 2) or waste products (recycled materials). Alternative insulation materials provide climate benefits by consuming less manufacturing energy, using renewable materials in place of fossil fuels, and eliminating high-GWP blowing agents (Sustainable Traditional Buildings Alliance, 2024)

Figure 3 compares a variety of conventional and alternative insulation materials. While many bio-based and recycled materials could be used as alternatives to these conventional materials, this solution focuses on cellulose due to its effectiveness in avoiding emissions, low cost, and wide availability. Cellulose insulation is made primarily from recycled paper fibers, newsprint, and cardboard. These products are made into fibers and blended with fire retardants to produce loose or batt cellulose insulation (Figure 4) (Waldman et al., 2023; Wilson, 2021).

Figure 1. Properties and adoption of conventional and alternative insulation materials. Costs and emissions will vary from the values here depending on the insulation form (board, blanket, loose-fill, etc.).

Category Material High-GWP F-gases used? Median manufacturing and installation emissions* Mean product and installation cost** Estimated market share
(% by mass)
Conventional materials Stone wool No 0.31 623 20
Glass wool (fiberglass) No 0.29 508 34
EPS No 0.38 678 22
XPS Yes, sometimes 9.44 702 7
PUR/PIR Yes, sometimes 6.14 1,000 11
Alternative materials Cellulose No 0.05 441 2–13
Cork No 0.30 1,520 Commercially available, not widely used
Wood fiber No 0.13 814 Commercially available, not widely used
Plant fibers (kenaf, hemp, jute) No 0.18 467 Commercially available, not widely used
Sheep’s wool No 0.14 800 Commercially available, not widely used
Recycled PET plastic No 0.12 2,950 Commercially available, not widely used

*t CO₂‑eq (100-yr) to insulate 100m² to 1m²·K/W

**2023 US$ to insulate 100m² to 1m²·K/W. We use mean values for cost analysis to better capture the limited data and wide range of reported costs.

Although we are estimating the impact of using cellulose insulation in all buildings, the unique circumstances of each building are important when choosing the most appropriate insulation material. In this solution, we don’t distinguish between residential and commercial buildings, retrofit or new construction, different building codes, or different climates, but these would be important areas of future study.

In this solution, the effectiveness, cost, and adoption are calculated over a specified area (100 m2) and thermal resistance (1 m2·K/W). The chosen adoption unit ensures that all data are for materials with the same insulating performance. Due to limited material information, we assumed that insulation mass scales linearly with thermal resistance.

To better understand the adoption unit, a one-story residential building of 130 m2 floor area would require approximately 370 m2 of insulation area (RSMeans from The Gordian Group, 2023). For a cold climate like Helsinki, Finland, code requires insulation thermal resistance of 11 m2·K/W (The World Bank, n.d.). For a warm climate like Jerusalem, Israel, envelope thermal resistance requirements average 1.1 m2·K/W (The World Bank, n.d.). Therefore, depending on the location, anywhere from approximately 4–40 adoption units insulating 100 m2 to 1 m2·K/W may be needed to insulate a small single-story home to the appropriate area and insulation level.

Take Action Intro

Would you like to help deploy alternative insulation? Below are some ways you can make a difference, depending on the roles you play in your professional or personal life.

These actions are meant to be starting points for involvement and may or may not be the most important, impactful, or doable actions you can take. We encourage you to explore, get creative, and take a step that is right for you!

References

Adams, M., Burrows, V., & Richardson, S. (2019). Bringing embodied carbon upfront: Coordinated action for the building and construction sector to tackle embodied carbon. World Green Building Council, Advancing Net Zero, Ramboll, & C40 Cities. https://worldgbc.s3.eu-west-2.amazonaws.com/wp-content/uploads/2022/09/22123951/WorldGBC_Bringing_Embodied_Carbon_Upfront.pdf

Amendment to the Montreal Protocol on Substances that Deplete the Ozone Layer. (2016, October 15). https://treaties.un.org/doc/Treaties/2016/10/20161015%2003-23%20PM/Ch_XXVII-2.f-English%20and%20French.pdf

Andersen, B., & Rasmussen, T. V. (2025). Biobased building materials: Moisture characteristics and fungal susceptibility. Building and Environment, 112720. https://doi.org/10.1016/j.buildenv.2025.112720

Asdrubali, F., D’Alessandro, F., & Schiavoni, S. (2015). A review of unconventional sustainable building insulation materials. Sustainable Materials and Technologies4, 1–17. https://doi.org/10.1016/j.susmat.2015.05.002

Biswas, K., Shrestha, S. S., Bhandari, M. S., & Desjarlais, A. O. (2016). Insulation materials for commercial buildings in North America: An assessment of lifetime energy and environmental impacts. Energy and Buildings112, 256–269. https://doi.org/10.1016/j.enbuild.2015.12.013

Cabeza, L. F., Boquera, L., Chàfer, M., & Vérez, D. (2021). Embodied energy and embodied carbon of structural building materials: Worldwide progress and barriers through literature map analysis. Energy and Buildings231, 110612. https://doi.org/10.1016/j.enbuild.2020.110612

Carbon Removals Expert Group Technical Assistance. (2023, December). Review of certification methodologies for long-term biogenic carbon storage in buildings. European Commission. https://climate.ec.europa.eu/system/files/2023-12/policy_carbon_expert_biogenic_carbon_storage_in_buildings_en.pdf

Deer, C., George, M., Kaluza, P., Loudon, Moore, G., Musick, M., Musick, R., Seifert, R., & Woodward, J. (2007). Alaska Residential Building Manual. Alaska Housing Finance Corporation. https://www.ahfc.us/application/files/2813/5716/1325/building_manual.pdf

Esau, R., Jungclaus, M., Olgyay, V., & Rempher, A. (2021). Reducing Embodied Carbon in Buildings: Low-Cost, High-Value Opportunities. RMI. http://www.rmi.org/insight/reducing-embodied-carbon-in-buildings

Fabbri, M., Rapf, O., Kockat, J., Fernández Álvarez, X., Jankovic, I., & Sibileau, H. (2022). Putting a stop to energy waste: How building insulation can reduce fossil fuel imports and boost EU energy security. Buildings Performance Institute Europe. https://www.bpie.eu/wp-content/uploads/2022/05/Putting-a-stop-to-energy-waste_Final.pdf

Forestry Production and Trade. (2023). [Dataset]. FAOSTAT. https://www.fao.org/faostat/en/#data/FO

Füchsl, S., Rheude, F., & Röder, H. (2022). Life cycle assessment (LCA) of thermal insulation materials: A critical review. Cleaner Materials5, 100119. https://doi.org/10.1016/j.clema.2022.100119

Gelowitz, M. D. C., & McArthur, J. J. (2017). Comparison of type III environmental product declarations for construction products: Material sourcing and harmonization evaluation. Journal of Cleaner Production157, 125–133. https://doi.org/10.1016/j.jclepro.2017.04.133

Global Alliance for Buildings and Construction, International Energy Agency, and the United Nations Environment Programme. (2020). GlobalABC Roadmap for Buildings and Construction: Towards a zero-emission, efficient and resilient buildings and construction sector. International Energy Agency. https://www.iea.org/reports/globalabc-roadmap-for-buildings-and-construction-2020-2050

Grazieschi, G., Asdrubali, F., & Thomas, G. (2021). Embodied energy and carbon of building insulating materials: A critical review. Cleaner Environmental Systems2, 100032. https://doi.org/10.1016/j.cesys.2021.100032

Harvey, L. D. D. (2007). Net climatic impact of solid foam insulation produced with halocarbon and non-halocarbon blowing agents. Building and Environment42(8), 2860–2879. https://doi.org/10.1016/j.buildenv.2006.10.028

Installed Cost of Residential Siding Comparative Study. (2023). RSMeans / The Gordian Group. https://www.gobrick.com/content/userfiles/files/RSMeans%20Residential%20Siding%20Comparative%20Cost%20Wall%20System%20Study%20Final%202023-09-15.pdf

Insulation Choices Revealed in New Study. (2019, June 19). Home Innovation Research Labs. https://www.homeinnovation.com/trends_and_reports/trends/insulation_choices_revealed_in_new_study

International Energy Agency. (2023). Building envelopes. https://www.iea.org/energy-system/buildings/building-envelopes

International Energy Agency, International Renewable Energy Agency, & United Nations Climate Change High-Level Champions. (2023). Breakthrough agenda report 2023. https://www.iea.org/reports/breakthrough-agenda-report-2023

Jelle, B. P. (2011). Traditional, state-of-the-art and future thermal building insulation materials and solutions – Properties, requirements and possibilities. Energy and Buildings43(10), 2549–2563. https://doi.org/10.1016/j.enbuild.2011.05.015

Kumar, D., Alam, M., Zou, P. X. W., Sanjayan, J. G., & Memon, R. A. (2020). Comparative analysis of building insulation material properties and performance. Renewable and Sustainable Energy Reviews131, 110038. https://doi.org/10.1016/j.rser.2020.110038

Magwood, C., Bowden, E., & Trottier, M. (2022). Emissions of Materials Benchmark Assessment for Residential Construction Report. Passive Buildings Canada and Builders for Climate Action.

Malhotra, A., & Schmidt, T. S. (2020). Accelerating Low-Carbon Innovation. Joule4(11), 2259–2267. https://doi.org/10.1016/j.joule.2020.09.004

Mályusz, L., & Pém, A. (2013). Prediction of the learning curve in roof insulation. Automation in Construction36, 191–195. https://doi.org/10.1016/j.autcon.2013.04.004

Mapping energy efficiency: A global dataset on building code effectiveness and compliance: Country profiles. (n.d.). [Dataset]. The World Bank. https://www.worldbank.org/content/dam/sites/buildinggreen/doc/building_green_country_profile.pdf

Maskell, D., Da Silva, C., Mower, K., Rana, C., Dengel, A., Ball, R., Ansell, M., Walker, P., & Shea, A. (2015, June 22). Properties of bio-based insulation materials and their potential impact on indoor air quality. First International Conference on Bio-based Building Materials, Clermont-Ferrand, France.

McGrath, T., Seigel, K., & Dickinson, M. (2023). Embodied Carbon and Material Health in Insulation. Healthy Building Network, Perkins&Will. https://habitablefuture.org/wp-content/uploads/2024/03/96-Carbon-Health-Insulation.pdf

Naldzhiev, D., Mumovic, D., & Strlic, M. (2020). Polyurethane insulation and household products – A systematic review of their impact on indoor environmental quality. Building and Environment169, 106559. https://doi.org/10.1016/j.buildenv.2019.106559

Northeast Bio-based Materials Collective 2023 summit proceedings. (2023). https://massdesigngroup.org/sites/default/files/file/2024/Northeast%20Bio-Based%20Materials%20Collective%202023%20Summit%20Proceedings.pdf

Petcu, C., Hegyi, A., Stoian, V., Dragomir, C. S., Ciobanu, A. A., Lăzărescu, A.-V., & Florean, C. (2023). Research on Thermal Insulation Performance and Impact on Indoor Air Quality of Cellulose-Based Thermal Insulation Materials. Materials16(15), Article 15. https://doi.org/10.3390/ma16155458

Rabbat, C., Awad, S., Villot, A., Rollet, D., & Andrès, Y. (2022). Sustainability of biomass-based insulation materials in buildings: Current status in France, end-of-life projections and energy recovery potentials. Renewable and Sustainable Energy Reviews156, 111962. https://doi.org/10.1016/j.rser.2021.111962

Riverse. (2024, August). Methodology: Biobased construction materials. https://www.riverse.io/methodologies/biobased-construction-materials

RSMeans from The Gordian Group. (2023). Installed Cost of Residential Siding Comparative Study. https://www.gobrick.com/content/userfiles/files/RSMeans%20Residential%20Siding%20Comparative%20Cost%20Wall%20System%20Study%20Final%202023-09-15.pdf

SaravanaPrabhu, G., & Vidjeapriya, R. (2021). Comparative Analysis of Learning Curve Models on Construction Productivity of Diaphragm Wall and Pile. IOP Conference Series: Materials Science and Engineering1197(1), 012004. https://doi.org/10.1088/1757-899X/1197/1/012004

Schiavoni, S., D׳Alessandro, F., Bianchi, F., & Asdrubali, F. (2016). Insulation materials for the building sector: A review and comparative analysis. Renewable and Sustainable Energy Reviews62, 988–1011. https://doi.org/10.1016/j.rser.2016.05.045

Schulte, M., Lewandowski, I., Pude, R., & Wagner, M. (2021). Comparative life cycle assessment of bio-based insulation materials: Environmental and economic performances. GCB Bioenergy13(6), 979–998. https://doi.org/10.1111/gcbb.12825

Stamm, R., Johnson, R., Clarity, C., McGrath, T., Singla, V., & Hasson, M. K. (2022). Chemical and Environmental Justice Impacts in the Life Cycle of Building Insulation. Energy Efficiency for All, Healthy Building Network. https://informed.habitablefuture.org/resources/research/20-chemical-and-environmental-justice-impacts-in-the-life-cycle-of-building-insulation-report-brief

Sustainable Traditional Buildings Alliance. (2024, March). The Use of Natural Insulation Materials in Retrofit. https://stbauk.org/wp-content/uploads/2024/03/The-use-of-natural-insulation-materials-in-retrofit.pdf

The Freedonia Group. (2024). Global Insulation Report. https://www.freedoniagroup.com/industry-study/global-insulation

The World Bank. (n.d.). Mapping Energy Efficiency: A GLobal Dataset on Building Code Effectiveness and Compliance. https://www.worldbank.org/content/dam/sites/buildinggreen/doc/building_green_main_findings.pdf

Types of Insulation. (n.d.). U.S. Department of Energy. https://www.energy.gov/energysaver/types-insulation

Waldman, B., Hyatt, A., Carlisle, S., Palmeri, J., & Simonen, K. (2023). 2023 Carbon Leadership Forum North American Material Baselines. Carbon Leadership Forum, University of Washington. https://carbonleadershipforum.org/clf-material-baselines-2023/

Wang, Z., & Wang, D. (2023). Can Paper Waste Be Utilised as an Insulation Material in Response to the Current Crisis. Sustainability15(22), Article 22. https://doi.org/10.3390/su152215939

Wi, S., Kang, Y., Yang, S., Kim, Y. U., & Kim, S. (2021). Hazard evaluation of indoor environment based on long-term pollutant emission characteristics of building insulation materials: An empirical study. Environmental Pollution285, 117223. https://doi.org/10.1016/j.envpol.2021.117223

Wilson, A. (2021). The BuildingGreen Guide to Thermal Insulation: What You Need to Know About Performance, Health, and Environmental Considerations. BuildingGreen, Inc.

Zabalza Bribián, I., Valero Capilla, A., & Aranda Usón, A. (2011). Life cycle assessment of building materials: Comparative analysis of energy and environmental impacts and evaluation of the eco-efficiency improvement potential. Building and Environment46(5), 1133–1140. https://doi.org/10.1016/j.buildenv.2010.12.002

Credits

Lead Fellow

  • Sarah Gleeson, Ph.D.

Contributors

  • Ruthie Burrows, Ph.D.

  • James Gerber, Ph.D.

  • Yusuf Jameel, Ph.D. 

  • Daniel Jasper

  • Alex Sweeney

Internal Reviewers

  • Aiyana Bodi

  • Hannah Henkin

  • Ted Otte

  • Amanda Smith, Ph.D.

  • Tina Swanson, Ph.D.

Effectiveness

To insulate 100 m2 to a thermal resistance of 1 m2·K/W using entirely cellulose insulation in place of the current baseline mix of insulation materials is expected to avoid 1.59 t CO₂‑eq on a 100-yr basis (Table 1). Effectiveness for this solution measures the one-time reduced emissions from manufacturing and installing insulation. Insulation also reduces the energy used while a building is operating, but those emissions are addressed separately in the Improve Building Envelopes solution. 

Conventional insulation cost was considered to be a weighted average cost of the current baseline insulation mix, including a small amount of cellulose insulation currently in use.

The largest contributor to conventional insulation embodied emissions is using high-GWP blowing agents to manufacture or install XPS, PUR, or PIR foam. We assumed the use of F-gas blowing agents for all foams, although these are already being regulated out of use globally (Amendment to the Montreal Protocol on Substances That Deplete the Ozone Layer, 2016) and an unknown amount of low-GWP blowing agents are currently use (such as hydrocarbons or CO₂ ). Therefore, we anticipate the effectiveness of this solution will decrease as F-gases are used less in the future. We assumed that 100% of blowing agents are emitted over the product lifetime.

Cellulose has the greatest avoided emissions of all of the alternative materials we evaluated (Figure 1). The next most effective materials were recycled PET, wood fibers, and sheep’s wool. Conventional materials like XPS, PUR, and PIR that are foamed with F-gases had the highest GHG emissions. For bio-based materials, we did not consider biogenic carbon as a source of carbon sequestration due to quantification and permanence concerns. 

left_text_column_width

Table 1. Effectiveness at reducing emissions.

Unit: t CO₂‑eq /insulation required to insulate 100 m2 to a thermal resistance of 1 m2·K/W, 100-yr basis

25th percentile 0.98
mean 1.34
median (50th percentile) 1.59
75th percentile 1.81
Left Text Column Width
Cost

Available cost data are variable for all materials, particularly those in early-stage commercialization. The mean cost of purchasing and installing cellulose insulation is less than that of any other conventional or alternative insulation material (Figure 1). Compared with the average cost of conventional insulation, the mean cost savings for cellulose insulation is US$193/100 m2 insulated to a thermal resistance of 1 m2·K/W. Since most buildings are insulated over greater areas to higher thermal resistances, these savings would quickly add up. When considering the mean cost per median climate impact, cellulose insulation saves US$121/t CO₂‑eq (100-yr basis), making it an economically and environmentally beneficial alternative (Table 2).

We considered conventional insulation cost to be a weighted average cost of the current baseline insulation mix, including a small amount of cellulose insulation currently in use.

For conventional insulation, material costs of purchasing the insulation are higher than costs for installation (US$540 and US$97, respectively, to insulate 100 m2 to a thermal resistance of 1 m2·K/W). Cellulose has a lower product cost and comparable installation costs to conventional materials. We considered all costs to be up-front and not spread over the lifetime of the material or building. For each material type, cost will vary based on the form of the insulation (board, loose, etc.) and this should be accounted for when comparing insulation options for a particular building. 

We determined net costs of insulation materials by adding the mean cost to purchase the product and the best estimation of installation costs based on available information. Installation costs were challenging to find data on and therefore represent broad assumptions of installation type and labor. Cost savings were determined by subtracting the weighted average net cost of conventional materials to the net cost of an alternative material. Although we used median values for other sections of this assessment, the spread of data was large for product cost estimates and the mean value was more appropriate in the expert judgment of our reviewers. 

left_text_column_width

Table 2. Cost per unit of climate impact.

Unit: 2023 US$/t CO₂‑eq, 100-yr basis

estimate -121
Left Text Column Width
Learning Curve

Little information is available about the learning rate for new insulation materials. Mályusz and Pém (2013) evaluated how labor time decreased with repetitive cycles for installing roof insulation. They found a learning rate of ~90%, but only for this specific insulation scenario, location, and material. Additionally, this study does not include any product or manufacturing costs that may decrease with scale.

In general, labor time for construction projects decreases with repetitive installation, including improved equipment and techniques and increased construction crew familiarity with the process (SaravanaPrabhu & Vidjeapriya, 2021). However, Malhotra and Schmidt (2020) classify building envelope retrofits as technologies that are highly customized based on user requirements, regulations, physical conditions, and building designs, likely leading to learning rates that are slow globally but where local expertise could reduce installation costs.

left_text_column_width
Speed of Action

Speed of action refers to how quickly a climate solution physically affects the atmosphere after it is deployed. This is different from speed of deployment, which is the pace at which solutions are adopted.

 At Project Drawdown, we define the speed of action for each climate solution as gradualemergency brake, or delayed.

Deploy Alternative Insulation Materials is an EMERGENCY BRAKE climate solution. It has the potential to deliver a more rapid impact than nominal and delayed solutions. Because emergency brake solutions can deliver their climate benefits quickly, they can help accelerate our efforts to address dangerous levels of climate change. For this reason, they are a high priority.

left_text_column_width
Caveats

Manufacturing and installation emissions reductions due to the use of alternative building thermal insulation materials are both permanent and additional

Permanence: There is a low risk of the emissions reductions for this solution being reversed. By using cellulose insulation instead of inorganic or plastic-based insulation, a portion of the manufacturing and installation emissions are never generated in the first place, making this a permanent reduction. Emissions from high-temperature manufacturing, petroleum extraction, and blowing agent use are all reduced through this approach.

Additionality: The GHG emissions reductions from alternative insulation materials are additional because they are calculated here relative to a baseline insulation case. This includes a small amount of cellulose materials included in baseline building insulation. Therefore, avoided emissions represent an improvement of the current emissions baseline that would have occurred in the absence of this solution. 

left_text_column_width
Current Adoption

Adoption data are extremely limited for alternative insulation materials. All adoption data and estimates are assumed to apply to both residential and commercial buildings, although in reality the uptake of alternative insulation materials will vary by building type due to differences in structures, climate, use type, and regulations. We assume that future uptake of alternative insulation is used only during retrofit or new construction, or when existing insulation is at the end of its functional lifetime.

European sources report that 2–13% of the insulation market is alternative materials. Depending on the source, this could include renewable materials, bio-based insulation, or recycled materials. In 2018 in the United States, 5% of total insulation area in new single-family homes was insulated with cellulose (Insulation Choices Revealed in New Study, 2019).

To convert estimated cellulose adoption percentage into annual insulation use, we estimated 26 Mt of all installed global insulation materials in 2023 based on a report from The Freedonia Group (2024). We calculated an annual use of approximately 1.7 billion insulation units of 100 m2 at a thermal resistance of 1 m2·K/W. Therefore, the median cellulose adoption is 140 million units/yr at 100 m2 at 1 m2·K/W, calculated from the median of the 2–13% adoption range. 

Since this calculation is based on more alternative materials than just cellulose and is heavily reliant on European data where we assume adoption is higher, this estimate of current adoption (Table 3) is most likely an overestimate.

The little adoption data that were considered in this section are mostly for Europe, and some for the United States. We recognize this limited geographic scope creates bias, and hope this work inspires research and data sharing on this topic in underrepresented regions.

left_text_column_width

Table 3. Current (2017–2022) adoption level.

Unit: units of insulation/yr installed to insulate 100 m2 to a thermal resistance of 1 m2·K/W

25th percentile 9000000
mean 130000000
median (50th percentile) 140000000
75th percentile 170000000
Left Text Column Width
Adoption Trend

Very few data are available that quantify adoption trends. In a regional study of several bio-based insulation materials, Rabbat et al. (2022) estimated French market annual growth rates of 4–10%, with cellulose estimated at 10%. Petcu et al. (2023) estimated the European adoption of recycled plastic and textile insulation, biomass fiber insulation, and waste-based insulation to have increased from 6% to 10% between 2012 and 2020.

When accounting for the calculated current adoption, these growth rates mean a median estimated annual increase of 500,000 insulation units/yr required to insulate 100 m2 to a thermal resistance of 1 m2·K/W. The increasing adoption of biobased insulation decreases the use of conventional insulation materials in those regions.

This adoption trend (Table 4) is likely an overestimate, as it is biased by high European market numbers and based on the likely high estimate we made for current adoption. 

left_text_column_width

Table 4. 2012–2020 adoption trend.

Unit: annual change in units of insulation/yr installed to insulate 100 m2 to a thermal resistance of 1 m2·K/W

25th percentile 500000
mean 800000
median (50th percentile) 500000
75th percentile 1300000
Left Text Column Width
Adoption Ceiling

No estimates have been found for the adoption ceiling of this solution, although we expect it to be high given low rates of current adoption and projected increases in building construction in the coming decades [International Energy Agency (IEA), International Renewable Energy Agency, & United Nations Climate Change High-Level Champions, 2023]. Two physical factors that could influence adoption are availability of alternative materials and thickness of insulation.

For cellulose insulation, availability does not seem to limit adoption. The Food and Agriculture Organization of the United Nations (2023) reports that there is a much higher annual production of cellulose-based materials (>300 Mt annually of cartonboard, newsprint, and recycled paper) than the overall demand for insulation globally (>25 Mt annual demand; Global Insulation Report, 2024). However, other uses for cellulose products may create competition for this supply.

Increased thickness of insulation could also be a limiting factor since this would reduce adoption by decreasing building square footage, in particular making retrofits more challenging and expensive. Deer et al. (2007) reported that the average cellulose thermal resistance is similar to mineral and glass wool, and lower than plastic insulations made of polystyrene and other foams. If we assume that 50% of plastic insulation cannot be replaced with cellulose due to thickness limitations, this would represent ~20% of current insulation that could not be replaced without structural changes to the building. Therefore, we calculate the adoption ceiling to be 80% of the current insulation that would be reasonably replaceable or 140 million units/yr required to insulate 100 m2 to a thermal resistance of 1 m2·K/W (Table 5).

Uptake of celllose insulation could also be limited by its susceptibility to absorbing moisture, limiting its use in wet climates or structures that retain moisture, such as flat roofs. Commercialization of alternative insulation materials beyond cellulose and in many different forms (e.g., board, loose-fill) will increase the adoption ceiling across more building types.

left_text_column_width

Table 5. Adoption ceiling.

Unit: units of insulation installed to insulate 100 m2 to a thermal resistance of 1 m2·K/W/yr.

25th percentile N/A
mean N/A
median (50th percentile) 140000000 (estimate)
75th percentile N/A
Left Text Column Width
Achievable Adoption

No estimates have been found for feasible global adoption of this solution. Rabbat et al. (2022) estimated the adoption levels of several bio-based insulation materials in France in 2050. For cellulose wadding, this was estimated to be 2.1 times the commercialized volume in France in 2020. Although we do not expect France to be representative of the rest of the world, if the predicted adoption trend holds across the world then we expect low adoption in 2050 to be 2.1 times greater than 2023 adoption. This is 29 million units/yr to insulate 100 m2 to a thermal resistance of 1 m2·K/W (Table 6).

The IEA (2023) claims that building envelopes need to have their retrofit rate increase by 2.5 times over the current rate in order to meet net zero targets (2023). This is a reasonable high-adoption scenario. Assuming that more retrofits of buildings occur and greater amounts of alternative insulation are installed in new buildings, we estimate that high future adoption of new insulation could occur at 2.5 times the rate of the low-adoption scenario. This is 73 million units/yr to insulate 100 m2 to a thermal resistance of 1 m2·K/W (Table 6).

Adoption will be facilitated or limited by local regulations around the world. Building codes will determine the location and extent of use of cellulose or other bio-based insulation. We expect uptake to be different between residential and commercial buildings, but due to insufficient data, we have grouped them in our adoption estimates.

left_text_column_width

Table 6. Range of achievable adoption levels.

Unit: units of insulation installed to insulate 100 m2 to a thermal resistance of 1 m2·K/W/yr

Current Adoption 14000000
Achievable – Low 29000000
Achievable – High 73000000
Adoption Ceiling 140000000
Left Text Column Width

The climate impacts for this solution are modest compared to current global GHG emissions. Not all conventional insulations have a high environmental impact due to the use of a wide range of materials, forms, and installation methods as well as the recent adoption of lower-GWP blowing agents. Therefore, the potential for further emissions savings is limited.

We quantified the effectiveness and adoption of cellulose insulation, which has the lowest emissions and, therefore, the highest climate impacts of the insulation materials we evaluated. With high adoption, 1.2 Gt CO₂‑eq on a 100-yr basis could be avoided over the next decade (Table 7).

While we only considered the adoption of cellulose insulation in this analysis, a realistic future for lowering the climate impact of insulation may include other bio-based materials, too. Utilizing a greater range of materials should increase adoption and climate impact due to more available forms, sources, and thermal resistance values of bio-based insulation.

Note that the current climate impact is calculated using a current materials baseline that includes a small fraction of cellulose. This means that the reported current adoption impact is a slight underestimate compared with the impacts for replacing entirely conventional insulation with the current amount of cellulose insulation in use.

left_text_column_width

Table 7. Climate impact at different levels of adoption.

Unit: Gt CO₂‑eq/yr, 100-yr basis

Current Adoption 0.022
Achievable – High 0.046
Achievable – Low 0.12
Achievable Ceiling 0.22
Left Text Column Width
Additional Benefits

Income and work

Some alternative insulations can be cheaper than conventional materials. Although there is large variation in evaluation methods and reported costs, our analysis found that cellulose and plant fibers are cheaper than conventional insulation materials such as stone wool, glass wool, and EPS (Figure 1). Depending on the applicable climate conditions and insulation form, switching to alternative insulation materials can result in cost savings for consumers, including homeowners and business owners.

Health

Conventional insulation materials may contribute to poor indoor air quality, especially during installation, and contribute to eye, skin, and lung irritation (Naldzhiev et al., 2020; Stamm et al., 2022; Wi et al., 2021). Additionally, off-gassing of flame retardants and other volatile organic compounds and by-products of conventional insulation can occur shortly after installation (Naldzhiev et al., 2020). Using bio-based alternative insulation products can minimize the health risks during and after installation (McGrath et al., 2023).

Water Resources

Although there is not a scientifically consistent approach to compare the environmental impacts of conventional and alternative insulation materials, a review analysis of 47 studies on insulation concluded that bio-based insulation materials generally have lower impacts as measured through acidificationeutrophication, and photochemical ozone creation potentials compared than do conventional materials (Füchsl et al., 2022). Other alternative materials such as wood fiber and miscanthus also tend to have a lower environmental footprint (Schulte et al., 2021). The water demand for wood and cellulose is significantly lower than that for EPS (about 2.8 and 20.8 l/kg respectively compared with 192.7 l/kg for EPS) (Zabalza Bribián et al., 2011). While the limited evidence suggests that the alternative material tends to be better environmentally, there is an urgent need to conduct life cycle assessments using a consistent approach to estimate the impact of these materials.

left_text_column_width
Risks

Cellulose insulation is susceptible to water absorption, which can lead to mold growth in wet or humid environments (Andersen & Rasmussen, 2025; Petcu et al., 2023). Mitigating this risk either requires an antifungal treatment for the material or limits adoption to particular climates. The thermal performance of cellulose insulation can decrease over time due to water absorption, settling, or temperature changes, but installing it as dense-packed or damp-spray can mitigate this (Wang & Wang, 2023; Wilson, 2021).

Bio-based insulation materials tend to be combustible, meaning they contribute more to the spread of a fire than non-combustible stone or glass insulation. Some bio-based materials are classified as having minimal contribution to a fire, such as some cellulose forms, rice husk, and flax (Kumar et al., 2020). These materials are less likely to contribute to a fire than very combustible plastic insulation such as EPS, XPS, and PUR. Fire codes – as well as other building and energy codes – could limit adoption, risking a lack of solution uptake due to regulatory setbacks (Northeast Bio-Based Materials Collective 2023 Summit Proceedings, 2023)

Additives such as fire retardants and anti-fungal agents are added to bio-based insulation along with synthetic binders, which can lead to indoor air pollution from organic compounds, although likely in low concentrations (Maskell et al., 2015; Rabbat et al., 2022).

left_text_column_width
Interactions with Other Solutions

Reinforcing

Upgrading insulation to lower-cost and lower-emitting alternative materials should increase the adoption of other building envelope solutions as they can be installed simultaneously to optimize cost and performance. 

left_text_column_width

Increasing the manufacturing of cellulose insulation, which contains large amounts of recycled paper, could increase the revenues for paper recycling.

left_text_column_width

Competing

The use of biomass as raw material for insulation will reduce the availability and increase the cost of using it for other applications. For cellulose, global production of cellulose materials (>300 Mt annually of cartonboard, newsprint, and recycled paper (Forestry Production and Trade, 2023)) is an order of magnitude higher than the demand for insulation materials (>25 Mt annual demand (The Freedonia Group, 2024)), so the overall impact should be small.

left_text_column_width

Reducing the demand for conventional insulation products and instead making insulation that produces fewer GHGs during manufacturing would slightly reduce the global climate impact of other industrial manufacturing solutions. This is because less energy overall would be used for manufacturing, and therefore other technologies for emissions reductions would be less impactful for insulation production.

left_text_column_width
Dashboard

Solution Basics

(insulation units of 100 m2 and 1 m2·K/W)/yr

tCO2-eq/unit
1.59
units
Current 1.4×10⁷2.9×10⁷7.3×10⁷
Achievable (Low to High)

Climate Impact

GtCO2-eq/yr
Current 0.02 0.050.12
US$ per tCO2-eq
-121
Emergency Brake

CO₂, F-gas

Trade-offs

Bio-based insulation materials including cellulose often have lower thermal resistance than some conventional insulation materials. In particular, bio-based materials may require a thicker layer than plastic insulation to reach the same insulating performance (Esau et al., 2021; Rabbat et al., 2022). Usable floor area within a building would need to be sacrificed to accommodate thicker insulation, which would potentially depreciate the structure or impact the aesthetic value (Jelle, 2011). This would be a more significant trade-off for retrofit construction and buildings in densely developed urban areas.

Sourcing bio-based materials has environmental trade-offs that come from cultivating biomass, such as increased land use, fertilizer production, and pesticide application (Schulte et al., 2021). Using waste or recycled materials could minimize these impacts. Binders and flame-retardants may also be required in the final product, leading to more processing and material use (Sustainable Traditional Buildings Alliance, 2024).

left_text_column_width
Geographic Guidance Introduction

The effectiveness of deploying alternative insulation is not inherently dependent on geographic factors since it addresses emissions embodied in the manufacture and deployment of insulation materials. However, due to a lack of related data, we assumed a consistent global breakdown of currently used insulation materials when in reality, the exact mix of insulation currently used in different geographic locations will affect the emissions impact of switching to alternative materials.

Building insulation is used in higher quantities in cold or hot climates, so deploying alternative insulation is more likely to be relevant and adopted in such climates. Other geographic factors also impact adoption: Areas with higher rates of new construction will be better able to design for cellulose or other alternative insulation materials, and drier climates will face a lower risk of mold growth on these materials. Local building codes, including fire codes, can also affect the adoption of alternative materials.

There are no maps for the Alternative Insulation solution. It is intended to address emissions embodied in the manufacture and deployment of insulation materials and has no intrinsic dependence on geographic factors.

Action Word
Deploy
Solution Title
Alternative Insulation Materials
Classification
Highly Recommended
Nonprofit Leaders
  • Advocate for financial incentives, improved building and fire codes, and educational programs for alternative insulation.
  • Conduct research to improve alternative insulation materials’ manufacturing, adoption, supply chain access, and circularity.
  • Offer educational resources, one-stop shops for retrofitting and weatherization, installation demonstrations, and tours of model builds for commercial and private developers, highlighting the cost savings and environmental benefits of alternative insulation.
  • Create, join, or administer green building certification schemes and/or public-private partnerships that offer information, training, and general support for alternative insulation.

Further information:

Philanthropists and International Aid Agencies
  • Finance only new construction and retrofits that utilize alternative insulation and other low-carbon practices.
  • Offer grants for developers utilizing alternative insulation and other climate-friendly practices.
  • Create financing programs for private construction in low-income or under-resourced communities.
  • Create new contractual terms that require embodied emissions data from materials and methods.
  • Advocate for financial incentives, improved building and fire codes, and educational programs for alternative insulation.
  • Fund research to improve alternative insulation materials’ manufacturing, adoption, supply chain access, and circularity.
  • Offer educational resources, one-stop shops for retrofitting and weatherization, installation demonstrations, and tours of model builds for commercial and private developers, highlighting the cost savings and environmental benefits of alternative insulation.
  • Create or join green building certification schemes and/or public-private partnerships that offer information, training, and general support for alternative insulation.

Further information:

Technologists and Researchers
  • Develop and improve existing alternative insulation materials or innovate new materials with enhanced insulation performance.
  • Investigate ways to increase the durability of alternative insulation, such as resistance to moisture, pests, and fire.
  • Find uses for recycled materials in alternative insulation and ways to improve the circular economy.
  • Innovate new manufacturing methods that reduce electricity use and emissions.
  • Design new application systems for alternative insulation that can be done without much additional training or licensing/certification.
  • Create new methods of disposal for conventional insulation during demolitions.
  • Research adoption rates of alternative insulation materials across regions and environments.

Further information:

Communities, Households, and Individuals
  • Finance or develop only new construction and retrofits that utilize alternative insulation and other low-carbon practices.
  • Take advantage of financial incentives such as subsidies, tax credits, and grants for installing alternative insulation.
  • Whenever possible, install insulation that does not use F-gas blowing agents.
  • Advocate for financial incentives, improved building and fire codes, and educational programs for alternative insulation.
  • Conduct local research to improve alternative insulation materials’ manufacturing, adoption, supply chain access, and circularity.
  • Organize local “green home tours” and open houses to showcase climate-friendly builds and foster demand by highlighting cost savings and environmental benefits of alternative insulation.
  • Create or join green building certification schemes, green building councils, and/or public-private partnerships that offer information, training, and general support for alternative insulation.
  • Capture community feedback and share it with local policymakers to address barriers such as permitting logistics or upfront costs, helping to share policies that drive adoption.

Further information:

Sources
Evidence Base

Consensus of effectiveness in reducing building sector emissions: Mixed

There is scientific consensus that using building insulation with lower embodied emissions will reduce GHG emissions, but expert opinions about the magnitude of possible emissions reductions as well as the accuracy of determining these reductions are mixed. 

Biswas et al. (2016) determined that, for insulation, avoided emissions from reduced heating and cooling energy tend to outweigh the embodied emissions. However, others emphasize that as buildings become more energy-efficient, material embodied emissions become a larger factor in their carbon footprint (Cabeza et al., 2021; Grazieschi et al., 2021). Embodied emissions from insulation can be substantial: Esau et al. (2021) analyzed a mixed-use multifamily building and found that selecting low-embodied-carbon insulation could reduce building embodied emissions by 16% at no cost premium.

Multiple studies have found that some sustainable insulation materials have lower manufacturing emissions than traditional insulation materials (Asdrubali et al., 2015; Füchsl et al., 2022; Kumar et al., 2020; Schiavoni et al., 2016). However, researchers have highlighted the difficulty in evaluating environmental performance of different insulation materials (Cabeza et al., 2021; Grazieschi et al., 2021). Gelowitz and McArthur (2017) found that construction product Environmental Product Declarations contain many errors and discrepancies due to self-contradictory or missing data. Füschl et al. (2022) conducted a meta-analysis and cautioned that “it does not appear that a definitive ranking [of insulation materials] can be drawn from the literature.” In our analysis, we attempt to compare climate impact between materials but acknowledge that this can come from flawed and inconsistent data.

Despite the difficulties in comparing materials, there is high consensus that cellulose is a strong low-emissions insulation option due to its low embodied carbon, high recycled content, and good thermal insulating performance (Wilson, 2021).

The results presented in this document summarize findings from four reviews and meta-analyses, 14 original studies, three reports, 27 Environmental Product Declarations, and two commercial websites reflecting current evidence from eight countries as well as data representing global, North American, or European insulation materials. We recognize this limited geographic scope creates bias, and hope this work inspires research and data sharing on this topic in underrepresented regions.

left_text_column_width
Updated Date
Subscribe to Water resources