Deploy Bioplastics

Image
Image
Colorful smoothies in plastic cups with label 100% biodegradable
Coming Soon
Off
Summary

Bioplastics are renewable, plant-based alternatives to conventional plastics that can reduce emissions by replacing fossil-based feedstocks with biogenic carbon feedstocks. These feedstocks are biomass materials that absorb atmospheric CO₂ during growth and serve as the carbon source for plastic production. The chemical and biological properties of bioplastics are well understood, commercially validated, and can reduce emissions when produced sustainably and managed properly at their end-of-life. Benefits include reducing fossil fuel reliance, alleviating plastic pollution, and, in targeted uses, supporting circularity. However, these are counterbalanced by their inconsistent emissions savings, high costs, and scalability constraints. We conclude that deploying bioplastics as plastic alternatives is “Worth Watching” as a climate solution, but would require changes in feedstock and appropriate end-of-life infrastructure to be implemented with reliable emissions reductions.

Page Description for Social
Our mission is to help the world reach “Drawdown" as quickly, safely, and equitably as possible.
Overview

What is our assessment?

Based on our analysis, the widespread use of bioplastics is challenged by their potential ecological risks and currently high costs. While bioplastics offer some environmental benefits in niche applications, their climate impact is inconsistent and hinges on feedstock type, manufacturing practices, and waste management. Therefore, we conclude that Deploy Bioplastics is “Worth Watching.”

Plausible Could it work? Yes
Ready Is it ready? Yes
Evidence Are there data to evaluate it? Yes
Effective Does it consistently work? No
Impact Is it big enough to matter? No
Risk Is it risky or harmful? ?
Cost Is it cheap? No

What is it?

Bioplastics (also called biopolymers) are plastic alternatives made from renewable biological sources, such as corn, sugarcane, crop residues, or other plants, instead of fossil fuels. Bioplastics are produced by extracting sugars or starches from plants and converting them through chemical or biological processes into chemical building blocks that form the basic structure of plastics. Because plants absorb atmospheric CO₂ through photosynthesis, the carbon stored in bioplastics is considered biogenic, as it is already part of the natural carbon cycle. In contrast, petrochemical plastics are made by extracting and refining oil or natural gas, which releases new (formerly buried) carbon into the atmosphere. Bioplastics cut emissions by replacing fossil carbon feedstocks with biomass-based feedstocks. Some bioplastics are durable, non-biodegradable, chemically identical to traditional plastics (i.e., “drop-in” bioplastics), and recyclable. Others are biodegradable and can be designed to break down in compost. Emissions from bioplastics come from growing and processing biomass (which requires energy and land use), manufacturing the plastics, and managing their end-of-life waste. Bioplastics can achieve climate benefits when the emissions from production and end-of-life are kept low enough to realize the advantages of biogenic carbon.

Does it work?

The basic idea of bioplastics is scientifically and chemically sound, with their gradual development and commercialization ongoing since the 1990s. Numerous studies support the effectiveness of bioplastics in reducing atmospheric CO₂ emissions from feedstock production and manufacturing stages compared to fossil-based plastics, particularly when made from sustainably sourced biomass under energy-efficient conditions and properly composted or recycled. However, other studies show bioplastics have inconsistent emissions reduction performance. Global adoption also remains limited, representing only about 0.5% of total plastics production (approximately 2–2.5 million tons (Mt) out of 414 Mt, according to the organization European Bioplastics). 

Why are we excited?

Bioplastics, particularly biologically derived and biodegradable polymers, have functional advantages in reducing fossil fuel dependence and mitigating plastic pollution. By sourcing raw materials from renewable biomass instead of petroleum (e.g., oil, natural gas), bioplastics can lower CO₂ emissions in the production stage, especially when accounting for biogenic carbon uptake during plant cultivation. Some types of bioplastics are interchangeable with traditional plastics and can be produced with existing plastic manufacturing systems, easing the transition. Compostable plastics simplify disposal in applications where contamination with food or organic waste occurs, enabling organic recycling and returning carbon and other nutrients to soil. Biodegradable bioplastics are also advantageous for products that are often discarded and may leak into the environment. Studies show that two widely used commercial bioplastics, polylactic acid (PLA) and polyhydroxybutyrate (PHB), biodegrade 60–80% in composting conditions within 28–30 days, while cellulose-based and starch-based plastics can fully degrade in soil and marine environments in 180 days and 50 days, respectively. These functional benefits, combined with potential additional benefits, such as soil enrichment and waste stream simplification, make bioplastics appealing in specific, targeted use cases. More broadly, they can significantly contribute to emissions reduction efforts in materials production when designed for circularity and supported by infrastructure that facilitates appropriate end-of-life waste treatment. 

Why are we concerned?

Despite their promise, bioplastics have several limitations as a viable climate solution, including relatively low emissions reduction potential and possible risks and adverse impacts from their large-scale deployment. Current production is low. To reach a meaningful 20–30% marketplace share by 2040, bioplastics would need to expand manufacturing by approximately 30% per year, nearly double the current pace. This could put pressure on land and food systems, since current bioplastics rely on food-based crops for industrial-level production. This raises sustainability concerns around food security and could potentially drive unintended land-use changes such as deforestation or cropland conversion. Furthermore, the effectiveness of reducing emissions by replacing conventional plastics with bioplastics is low and inconsistent. Some bioplastics produce more life cycle emissions than conventional plastics. The likely climate impact of replacing 20–30% of traditional plastics with bioplastics is <0.1 Gt CO₂‑eq/yr. End-of-life treatment is also a major challenge. Many bioplastics are incompatible with home composting and current recycling streams, and improperly composted or landfilled biodegradable bioplastics can emit methane. Finally, bioplastics remain 2–3 times more expensive than conventional plastics.

Solution in Action
References

Barbu, B. (2024). Can biodegradable polymers make microplastics? C&EN Global Enterprise, 102(37), 21–22. https://doi.org/10.1021/cen-10237-cover4‌ 

Bauer, F., Nielsen, T. D., Nilsson, L. J., Palm, E., Ericsson, K., Fråne, A., & Cullen, J. (2022). Plastics and climate change—Breaking carbon lock-ins through three mitigation pathways. One Earth, 5(4), 361–376.‌

Benavides, P. T., Lee, U., & Zarè-Mehrjerdi, O. (2020). Life cycle greenhouse gas emissions and energy use of polylactic acid, bio-derived polyethylene, and fossil-derived polyethylene. Journal of Cleaner Production, 277(124010), 124010. https://doi.org/10.1016/j.jclepro.2020.124010 

Bishop, G., Styles, D., & Lens, P. N. L. (2022). Land-use change and valorisation of feedstock side-streams determine the climate mitigation potential of bioplastics. Resources, Conservation and Recycling, 180, 106185. https://doi.org/10.1016/j.resconrec.2022.106185‌ 

Chen, G., Li, J., Sun, Y., Wang, Z., Leeke, G. A., Moretti, C., Cheng, Z., Wang, Y., Li, N., Mu, L., Li, J., Tao, J., Yan, B., & Hou, L. (2024). Replacing Traditional Plastics with Biodegradable Plastics: Impact on Carbon Emissions. Engineering, 32. 
https://doi.org/10.1016/j.eng.2023.10.002 

Cotterill, M. (2020, August 5). Bioplastics: Don’t let the label fool you. Canadian Geographic.
https://canadiangeographic.ca/articles/bioplastics-dont-let-the-label-fool-you/ 

Di Bartolo, A., Infurna, G., & Dintcheva, N. T. (2021). A Review of Bioplastics and Their Adoption in the Circular Economy. Polymers, 13(8), 1229. https://doi.org/10.3390/polym13081229 

Dokl, M., Copot, A., Krajnc, D., Fan, Y. V., Vujanović, A., Aviso, K. B., Tan, R. R., Kravanja, Z., & Čuček, L. (2024). Global projections of plastic use, end-of-life fate and potential changes in consumption, reduction, recycling and replacement with bioplastics to 2050. Sustainable Production and Consumption, 51, 498–518. https://doi.org/10.1016/j.spc.2024.09.025 

Escobar, N., & Britz, W. (2021). Metrics on the sustainability of region-specific bioplastics production, considering global land use change effects. Resources, Conservation and Recycling, 167, 105345. https://doi.org/10.1016/j.resconrec.2020.105345 

‌‌European Bioplastics. (2023). Bioplastics market development update 2023. European Bioplastics E.V. https://docs.european-bioplastics.org/publications/market_data/2023/EUBP_Market_Data_Report_2023.pdf 

‌‌European Bioplastics. (2024). Bioplastics market development update 2024. European Bioplastics E.V. https://www.european-bioplastics.org/market/ 

Ferreira-Filipe, D. A., Paço, A., Duarte, A. C., Rocha-Santos, T., & Patrício Silva, A. L. (2021). Are Biobased Plastics Green Alternatives?—A Critical Review. International Journal of Environmental Research and Public Health, 18(15), 7729. https://doi.org/10.3390/ijerph18157729 

Helm, L. T., Venier-Cambron, C., & Verburg, P. H. (2025). The potential land-use impacts of bio-based plastics and plastic alternatives. Nature Sustainability. https://doi.org/10.1038/s41893-024-01492-7 

Islam, M., Xayachak, T., Haque, N., Lau, D., Bhuiyan, M., & Pramanik, B. K. (2024). Impact of bioplastics on environment from its production to end-of-life. Process Safety and Environmental Protection, 188, 151–166. https://doi.org/10.1016/j.psep.2024.05.113‌ 

Ita-Nagy, D., Vázquez-Rowe, I., Kahhat, R., Chinga-Carrasco, G., & Quispe, I. (2020). Reviewing environmental life cycle impacts of biobased polymers: current trends and methodological challenges. The International Journal of Life Cycle Assessment, 25(11), 2169–2189. https://doi.org/10.1007/s11367-020-01829-2‌ 

Karali, N., Khanna, N., & Shah, N. (2024, April 12). Climate Impact of Primary Plastic Production [Review of Climate Impact of Primary Plastic Production]. Lawrence Berkeley National Laboratory. https://escholarship.org/uc/item/6cc1g99q‌ 

Meng, F., Brandão, M., & Cullen, J. M. (2024). Replacing Plastics with Alternatives Is Worse for Greenhouse Gas Emissions in Most Cases. Environmental Science & Technology, 58(6). https://doi.org/10.1021/acs.est.3c05191‌ 

Patria, R. D., Rehman, S., Yuen, C. W. M., Lee, D.-J., Vuppaladadiyam, A. K., & Leu, S. (2024). Energy-environment-economic (3E) hub for sustainable plastic management – Upgraded recycling, chemical valorization, and bioplastics. Applied Energy, 357, 122543–122543. https://doi.org/10.1016/j.apenergy.2023.122543‌ 

Piemonte, V., & Gironi, F. (2010). Land-use change emissions: How green are the bioplastics? Environmental Progress & Sustainable Energy, 30(4), 685–691. https://doi.org/10.1002/ep.10518 

Plastics Europe. (2024, November 18). Plastics – the fast Facts 2024 • Plastics Europe. Plastics Europe. https://plasticseurope.org/knowledge-hub/plastics-the-fast-facts-2024/ 

Rosenboom, J.-G., Langer, R., & Traverso, G. (2022). Bioplastics for a Circular Economy. Nature Reviews Materials, 7(117–137), 1–21. https://doi.org/10.1038/s41578-021-00407-8 

‌The multifaceted challenges of bioplastics. (2024). Nature Reviews Bioengineering, 2(4), 279–279. https://doi.org/10.1038/s44222-024-00181-6 

Vanderreydt, I., Rommens, T., Tenhunen, A., Mortensen, L. F., & Tange, I. (2021, May). Greenhouse gas emissions and natural capital implications of plastics (including biobased plastics). Eionet Portal; European Environment Agency (EEA) European Topic Centre on Waste and Materials in a Green Economy. 
https://www.eionet.europa.eu/etcs/etc-wmge/products/etc-wmge-reports/greenhouse-gas-emissions-and-natural-capital-implications-of-plastics-including-biobased-plastics 

‌Walker, S., & Rothman, R. (2020). Life cycle assessment of bio-based and fossil-based plastic: A review. Journal of Cleaner Production, 261, 121158. https://doi.org/10.1016/j.jclepro.2020.121158 

Zhao, X., Cornish, K., & Vodovotz, Y. (2020). Narrowing the gap for bioplastic use in food packaging-an update. Environmental Science & Technology, 54(8). https://doi.org/10.1021/acs.est.9b03755 

‌Zhao, X., Wang, Y., Chen, X., Yu, X., Li, W., Zhang, S., Meng, X., Zhao, Z.-M., Dong, T., Anderson, A., Aiyedun, A., Li, Y., Webb, E., Wu, Z., Kunc, V., Ragauskas, A., Ozcan, S., & Zhu, H. (2023). Sustainable bioplastics derived from renewable natural resources for food packaging. Matter, 6(1), 97–127. https://doi.org/10.1016/j.matt.2022.11.006 

Credits

Lead Fellow

  • Nina-Francesca Farac

Contributors

  • Amanda Smith
  • Sarah Gleeson

Internal Reviewer

  • Christina Swanson
Speed of Action
left_text_column_width
Caveats
left_text_column_width
Additional Benefits
left_text_column_width
Risks
left_text_column_width
Consensus
left_text_column_width
Trade-offs
left_text_column_width
Action Word
Deploy
Solution Title
Bioplastics
Classification
Watching
Updated Date

Deploy Alternative Insulation Materials

Image
Image
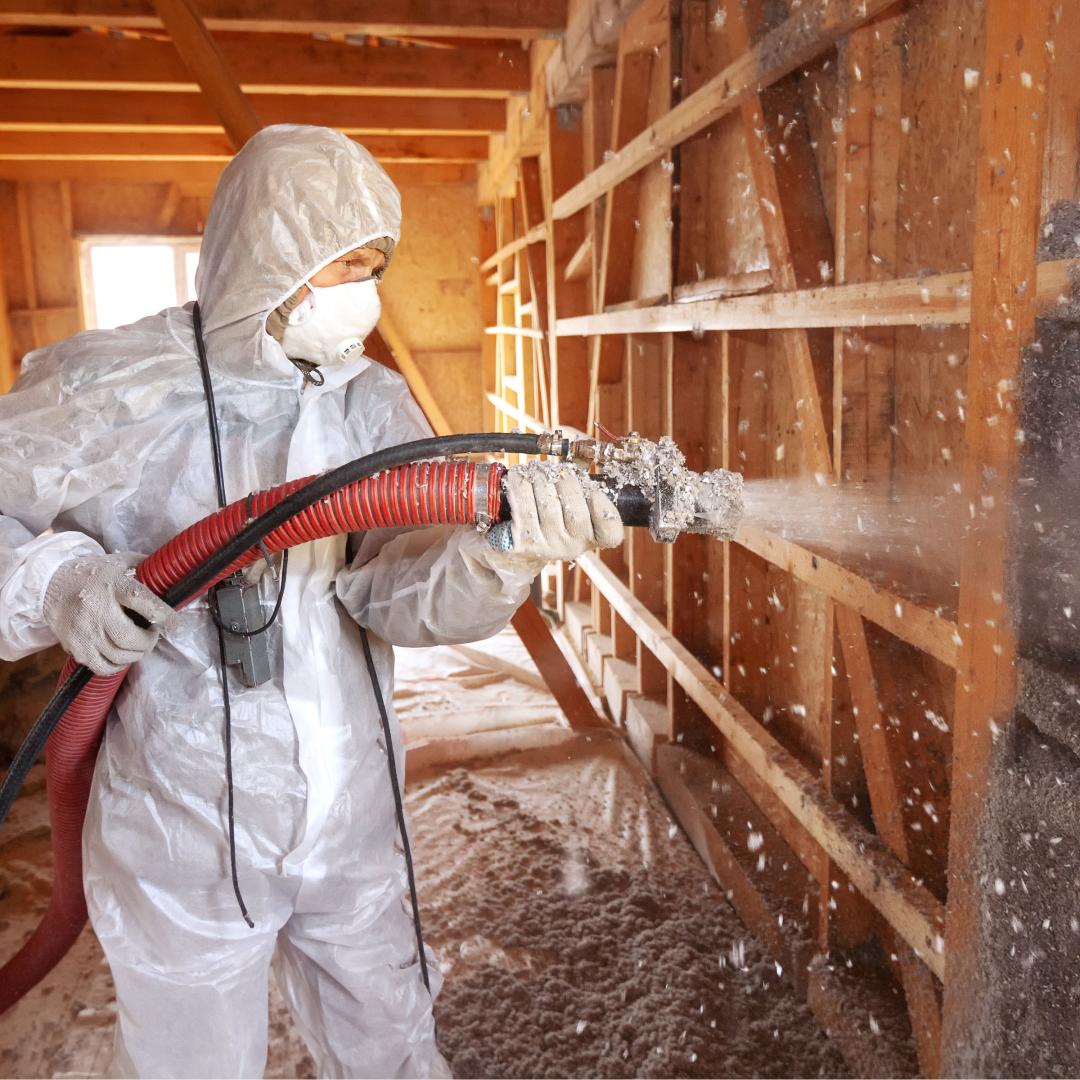
Worker sprays insulation in building frame.
Coming Soon
Off
Summary

Deploy Alternative Insulation Materials is defined as using alternative building insulation materials in place of conventional ones. In particular, we highlight the impact of using cellulose instead of glass, mineral, or plastic insulation in new and retrofit buildings. Cellulose insulation manufacture and installation emits fewer GHGs to reach the same operational insulating performance than does manufacture and installation of conventional materials.

Overview

Thermal insulation materials are used in the walls, roofs, and floors of buildings to help maintain comfortable indoor temperatures. However, manufacture and installation of insulation materials produces GHG emissions. These are called embodied emissions because they occur before the insulation is used in buildings. Insulation embodied emissions offset a portion of the positive climate impacts from using insulation to reduce heating and cooling demand. A Canadian study found that over 25% of residential embodied emissions from manufacturing building materials can be due to insulation (Magwood et al., 2022). Using cellulose insulation made primarily from recycled paper avoids some embodied emissions associated with conventional insulation.

Insulation is manufactured in many different forms, including continuous blankets or boards, loose fill, and sprayed foam (Types of Insulation, n.d.). Most conventional insulation materials are nonrenewable inorganic materials such as stone wool and fiberglass. These require high temperatures (>1,300 °C) to melt the raw ingredients, consuming thermal energy and releasing CO₂ from fossil fuel combustion or grid power generation (Schiavoni et al., 2016). Other common insulations are plastics, including expanded polystyrene (EPS), extruded polystyrene (XPS), polyurethane (PUR), and polyisocyanurate (PIR). Producing these plastics requires the extraction of fossil fuels – primarily petroleum – for feedstocks, as well as high amounts of energy for processing (Harvey, 2007)

F-gases are often used as blowing agents to manufacture rigid foam board insulation or install sprayed foam insulation (Figure 1). F-gases are GHGs with GWPs that can be hundreds or thousands of times higher than CO₂. High-GWP F-gases used in foam production are released into the atmosphere during all subsequent stages of the foam’s life cycle (Biswas et al., 2016; Waldman et al., 2023). The climate benefits of this solution during the installation stage are primarily due to avoiding these blowing agents. 

Alternative insulation is produced from plant or animal biomass (bio-based materials, see Figure 2) or waste products (recycled materials). Alternative insulation materials provide climate benefits by consuming less manufacturing energy, using renewable materials in place of fossil fuels, and eliminating high-GWP blowing agents (Sustainable Traditional Buildings Alliance, 2024)

Figure 3 compares a variety of conventional and alternative insulation materials. While many bio-based and recycled materials could be used as alternatives to these conventional materials, this solution focuses on cellulose due to its effectiveness in avoiding emissions, low cost, and wide availability. Cellulose insulation is made primarily from recycled paper fibers, newsprint, and cardboard. These products are made into fibers and blended with fire retardants to produce loose or batt cellulose insulation (Figure 4) (Waldman et al., 2023; Wilson, 2021).

Figure 1. Properties and adoption of conventional and alternative insulation materials. Costs and emissions will vary from the values here depending on the insulation form (board, blanket, loose-fill, etc.).

Category Material High-GWP F-gases used? Median manufacturing and installation emissions* Mean product and installation cost** Estimated market share
(% by mass)
Conventional materials Stone wool No 0.31 623 20
Glass wool (fiberglass) No 0.29 508 34
EPS No 0.38 678 22
XPS Yes, sometimes 9.44 702 7
PUR/PIR Yes, sometimes 6.14 1,000 11
Alternative materials Cellulose No 0.05 441 2–13
Cork No 0.30 1,520 Commercially available, not widely used
Wood fiber No 0.13 814 Commercially available, not widely used
Plant fibers (kenaf, hemp, jute) No 0.18 467 Commercially available, not widely used
Sheep’s wool No 0.14 800 Commercially available, not widely used
Recycled PET plastic No 0.12 2,950 Commercially available, not widely used

*t CO₂‑eq (100-yr) to insulate 100m² to 1m²·K/W

**2023 US$ to insulate 100m² to 1m²·K/W. We use mean values for cost analysis to better capture the limited data and wide range of reported costs.

Although we are estimating the impact of using cellulose insulation in all buildings, the unique circumstances of each building are important when choosing the most appropriate insulation material. In this solution, we don’t distinguish between residential and commercial buildings, retrofit or new construction, different building codes, or different climates, but these would be important areas of future study.

In this solution, the effectiveness, cost, and adoption are calculated over a specified area (100 m2) and thermal resistance (1 m2·K/W). The chosen adoption unit ensures that all data are for materials with the same insulating performance. Due to limited material information, we assumed that insulation mass scales linearly with thermal resistance.

To better understand the adoption unit, a one-story residential building of 130 m2 floor area would require approximately 370 m2 of insulation area (RSMeans from The Gordian Group, 2023). For a cold climate like Helsinki, Finland, code requires insulation thermal resistance of 11 m2·K/W (The World Bank, n.d.). For a warm climate like Jerusalem, Israel, envelope thermal resistance requirements average 1.1 m2·K/W (The World Bank, n.d.). Therefore, depending on the location, anywhere from approximately 4–40 adoption units insulating 100 m2 to 1 m2·K/W may be needed to insulate a small single-story home to the appropriate area and insulation level.

Take Action Intro

Would you like to help deploy alternative insulation? Below are some ways you can make a difference, depending on the roles you play in your professional or personal life.

These actions are meant to be starting points for involvement and may or may not be the most important, impactful, or doable actions you can take. We encourage you to explore, get creative, and take a step that is right for you!

References

Adams, M., Burrows, V., & Richardson, S. (2019). Bringing embodied carbon upfront: Coordinated action for the building and construction sector to tackle embodied carbon. World Green Building Council, Advancing Net Zero, Ramboll, & C40 Cities. https://worldgbc.s3.eu-west-2.amazonaws.com/wp-content/uploads/2022/09/22123951/WorldGBC_Bringing_Embodied_Carbon_Upfront.pdf

Amendment to the Montreal Protocol on Substances that Deplete the Ozone Layer. (2016, October 15). https://treaties.un.org/doc/Treaties/2016/10/20161015%2003-23%20PM/Ch_XXVII-2.f-English%20and%20French.pdf

Andersen, B., & Rasmussen, T. V. (2025). Biobased building materials: Moisture characteristics and fungal susceptibility. Building and Environment, 112720. https://doi.org/10.1016/j.buildenv.2025.112720

Asdrubali, F., D’Alessandro, F., & Schiavoni, S. (2015). A review of unconventional sustainable building insulation materials. Sustainable Materials and Technologies4, 1–17. https://doi.org/10.1016/j.susmat.2015.05.002

Biswas, K., Shrestha, S. S., Bhandari, M. S., & Desjarlais, A. O. (2016). Insulation materials for commercial buildings in North America: An assessment of lifetime energy and environmental impacts. Energy and Buildings112, 256–269. https://doi.org/10.1016/j.enbuild.2015.12.013

Cabeza, L. F., Boquera, L., Chàfer, M., & Vérez, D. (2021). Embodied energy and embodied carbon of structural building materials: Worldwide progress and barriers through literature map analysis. Energy and Buildings231, 110612. https://doi.org/10.1016/j.enbuild.2020.110612

Carbon Removals Expert Group Technical Assistance. (2023, December). Review of certification methodologies for long-term biogenic carbon storage in buildings. European Commission. https://climate.ec.europa.eu/system/files/2023-12/policy_carbon_expert_biogenic_carbon_storage_in_buildings_en.pdf

Deer, C., George, M., Kaluza, P., Loudon, Moore, G., Musick, M., Musick, R., Seifert, R., & Woodward, J. (2007). Alaska Residential Building Manual. Alaska Housing Finance Corporation. https://www.ahfc.us/application/files/2813/5716/1325/building_manual.pdf

Esau, R., Jungclaus, M., Olgyay, V., & Rempher, A. (2021). Reducing Embodied Carbon in Buildings: Low-Cost, High-Value Opportunities. RMI. http://www.rmi.org/insight/reducing-embodied-carbon-in-buildings

Fabbri, M., Rapf, O., Kockat, J., Fernández Álvarez, X., Jankovic, I., & Sibileau, H. (2022). Putting a stop to energy waste: How building insulation can reduce fossil fuel imports and boost EU energy security. Buildings Performance Institute Europe. https://www.bpie.eu/wp-content/uploads/2022/05/Putting-a-stop-to-energy-waste_Final.pdf

Forestry Production and Trade. (2023). [Dataset]. FAOSTAT. https://www.fao.org/faostat/en/#data/FO

Füchsl, S., Rheude, F., & Röder, H. (2022). Life cycle assessment (LCA) of thermal insulation materials: A critical review. Cleaner Materials5, 100119. https://doi.org/10.1016/j.clema.2022.100119

Gelowitz, M. D. C., & McArthur, J. J. (2017). Comparison of type III environmental product declarations for construction products: Material sourcing and harmonization evaluation. Journal of Cleaner Production157, 125–133. https://doi.org/10.1016/j.jclepro.2017.04.133

Global Alliance for Buildings and Construction, International Energy Agency, and the United Nations Environment Programme. (2020). GlobalABC Roadmap for Buildings and Construction: Towards a zero-emission, efficient and resilient buildings and construction sector. International Energy Agency. https://www.iea.org/reports/globalabc-roadmap-for-buildings-and-construction-2020-2050

Grazieschi, G., Asdrubali, F., & Thomas, G. (2021). Embodied energy and carbon of building insulating materials: A critical review. Cleaner Environmental Systems2, 100032. https://doi.org/10.1016/j.cesys.2021.100032

Harvey, L. D. D. (2007). Net climatic impact of solid foam insulation produced with halocarbon and non-halocarbon blowing agents. Building and Environment42(8), 2860–2879. https://doi.org/10.1016/j.buildenv.2006.10.028

Installed Cost of Residential Siding Comparative Study. (2023). RSMeans / The Gordian Group. https://www.gobrick.com/content/userfiles/files/RSMeans%20Residential%20Siding%20Comparative%20Cost%20Wall%20System%20Study%20Final%202023-09-15.pdf

Insulation Choices Revealed in New Study. (2019, June 19). Home Innovation Research Labs. https://www.homeinnovation.com/trends_and_reports/trends/insulation_choices_revealed_in_new_study

International Energy Agency. (2023). Building envelopes. https://www.iea.org/energy-system/buildings/building-envelopes

International Energy Agency, International Renewable Energy Agency, & United Nations Climate Change High-Level Champions. (2023). Breakthrough agenda report 2023. https://www.iea.org/reports/breakthrough-agenda-report-2023

Jelle, B. P. (2011). Traditional, state-of-the-art and future thermal building insulation materials and solutions – Properties, requirements and possibilities. Energy and Buildings43(10), 2549–2563. https://doi.org/10.1016/j.enbuild.2011.05.015

Kumar, D., Alam, M., Zou, P. X. W., Sanjayan, J. G., & Memon, R. A. (2020). Comparative analysis of building insulation material properties and performance. Renewable and Sustainable Energy Reviews131, 110038. https://doi.org/10.1016/j.rser.2020.110038

Magwood, C., Bowden, E., & Trottier, M. (2022). Emissions of Materials Benchmark Assessment for Residential Construction Report. Passive Buildings Canada and Builders for Climate Action.

Malhotra, A., & Schmidt, T. S. (2020). Accelerating Low-Carbon Innovation. Joule4(11), 2259–2267. https://doi.org/10.1016/j.joule.2020.09.004

Mályusz, L., & Pém, A. (2013). Prediction of the learning curve in roof insulation. Automation in Construction36, 191–195. https://doi.org/10.1016/j.autcon.2013.04.004

Mapping energy efficiency: A global dataset on building code effectiveness and compliance: Country profiles. (n.d.). [Dataset]. The World Bank. https://www.worldbank.org/content/dam/sites/buildinggreen/doc/building_green_country_profile.pdf

Maskell, D., Da Silva, C., Mower, K., Rana, C., Dengel, A., Ball, R., Ansell, M., Walker, P., & Shea, A. (2015, June 22). Properties of bio-based insulation materials and their potential impact on indoor air quality. First International Conference on Bio-based Building Materials, Clermont-Ferrand, France.

McGrath, T., Seigel, K., & Dickinson, M. (2023). Embodied Carbon and Material Health in Insulation. Healthy Building Network, Perkins&Will. https://habitablefuture.org/wp-content/uploads/2024/03/96-Carbon-Health-Insulation.pdf

Naldzhiev, D., Mumovic, D., & Strlic, M. (2020). Polyurethane insulation and household products – A systematic review of their impact on indoor environmental quality. Building and Environment169, 106559. https://doi.org/10.1016/j.buildenv.2019.106559

Northeast Bio-based Materials Collective 2023 summit proceedings. (2023). https://massdesigngroup.org/sites/default/files/file/2024/Northeast%20Bio-Based%20Materials%20Collective%202023%20Summit%20Proceedings.pdf

Petcu, C., Hegyi, A., Stoian, V., Dragomir, C. S., Ciobanu, A. A., Lăzărescu, A.-V., & Florean, C. (2023). Research on Thermal Insulation Performance and Impact on Indoor Air Quality of Cellulose-Based Thermal Insulation Materials. Materials16(15), Article 15. https://doi.org/10.3390/ma16155458

Rabbat, C., Awad, S., Villot, A., Rollet, D., & Andrès, Y. (2022). Sustainability of biomass-based insulation materials in buildings: Current status in France, end-of-life projections and energy recovery potentials. Renewable and Sustainable Energy Reviews156, 111962. https://doi.org/10.1016/j.rser.2021.111962

Riverse. (2024, August). Methodology: Biobased construction materials. https://www.riverse.io/methodologies/biobased-construction-materials

RSMeans from The Gordian Group. (2023). Installed Cost of Residential Siding Comparative Study. https://www.gobrick.com/content/userfiles/files/RSMeans%20Residential%20Siding%20Comparative%20Cost%20Wall%20System%20Study%20Final%202023-09-15.pdf

SaravanaPrabhu, G., & Vidjeapriya, R. (2021). Comparative Analysis of Learning Curve Models on Construction Productivity of Diaphragm Wall and Pile. IOP Conference Series: Materials Science and Engineering1197(1), 012004. https://doi.org/10.1088/1757-899X/1197/1/012004

Schiavoni, S., D׳Alessandro, F., Bianchi, F., & Asdrubali, F. (2016). Insulation materials for the building sector: A review and comparative analysis. Renewable and Sustainable Energy Reviews62, 988–1011. https://doi.org/10.1016/j.rser.2016.05.045

Schulte, M., Lewandowski, I., Pude, R., & Wagner, M. (2021). Comparative life cycle assessment of bio-based insulation materials: Environmental and economic performances. GCB Bioenergy13(6), 979–998. https://doi.org/10.1111/gcbb.12825

Stamm, R., Johnson, R., Clarity, C., McGrath, T., Singla, V., & Hasson, M. K. (2022). Chemical and Environmental Justice Impacts in the Life Cycle of Building Insulation. Energy Efficiency for All, Healthy Building Network. https://informed.habitablefuture.org/resources/research/20-chemical-and-environmental-justice-impacts-in-the-life-cycle-of-building-insulation-report-brief

Sustainable Traditional Buildings Alliance. (2024, March). The Use of Natural Insulation Materials in Retrofit. https://stbauk.org/wp-content/uploads/2024/03/The-use-of-natural-insulation-materials-in-retrofit.pdf

The Freedonia Group. (2024). Global Insulation Report. https://www.freedoniagroup.com/industry-study/global-insulation

The World Bank. (n.d.). Mapping Energy Efficiency: A GLobal Dataset on Building Code Effectiveness and Compliance. https://www.worldbank.org/content/dam/sites/buildinggreen/doc/building_green_main_findings.pdf

Types of Insulation. (n.d.). U.S. Department of Energy. https://www.energy.gov/energysaver/types-insulation

Waldman, B., Hyatt, A., Carlisle, S., Palmeri, J., & Simonen, K. (2023). 2023 Carbon Leadership Forum North American Material Baselines. Carbon Leadership Forum, University of Washington. https://carbonleadershipforum.org/clf-material-baselines-2023/

Wang, Z., & Wang, D. (2023). Can Paper Waste Be Utilised as an Insulation Material in Response to the Current Crisis. Sustainability15(22), Article 22. https://doi.org/10.3390/su152215939

Wi, S., Kang, Y., Yang, S., Kim, Y. U., & Kim, S. (2021). Hazard evaluation of indoor environment based on long-term pollutant emission characteristics of building insulation materials: An empirical study. Environmental Pollution285, 117223. https://doi.org/10.1016/j.envpol.2021.117223

Wilson, A. (2021). The BuildingGreen Guide to Thermal Insulation: What You Need to Know About Performance, Health, and Environmental Considerations. BuildingGreen, Inc.

Zabalza Bribián, I., Valero Capilla, A., & Aranda Usón, A. (2011). Life cycle assessment of building materials: Comparative analysis of energy and environmental impacts and evaluation of the eco-efficiency improvement potential. Building and Environment46(5), 1133–1140. https://doi.org/10.1016/j.buildenv.2010.12.002

Credits

Lead Fellow

  • Sarah Gleeson, Ph.D.

Contributors

  • Ruthie Burrows, Ph.D.

  • James Gerber, Ph.D.

  • Yusuf Jameel, Ph.D. 

  • Daniel Jasper

  • Alex Sweeney

Internal Reviewers

  • Aiyana Bodi

  • Hannah Henkin

  • Ted Otte

  • Amanda Smith, Ph.D.

  • Tina Swanson, Ph.D.

Effectiveness

To insulate 100 m2 to a thermal resistance of 1 m2·K/W using entirely cellulose insulation in place of the current baseline mix of insulation materials is expected to avoid 1.59 t CO₂‑eq on a 100-yr basis (Table 1). Effectiveness for this solution measures the one-time reduced emissions from manufacturing and installing insulation. Insulation also reduces the energy used while a building is operating, but those emissions are addressed separately in the Improve Building Envelopes solution. 

Conventional insulation cost was considered to be a weighted average cost of the current baseline insulation mix, including a small amount of cellulose insulation currently in use.

The largest contributor to conventional insulation embodied emissions is using high-GWP blowing agents to manufacture or install XPS, PUR, or PIR foam. We assumed the use of F-gas blowing agents for all foams, although these are already being regulated out of use globally (Amendment to the Montreal Protocol on Substances That Deplete the Ozone Layer, 2016) and an unknown amount of low-GWP blowing agents are currently use (such as hydrocarbons or CO₂ ). Therefore, we anticipate the effectiveness of this solution will decrease as F-gases are used less in the future. We assumed that 100% of blowing agents are emitted over the product lifetime.

Cellulose has the greatest avoided emissions of all of the alternative materials we evaluated (Figure 1). The next most effective materials were recycled PET, wood fibers, and sheep’s wool. Conventional materials like XPS, PUR, and PIR that are foamed with F-gases had the highest GHG emissions. For bio-based materials, we did not consider biogenic carbon as a source of carbon sequestration due to quantification and permanence concerns. 

left_text_column_width

Table 1. Effectiveness at reducing emissions.

Unit: t CO₂‑eq /insulation required to insulate 100 m2 to a thermal resistance of 1 m2·K/W, 100-yr basis

25th percentile 0.98
mean 1.34
median (50th percentile) 1.59
75th percentile 1.81
Left Text Column Width
Cost

Available cost data are variable for all materials, particularly those in early-stage commercialization. The mean cost of purchasing and installing cellulose insulation is less than that of any other conventional or alternative insulation material (Figure 1). Compared with the average cost of conventional insulation, the mean cost savings for cellulose insulation is US$193/100 m2 insulated to a thermal resistance of 1 m2·K/W. Since most buildings are insulated over greater areas to higher thermal resistances, these savings would quickly add up. When considering the mean cost per median climate impact, cellulose insulation saves US$121/t CO₂‑eq (100-yr basis), making it an economically and environmentally beneficial alternative (Table 2).

We considered conventional insulation cost to be a weighted average cost of the current baseline insulation mix, including a small amount of cellulose insulation currently in use.

For conventional insulation, material costs of purchasing the insulation are higher than costs for installation (US$540 and US$97, respectively, to insulate 100 m2 to a thermal resistance of 1 m2·K/W). Cellulose has a lower product cost and comparable installation costs to conventional materials. We considered all costs to be up-front and not spread over the lifetime of the material or building. For each material type, cost will vary based on the form of the insulation (board, loose, etc.) and this should be accounted for when comparing insulation options for a particular building. 

We determined net costs of insulation materials by adding the mean cost to purchase the product and the best estimation of installation costs based on available information. Installation costs were challenging to find data on and therefore represent broad assumptions of installation type and labor. Cost savings were determined by subtracting the weighted average net cost of conventional materials to the net cost of an alternative material. Although we used median values for other sections of this assessment, the spread of data was large for product cost estimates and the mean value was more appropriate in the expert judgment of our reviewers. 

left_text_column_width

Table 2. Cost per unit of climate impact.

Unit: 2023 US$/t CO₂‑eq, 100-yr basis

estimate -121
Left Text Column Width
Learning Curve

Little information is available about the learning rate for new insulation materials. Mályusz and Pém (2013) evaluated how labor time decreased with repetitive cycles for installing roof insulation. They found a learning rate of ~90%, but only for this specific insulation scenario, location, and material. Additionally, this study does not include any product or manufacturing costs that may decrease with scale.

In general, labor time for construction projects decreases with repetitive installation, including improved equipment and techniques and increased construction crew familiarity with the process (SaravanaPrabhu & Vidjeapriya, 2021). However, Malhotra and Schmidt (2020) classify building envelope retrofits as technologies that are highly customized based on user requirements, regulations, physical conditions, and building designs, likely leading to learning rates that are slow globally but where local expertise could reduce installation costs.

left_text_column_width
Speed of Action

Speed of action refers to how quickly a climate solution physically affects the atmosphere after it is deployed. This is different from speed of deployment, which is the pace at which solutions are adopted.

 At Project Drawdown, we define the speed of action for each climate solution as gradualemergency brake, or delayed.

Deploy Alternative Insulation Materials is an EMERGENCY BRAKE climate solution. It has the potential to deliver a more rapid impact than nominal and delayed solutions. Because emergency brake solutions can deliver their climate benefits quickly, they can help accelerate our efforts to address dangerous levels of climate change. For this reason, they are a high priority.

left_text_column_width
Caveats

Manufacturing and installation emissions reductions due to the use of alternative building thermal insulation materials are both permanent and additional

Permanence: There is a low risk of the emissions reductions for this solution being reversed. By using cellulose insulation instead of inorganic or plastic-based insulation, a portion of the manufacturing and installation emissions are never generated in the first place, making this a permanent reduction. Emissions from high-temperature manufacturing, petroleum extraction, and blowing agent use are all reduced through this approach.

Additionality: The GHG emissions reductions from alternative insulation materials are additional because they are calculated here relative to a baseline insulation case. This includes a small amount of cellulose materials included in baseline building insulation. Therefore, avoided emissions represent an improvement of the current emissions baseline that would have occurred in the absence of this solution. 

left_text_column_width
Current Adoption

Adoption data are extremely limited for alternative insulation materials. All adoption data and estimates are assumed to apply to both residential and commercial buildings, although in reality the uptake of alternative insulation materials will vary by building type due to differences in structures, climate, use type, and regulations. We assume that future uptake of alternative insulation is used only during retrofit or new construction, or when existing insulation is at the end of its functional lifetime.

European sources report that 2–13% of the insulation market is alternative materials. Depending on the source, this could include renewable materials, bio-based insulation, or recycled materials. In 2018 in the United States, 5% of total insulation area in new single-family homes was insulated with cellulose (Insulation Choices Revealed in New Study, 2019).

To convert estimated cellulose adoption percentage into annual insulation use, we estimated 26 Mt of all installed global insulation materials in 2023 based on a report from The Freedonia Group (2024). We calculated an annual use of approximately 1.7 billion insulation units of 100 m2 at a thermal resistance of 1 m2·K/W. Therefore, the median cellulose adoption is 140 million units/yr at 100 m2 at 1 m2·K/W, calculated from the median of the 2–13% adoption range. 

Since this calculation is based on more alternative materials than just cellulose and is heavily reliant on European data where we assume adoption is higher, this estimate of current adoption (Table 3) is most likely an overestimate.

The little adoption data that were considered in this section are mostly for Europe, and some for the United States. We recognize this limited geographic scope creates bias, and hope this work inspires research and data sharing on this topic in underrepresented regions.

left_text_column_width

Table 3. Current (2017–2022) adoption level.

Unit: units of insulation/yr installed to insulate 100 m2 to a thermal resistance of 1 m2·K/W

25th percentile 9000000
mean 130000000
median (50th percentile) 140000000
75th percentile 170000000
Left Text Column Width
Adoption Trend

Very few data are available that quantify adoption trends. In a regional study of several bio-based insulation materials, Rabbat et al. (2022) estimated French market annual growth rates of 4–10%, with cellulose estimated at 10%. Petcu et al. (2023) estimated the European adoption of recycled plastic and textile insulation, biomass fiber insulation, and waste-based insulation to have increased from 6% to 10% between 2012 and 2020.

When accounting for the calculated current adoption, these growth rates mean a median estimated annual increase of 500,000 insulation units/yr required to insulate 100 m2 to a thermal resistance of 1 m2·K/W. The increasing adoption of biobased insulation decreases the use of conventional insulation materials in those regions.

This adoption trend (Table 4) is likely an overestimate, as it is biased by high European market numbers and based on the likely high estimate we made for current adoption. 

left_text_column_width

Table 4. 2012–2020 adoption trend.

Unit: annual change in units of insulation/yr installed to insulate 100 m2 to a thermal resistance of 1 m2·K/W

25th percentile 500000
mean 800000
median (50th percentile) 500000
75th percentile 1300000
Left Text Column Width
Adoption Ceiling

No estimates have been found for the adoption ceiling of this solution, although we expect it to be high given low rates of current adoption and projected increases in building construction in the coming decades [International Energy Agency (IEA), International Renewable Energy Agency, & United Nations Climate Change High-Level Champions, 2023]. Two physical factors that could influence adoption are availability of alternative materials and thickness of insulation.

For cellulose insulation, availability does not seem to limit adoption. The Food and Agriculture Organization of the United Nations (2023) reports that there is a much higher annual production of cellulose-based materials (>300 Mt annually of cartonboard, newsprint, and recycled paper) than the overall demand for insulation globally (>25 Mt annual demand; Global Insulation Report, 2024). However, other uses for cellulose products may create competition for this supply.

Increased thickness of insulation could also be a limiting factor since this would reduce adoption by decreasing building square footage, in particular making retrofits more challenging and expensive. Deer et al. (2007) reported that the average cellulose thermal resistance is similar to mineral and glass wool, and lower than plastic insulations made of polystyrene and other foams. If we assume that 50% of plastic insulation cannot be replaced with cellulose due to thickness limitations, this would represent ~20% of current insulation that could not be replaced without structural changes to the building. Therefore, we calculate the adoption ceiling to be 80% of the current insulation that would be reasonably replaceable or 140 million units/yr required to insulate 100 m2 to a thermal resistance of 1 m2·K/W (Table 5).

Uptake of celllose insulation could also be limited by its susceptibility to absorbing moisture, limiting its use in wet climates or structures that retain moisture, such as flat roofs. Commercialization of alternative insulation materials beyond cellulose and in many different forms (e.g., board, loose-fill) will increase the adoption ceiling across more building types.

left_text_column_width

Table 5. Adoption ceiling.

Unit: units of insulation installed to insulate 100 m2 to a thermal resistance of 1 m2·K/W/yr.

25th percentile N/A
mean N/A
median (50th percentile) 140000000 (estimate)
75th percentile N/A
Left Text Column Width
Achievable Adoption

No estimates have been found for feasible global adoption of this solution. Rabbat et al. (2022) estimated the adoption levels of several bio-based insulation materials in France in 2050. For cellulose wadding, this was estimated to be 2.1 times the commercialized volume in France in 2020. Although we do not expect France to be representative of the rest of the world, if the predicted adoption trend holds across the world then we expect low adoption in 2050 to be 2.1 times greater than 2023 adoption. This is 29 million units/yr to insulate 100 m2 to a thermal resistance of 1 m2·K/W (Table 6).

The IEA (2023) claims that building envelopes need to have their retrofit rate increase by 2.5 times over the current rate in order to meet net zero targets (2023). This is a reasonable high-adoption scenario. Assuming that more retrofits of buildings occur and greater amounts of alternative insulation are installed in new buildings, we estimate that high future adoption of new insulation could occur at 2.5 times the rate of the low-adoption scenario. This is 73 million units/yr to insulate 100 m2 to a thermal resistance of 1 m2·K/W (Table 6).

Adoption will be facilitated or limited by local regulations around the world. Building codes will determine the location and extent of use of cellulose or other bio-based insulation. We expect uptake to be different between residential and commercial buildings, but due to insufficient data, we have grouped them in our adoption estimates.

left_text_column_width

Table 6. Range of achievable adoption levels.

Unit: units of insulation installed to insulate 100 m2 to a thermal resistance of 1 m2·K/W/yr

Current Adoption 14000000
Achievable – Low 29000000
Achievable – High 73000000
Adoption Ceiling 140000000
Left Text Column Width

The climate impacts for this solution are modest compared to current global GHG emissions. Not all conventional insulations have a high environmental impact due to the use of a wide range of materials, forms, and installation methods as well as the recent adoption of lower-GWP blowing agents. Therefore, the potential for further emissions savings is limited.

We quantified the effectiveness and adoption of cellulose insulation, which has the lowest emissions and, therefore, the highest climate impacts of the insulation materials we evaluated. With high adoption, 1.2 Gt CO₂‑eq on a 100-yr basis could be avoided over the next decade (Table 7).

While we only considered the adoption of cellulose insulation in this analysis, a realistic future for lowering the climate impact of insulation may include other bio-based materials, too. Utilizing a greater range of materials should increase adoption and climate impact due to more available forms, sources, and thermal resistance values of bio-based insulation.

Note that the current climate impact is calculated using a current materials baseline that includes a small fraction of cellulose. This means that the reported current adoption impact is a slight underestimate compared with the impacts for replacing entirely conventional insulation with the current amount of cellulose insulation in use.

left_text_column_width

Table 7. Climate impact at different levels of adoption.

Unit: Gt CO₂‑eq/yr, 100-yr basis

Current Adoption 0.022
Achievable – High 0.046
Achievable – Low 0.12
Achievable Ceiling 0.22
Left Text Column Width
Additional Benefits

Income and work

Some alternative insulations can be cheaper than conventional materials. Although there is large variation in evaluation methods and reported costs, our analysis found that cellulose and plant fibers are cheaper than conventional insulation materials such as stone wool, glass wool, and EPS (Figure 1). Depending on the applicable climate conditions and insulation form, switching to alternative insulation materials can result in cost savings for consumers, including homeowners and business owners.

Health

Conventional insulation materials may contribute to poor indoor air quality, especially during installation, and contribute to eye, skin, and lung irritation (Naldzhiev et al., 2020; Stamm et al., 2022; Wi et al., 2021). Additionally, off-gassing of flame retardants and other volatile organic compounds and by-products of conventional insulation can occur shortly after installation (Naldzhiev et al., 2020). Using bio-based alternative insulation products can minimize the health risks during and after installation (McGrath et al., 2023).

Water Resources

Although there is not a scientifically consistent approach to compare the environmental impacts of conventional and alternative insulation materials, a review analysis of 47 studies on insulation concluded that bio-based insulation materials generally have lower impacts as measured through acidificationeutrophication, and photochemical ozone creation potentials compared than do conventional materials (Füchsl et al., 2022). Other alternative materials such as wood fiber and miscanthus also tend to have a lower environmental footprint (Schulte et al., 2021). The water demand for wood and cellulose is significantly lower than that for EPS (about 2.8 and 20.8 l/kg respectively compared with 192.7 l/kg for EPS) (Zabalza Bribián et al., 2011). While the limited evidence suggests that the alternative material tends to be better environmentally, there is an urgent need to conduct life cycle assessments using a consistent approach to estimate the impact of these materials.

left_text_column_width
Risks

Cellulose insulation is susceptible to water absorption, which can lead to mold growth in wet or humid environments (Andersen & Rasmussen, 2025; Petcu et al., 2023). Mitigating this risk either requires an antifungal treatment for the material or limits adoption to particular climates. The thermal performance of cellulose insulation can decrease over time due to water absorption, settling, or temperature changes, but installing it as dense-packed or damp-spray can mitigate this (Wang & Wang, 2023; Wilson, 2021).

Bio-based insulation materials tend to be combustible, meaning they contribute more to the spread of a fire than non-combustible stone or glass insulation. Some bio-based materials are classified as having minimal contribution to a fire, such as some cellulose forms, rice husk, and flax (Kumar et al., 2020). These materials are less likely to contribute to a fire than very combustible plastic insulation such as EPS, XPS, and PUR. Fire codes – as well as other building and energy codes – could limit adoption, risking a lack of solution uptake due to regulatory setbacks (Northeast Bio-Based Materials Collective 2023 Summit Proceedings, 2023)

Additives such as fire retardants and anti-fungal agents are added to bio-based insulation along with synthetic binders, which can lead to indoor air pollution from organic compounds, although likely in low concentrations (Maskell et al., 2015; Rabbat et al., 2022).

left_text_column_width
Interactions with Other Solutions

Reinforcing

Upgrading insulation to lower-cost and lower-emitting alternative materials should increase the adoption of other building envelope solutions as they can be installed simultaneously to optimize cost and performance. 

left_text_column_width

Increasing the manufacturing of cellulose insulation, which contains large amounts of recycled paper, could increase the revenues for paper recycling.

left_text_column_width

Competing

The use of biomass as raw material for insulation will reduce the availability and increase the cost of using it for other applications. For cellulose, global production of cellulose materials (>300 Mt annually of cartonboard, newsprint, and recycled paper (Forestry Production and Trade, 2023)) is an order of magnitude higher than the demand for insulation materials (>25 Mt annual demand (The Freedonia Group, 2024)), so the overall impact should be small.

left_text_column_width

Reducing the demand for conventional insulation products and instead making insulation that produces fewer GHGs during manufacturing would slightly reduce the global climate impact of other industrial manufacturing solutions. This is because less energy overall would be used for manufacturing, and therefore other technologies for emissions reductions would be less impactful for insulation production.

left_text_column_width
Dashboard

Solution Basics

(insulation units of 100 m2 and 1 m2·K/W)/yr

tCO2-eq/unit
1.59
units
Current 1.4×10⁷2.9×10⁷7.3×10⁷
Achievable (Low to High)

Climate Impact

GtCO2-eq/yr
Current 0.02 0.050.12
US$ per tCO2-eq
-121
Emergency Brake

CO₂, F-gas

Trade-offs

Bio-based insulation materials including cellulose often have lower thermal resistance than some conventional insulation materials. In particular, bio-based materials may require a thicker layer than plastic insulation to reach the same insulating performance (Esau et al., 2021; Rabbat et al., 2022). Usable floor area within a building would need to be sacrificed to accommodate thicker insulation, which would potentially depreciate the structure or impact the aesthetic value (Jelle, 2011). This would be a more significant trade-off for retrofit construction and buildings in densely developed urban areas.

Sourcing bio-based materials has environmental trade-offs that come from cultivating biomass, such as increased land use, fertilizer production, and pesticide application (Schulte et al., 2021). Using waste or recycled materials could minimize these impacts. Binders and flame-retardants may also be required in the final product, leading to more processing and material use (Sustainable Traditional Buildings Alliance, 2024).

left_text_column_width
Geographic Guidance Introduction

The effectiveness of deploying alternative insulation is not inherently dependent on geographic factors since it addresses emissions embodied in the manufacture and deployment of insulation materials. However, due to a lack of related data, we assumed a consistent global breakdown of currently used insulation materials when in reality, the exact mix of insulation currently used in different geographic locations will affect the emissions impact of switching to alternative materials.

Building insulation is used in higher quantities in cold or hot climates, so deploying alternative insulation is more likely to be relevant and adopted in such climates. Other geographic factors also impact adoption: Areas with higher rates of new construction will be better able to design for cellulose or other alternative insulation materials, and drier climates will face a lower risk of mold growth on these materials. Local building codes, including fire codes, can also affect the adoption of alternative materials.

There are no maps for the Alternative Insulation solution. It is intended to address emissions embodied in the manufacture and deployment of insulation materials and has no intrinsic dependence on geographic factors.

Action Word
Deploy
Solution Title
Alternative Insulation Materials
Classification
Highly Recommended
Nonprofit Leaders
  • Advocate for financial incentives, improved building and fire codes, and educational programs for alternative insulation.
  • Conduct research to improve alternative insulation materials’ manufacturing, adoption, supply chain access, and circularity.
  • Offer educational resources, one-stop shops for retrofitting and weatherization, installation demonstrations, and tours of model builds for commercial and private developers, highlighting the cost savings and environmental benefits of alternative insulation.
  • Create, join, or administer green building certification schemes and/or public-private partnerships that offer information, training, and general support for alternative insulation.

Further information:

Philanthropists and International Aid Agencies
  • Finance only new construction and retrofits that utilize alternative insulation and other low-carbon practices.
  • Offer grants for developers utilizing alternative insulation and other climate-friendly practices.
  • Create financing programs for private construction in low-income or under-resourced communities.
  • Create new contractual terms that require embodied emissions data from materials and methods.
  • Advocate for financial incentives, improved building and fire codes, and educational programs for alternative insulation.
  • Fund research to improve alternative insulation materials’ manufacturing, adoption, supply chain access, and circularity.
  • Offer educational resources, one-stop shops for retrofitting and weatherization, installation demonstrations, and tours of model builds for commercial and private developers, highlighting the cost savings and environmental benefits of alternative insulation.
  • Create or join green building certification schemes and/or public-private partnerships that offer information, training, and general support for alternative insulation.

Further information:

Technologists and Researchers
  • Develop and improve existing alternative insulation materials or innovate new materials with enhanced insulation performance.
  • Investigate ways to increase the durability of alternative insulation, such as resistance to moisture, pests, and fire.
  • Find uses for recycled materials in alternative insulation and ways to improve the circular economy.
  • Innovate new manufacturing methods that reduce electricity use and emissions.
  • Design new application systems for alternative insulation that can be done without much additional training or licensing/certification.
  • Create new methods of disposal for conventional insulation during demolitions.
  • Research adoption rates of alternative insulation materials across regions and environments.

Further information:

Communities, Households, and Individuals
  • Finance or develop only new construction and retrofits that utilize alternative insulation and other low-carbon practices.
  • Take advantage of financial incentives such as subsidies, tax credits, and grants for installing alternative insulation.
  • Whenever possible, install insulation that does not use F-gas blowing agents.
  • Advocate for financial incentives, improved building and fire codes, and educational programs for alternative insulation.
  • Conduct local research to improve alternative insulation materials’ manufacturing, adoption, supply chain access, and circularity.
  • Organize local “green home tours” and open houses to showcase climate-friendly builds and foster demand by highlighting cost savings and environmental benefits of alternative insulation.
  • Create or join green building certification schemes, green building councils, and/or public-private partnerships that offer information, training, and general support for alternative insulation.
  • Capture community feedback and share it with local policymakers to address barriers such as permitting logistics or upfront costs, helping to share policies that drive adoption.

Further information:

Sources
Evidence Base

Consensus of effectiveness in reducing building sector emissions: Mixed

There is scientific consensus that using building insulation with lower embodied emissions will reduce GHG emissions, but expert opinions about the magnitude of possible emissions reductions as well as the accuracy of determining these reductions are mixed. 

Biswas et al. (2016) determined that, for insulation, avoided emissions from reduced heating and cooling energy tend to outweigh the embodied emissions. However, others emphasize that as buildings become more energy-efficient, material embodied emissions become a larger factor in their carbon footprint (Cabeza et al., 2021; Grazieschi et al., 2021). Embodied emissions from insulation can be substantial: Esau et al. (2021) analyzed a mixed-use multifamily building and found that selecting low-embodied-carbon insulation could reduce building embodied emissions by 16% at no cost premium.

Multiple studies have found that some sustainable insulation materials have lower manufacturing emissions than traditional insulation materials (Asdrubali et al., 2015; Füchsl et al., 2022; Kumar et al., 2020; Schiavoni et al., 2016). However, researchers have highlighted the difficulty in evaluating environmental performance of different insulation materials (Cabeza et al., 2021; Grazieschi et al., 2021). Gelowitz and McArthur (2017) found that construction product Environmental Product Declarations contain many errors and discrepancies due to self-contradictory or missing data. Füschl et al. (2022) conducted a meta-analysis and cautioned that “it does not appear that a definitive ranking [of insulation materials] can be drawn from the literature.” In our analysis, we attempt to compare climate impact between materials but acknowledge that this can come from flawed and inconsistent data.

Despite the difficulties in comparing materials, there is high consensus that cellulose is a strong low-emissions insulation option due to its low embodied carbon, high recycled content, and good thermal insulating performance (Wilson, 2021).

The results presented in this document summarize findings from four reviews and meta-analyses, 14 original studies, three reports, 27 Environmental Product Declarations, and two commercial websites reflecting current evidence from eight countries as well as data representing global, North American, or European insulation materials. We recognize this limited geographic scope creates bias, and hope this work inspires research and data sharing on this topic in underrepresented regions.

left_text_column_width
Updated Date

Improve Cement Production

Image
Image
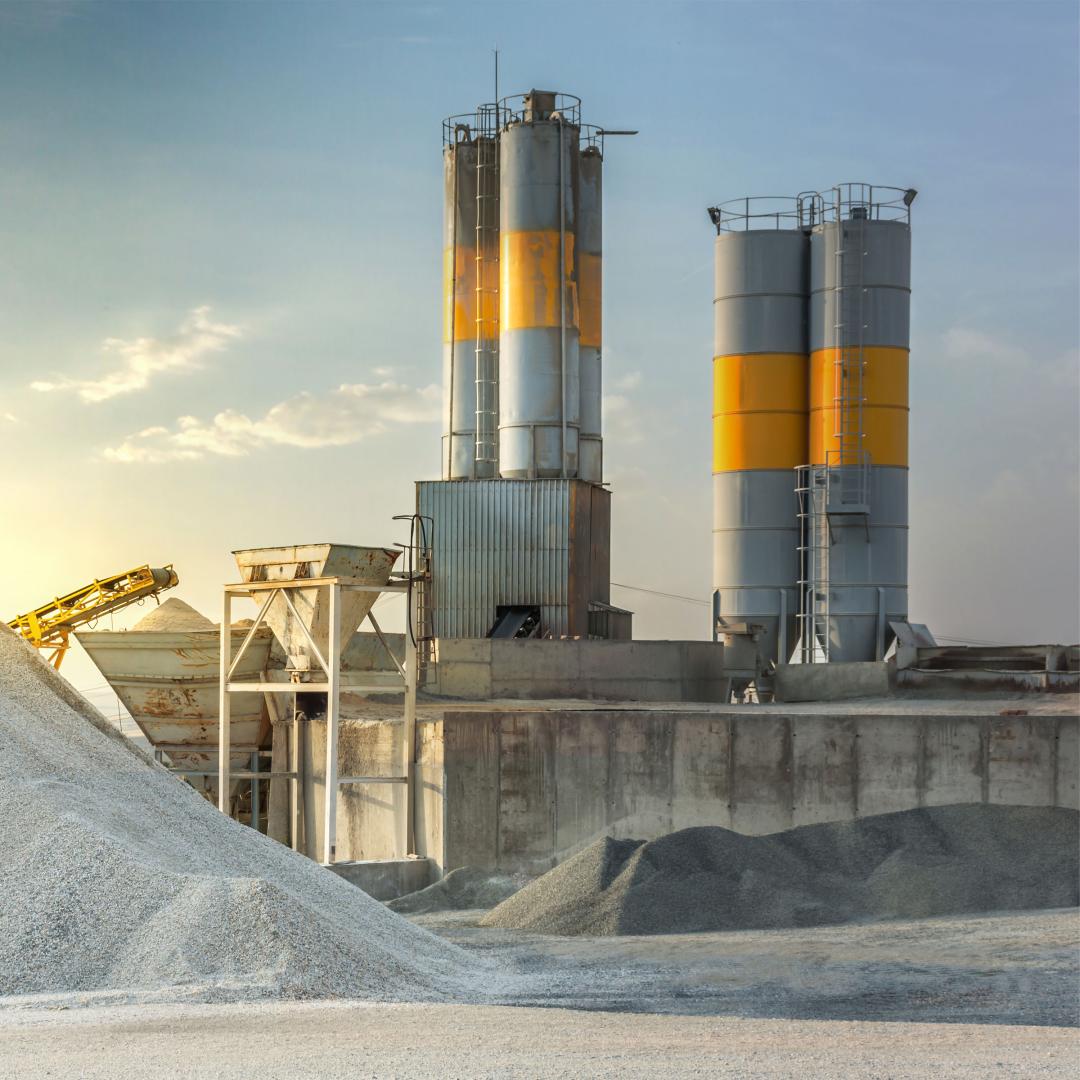
Cement factory
Coming Soon
Off
Summary

Cement is a key ingredient of concrete, a manufactured material used in massive quantities around the world. Cement production generates high CO₂ emissions from the production of clinker, a binding ingredient. These emissions come from not only the chemical reaction that produces clinker, but also burning fossil fuels to provide heat for this reaction. We define the Improve Cement Production solution as reducing GHG emissions related to cement manufacturing by substituting other materials for clinker, using alternative fuels, and improving process efficiency.

Overview

Concrete production requires the manufacturing of 4 Gt of cement annually (U.S. Geological Survey, 2024). Roughly 85% of cement industry GHG emissions come from the production of a key cement component called clinker. Both the clinker formation chemical reaction and fuel combustion for high-temperature clinker kilns release GHGs (Goldman et al., 2023). Figure 1 illustrates the manufacturing steps responsible for these emissions and highlights how three approaches – clinker material substitution, use of alternative fuels, and process efficiency upgrades – could mitigate emissions.

Figure 1. Cement production GHG emissions. Some 85% of GHGs emitted during cement production are released when clinker is produced in high-temperature kilns. The three approaches analyzed in this solution – clinker material substitution, alternative fuels, and process efficiency upgrades – aim to mitigate such emissions. Modified from Goldman et al. (2023).

Image
Diagram of energy used in cement production process

Source: Goldman, S., Majsztrik, P., Sgro Rojas, I., Gavvalapalli, M., Gaikwad, R., Feric, T., Visconti, K., & McMurty, B. (2023). Pathways to commercial liftoff: Low-carbon cement. U.S. Department of Energy. https://liftoff.energy.gov/wp-content/uploads/2023/09/20230918-Pathways-to-Commercial-Liftoff-Cement.pdf 

Clinker material substitution replaces a portion of the clinker used in cement with alternative materials, thus reducing the amount of clinker manufactured. This decreases the amount of CO₂ emitted by the chemical reaction and fuel combustion. Clinker is made by heating limestone to convert it to lime. This reaction releases CO₂. Some of the CO₂ production can be eliminated by replacing some of the clinker with substitute materials such as industrial waste products, other cementitious compounds, or available minerals. Clinker material substitution also reduces energy demand, lowering emissions from burning fossil fuels. Clinker fraction in cement is often expressed as a clinker-to-cement ratio, which ranges from 0 (no clinker) to 1 (entirely clinker). The most common type of cement, Portland cement, typically has a clinker-to-cement ratio of 0.95, meaning the cement is 95% clinker by mass.

Alternative fuels that can be used to heat cement kilns in place of fossil fuels are typically biomass and waste-based fuels. Cement production uses two kilns, one heated to ~700 °C and the other to ~1,400 °C (U.S. Department of Energy, 2022). The energy needed to provide this heat typically comes from burning fossil fuels such as oil, gas, coal, and petroleum coke on-site, which emits CO₂ as well as small amounts of other GHGs, including methane and nitrous oxide, and air pollutants, including nitrogen oxides, sulfur oxides, and particulate matter (Hottle et al., 2022; Miller & Moore, 2020). Switching to alternative fuels decreases emissions by reducing the mining and combustion of fossil fuels and recovering energy from waste streams that would have otherwise released GHG during decomposition or incineration (Georgiopoulou & Lyberatos, 2018).

Process efficiency upgrades include a broad suite of technologies such as improved controls, electrically efficient equipment (e.g., mills, fans, and motors), thermally efficient and multistage kilns, and waste heat recovery. These improvements lead to less wasted heat and input energy, and therefore require less fossil fuel burning during manufacturing. In particular, upgrading kilns has the potential for high emissions mitigation (Mokhtar & Nasooti, 2020; Morrow III et al., 2014). Kiln upgrades can include processing dry raw material (which is more efficient than expending energy to remove moisture from wet feedstock), adding a preheater that uses kiln exhaust gas to dry and preheat raw material, and adding a precalciner kiln that uses some of the fuel to partially calcinate raw material at a lower temperature (European Cement Research Academy, 2022; Schorcht et al., 2013). Each study included in our analysis for effectiveness and cost included a set group of technologies that were considered to be process efficiency upgrades.

The cost and avoided emissions from each approach vary depending on the other technologies in use at a particular cement plant (Glenk et al., 2023). While coupling the impacts of the approaches would provide the most accurate representation of this solution, that analysis is complex and outside the scope of this assessment. Therefore, we will consider the three approaches separately. 

5.42%
of total global emissions
4.1 Billion

Worldwide, we make 4.1 billion metric tons of cement every year.

3.2 Gt

In the process, we produce more than 3 Gt CO₂‑eq of greenhouse gases – 5.42% of global annual emissions

Take Action Intro

Would you like to help reduce the climate impacts of cement production? Below are some ways you make a difference, depending on the roles you play in your professional or personal life.

These actions are meant to be starting points for involvement and may or may not be the most important, impactful, or doable actions you can take. We encourage you to explore, get creative, and take a step that is right for you!

References

Afsah, S. (2004). CDM potential in the cement sector: The challenge of demonstrating additionality. Performeks LLC. https://www.performeks.com/media/downloads/CDM-Cement%20Sector_May%202004.pdf 

Cannon, C., Guido, V., & Wright, L. (2021). Concrete solutions guide: Mix it up: Supplementary cementitious materials (SCMs). RMI. https://rmi.org/wp-content/uploads/2021/08/ConcreteGuide2.pdf 

Cao, Z., Masanet, E., Tiwari, A., and Akolawala, S. (2021). Decarbonizing concrete: Deep decarbonization pathways for the cement and concrete cycle in the United States, India, and China. Industrial Sustainability Analysis Laboratory. https://www.climateworks.org/wp-content/uploads/2021/03/Decarbonizing_Concrete.pdf 

Cavalett, O., Watanabe, M. D. B., Voldsund, M., Roussanaly, S., & Cherubini, F. (2024). Paving the way for sustainable decarbonization of the European cement industry. Nature Sustainability7, 568–580. https://doi.org/10.1038/s41893-024-01320-y 

CEMBUREAU. (n.d.) Clinker substitution. Retrieved August 7, 2024, from https://lowcarboneconomy.cembureau.eu/5-parallel-routes/resource-efficiency/clinker-substitution/ 

Clark, G., Davis, M., Shibani, & Kumar, A. (2024). Assessment of fuel switching as a decarbonization strategy in the cement sector. Energy Conversion and Management312, 118585. https://doi.org/10.1016/j.enconman.2024.118585 

ClimeCo. (2022). Low carbon cement production. https://www.climateactionreserve.org/wp-content/uploads/2022/10/Low-Carbon-Cement-Issue-Paper-05-20-2022_final.pdf 

Daehn, K., Basuhi, R., Gregory, J., Berlinger, M., Somjit, V., & Olivetti, E. A. (2022). Innovations to decarbonize materials industries. Nature Reviews Materials7, 275–294. https://doi.org/10.1038/s41578-021-00376-y 

de Puy Kamp, M. (2021, July 9). How marginalized communities in the South are paying the price for ‘green energy’ in Europe. CNNhttps://edition.cnn.com/interactive/2021/07/us/american-south-biomass-energy-invs/ 

European Cement Research Academy. (2022). The ECRA technology papers 2022: State of the art cement manufacturing, current technologies and their future development. https://api.ecra-online.org/fileadmin/files/tp/ECRA_Technology_Papers_2022.pdf 

Georgiopoulou, M., & Lyberatos, G. (2018). Life cycle assessment of the use of alternative fuels in cement kilns: A case study. Journal of Environmental Management216, 224–234. https://doi.org/10.1016/j.jenvman.2017.07.017 

Glenk, G., Kelnhofer, A., Meier, R., & Reichelstein, S. (2023). Cost-efficient pathways to decarbonizing Portland cement production. ZEW - Centre for European Economic Research Discussion Paper No. 23-023. https://doi.org/10.2139/ssrn.4434830 

Global Cement and Concrete Association. (2021). Concrete future: The GCCA 2050 cement and concrete industry roadmap for net zero concrete. https://gccassociation.org/concretefuture/wp-content/uploads/2021/10/GCCA-Concrete-Future-Roadmap-Document-AW.pdf 

Goldman, S., Majsztrik, P., Sgro Rojas, I., Gavvalapalli, M., Gaikwad, R., Feric, T., Visconti, K., & McMurty, B. (2023). Pathways to commercial liftoff: Low-carbon cement. U.S. Department of Energy. https://liftoff.energy.gov/wp-content/uploads/2023/09/20230918-Pathways-to-Commercial-Liftoff-Cement.pdf 

Gómez, D. R., & Watterson, J. D., et al. (2006). Stationary combustion. In S. Eggelston, L. Buendia, K. Miwa, T. Ngara, & K. Tanabe (Eds.), 2006 IPCC guidelines for national greenhouse gas inventories (Vol. 2). Institute for Global Environmental Strategies (IGES) for the IPCC. https://www.ipcc-nggip.iges.or.jp/public/2006gl/pdf/2_Volume2/V2_2_Ch2_Stationary_Combustion.pdf 

Griffiths, S., Sovacool, B. K., Furszyfer Del Rio, D. D., Foley, A. M., Bazilian, M. D., Kim, J., & Uratani, J. M. (2023). Decarbonizing the cement and concrete industry: A systematic review of socio-technical systems, technological innovations, and policy options. Renewable and Sustainable Energy Reviews, 180, 113291. https://doi.org/10.1016/j.rser.2023.113291 

Habert, G., Miller, S. A., John, V. M., Provis, J. L., Favier, A., Horvath, A., & Scrivener, K. L. (2020). Environmental impacts and decarbonization strategies in the cement and concrete industries. Nature Reviews Earth & Environment1, 559–573. https://doi.org/10.1038/s43017-020-0093-3 

Hottle, T., Hawkins, T. R., Chiquelin, C., Lange, B., Young, B., Sun, P., Elgowainy, A., & Wang, M. (2022). Environmental life-cycle assessment of concrete produced in the United States. Journal of Cleaner Production363, 131834. https://doi.org/10.1016/j.jclepro.2022.131834 

International Energy Agency. (2018). Technology roadmap: Low-carbon transition in the cement industry. https://www.iea.org/reports/technology-roadmap-low-carbon-transition-in-the-cement-industry 

International Energy Agency. (2023a). CO₂ emitted and captured in the cement sector and clinker-to-cement ratio in the Net Zero Scenario, 20152030. https://www.iea.org/data-and-statistics/charts/co2-emitted-and-captured-in-the-cement-sector-and-clinker-to-cement-ratio-in-the-net-zero-scenario-2015-2030 

International Energy Agency. (2023b). Global cement production in the Net Zero Scenario, 20102030. https://www.iea.org/data-and-statistics/charts/global-cement-production-in-the-net-zero-scenario-2010-2030-5260 

International Energy Agency. (2023c). Global thermal energy intensity of clinker production by fuel in the Net Zero Scenario, 20102030. https://www.iea.org/data-and-statistics/charts/global-thermal-energy-intensity-of-clinker-production-by-fuel-in-the-net-zero-scenario-2010-2030 

Isabirye, A., & Sinha, A. (2023). Manufacturing sector: Cement manufacturing emissions. ClimateTRACE. https://github.com/climatetracecoalition/methodology-documents/blob/main/2023/Manufacturing/Manufacturing%20and%20Industrial%20Processes%20sector-%20Cement%20Manufacturing%20Emissions%20methodology.docx.pdf 

Juenger, M. C. G., Snellings, R., & Bernal, S. A. (2019). Supplementary cementitious materials: New sources, characterization, and performance insights. Cement and Concrete Research122, 257–273. https://doi.org/10.1016/j.cemconres.2019.05.008 

Miller, S. A., & Moore, F. C. (2020). Climate and health damages from global concrete production. Nature Climate Change10(5), 439–443. https://doi.org/10.1038/s41558-020-0733-0

Mokhtar, A., & Nasooti, M. (2020). A decision support tool for cement industry to select energy efficiency measures. Energy Strategy Reviews28, 100458. https://doi.org/10.1016/j.esr.2020.100458 

Morrow III, W. R., Hasanbeigi, A., Sathaye, J., & Xu, T. (2014). Assessment of energy efficiency improvement and CO₂ emission reduction potentials in India's cement and iron & steel industries. Journal of Cleaner Production65, 131–141. https://doi.org/10.1016/j.jclepro.2013.07.022 

Rissman, J., Bataille, C., Masanet, E., Aden, N., Morrow III, W. R., Zhou, N., Elliott, N., Dell, R., Heeren, N., Huckestein, B., Cresko, J., Miller, S. A., Roy, J., Fennell, P., Cremmins, B., Blank, T. K., Hone, D., Williams, E. D., de la Rue du Can, S., …Helseth, J. (2020). Technologies and policies to decarbonize global industry: Review and assessment of mitigation drivers through 2070. Applied Energy266, 114848. https://doi.org/10.1016/j.apenergy.2020.114848 

Schorcht, F., Kourti, I., Scalet, B. M., Roudier, S., & Delgado Sancho L. (2013). Best available techniques (BAT) reference document for the production of cement, lime and magnesium oxide – Industrial Emissions Directive 2010/75/EU (integrated pollution prevention and control) (Joint Research Center publication JRC 83006). European Commission, Joint Research Centre, Institute for Prospective Technological Studies. https://doi.org/10.2788/12850 

Shah, I. H., Miller, S. A., Jiang, D., & Myers, R. J. (2022). Cement substitution with secondary materials can reduce annual global CO₂ emissions by up to 1.3 gigatons. Nature Communications13, 5758. https://doi.org/10.1038/s41467-022-33289-7 

Sinha, A., and Crane, V. (2024). Manufacturing and industrial processes sector: Cement manufacturing emissions. TransitionZero, UK, Climate TRACE Emissions Inventory. https://climatetrace.org

Snellings, R. (2016). Assessing, understanding and unlocking supplementary cementitious materials. RILEM Technical Letters1, 50–55. https://doi.org/10.21809/rilemtechlett.2016.12 

Snellings, R., Suraneni, P., & Skibsted, J. (2023). Future and emerging supplementary cementitious materials. Cement and Concrete Research171, 107199. https://doi.org/10.1016/j.cemconres.2023.107199

U.S. Department of Energy. (2022). Industrial decarbonization roadmap. https://www.energy.gov/sites/default/files/2022-09/Industrial%20Decarbonization%20Roadmap.pdf 

U.S. Environmental Protection Agency. (2016). Greenhouse gas inventory guidance: Direct emissions from stationary combustion sources. https://www.epa.gov/sites/default/files/2016-03/documents/stationaryemissions_3_2016.pdf 

U.S. Federal Highway Administration. (n.d.). Use of supplementary cementitious materials (SCMs) in concrete mixtures (FHWA-HIF-19-054)U.S. Department of Transportation. https://www.fhwa.dot.gov/pavement/concrete/trailer/resources/hif19054.pdf 

U.S. Geological Survey. (2024). Mineral commodity summaries 2024. https://doi.org/10.3133/mcs2024 

Yang, X., Teng, F., & Wang, G. (2013). Incorporating environmental co-benefits into climate policies: A regional study of the cement industry in China. Applied Energy112, 1446–1453. https://doi.org/10.1016/j.apenergy.2013.03.040

Zhang, S., Ren, H., Zhou, W., Yu, Y., & Chen, C. (2018). Assessing air pollution abatement co-benefits of energy efficiency improvement in cement industry: A city level analysis. Journal of Cleaner Production185, 761–771. https://doi.org/10.1016/j.jclepro.2018.02.293

Zhang, S., Worrell, E., & Crijns-Graus, W. (2015). Evaluating co-benefits of energy efficiency and air pollution abatement in China’s cement industry. Applied Energy147, 192–213. https://doi.org/10.1016/j.apenergy.2015.02.081

Zhang, S., Xie, Y., Sander, R., Yue, H., & Shu, Y. (2021). Potentials of energy efficiency improvement and energy–emission–health nexus in Jing-Jin-Ji’s cement industry. Journal of Cleaner Production278, 123335. https://doi.org/10.1016/j.jclepro.2020.123335

Credits

Lead Fellow

  • Sarah Gleeson, Ph.D.

Contributors

  • James Gerber, Ph.D.

  • Yusuf Jameel, Ph.D.

  • Daniel Jasper

  • Alex Sweeney

Internal Reviewers

  • Aiyana Bodi

  • Hannah Henkin

  • Ted Otte

  • Amanda Smith, Ph.D.

  • Tina Swanson, Ph.D.

Effectiveness

Cement production currently emits 760,000 t CO₂‑eq /Mt cement produced, based on our analysis. With global cement production exceeding 4 Gt/yr (U.S. Geological Survey, 2024), the scale of emissions to be mitigated is large.

Clinker material substitution is the most effective of the three approaches at reducing emissions, eliminating approximately 240,000 t CO₂‑eq /Mt cement produced. This is equivalent to 690,000 t CO₂‑eq /Mt clinker avoided (Table 1a). This estimate is based on expert predictions of GHG savings for realistic target levels of clinker replacement with material substitutes.

Alternative fuels and process efficiency upgrades ) have carbon abatement potentials of 96,000 and 90,000 t CO₂‑eq /Mt cement produced, respectively, when calculated based on production levels (Table 1b). Since the units of adoption for process efficiency upgrades are GJ thermal energy input, when calculating climate impact we used an effectiveness per GJ of thermal energy, calculated using an emission factor for fuel combustion. This effectiveness is 0.0847 t CO₂ /GJ thermal energy input (Table 1c) (Gómez & Watterson et al., 2006; IEA, 2023c). 

We calculated the effectiveness of these three approaches separately. Because the implementation of each affects the effectiveness potential of the others (Glenk et al., 2023), the actual effectiveness will be lower when the approaches are implemented together.

Emissions reductions from these approaches can be directly related to how the approach impacts GHG emissions from clinker production and fossil fuel burning. However, sourcing, processing, and transporting clinker substitutes and alternative fuels also produces GHGs. Our data sources did not always report whether such indirect emissions were accounted for, so our analysis primarily focuses on direct emissions. Further analysis of other life-cycle emissions considerations would be valuable in future research; however, indirect emission levels for both clinker substitutes and alternative fuels are reportedly small compared to direct emissions (European Cement Research Academy, 2022; Shah et al., 2022).

Additionally, cement industry members sometimes assume that there are no direct emissions from burning biomass fuels (Goldman et al., 2023). As a result, we assume that direct emissions from biomass are not fully accounted for in the data and therefore that the climate benefit of using alternative fuels may be exaggerated.

While other GHGs, including methane and nitrous oxide, are also released during cement manufacturing, these gases represent a small fraction (<3% combined) of overall CO₂‑eq emissions so we considered them negligible in our calculations (U.S. Environmental Protection Agency, 2016; Hottle et al., 2022). 

left_text_column_width

Table 1. Effectiveness at reducing emissions.

Unit: t CO₂‑eq /Mt cement produced (100-year basis)

25th percentile 540,000
mean 710,000
median (50th percentile) 690,000
75th percentile 860,000

Unit: t CO₂‑eq /Mt cement produced (100-year basis)

25th percentile 77,000
mean 94,000
median (50th percentile) 96,000
75th percentile 99,000

Unit: t CO₂‑eq /Mt cement produced (100-year basis)

calculated value 0.0847
Cost

All three approaches to mitigating cement emissions result in cost savings by our analysis. Despite high initial costs, when considering the long technology lifetime and annual operational savings, the net lifetime and annualized costs are lower than conventional cement production.

Clinker material substitution has the highest net savings of the three approaches, with US$7 million/Mt cement produced generating savings of US$30/t CO₂‑eq . While initial and operating costs may vary between different substitute materials, we averaged all material types for each cost estimate. Goldman et al. (2023) and the European Cement Research Academy (2022) offer breakdowns of cost by material type.

Alternative fuels generate savings of US$5 million/Mt cement, or US$50/t CO₂‑eq mitigated. For both clinker material substitution and alternative fuels, cost and emissions will vary based on local material availability (Cannon et al., 2021). We assumed equivalent costs for all alternative fuel types.

Process efficiency upgrades save US$6 million/Mt cement and have the highest cost savings per unit climate impact (US$60/t CO₂‑eq ). While process efficiency upgrades encompass many different technologies, this cost estimate incorporates the costs of two of the technologies yielding high avoided emissions – replacing long kilns with preheater/precalciner kilns and implementing efficient clinker cooler technology. Between these technologies, upgrading to preheater/precalciner kilns represents most of the initial cost increase and the operational cost savings (European Cement Research Academy, 2022).

The costs of each approach (Table 2) were calculated as amortized initial costs of upgrading plants, added to the expected changes in annual operational costs. Only very limited data are available for price premiums on low-carbon cement. Therefore, we did not include any revenues for low-carbon cement. 

While we calculated these costs separately, in reality the cost for implementing multiple approaches will be different due to interactions between technologies (Glenk et al., 2023). For example, material processing equipment could change based on the type of clinker substitute materials. We do not expect the costs to be additive as we assumed in our analysis, and limited cost data means that this estimate is based on limited sources.

left_text_column_width

Table 2: Cost per unit climate impact.

Unit: 2023 US$/t CO₂‑eq (100-yr basis)

Clinker material substitution -30
Alternative fuels -50
Process efficiency upgrades -60

Negative values reflect cost savings.

Learning Curve

The technologies needed for all approaches in this solution are well developed and ready to deploy at scale, so we did not consider learning curves. 

We did not find any global data on cost changes related to adoption levels for equipment, including energy-efficient processing technologies, dry-process kilns, or material storage. A portion of the solution’s initial costs come from plant downtimes, which would not be impacted by the technology learning curve. For feedstock components of the solution, including alternative fuels and clinker material substitutes, the costs will be subject to material availability, market prices, and transportation, and therefore will not necessarily decrease with adoption.

left_text_column_width
Speed of Action

Speed of action refers to how quickly a climate solution physically affects the atmosphere after it is deployed. This is different from speed of deployment, which is the pace at which solutions are adopted.

At Project Drawdown, we define the speed of action for each climate solution as gradualemergency brake, or delayed.

Improve Cement Production is a GRADUAL climate solution. It has a steady, linear impact on the atmosphere. The cumulative effect over time builds as a straight line.

left_text_column_width
Caveats

Manufacturing emissions reductions due to clinker material substitution, alternative fuels, and process efficiency upgrades are both permanent and additional

Permanence 

There is a low risk that the emission reductions this solution generates will be reversed in the next 100 years. This approach calls for reduced burning of fossil fuels and less calcination of limestone into clinker, thereby avoiding emissions from these activities. Meanwhile, carbon that is not released as CO₂ due to these technologies will remain stable in limestone or fossil fuel reserves indefinitely, making the emissions mitigation permanent.

Additionality 

These cement emissions reductions are additional if they are adopted in amounts higher than what is currently required and used in local or regional cement manufacturing. Afsah (2004) assessed additionality based on whether it represents “not common practice” from a national standpoint of market share or adoption. ClimeCo (2022) suggested that for clinker material substitutes to be considered additional, the substitute needs to meet two criteria: The replacement is not mandated by law, and new or emerging materials are used.

left_text_column_width
Current Adoption

Few global data are available for current adoption. Most data are from regional sources, typically the United States or Europe. As a result, we do not expect these data to be representative at the global level – China and India alone produce more than 60% of the world’s cement (U.S. Geological Survey, 2024). Therefore, we quantified adoption only from a limited number of worldwide sources, using the adoption units listed in Figure 2.

Clinker material substitution is challenging to assess for adoption, since it is implemented with a broad range of materials and replacement fractions. We therefore simplified adoption in this analysis by quantifying it as the amount of global cement material that is not clinker. The adoption tonnage (Table 3a) represents Mt of clinker production avoided, using conventional Portland cement (5% non-clinker) as a baseline (CEMBUREAU, n.d.). Note that this is different from the way we considered cement tonnage for effectiveness and cost. There, we calculated emissions reductions for a Mt of cement produced including substituted material. For adoption, however, we considered tonnage to be clinker avoided (based on amount replaced with other materials).

The IEA (2023a) and the European Cement Research Academy (2022) estimated the global clinker-to-cement ratio to be approximately 0.72, meaning that 28% of cement composition is material other than clinker. This correlates to 980 Mt clinker avoided/yr used over the Portland cement baseline.

Alternative fuels are currently used to replace approximately 7% of fossil fuels in global cement production (Global Cement and Concrete Association, 2021; IEA, 2023c). We assumed this means approximately 300 Mt cement/yr are currently produced with biomass and waste fuels (Table 3b).

Process efficiency upgrades encompass dozens of technological improvements, which – along with a paucity of available data – make adoption levels challenging to assess. To estimate the current state of energy usage in the cement industry, we used the IEA (2023c) estimate of 3,550,000 GJ/Mt clinker as the 2022 benchmark thermal energy input for clinker production. This value does not include electrical efficiency and can vary based on fuel mix, but approximates the current state of energy use. We converted it to GJ/yr using amounts of annual clinker production, yielding 10.5 billion GJ thermal energy consumed each year for clinker production. Since there is no baseline for efficiency, we consider this value to be the zero adoption scenario and 0 GJ/yr are saved (Table 3c).

For the other approaches, there is a clear baseline case of “zero adoption” where no substitutes or alternative fuels are in use. However, thermal energy input is an energy use indicator that represents a continuum with no clear baseline. We therefore had to benchmark future energy savings against an initial value, which we chose as 2022 since it provided the most recent available data. All future estimates represent annual GHG savings relative to global cement production’s 2022 GHG emissions levels.

left_text_column_width

Table 3. Current adoption level (2022).

Unit: Mt clinker avoided/yr

median (50th percentile) 980

Unit: Mt cement produced using alternative fuels/yr

median (50th percentile) 300

Unit: GJ thermal energy input/yr saved

median (50th percentile) 0
Left Text Column Width
Adoption Trend

Clinker material substitution has experienced relatively unchanged adoption worldwide in recent years (Table 4a). Since 2016, there has been a small increase in clinker-to-cement ratio, indicating a slight decrease in adoption of this approach (IEA, 2023a). This corresponds to 40 Mt fewer clinker material substitutes being used each year, on average. 

Alternative fuels adoption is slowly on the rise as percent of fuel mix (Table 4b). According to the IEA (2023c), the percentage of global clinker produced by bioenergy and waste fuels increased from 6.5% in 2015 to 8.5% in 2022. This corresponds to a median annual increase of 12 Mt cement/yr produced by alternative fuels. 

The IEA (2023c) reported process efficiency upgrades to have led to a median annual decrease of 5,000 GJ/Mt clinker from 2011 to 2022, representing a –0.14% annual change in energy input. This indicates that processes consuming thermal energy have become slightly more efficient in recent years. When converted to GJ/yr, this is 15 million fewer GJ thermal energy consumed each year (Table 4c).

left_text_column_width

Table 4. Adoption trend.

Unit: change in Mt clinker avoided/yr

median (50th percentile) –40

2016–2022 adoption trend

Unit: change in Mt cement produced using alternative fuels/yr

median (50th percentile) 12

2015–2022 adoption trend

Unit: annual change in GJ thermal energy input/yr

median (50th percentile) -15,000,000

2011–2022 adoption trend

Left Text Column Width
Adoption Ceiling

The adoption ceiling (Table 5a, Table 5b, Table 5c) is high for all approaches within this solution.

Clinker material substitution adoption is likely to be limited primarily by material standards and availability. Across literature, the median adoption ceiling is considered to be 3,000 Mt clinker avoided/yr beyond the Portland cement baseline, yielding a clinker-to-cement ratio of 0.2. Snellings (2016) calculated the worldwide amount of clinker materials substitutes and found that a maximum of ~2,000 Mt/yr would be available, which would result in a clinker-to-cement ratio of approximately 0.5. In the future, some waste materials – like fly ash and ground granulated blast furnace slag – are likely to be less available so increasing the possible substitute amounts would require research on new materials or cement properties.

Alternative fuels are typically assumed to be applicable to roughly 90% of cement production globally, or approximately 4,000 Mt cement/yr at 2022 global production levels (Daehn et al., 2022). In theory, kilns can use 100% alternative fuels, although composition of the fuel can influence the trace elements or calorific value (European Cement Research Academy, 2022). In particular, several analyses point to the lower calorific value of alternative fuels as an adoption-limiting factor. Cavalett et al. (2024) considered 90% to be the maximum. A separate analysis of Canadian cement production determined that 65% is the threshold due to lower-calorie fuels only being applicable in a precalciner kiln – the equipment where fuel is used to begin decomposing limestone through the calcination process (Clark et al., 2024).

Process efficiency upgrades have their adoption ceiling limited by the minimum thermal energy demand needed to run cement kilns. The European Cement Research Academy estimates this lower threshold of energy input to be approximately 2,300,000 GJ/Mt clinker, considering chemical reaction and evaporation energy needs (European Cement Research Academy, 2022). This converts to 6.9 billion GJ thermal energy used each year, or 3.6 billion GJ/yr saved over current thermal energy efficiency levels (Table 5c).

left_text_column_width

Table 5. Adoption ceiling.

Unit: Mt clinker avoided/yr

median (50th percentile) 3,000

Unit: Mt cement produced using alternative fuels/yr

median (50th percentile) 4,000

Unit: GJ thermal energy input/yr saved over current levels

median (50th percentile) 3,600,000,000

Lower limit for energy input

Left Text Column Width
Achievable Adoption

Clinker material substitution achievable adoption (Table 6a) is primarily limited by material availability and initial costs. Global estimates generally expect 30–50% of total substituted material to be reasonable, which correlates to a clinker-to-cement ratio of 0.4–0.6 and 1,000–2,000 Mt clinker avoided/yr (Habert et al., 2020; European Cement Research Academy, 2022). In a separate U.S.-specific analysis, the substitute amount was projected to vary from 5% to 45% depending on the availability and performance of the material substitute (Goldman et al., 2023).

Alternative fuels are projected to account for roughly 40% of the cement fuel mix in 2050 for both global and North American estimates. Taking the median of the global achievable adoption estimates, this correlates to 2,000 Mt cement/yr that would be produced using alternative kiln fuels. As a low estimate, if the current adoption trend holds, approximately 16% of global cement fuel (producing 610 Mt cement/yr) will come from biomass and waste (IEA, 2023c). A reasonable adoption range is 610–2,000 Mt cement/yr (Table 6b), although some European countries currently have ~80% adoption of alternative fuels, meaning that >40% adoption in an aggressive 2050 scenario may be feasible (Cavalett et al., 2024).

Little information exists on projected global adoption of process efficiency upgrades between now and 2050. In an analysis of a fraction of cement plants in China, India, and the U.S., it was estimated that these three countries – which represent more than 70% of current cement production worldwide – could reach a thermal energy input of 3.15–3.25 million GJ/Mt clinker by 2060, or 9.30–9.59 billion GJ/yr, which is 0.886–1.18 billion GJ/yr saved over current adoption levels (Table 6c; Cao et al., 2021). Meanwhile, in a European analysis, the European Cement Research Academy found the same range to be possible by 2050 (European Cement Research Academy, 2022). This is not significantly lower than the current state due to the fact that the highest-producing countries – China and India – have newer manufacturing facilities with more efficient equipment today. Countries with more room to improve in thermal energy efficiency – such as the U.S. – produce only a small fraction of the world’s cement. Approximately 92% of global plants are estimated to use more efficient dry kiln technology, indicating that some of the more energy-saving equipment upgrades are already highly adopted (Isabirye & Sinha, 2023). Therefore, there is less room for increased adoption in kiln technologies worldwide, although electrical efficiency measures could further improve these values.

 While the estimates for tonnage of cement impacted by these approaches are based on 2022 global production numbers, cement production will change through 2050, meaning the impacted mass of cement will also change as these emissions-reducing measures are adopted (IEA, 2023b).

left_text_column_width

Table 6. Range of achievable adoption levels.

Unit: Mt clinker avoided/yr

Current Adoption 980
Achievable – Low 1,000
Achievable – High 2000
Adoption Ceiling 3000

Unit: Mt cement produced using alternative fuels/yr

Current Adoption 300
Achievable – Low 610
Achievable – High 2,000
Adoption Ceiling 4,000

Unit: GJ thermal energy input/yr saved over current adoption levels

Current Adoption 0
Achievable – Low 886,000,000
Achievable – High 1,180,000,000
Adoption Ceiling 3,600,000,000

Note: High adoption in this case results in lower energy use for each unit of clinker produced, and thus better efficiency. 

Left Text Column Width

Improved cement production has high potential for climate impact. Since cement production is responsible for 7–8% of global GHG emissions, mitigating even a portion of these emissions will meaningfully reduce the world’s carbon output. 

Clinker material substitution has the highest current and potential GHG emissions savings of the three approaches (Table 7a). To calculate the climate impact, we used effectiveness and adoption on the basis of Mt clinker avoided. Climate impact was calculated as:

CO₂ abatedyear =CO₂ abatedclinker avoidedx  clinker avoidedyear 

  • Current GHG savings: 0.67 Gt CO₂‑eq/yr
  • GHG savings ceiling: 2 Gt CO₂‑eq/yr
  • Achievable GHG savings range: 0.7–1 Gt CO₂‑eq/yr

Alternative fuels have a low current climate impact but possess the potential to be adopted for a much greater fraction of the global kiln fuel mix (Table 7b). However, alternative fuels’ potential GHG emissions savings are lower than those for clinker material substitutes because alternative fuels have a lower CO₂ mitigation effectiveness. Climate impact is calculated as:

CO₂ abatedyear =CO₂ abatedcement producedx  cement producedyear 

  • Current GHG savings: 0.03 Gt CO₂‑eq/yr
  • GHG savings ceiling: 0.4 Gt CO₂‑eq/yr
  • Achievable GHG savings range: 0.06–0.2 Gt CO₂‑eq/yr

Process efficiency upgrades are the most challenging to assess for climate impact because they represent a broad range of equipment upgrades with no clear baseline efficiency. We considered adoption to be energy savings from the current (2022) baseline in GJ thermal energy input/yr. We converted adoption to climate impact using the emission factor of 0.0847 t CO₂‑eq /GJ thermal energy input (calculated using data from Gómez & Watterson et al., 2006 and IEA, 2023c). The resulting calculation is as follows:

CO₂ abatedyear =CO₂ emissionsthermal energyx  thermal energy savings from 2022 baselineyr 

  • Current GHG savings: N/A (we consider the current adoption to be the baseline)
  • GHG savings ceiling: 0.31 Gt CO₂‑eq/yr less than 2022
  • Achievable GHG savings range: 0.0760–0.101 Gt CO₂‑eq/yr less than 2022

While clinker material substitution, alternative fuels, and process efficiency upgrades are quantified separately here, the adoption of any of these approaches will reduce the climate impact of the others. In particular, the climate impacts for technologies that reduce emissions per Mt of clinker (such as alternative fuels and process efficiency upgrades) will be lower when implemented along with technologies that reduce the amount of clinker used (such as clinker material substitution), and vice versa (Glenk et al., 2023). Therefore, these impacts will not be additive, although they will contribute to reduced emissions when implemented together.

While our analysis found clinker material substitution to have the highest climate impact, cement manufacturers will have to prioritize these technologies depending on their plant’s existing equipment, local availability of materials, and regional cement standards.

left_text_column_width

Table 7. Climate impact at different levels of adoption.

Unit: Gt CO₂‑eq/yr, 100-yr basis

Current Adoption 0.67
Achievable – Low 0.7
Achievable – High 1
Adoption Ceiling 2

Unit: Gt CO₂‑eq/yr, 100-yr basis

Current Adoption 0.03
Achievable – Low 0.06
Achievable – High 0.2
Adoption Ceiling 0.4

Unit: Gt CO₂‑eq/yr, 100-yr basis

Current Adoption N/A
Achievable – Low 0.075
Achievable – High 0.100
Adoption Ceiling 0.31
Left Text Column Width
Additional Benefits

The main non-climate benefits of improved cement production are reduced air pollution and improved public health.

Air Quality 

Cement production is a major contributor to air pollution. Globally, concrete production accounts for approximately 8% of nitrogen oxide emissions, 5% of sulfur oxide emissions, and 5% of particulate matter emissions, with a significant portion of all these emissions stemming exclusively from cement production (Miller & Moore, 2020)Cement-related air pollution is especially acute in China, which produces over 50% of the world’s cement (U.S. Geological Survey, 2024). In 2009, China's cement industry emitted 3.59 Mt of particulate matter, making the industry the leading source of particulate matter emissions in the country (Yang et al., 2013). China also released 0.88 Mt of sulfur dioxide, accounting for about 4% of the national total, and emitted 1.7 Mt of nitrogen oxides (Yang et al., 2013). Process efficiency upgrades in cement manufacturing can reduce these harmful emissions. For example, implementing energy efficiency measures in China’s cement industry could reduce particulate matter by more than 3%, lower sulfur dioxide emissions by more than 15%, and decrease nitrogen oxide emissions by more than 12% by 2030 (Zhang et al., 2015). In Jiangsu province, which is the largest cement producer in China, energy and CO₂ reduction techniques could cut particulate matter and nitrogen oxide emissions by 30% and 56%, respectively, by 2030 (Zhang et al., 2018).

Health 

Miller & Moore (2020) estimated that the health damages associated with cement production amounted to approximately US$60 billion globally in 2015. These health damages are due to air pollutants produced during cement manufacturing, which would be reduced by this solution as described above. In China, one study estimated that improving energy efficiency in the Jing Jin Ji region’s cement industry could prevent morbidity in 17,000 individuals (Zhang et al., 2021). 

left_text_column_width
Risks

According to the U.S. Federal Highway Administration (n.d.), the use of clinker material substitutes in cement slows concrete curing times. Additionally, some clinker material substitutes, such as fly ash, raise ecotoxicity concerns and require safe handling (U.S. Department of Energy, 2022). Robust research and development is needed for new compositions of cement to accelerate testing, standardization, and adoption (Griffiths et al., 2023). Since regional standards vary for cement and concrete, policy and regulatory support designed for specific locations will be necessary to influence adoption levels and rates.

Most clinker material substitutes have limited or regional availability, leading to shortages, high costs, and transportation emissions (Habert et al., 2020). Because some substitute materials are sourced from the waste streams of other industries, such as the coal and steel industries, the long-term feasibility of sourcing these materials is uncertain (Goldman et al., 2023; Juenger et al., 2019). However, one study found that most leading cement-producing countries have substitute materials available in sufficient quantities to replace at least half of their current clinker usage (Shah et al., 2022). 

In terms of risks associated with alternative fuels, they can be subject to regional scarcity. Lack of available waste fuel in particular could risk non-waste biomass burning, leading to deforestation and high net emissions (de Puy Kamp, 2021). In addition, waste fuels can have varying compositions that can lead to different heats of combustion, kiln compatibility, or emitted pollutants (Griffiths et al., 2023). Finally, the use of waste products requires cement plants to be situated near industrial waste sources, risking low adoption for cement plants that are not located near a waste source. 

left_text_column_width
Interactions with Other Solutions

Reinforcing

Lower-carbon cement will improve the effectiveness and enhance the net climate impact of any solutions that might require new construction. The embodied emissions from the cement and concrete used for new built structures or roads will be reduced.

left_text_column_width

Technological advancements and increased adoption of efficient cement manufacturing equipment will improve the rate and cost of scaling similar high-efficiency machinery.

left_text_column_width

Industrial electrification in cement plants will be faster and easier to adopt if the plants’ energy demands are lowered via reduced clinker production and more efficient processes.

left_text_column_width

Competing

All of these solutions rely on biomass as a raw material or feedstock. For that reason, the use of biomass as an alternative kiln fuel or a source of ash for clinker substitutes will reduce the overall availability of biomass and increase the cost of using it for other applications.

left_text_column_width
Dashboard

Solution Basics

Mt clinker avoided/yr

tCO2-eq/unit
690,000
units
Current 9801,0002,000
Achievable (Low to High)

Climate Impact

GtCO2-eq/yr
Current 0.67 0.71
US$ per tCO2-eq
-30
Gradual

CO₂

Solution Basics

Mt cement produced using alternative fuels/yr

tCO2-eq/unit
96,000
units
Current 3006102,000
Achievable (Low to High)

Climate Impact

GtCO2-eq/yr
Current 0.03 0.060.2
US$ per tCO2-eq
-50
Gradual

CO₂

Solution Basics

GJ thermal energy input/yr reduced

tCO2-eq/unit
0.08
units
Current 08.86×10⁸1.18×10⁹
Achievable (Low to High)

Climate Impact

GtCO2-eq/yr
0.080.1
US$ per tCO2-eq
-60
Gradual

CO₂

Trade-offs

Wider adoption of clinker material substitutes, alternative fuels, and process efficiency upgrades could generate new GHG emissions, including emissions stemming from the transportation of clinker material substitutes and alternative fuels as well as embodied emissions from manufacturing and installing new cement plant equipment. Nevertheless, the overall solution effectiveness is not expected to be significantly impacted. In some of the largest cement-producing countries, the emissions from transport of clinker material substitutes has been calculated to be an order of magnitude less than the emissions savings from the use of those substitutes in place of clinker (Shah et al., 2022). 

In terms of environmental impact, some clinker substitutes such as calcined clays and natural pozzolans can increase water use (Juenger et al., 2019; Snellings et al., 2023). Additionally, the use of biomass as an alternative fuel source could lead to trade-offs – such as increased water use and land use, or diminished resource availability – although the risk of this outcome is low since biomass for kiln fuels tends to be agricultural by-products or other waste (Clark et al., 2024; Georgiopoulou & Lyberatos, 2018). 

left_text_column_width
Mt CO2-eq
< 2
2 - 4
4 - 6
6 - 8
8 - 10
> 10

Annual cement plant emissions, 2024

Cement production is responsible for approximately 4% of global GHG emissions. This is partly due to burning fossil fuels to run kilns and partly due to CO2 emissions associated with the chemistry of producing clinker, a key component of cement.

Sinha, A. and Crane, V. (2024). Manufacturing and industrial processes sector: Cement manufacturing emissions [Data set]. TransitionZero, Climate TRACE Emissions Inventory. Retrieved February 11, 2025, from https://climatetrace.org

Geographic Guidance Introduction

There are no location-specific constraints to the effectiveness of the Improve Cement Production solution as there are for solutions dependent on climatic factors. However, there is geographic variation associated with current uptake of solutions and feasibility/expense of future uptake. Moreover, the distribution of cement-producing facilities around the world is non-uniform, thus the solution set naturally has the greatest applicability in regions with the greatest concentration of cement production. China and India have particularly high production of cement at 51% and 8% of global totals in 2024, respectively (Sinha & Crane, 2024).

Newer cement plants are more likely to have high thermal efficiencies, and the age of cement plants varies around the world, with average ages of cement plants less than 20 years in much of Asia, and greater than 40 years in much of the US and Europe.

Uptake of alternative fuels is relatively high in Europe and low in the Americas.  

While use of clinker substitutes is in principle possible anywhere, the materials themselves are not readily available everywhere, thus transportation costs and associated emissions can place constraints on their viability (Shah et al., 2022).

Action Word
Improve
Solution Title
Cement Production
Current State Introduction

Our analysis of the current state of solutions for improved cement production included three separate approaches to reducing emissions: clinker material substitution, alternative fuels, and process efficiency upgrades. Each approach had adoption units chosen based on data availability and consistency between calculated values. Figure 2 summarizes the units and conversions used for all approaches (Habert et al., 2020).

left_text_column_width

Figure 2: Units of quantification used in the Current State, Adoption, and Impacts analyses below.

Approach Clinker material substitution Alternative fuels Process efficiency upgrades
Effectiveness

t CO₂-eq abated/Mt clinker avoided*

t CO₂ abated/Mt cement produced*

t CO₂-eq abated/Mt cement produced

t CO₂-eq abated/GJ thermal energy input**

t CO₂-eq abated/Mt cement produced**

Cost US$/Mt cement produced US$/Mt cement produced US$/Mt cement produced
Adoption Mt clinker avoided/yr Mt cement/yr produced using alternative fuels GJ thermal energy input saved/yr
Climate impact Gt CO₂-eq/yr Gt CO₂-eq/yr Gt CO₂-eq/yr

*Clinker material substitution effectiveness was calculated in two different adoption units using the same source data. Effectiveness in t CO₂‑eq abated/Mt cement produced was used to calculate cost per climate impact. Effectiveness was converted to t CO₂‑eq abated/Mt clinker avoided using the clinker-to-cement ratio for each individual study in the analysis, and this was used to calculate climate impact.

**Process efficiency upgrades effectiveness in units of t CO₂‑eq abated/Mt cement produced was used to calculate cost per climate impact. Separately, a calculated fuel emission factor effectiveness in units of t CO₂‑eq abated/GJ thermal energy was used to quantify climate impact.

Enable Download
On
Classification
Highly Recommended
Lawmakers and Policymakers
  • Hold cement manufacturers accountable for safety standards.
  • Regulate clinker material substitution, alternative fuel usage, and process efficiency upgrades.
  • Set standards for low-carbon cement and reporting on embodied carbon for new projects.
  • Provide financial incentives such as grants, subsidies, and/or carbon taxes.
  • Set low-carbon cement standards for public procurement.
  • Implement building codes and standards that allow for the safe, tested use of low-clinker cement while accounting for regional variability in cement compositions.
  • When possible integrate low-carbon cement standards into industry standards such as LEED certification or CALGreen.
  • Increase investment in research and development of clinker material substitutes.
  • Promote a circular economy by creating reverse supply chains to collect industrial and biomass waste to be used as feedstocks for cement kilns and products.
  • Require labels for low-carbon products and materials.
  • Engage impacted communities and incorporate public feedback into policy design.
  • Ensure permit processes for mining or collecting clinker substitutes allow local supply chains to develop.
  • Integrate water management into policy planning when adopting new cement technologies, especially in drought-prone areas.
Practitioners
  • Increase the fraction of clinker substitutes in cement, which will reduce production costs.
  • Use alternative fuels as manufacturing energy sources, ideally from renewable sources when possible, which will reduce production costs.
  • Upgrade equipment and production process to be more efficient, which will reduce production costs.
  • Invest in research and development for clinker material substitutes and process improvements.
  • Work to form national and regional industrial strategies for low-carbon cement.
  • Join industry coalitions such as the Global Cement and Concrete Association and/or Concrete Sustainability Council.
  • Engage with local community members and use their feedback to create safer and healthier production facilities.
  • Increase transparency and reporting around the energy usage of manufacturing processes, fuel composition, and the material composition of cement products.
  • Integrate water management safeguards when adopting new cement technologies, especially in drought-prone areas.
Business Leaders
  • Source from low-carbon cement producers.
  • Advocate for low-carbon cement during project design and construction.
  • Promote concrete alternatives in high-profile projects.
  • Purchase, promote, and/or invest in local manufacturing and supply chains not only for materials and equipment used to make low-carbon cement, but also for low-carbon cementitious products.
  • Create off-take agreements for emerging cement technologies.
  • Create training and capacity-building programs for industry professionals related to the use and benefits of low-carbon cement and concrete.
  • Launch education and awareness campaigns that share case studies and pilot projects with industry media and other key stakeholders.
  • Leverage carbon markets to help subsidize the cost of low-carbon cement.
  • Work with governments and financial institutions to establish standards and incentives for utilizing low-carbon materials.
Nonprofit Leaders
  • Assist with monitoring and reporting related to the energy usage of manufacturing processes, fuel composition, and the material composition of cement products.
  • Help design policies and regulations that support low-carbon cement production.
  • Educate the public about the urgent need for low-carbon cement while showcasing its many benefits.
  • Join or support efforts such as the Concrete Sustainability Council.
  • Encourage policymakers to create ambitious targets and regulations.
  • Encourage cement manufacturers to improve their practices.
Investors
  • Invest in low-carbon cement producers, low-carbon cement research and development, and shared recycling infrastructure for cement materials.
  • Invest in supply chains for new clinker substitutes, alternative fuels, and technologies that improve production efficiency.
  • Encourage portfolio companies to produce low-carbon cement or source from low-carbon cement producers, noting that low-carbon retrofits will save money for producers.
  • Seek impact investment opportunities, such as low-interest loans for construction or renovation projects that use low-carbon cement, or favorable loans for entities that set low-carbon cement policies or targets.
Philanthropists and International Aid Agencies
  • Set low-carbon cement standards for construction-related grants, loans, and awards.
  • Provide capital for local supply chains and the acquisition or production of clinker material substitutes.
  • Support global, national, and local policies that promote low-carbon cement use.
  • Support accelerators or multilateral initiatives like the Concrete Sustainability Council.
  • Explore opportunities to fund low-carbon cement start-ups.
  • Advance awareness of the public health and climate benefits of low-carbon cement. 
Thought Leaders
  • Provide technical assistance (e.g., circular economy design) to producers, government agencies, and other entities working to reduce cement emissions.
  • Help design policies and regulations that support the adoption of low-carbon cement.
  • Educate the public through campaigns emphasizing the urgent need to reduce cement production emissions.
  • Join or support efforts such as the Concrete Sustainability Council.
  • Encourage policymakers to create more ambitious targets and regulations.
  • Pressure the cement industry to improve its production practices.
Technologists and Researchers
  • Develop new separation technology for recycling cement material.
  • Assess new clinker substitutes and improve supply chains for known substitutes.
  • Improve the efficiency of processing technology and equipment.
  • Increase the safety of extraction, transport, handling, and processing of clinker material substitutes.
  • Develop on-site testing and reporting methods for tracking the energy use of manufacturing processes, fuel composition, and the material composition of cement products.
  • Examine and refine understandings of the potential revenue and price premiums of low-carbon cement products.
Communities, Households, and Individuals
  • Purchase low-carbon cement and concrete products when possible.
  • Document your experiences if harmful cement production practices impact you. Share documentation of harmful cement production practices and/or other key messages with policymakers, the media, and your community.
  • Encourage policymakers to improve regulations related to cement production.
  • Support public education efforts to raise awareness about the urgent need to make cement production practices more environmentally sustainable.
  • Pressure the cement industry to improve its production practices.
Evidence Base

Consensus of effectiveness in reducing cement industry emissions: High

The cement industry produces an estimated 7–8% of global CO₂ emissions (Goldman et al., 2023), so this is an important area to target. There is high scientific consensus that clinker material substitution, alternative fuels, and process efficiency upgrades can be immediately and effectively implemented. Other emissions reduction strategies – including hydrogen kiln fuel, electrification, and carbon capture and storage technologies – have generated mixed scientific opinions on their potential for immediate impact and were not considered in this analysis. 

The U.S. Department of Energy (2022) highlighted cement as one of five high-emitting industries with potential for mitigation. The technologies identified as having the highest level of maturity and market readiness were energy efficiency measures, biomass and natural gas fuels, material efficiency measures, and blended-material cements. 

An extensive review of industrial decarbonization points to four technologies that could be implemented in the near term across global industries: electrification, material efficiency, energy efficiency, and circularity (Rissman et al., 2020). The European Cement Research Academy (2022) classified the three cement industry approaches considered in this solution – clinker material substitution, alternative fuels, and process efficiency upgrades – as meeting the highest technology readiness level.

Goldman et al. (2023) identified clinker material substitution, alternative fuels, and efficiency improvements as deployable today, estimating that these three approaches could abate 30% of U.S. cement industry emissions by 2030. Habert et al. (2020) proposed technologies that could reduce emissions up to 50% in the next few decades, including “cement improvements” of supplementary clinker materials, alternative fuels, and more efficient technologies. The International Energy Agency (IEA, 2018) estimated that clinker material replacement, alternative fuels, and efficiency improvements could provide 37%, 12%, and 3% of cement emissions savings by 2050, respectively.

The results presented in this document summarize findings from two reviews and meta-analyses, eight original studies, nine reports, and several data sets reflecting current evidence from 33 countries, primarily high cement-producing countries in North America, Europe, and Asia. We recognize this limited geographic scope creates bias, and hope this work inspires research and data sharing on this topic in underrepresented regions.

left_text_column_width
Updated Date
Subscribe to Improve Materials