Physical and mental wellness, including prevention of illness, injury, and premature mortality

Icon

Improve Landfill Management

Image
Image
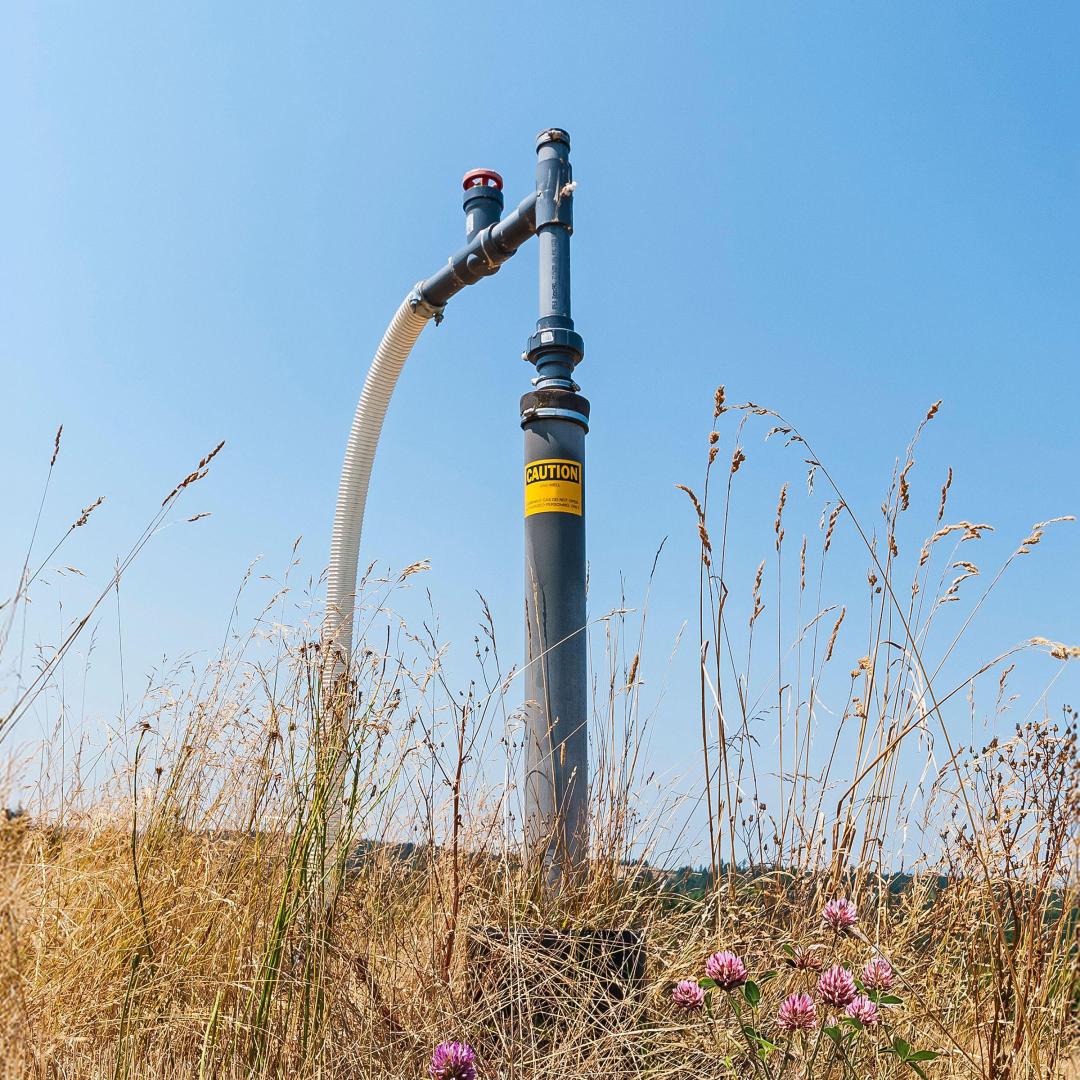
Methane tap valve from a landfill
Coming Soon
Off
Summary

Landfill management is the process of reducing methane emissions from landfill gas (LFG). As bacteria break down organic waste in an environment without oxygen, they produce methane and release it into the atmosphere if there are no controls in place. This solution focuses on two methane abatement strategies: 1) gas collection and control systems (GCCSs) and methane use/destruction, and 2) biocovers. When methane is used or destroyed it is converted into CO₂ (Garland et al., 2023).

Overview

Landfill management relies on several practices and technologies that prevent methane from being released into the atmosphere. When organic material is broken down, it creates LFG, which usually is half methane and half CO₂, and water vapor (U.S. Environmental Protection Agency [EPA], 2024a). Methane that is directly released into the atmosphere has a GWP of 81 over a 20-yr basis and a GWP of 28 over a 100-yr basis (Intergovernmental Panel on Climate Change [IPCC], 2023). This means methane is 81 times more effective at trapping heat than CO₂. Because methane is a short-lived climate pollutant that has a much stronger warming effect than CO₂ over a given time period, abating methane will have a relatively large near-term impact on slowing global climate change (International Energy Agency [IEA], 2023). LFG contains trace amounts of oxygen, nitrogen, sulfides, hydrogen, and other organic compounds that can negatively affect nearby environments with odors, acid rain, and smog (New York State Government, 2024).

Methods for reducing methane emissions can be put into two broad strategies (Garland et al., 2023):

GCCS and methane use/destruction utilizes pipes to route LFG to be used as an energy source or to flare. The gas can be used on-site for landfill equipment or refined into biomethane and sold; unrefined LFG can also be sold to local utilities or industries for their own use. In areas where electricity generation is carbon intensive, the LFG can help to reduce local emissions by displacing fossil fuels. Methane that can’t be used for energy is burned in a flare during system downtime or at the end of the landfill life, when LFG production has decreased and collecting it no longer makes economic sense. High-efficiency (enclosed) flares have a 99% methane destruction rate. Open flares can be used but research from Plant et al. (2022) has found that the methane destruction rate in practice is much lower than the 90% value the EPA assumes. 

Biocovers are a type of landfill cover designed to promote bacteria that convert methane to CO₂ and water. Biocovers have an organic layer that provides an environment for the bacteria to grow and a gas distribution layer to separate the landfill waste from the organic layer. Non-biocover landfill covers – made with impermeable material like clay or synthetic materials – can also be used to prevent methane from being released. The methane oxidation from these covers will be minimal – they mostly serve to limit LFG from escaping – but they can then be used in conjunction with GCCS to improve gas collection. Landfills also use daily and interim landfill covers. It is important to note that studies on biocover abatement potential and cost are limited and biocovers may not be appropriate for all situations.

Leak Detection and Repair (LDAR) involves regularly monitoring for methane leaks and modifying or replacing leaking equipment. LDAR does not directly reduce emissions but is used to determine where to apply the above technology and practices and is considered a critical part of methane abatement strategies. Methane can be monitored through satellites, drones, continuous sensors, or on-site walking surveys (Carbon Mapper, 2024). LDAR is an important step in identifying where methane escapes from the gas collection infrastructure or landfill cover. Quick repairs help reduce GHG emissions while allowing more methane to be used for energy or fuel. The Appendix shows where methane can escape from landfills.

References

Abichou, T. (2020). Using methane biological oxidation to partially finance sustainable waste management systems and closure of dumpsites in the Southern Mediterranean region. Euro-Mediterranean Journal for Environmental Integrationhttps://doi.org/10.1007/s41207-020-00157-z 

Auth, K., & Kincer, J. (2022). Untangling ‘stranded assets’ and ‘carbon lock-in’. Energy for Growth Hubhttps://energyforgrowth.org/article/untangling-stranded-assets-and-carbon-lock-in/ 

Ayandele, E., Frankiewicz, T., & Garland, E. (2024a). Deploying advanced monitoring technologies at US landfills. RMIhttps://rmi.org/wp-content/uploads/dlm_uploads/2024/03/wasteMAP_united_states_playbook.pdf 

Ayandele, E., Bodas, J., Krishnakumar, A., & Orakwe, L. (2024b). Mitigating methane emissions from municipal solid waste: A playbook for Lagos, Nigeria. RMIhttps://rmi.org/insight/waste-methaneassessment-platform/ 

Ayandele, E., Bodas, J., Gautam,l S., & Velijala, V. (2024c). Sustainable organic waste management: A playbook for Lucknow, India. RMIhttps://www.teriin.org/policy-brief/sustainable-organic-waste-management-playbook-lucknow-india 

Barton, D. (2020). Fourth five-year review report for Fresno municipal sanitary landfill superfund site Fresno county, California. U.S. Environmental Protection Agency. https://semspub.epa.gov/work/09/100021516.pdf 

Brender, J. D., Maantay, J. A., Chakraborty, J. (2011). Residential proximity to environmental hazards and adverse health outcomes. American Journal of Public Health, 101(S1). https://pmc.ncbi.nlm.nih.gov/articles/PMC3222489/pdf/S37.pdf 

Cai, B., Lou, Z., Wang, J., Geng, Y., Sarkis, J., Liu, J., & Gao, Q. (2018). CH₄ mitigation potentials from China landfills and related environmental co-benefits. Science Advances, 4(7). https://doi.org/10.1126/sciadv.aar8400 

Carbon Mapper (2024, March 28). Study finds landfill point source emissions have an outsized impact and opportunity to tackle U.S. waste methanehttps://carbonmapper.org/articles/studyfinds-landfill 

Casey, J. A., Cushing, L., Depsky, N., & Morello-Frosch, R. (2021). Climate justice and California's methane superemitters: Environmental equity assessment of community proximity and exposure intensity. Environmental Science & Technology, 55(21), 14746-14757. https://doi.org/10.1021/acs.est.1c04328 

City of Saskatoon. (2023). Landfill gas collection & power generation system. Retrieved September 2, 2024. https://www.saskatoon.ca/services-residents/power-water-sewer/saskatoon-light-power/sustainable-electricity/landfill-gas-collection-power-generation-system 

DeFabrizio, S., Glazener, W., Hart, C., Henderson, K., Kar, J., Katz, J., Pratt, M. P., Rogers, M., Ulanov, A., & Tryggestad, C. (2021). Curbing methane emissions: How five industries can counter a major climate threat. McKinsey Sustainability. https://www.mckinsey.com/~/media/mckinsey/business%20functions/sustainability/our%20insights/curbing%20methane%20emissions%20how%20five%20industries%20can%20counter%20a%20major%20climate%20threat/curbing-methane-emissions-how-five-industries-can-counter-a-major-climate-threat-v4.pdf 

Dobson, S., Goodday, V., & Winter, J. (2023). If it matters, measure it: A review of methane sources and mitigation policy in Canada. International Review of Environmental and Resource Economics16(3-4), 309–429. https://doi.org/10.1561/101.00000146

Fries, J. (2020, March 26). Unique landfill gas solution found. Penticton Heraldhttps://www.pentictonherald.ca/news/article_874b5c9c-6fb5-11ea-87ce-2b2aedf77300.html 

Garland E., Alves O., Frankiewicz T., & Ayandele E. (2023). Mitigating landfill methane. RMIhttps://rmi.org/wp-content/uploads/dlm_uploads/2023/06/landfill_monitoring_memo_series.pdf 

Global Climate & Health Alliance. (2024). Methane & health. Retrieved September 24, 2024. https://climateandhealthalliance.org/initiatives/methane-health/ 

Global Methane Initiative. (2022). Policy maker’s handbook for measurement, reporting, and verification in the biogas sectorhttps://www.globalmethane.org/resources/details.aspx?resourceid=5182

Global Methane Initiative (2024). 2023 accomplishments in methane mitigation, recovery, and use through U.S.-supported international efforts. https://www.epa.gov/gmi/us-government-global-methane-initiative-accomplishments 

Global Methane Pledge (2023). Lowering organic waste methane initiative (LOW-Methane). Retrieved March 6, 2025. https://www.globalmethanepledge.org/news/lowering-organic-waste-methane-initiative-low-methane 

Gómez-Sanabria, A., & Höglund-Isaksson, L. (2024). A comprehensive model for promoting effective decision-making and sustained climate change stabilization for South Africa. International Institute for Applied Systems Analysis. https://pure.iiasa.ac.at/id/eprint/19897/1/Final_Report_SAFR.pdf

Government of Canada. (2024). Canada gazette, part I, volume 158, number 26: Regulations respecting the reduction in the release of methane (waste sector). Retrieved September 2, 2024. https://canadagazette.gc.ca/rp-pr/p1/2024/2024-06-29/html/reg5-eng.html 

Industrious Labs. (2024a). The hidden cost of landfillshttps://cdn.sanity.io/files/xdjws328/production/657706be7f29a20fe54692a03dbedce8809721e8.pdf 

Industrious Labs. (2024b). Turning down the heat: How the U.S. EPA can fight climate change by cutting landfill emissionshttps://cdn.sanity.io/files/xdjws328/production/b562620948374268b8c6da61ec1c44960a8d5879.pdf 

Intergovernmental Panel on Climate Change. (2023). Sixth assessment report (AR6).https://www.ipcc.ch/assessment-report/ar6/ 

International Energy Agency. (2021). Global methane tracker 2021: Methane abatement and regulation. https://www.iea.org/reports/methane-tracker-2021/methane-abatement-and-regulation 

International Energy Agency. (2023). Net zero roadmap: A global pathway to keep the 1.5℃ goal in reach - 2023 update. https://www.iea.org/reports/net-zero-roadmap-a-global-pathway-to-keep-the-15-0c-goal-in-reach 

International Energy Agency. (2025). Methane tracker: Data tools. https://www.iea.org/data-and-statistics/data-tools/methane-tracker 

Krause, M. Kenny, S., Stephensons, J. & Singleton, A (2023). Food waste management: Quantifying methane emissions from landfilled food waste. U.S. Environmental Protection Agency. https://www.epa.gov/system/files/documents/2023-10/food-waste-landfill-methane-10-8-23-final_508-compliant.pdf

Malley, C. S., Borgford-Parnell, N. Haeussling, S., Howard, L. C., Lefèvre E. N., & Kuylenstierna J. C. I. (2023). A roadmap to achieve the global methane pledge. Environmental Research: Climate, 2(1). https://doi.org/10.1088/2752-5295/acb4b4 

Martin Charlton Communications. (2020). Features : Landfill biocovers. APEGShttps://www.apegs.ca/features-landfill-biocovers 

Martuzzi, M., Mitis, F., & Forastiere, F. (2010). Inequalities, inequities, environmental justice in waste management and health. European Journal of Public Health, 20(1), 21-26. https://doi.org/10.1093/eurpub/ckp216 

MethaneSAT. (n.d.). Solving a crucial climate challenge. Retrieved September 2, 2024. https://www.methanesat.org/satellite/ 

Nesser, H., Jacob, D. J., Maasakkers, J. D., Lorente, A., Chen, Z., Lu, X., Shen, L., Qu, Z., Sulprizio, M. P., Winter, M., Ma, S., Bloom, A. A., Worden, J. R., Stavins, R. N., & Randles, C. A. . (2024). High-resolution US methane emissions inferred from an inversion of 2019 TROPOMI satellite data: Contributions from individual states, urban areas, and landfills. Atmospheric Chemistry and Physics24, 5069-5091 https://doi.org/10.5194/acp-24-5069-2024 

New York State Government. (2024). Important things to know about landfill gas. Retrieved September 3, 2024. https://www.health.ny.gov/environmental/outdoors/air/landfill_gas.htm 

Nisbet, E. G., Fisher, R. E., Lowry, D., France, J. L., Allen, G., Bakkaloglu, S., Broderick, T. J., Cain, M., Coleman, M., Fernandez, J., Forster, G., Griffiths, P. T., Iverach, C. P., Kelly, B. F. J., Manning, M. R., Nisbet-Jones, P. B. R., Pyle, J. A., Townsend-Small, A., al-Shalaan, A., Warwick, N., & Zazeri, G. (2020). Methane mitigation: Methods to reduce emissions,on the path to the Paris agreement. Review of Geophysics, 58(1). https://doi.org/10.1029/2019RG000675 

Ocko, I. B., Sun, T., Shindell, D., Oppenheimer, M. Hristov, A. N., Pacala, S. W., Mauzerall, D. L., Xu, Y. & Hamburg, S. P. (2021). Acting rapidly to deploy readily available methane mitigation measures by sector can immediately slow global warming. Environmental Research, 16(5). https://doi.org/10.1088/1748-9326/abf9c8 

Olaguer, E. P. (2021). The potential ozone impacts of landfills. Atmosphere, 12(7), 877. https://doi.org/10.3390/atmos12070877 

Plant, G., Kort, E. A., Brandt, A. R., Chen, Y., Fordice, G., Negron, A. M. G., Schwietzke, S., Smith, M., & Zavala-araiza, D. (2022). Estimates of solid waste disposal rates and reduction targets for landfill gas emissions. Science, 377(6614), 1566-1571 https://doi.org/10.1126/science.abq0385 

Powell J. T., Townsend, T. G., & Zimmerman, J. B. (2015). Estimates of solid waste disposal rates and reduction targets for landfill gas emissions. Nature Climate Change6, 162-165 https://www.nature.com/articles/nclimate2804

SaveOnEnergy. (2024). Landfills: The truths about trash dumps by the numbers. Retrieved September 2, 2024. https://www.saveonenergy.com/resources/landfill-statistics/ 

Scarapelli, T. R., Cusworth, D. H., Duren, R. M., Kim, J., Heckler, J., Asner, G. P., Thoma, E., Krause, M. J., Heins, D., & Thorneloe, S. (2024). Investigating major sources of methane emissions at US landfills. Environmental Science & Technology58(29). https://doi.org/10.1021/acs.est.4c07572

Scharff, H. Soon, H., Taremwa, S. R., Zegers, D., Dick, B., Zanon, T. V. B., & Shamrock, J. (2023). The impact of landfill management approaches on methane emissions. Waste Management & Researchhttps://doi.org/10.1177/0734242X231200742 

Scheutz, C., Pedersen, R. B., Petersen, P. H., Jørgensen, J. H. B., Ucendo, I. M. B., Mønster, J. G., Samuelsson, J., Kjeldsen, P. (2014). Mitigation of methane emission from an old unlined landfill in Klintholm, Denmark using a passive biocover system. Waste Management34(7), 1179-1190. https://doi.org/10.1016/j.wasman.2014.03.015 

Siddiqua, A., Hahladakis, J.N. & Al-Attiya, W.A.K.A. (2022). An overview of the environmental pollution and health effects associated with waste landfilling and open dumping. Environmental Science and Pollution Research 29, 58514–58536 https://doi.org/10.1007/s11356-022-21578-z 

Sperling Hansen Associates (2020). 7 Mile landfill operational biocover studyhttps://www.rdmw.bc.ca/media/2020%2003%2017%207Mile%20Landfill%20Operational%20Biocover%20Study.pdf 

Stern, J. C., Chanton, J., Ahicou, T., Powelson, D., Yuan, L., Escoriza, S. & Bogner, J.. (2007). Use of a biologically active cover to reduce landfill methane emissions and enhance methane oxidation. Waste Management 27(9), 1248-1258 https://doi.org/10.1016/j.wasman.2006.07.018 

Stone, E. (2023, September 7). Landfills: 'Zombie' landfills emit tons of methane decades after shutting down. Here's why that's a big problem. LAist. https://laist.com/news/climate-environment/zombie-landfills-emit-tons-of-methane-decades-after-shutting-down-heres-why-thats-a-big-problem 

Sweeptech. (2022). What is a landfill site’s environmental impact?. Retrieved March 7, 2025. https://www.sweeptech.co.uk/what-is-a-landfill-site-and-how-does-landfill-impact-the-environment/#:~:text=The%20average%20size%20of%20a,for%20these%20massive%20waste%20dumps

Tangri, N. (2010). Respect for recyclers: Protecting the climate through zero waste. Gaia. https://www.no-burn.org/wp-content/uploads/2021/11/Respect-for-Recyclers-English_1.pdf 

Towprayoon, S., Ishigaki, T., Chiemchaisri, C., & Abdel-Aziz, A. O. (2019). Chapter 3: Solid waste disposal. In 2019 refinement to the 2006 IPCC guidelines for national greenhouse gas inventories. International Panel on Climate Change. https://www.ipcc-nggip.iges.or.jp/public/2019rf/pdf/5_Volume5/19R_V5_3_Ch03_SWDS.pdf

Trashcans Unlimited. (2022). Biggest landfill in the world. Retrieved March 7, 2025. https://trashcansunlimited.com/blog/biggest-landfill-in-the-world/ 

UN Environment Program. (2021). Global methane assessment: Benefits and costs of mitigating methane emissions. https://www.unep.org/resources/report/global-methane-assessment-benefits-and-costs-mitigating-methane-emissions 

U.S. Environmental Protection Agency. (2019). Global non-CO₂ greenhouse gas emission projections & mitigation 2015 - 2050https://www.epa.gov/ozone-layer-protection/transitioning-low-gwp-alternatives-residential-and-commercial-air

U.S. Environmental Protection Agency. (2024a). Basic information about landfill gas. Retrieved September 2, 2024. https://www.epa.gov/lmop/basic-information-about-landfill-gas 

U.S. Environmental Protection Agency. (2024b). Benefits of landfill gas energy projects. Retrieved September 23, 2024. https://www.epa.gov/lmop/benefits-landfill-gas-energy-projects 

U.S. Environmental Protection Agency. (2025). Accomplishments of the landfill methane outreach program. Retrieved March 5, 2025. https://www.epa.gov/lmop/accomplishments-landfill-methane-outreach-program 

Van Dingenen, R., Crippa, M., Maenhout, G., Guizzardi, D., & Dentener, F. (2018). Global trends of methane emissions and their impacts on ozone concentrations. European Commission. https://op.europa.eu/en/publication-detail/-/publication/c40e6fc4-dbf9-11e8-afb3-01aa75ed71a1/language-en 

Vasarhelyi, K. (2021, April 15). The hidden damage of landfills. University of Colorado Boulderhttps://www.colorado.edu/ecenter/2021/04/15/hidden-damage-landfills#:~:text=The%20average%20landfill%20size%20is,liners%20tend%20to%20have%20leaks 

Waste Today. (2019, June 26). How landfill covers can help improve operations. Retrieved April 13, 2025. https://www.wastetodaymagazine.com/news/interim-daily-landfill-covers/ 

Zhang, T. (2020, May 8). Landfill earth: A global perspective on the waste problem. Universitat de Barcelonahttps://diposit.ub.edu/dspace/bitstream/2445/170328/1/Landfill%20Eart.%20A%20Global%20Perspective%20on%20the%20Waste%20Problem.pdf 

Credits

Lead Fellow

  • Jason Lam

Contributors

  • Yusuf Jameel

  • Daniel Jasper

  • James Gerber

  • Alex Sweeney

Internal Reviewers

  • Erika Luna

  • Paul West

  • Amanda Smith

  • Aiyana Bodi

  • Hannah Henkin

  • Ted Otte

Effectiveness

According to the IPCC, preventing 1 Mt of emitted methane avoids 81.2 Mt CO₂‑eq on a 20-yr basis and 27.9 Mt CO₂‑eq on a 100-yr basis (Smith et al., 2021, Table 1). If the methane is burned (converted into CO₂), the contribution to GHG emissions is still less than that of methane released directly into the atmosphere. Methane abatement can immediately limit future global climate change because of its outsized impact on global temperature change, especially when looking at a 20-yr basis.

left_text_column_width

Table 1. Effectiveness at reducing emissions.

Unit: tCO₂‑eq/Mt of methane abated

100-yr GWPl 27,900,000
Left Text Column Width
Cost

To abate 1 Mt of methane, GCCS and methane use/destruction have an initial cost of around US$410 million, an operating cost of roughly US$191 million, and revenue in the neighborhood of US$383 million. The net savings over a 30-yr amortization period is US$179 million. This means capturing and selling landfill methane will be a net economic gain for most landfill operators. We included LDAR operating costs in the overall operating costs for GCCS and methane use/destruction, although LDAR can be used prior to installation or with other strategies such as biocovers. We split the median costs for GCCS and methane use/destruction between 20-yr and 100-yr GWP (Table 2a).

Biocovers have an initial cost to abate 1 Mt of methane around US$380 million, operating costs of roughly US$0.4 million, and revenue of about US$0 million, and an overall net cost over a 30-yr amortization period of US$13 million. This means that using biocovers to abate landfill methane has a net cost. If a carbon credit system is in place, biocovers can recoup the costs or generate profits. Biocovers are reported to have lower installation and operation costs than GCCS because they are simpler to install and maintain, and can be used where local regulations might limit a landfill operator’s ability to capture and use methane (Fries, 2020). Table 2b shows that the median costs for biocovers are split between 20-yr and 100-yr GWP.

We found very limited data for the baseline scenario, which follows current practices without methane abatement. We considered the baseline costs to be zero for initial costs, operational costs, and revenue because landfills without management – such as open landfills or sanitary landfills with no methane controls – release methane as part of their regular operations, do not incur additional maintenance or capital costs, and lack any energy savings from capturing and using methane.

Few data were available to characterize the initial costs of implementing landfill methane capture. We referenced reports from Ayandele et al. (2024a), City of Saskatoon (2023), DeFabrizio et al. (2021), and Government of Canada (2024), but the context and underlying assumptions costs were not always clear. 

Landfills are typically 202–243 ha (Sweeptech, 2022); however, the size can vary greatly, with the world’s largest landfill covering 890 ha (Trashcans Unlimited, 2022). Because larger landfills make more methane, facility size helps determine which methane management strategies make the most sense. We assumed the average landfill covered 243 ha when converting costs to our common unit

Data on revenues from the sale of collected LFG are also limited. We found some reports of revenue generated at a municipal level or monetized benefits from GHG emission reductions priced according to a social cost of methane or carbon credit system (Abichou, 2020; Government of Canada, 2024). These values may not apply at a global scale, especially when the credits are supported by programs such as the United States’ use of Renewable Identification Numbers.

left_text_column_width

Table 2. Cost per unit climate impact.

Unit: 2023 US$/t CO₂‑eq

Median (100-yr basis) -6.42
Median (20-yr basis) -2.21

Unit: 2023 US$/t CO₂‑eq

Median (100-yr basis) 0.47
Median (20-yr basis) 0.16
Left Text Column Width
Learning Curve

Landfill GCCSs are mature; we do not foresee declining implementation costs for these solutions due to extensive use of the same installation equipment and materials in other industries and infrastructure. Automation of GCCS settings and monitoring may improve efficiencies, but installation costs will stay largely the same. 

Landfill covers are a mature technology, having been used to control odors, fires, litter, and scavenging since 1935 (Barton, 2020). Biocover landfill cover costs could decrease as recycled organic materials are increasingly used in their construction. It is not clear how the cost of biocovers might decrease as adoption grows. 

Though LDAR might provide gains around efficiencies, little research offers insights here.

left_text_column_width
Speed of Action

Speed of action refers to how quickly a climate solution physically affects the atmosphere after it is deployed. This is different from speed of deployment, which is the pace at which solutions are adopted.

At Project Drawdown, we define the speed of action for each climate solution as gradualemergency brake, or delayed.

Improve Landfill Management is an EMERGENCY BRAKE climate solution. It has the potential to deliver a more rapid impact than nominal and delayed solutions. Because emergency brake solutions can deliver their climate benefits quickly, they can help accelerate our efforts to address dangerous levels of climate change. For this reason, they are a high priority.

left_text_column_width
Caveats

Approximately 61% of methane generated from food waste happens within 3.6 years of being landfilled (Krause, et al., 2023). In the United States, the EPA requires GCCS to be installed after five years of the landfill closing, meaning that much of the food waste methane will evade GCCS before it is installed (Industrious Labs, 2024b). In contrast, biocovers can quickly (up to three months) reduce methane emissions once the bacteria have established (Stern et al., 2007). GCCS and biocovers should be installed as soon as possible to capture as much of the early methane produced from food waste. Due to unstable methane production during early- and end-of-life gas production, low-calorific flares or biocovers may be needed to destroy any poor-quality gas that has collected. Strategies that prevent organic waste from being deposited at landfills are captured in other Project Drawdown solutions: Deploy Methane Digesters, Increase Composting, and Reduce Food Loss and Waste.

The effectiveness of landfill management depends on methane capture and destruction efficiency. The EPA previously assumed methane capture efficiency to be 75% and then revised it to 65%; however, the actual recovery rate in the United States is closer to 43% (Industrious Labs, 2024b). 

Our assessment does not include the impact of the CO₂ created from the destruction of methane.

left_text_column_width
Current Adoption

We found little literature quantifying the current adoption of LFG methane abatement. We estimate that GCCS and methane use/destruction strategies account for approximately 1.6 Mt/yr of abated global methane. 

We did not find unaggregated data about current adoption of biocovers or global data for landfill methane abatement that we could use to allocate the contribution to each landfill methane abatement strategy. A large portion of data for current adoption is from sources focused on landfills in the U.S.. Around 70 Mt of methane is currently being emitted globally from landfills in 2024 (IEA, 2025; Ocko et al., 2021). 

Table 3a shows the statistical ranges among the sources we found for current adoption of GCCS and methane use/destruction strategies. We were not able to find sources measuring the current adoption of biocovers and the amount of methane abated and assume it was 0 in 2023 (Table 3b).

The EPA’s Landfill Methane Outreach Program helps reduce methane emissions from U.S. landfills. The program has worked with 535 of more than 3,000 U.S. landfills (EPA, 2024; Vasarhelyi, 2021). Global Methane Initiative (GMI) members abated 4.7 Mt of methane from 2004 to 2023 (GMI, 2024). Because GMI members cover only 70% of human-caused methane emissions overall – including wastewater and agricultural emissions this is an overestimate of current landfill methane abatement. Holley et al. (2024) determined that while some methane abatement was occuring in Mexico, only 0.13 Mt of methane was abated from 2018 to 2020, which is about 12% of Mexico’s 2021 solid waste sector methane emissions. India and Nigeria recently installed some GCCS and methane use/destruction systems, but these are excluded from our analysis due to unclear data (Ayandele et al., 2024b; Ayandele et al., 2024c). Industrious Labs (2024b) found that GCCS were less common than expected – the EPA assumes a 75% gas recovery rate for well-managed landfills. A study on Maryland landfills found that only half had GCCS in place, with an average collection efficiency of 59% (Industrious Labs, 2024b). 

left_text_column_width

Table 3. Current (2023) adoption level.

Unit: Mt/yr methane abated

25th percentile 1.26
mean 1.64
median (50th percentile) 1.59
75th percentile 2.00

Unit: Mt/yr methane abated

25th percentile 0
mean 0
median (50th percentile) 0
75th percentile 0
Left Text Column Width
Adoption Trend

Few studies explicitly quantify the adoption of methane abatement technologies over time; we estimated the adoption trend to be 0.22 Mt/yr of methane abated – mainly from GCCS and methane use/destruction. We were not able to find unaggregated data for the adoption trend of biocovers, so we estimated adoption from EPA (2024), GMI (2024), Industrious Labs (2024b), and Van Dingenen et al. (2018). The EPA (2024) provided adoption data for a limited number of U.S. landfills that showed increasing methane abatement 2000–2013, a plateau 2013–2018, and slower progress 2018–2023 (Figure 2).

left_text_column_width
Enable Download
Off

GMI (2024) show a gradual increase in methane abatement 2011–2022. However, these data do not differentiate landfill methane abatement from other abatement opportunities, and even include wastewater systems and agriculture. When the GMI (2024) data are used to estimate adoption trends, they result in an overestimate. Van Dingenen et al. (2018) attributed a decreasing trend in landfill methane emissions 1990–2012 to landfill regulations implemented in the 1990s. Table 4a shows statistical ranges among the sources we found for the adoption trend of landfill methane strategies. Due to a lack of sources, we assume a zero value for the adoption trend of biocovers (and the amount of methane abated) as shown in Table 4b.

left_text_column_width

Table 4. 2011–2022 adoption trend.

Unit: Mt/yr methane abated

25th percentile 0.05
mean 0.38
median (50th percentile) 0.22
75th percentile 0.54

Unit: Mt/yr methane abated

25th percentile 0
mean 0
median (50th percentile) 0
75th percentile 0
Left Text Column Width
Adoption Ceiling

GCCS and methane use/destruction have an estimated adoption ceiling of 70 Mt/yr of methane abated based on the IEA’s (2025) estimate for methane emissions from the landfill waste sector. We assumed that current landfill methane emissions would remain the same into the future with no changes in waste produced or waste diversion employed.

Biocovers have an estimated adoption ceiling of 70 Mt/yr of methane based on the IEA’s (2025) estimate for methane emissions from the landfill waste sector. We assumed that current landfill methane emissions would remain the same into the future with no changes in waste produced or waste diversion employed.

The maximum possible abatement of LFG methane critically depends on the efficiency of the abatement technology; Powell et al. (2015) found that closed landfills (those not actively receiving new waste) were 17% more efficient than open landfills. Even so, research from Nesser et al. (2024) found that the gas capture efficiency among United States landfills was significantly lower than EPA assumptions – closer to 50% rather than 75%. Industrious Labs (2024b) found that landfill methane emissions could be reduced by up to 104 Mt of methane 2025–2050. Using biocovers and installing GCCS earlier (with consistent operation standards) may help reduce emissions throughout the landfill’s lifespan. Tables 5a and 5b show the adoption ceiling for GCCS and methane use/destruction strategies, and for biocovers when used separately.

left_text_column_width

Table 5. Adoption ceiling.

Unit: Mt/yr methane abated

median (50th percentile) 70

Unit: Mt/yr methane abated

median (50th percentile) 70
Left Text Column Width
Achievable Adoption

The amount of methane that can be abated from landfills is highly uncertain due to the difficulty in quantifying where and how much methane is emitted and how much of those emissions can be abated. 

GCCS and methane use/destruction strategies have an achievable adoption range of 5–35 Mt/yr of methane (Table 6a). These values are aligned with estimates from DeFabrizio et al. (2021) and Scharff et al. (2023) for landfill methane abatement. 

Biocovers have an achievable adoption range of 35–57 Mt/yr of methane (Table 6b). This value is aligned with estimates of biocover gas destruction efficiency from Duan et al. (2022) and Scheutz et al. (2014). 

The use of these methane abatement strategies would still release around 13–65 Mt/yr of methane into the atmosphere (IEA, 2025). The amount of methane abated from both GCCS and methane use/destruction strategies and biocovers will vary with what kind of waste reduction and organic diversion is used (which can increase or decrease depending on the amount of organics sent to landfills). 

We referenced CCAC (2024), EPA (2011), Fries (2020), Industrious Labs (2024b), Lee et al. (2017), and Sperling Hansen (2020) when looking at the achievable adoption for global landfill methane abatement. Several resources focused on landfills in Canada, Denmark, South Korea, and the United States. We based the adoption achievable for biocovers only on sources that include the percentage of gas capture (destruction) efficiency over landfill sites. We exclude studies that include the percentage of biogas oxidized because they focus on specific areas where biocovers were applied. It is important to note that biocovers do not capture methane – they destroy it through methane oxidation. In addition, biocovers’ gas capture efficiency will not reach its optimal rate until the bacteria establishes. It may take up to three months (Stern et al., 2007) for methane oxidation rates to stabilize, and – because environmental changes can impact the bacteria’s methane oxidation rate – the value presented here likely overestimates biocover methane abatement potential in practice. Stern et al. (2007) found that biocovers can be a methane sink and oxidation rates of 100% have been measured at landfills. 

Few studies have examined how methane abatement is affected when all strategies are combined. A single landfill’s total methane abatement would likely increase with each added strategy, the total methane abatement is not expected to be additive between the strategies. For example, If a GCCS system can capture a large portion of LFG methane, then adding a biocover to the same landfill will play a reduced role in methane abatement. The values presented do not consider which geographies are best suited for specific methane abatement strategies. Compared with reality, those values may appear generous. 

Long-term landfill methane abatement will be necessary to manage emissions from previously deposited organic waste. Strong regulations for waste management can encourage methane abatement strategies at landfills and/or reduce the amount of organics sent their way. The infrastructure for these methane abatement strategies can still be employed in geographies without strong regulations. Tables 6a and 6b show the statistical low and high achievable ranges for GCCS and methane use/destruction strategies and for biocovers (when used separately) based on different reported sources for adoption ceilings.

left_text_column_width

Table 6. Range of achievable adoption levels.

Unit: Mt/yr methane abated

Current Adoption 1.60
Achievable – Low 4.50
Achievable – High 34.78
Adoption Ceiling 69.56

Unit: Mt/yr methane abated

Current Adoption 0.00
Achievable – Low 35.13
Achievable – High 57.04
Adoption Ceiling 69.56
Left Text Column Width

Landfill methane abatement has a high potential for climate impact. 

GCCS and methane use/destruction strategies can significantly reduce landfill GHG emissions (table 7a).

Biocovers can be a useful strategy for controlling LFG methane (table 7b) because they can oxidize methane in areas where GCCS and methane use/destruction strategies are not applicable. In addition, this strategy can help destroy methane missed from GCCS and even remove methane from the atmosphere (Stern et al., 2007). The lower cost for installation and operation when compared to installing GCCS systems and increased applicability at landfills large and small are encouraging factors for broadening their use around the world. 

LDAR can help identify methane leaks,allowing for targeted abatement (Industrious Labs, 2024a). 

Research has not quantified how methane abatement is affected by combining these strategies. We anticipate that the total methane abatement would increase with each additional strategy, but we don’t expect them to be additive. The general belief is that biocovers are useful for reducing methane emissions in areas where a GCCS cannot be installed and will also help to remove residual methane emissions from GCCS systems. If there is a large increase in waste diversion, the abatement potential could be 0.13–1.59 Gt CO₂‑eq/yr for landfill methane abatement (DeFabrizio et al, 2021; Duan et al., 2022). In this scenario there will also be reduced sources of revenue due to lower LFG methane production affecting the economics.

UNEP (2021) underscored the need for additional methane measures to stay aligned with 1.5 °C scenarios. Meeting these goals requires the implementation of landfill GCCS and biocovers as well as improved waste diversion strategies – such as composting or reducing food loss and waste – to reduce methane emissions. The amount of landfill methane available to abate will grow or shrink depending on the amount of organic waste sent to landfills. Previously deposited organic waste will still produce methane for many years and will still require methane abatement.

left_text_column_width

Table 7. Climate impact at different levels of adoption.

Unit: Gt CO₂‑eq/yr, 100-yr basis

Current Adoption 0.04
Achievable – Low 0.13
Achievable – High 0.97
Adoption Ceiling 1.94

Unit: Gt CO₂‑eq/yr, 20-yr basis

Current Adoption 0.13
Achievable – Low 0.37
Achievable – High 2.82
Adoption Ceiling 5.65

Unit: Gt CO₂‑eq/yr, 100-yr basis

Current Adoption 0
Achievable – Low 0.98
Achievable – High 1.59
Adoption Ceiling 1.94

Unit: Gt CO₂‑eq/yr, 20-yr basis

Current Adoption 0
Achievable – Low 2.85
Achievable – High 4.63
Adoption Ceiling 5.65
Left Text Column Width
Additional Benefits

Air quality

Using LFG for energy in place of other non-renewable sources – such as coal or fuel oil – reduces emissions of air pollutants such as sulfur dioxide, nitrous oxides, and particulate matter (EPA, 2024b; Siddiqua et al., 2022). Untreated LFG is also a source of volatile organic compounds (VOCs) in low concentrations. Capturing and burning LFG to generate electricity reduces the hazards of these air pollutants. Methane emissions can contribute to landfill fires, which pose risks to the health and safety of nearby communities by releasing black carbon and carbon monoxide (Global Climate & Health Alliance [GCHA], 2024). Reducing landfill fires by capturing methane can also help improve local air quality. Landfill methane emissions can contribute to ozone pollution, particularly when other non-methane ozone precursors are present (Olaguer, 2021). 

Health

Landfill emissions can contribute to health issues such as cancer, respiratory and neurological problems, low birth weight, and birth defects (Brender et al., 2011; Industrious Labs, 2024a; Siddiqua et al. 2022). By reducing harmful air pollutants, capturing landfill methane emissions minimizes the health risks associated with exposure to these toxic landfill compounds. Capturing LFG can reduce malodorous landfill emissions – pollutants such as ammonia and hydrogen sulfide – that impact human well-being (Cai et al., 2018).

Equality

Landfill management practices that reduce community exposure to air pollution have implications for environmental justice (Casey et al., 2021). A large review of waste sites in the United States and Europe found that landfills are disproportionately located near low-income communities and near neighborhoods with racially and ethnically marginalized populations (Marzutti et al., 2010). Reducing disproportionate exposures to air pollution from landfills may mitigate poor health outcomes in surrounding communities (Brender et al., 2011).

Income and work

Generating electricity from LFG can create local jobs in drilling, piping, design, construction, and operation of energy projects. In the United States, LFG energy projects can create 10–70 jobs per project (EPA, 2024b).

left_text_column_width
Risks

GCCS can be voluntarily implemented with sufficient methane generated by the landfill and favorable natural gas prices, but when natural gas prices are low, it makes less economic sense (IEA, 2021). There is also a risk of encouraging organics to be sent to landfills in order to maintain methane capture rates. Reducing the amount of waste made in the first place will allow us to better utilize our resources and for the organic waste that is created; it can be better served with waste diversion strategies such as composting or methane digesters. 

Without policy support, regulation, carbon pricing mechanism, or other economic incentives – biocover adoption may be limited by installation costs. Some tools (like the United Nations’ clean development mechanism) encourage global landfill methane abatement projects. There have been criticisms of this mechanism’s effectiveness for failing to support waste diversion practices and focusing solely on GCCS and incinerator strategies (Tangri, 2010). Collected LFG methane can be used to reduce GHG emissions for hard to abate sectors but continued reliance on methane for industries where it is easier to switch to clean alternatives could encourage new natural gas infrastructure to be built which risks becoming a stranded asset and locking infrastructure to emitting forms of energy (Auth & Kincer, 2022).

left_text_column_width
Interactions with Other Solutions

Reinforcing

Landfill management can have a reinforcing impact on other solutions that reduce the amount of methane released to the atmosphere. By using strategies like GCCS, methane destruction, and LDAR, the landfill waste sector can help demonstrate the effectiveness and economic case for abating methane. This would build momentum for widespread adoption of methane abatement because successes in this sector can be leveraged in others as well. For example, processes and tools for identifying methane leaks are useful beyond landfills; LDAR as a key strategy for identifying methane emissions can be applied and studied more widely.

left_text_column_width

Competing

Landfill management can have a competing impact with solutions that provide clean electricity. Capturing methane uses natural gas infrastructure and can reduce the cost of using methane and natural gas as a fuel source. As a result, it could prolong the use of fossil fuels and slow down the transition to clean electricity sources.

left_text_column_width
Dashboard

Solution Basics

1 Mt methane abated

tCO2-eq/unit
2.79×10⁷
units
Current 1.594.534.78
Achievable (Low to High)

Climate Impact

GtCO2-eq/yr
Current 0.04 0.130.97
US$ per tCO2-eq
-6
Emergency Brake

CO₂, CH₄, N₂O, BC

Solution Basics

1 Mt methane abated

tCO2-eq/unit
2.79×10⁷
units
Current 035.1357.04
Achievable (Low to High)

Climate Impact

GtCO2-eq/yr
Current 0 0.981.59
US$ per tCO2-eq
0
Emergency Brake

CO₂, CH₄, N₂O, BC

Trade-offs

Landfill management strategies outlined in this solution can help to reduce methane emissions that reach the atmosphere. However, the methane used as fuel or destroyed will still emit GHGs. Strategies to capture CO₂ emissions from methane use will be needed to avoid adding any GHG emissions to the atmosphere. Research on this topic takes global methane emissions from landfills in 2023, and assumes they were fully combusted and converted to CO₂ emissions.

left_text_column_width
Mt CO2–eq
< 0.5
0.5–1
1–3
3–5
> 5

Annual emissions from solid waste disposal sites, 2024

Landfills release methane when organic material breaks down. Globally, municipal solid waste was responsible for about 67 Mt of methane emissions in 2023. This methane contributed 19% of total anthropogenic methane emissions in 2023, and is equivalent to 1,809 Mt CO2-eq based on a 100-year time scale.

Raniga, K., (2024). Waste sector: Estimating CH4 emissions from solid waste disposal sites [Data set]. WattTime, Climate TRACE Emissions Inventory. Retrieved April 21, 2025 from https://climatetrace.org

International Energy Agency. (2024). Methane tracker: Data tools. https://www.iea.org/data-and-statistics/data-tools/methane-tracker

Geographic Guidance Introduction

Methane emissions from landfills can vary geographically (IPCC, 2006) since rates of organic matter decomposition and methane generation depend on climate. In practice, however, landfill management has a more significant impact on related emissions and is correlated with country income levels.  

Many high-income countries have landfills that are considered sanitary landfills (where waste is covered daily and isolated from the environment) and have high waste collection rates. Basic covers are placed on the landfills to reduce the risk of odor, scavenging, and wildlife accessing the waste, and there are regulations in place to manage and capture landfill gas (LFG) emissions. These landfills are better prepared to install Gas Collection and Control Systems (GCCS) and methane use or destruction infrastructure. 

For landfills in low- and middle-income countries, existing waste management practices and regulations can vary widely. In countries like the Dominican Republic, Guatemala, and Nigeria, waste may not be regularly collected; when it is, it is often placed in open landfills where waste lies uncovered, as documented by Ayandele et al. (2024d). This can negatively impact the environment by attracting scavengers and pest animals to the landfill. When this occurs, methane is more easily released to the atmosphere or burned as waste, the latter process creating pollutants that impact the nearby environment (not to mention generating additional GHG emissions).

Overall, managing methane emissions from landfills can be improved everywhere with stronger regulations for high-income countries that will ensure the methane generated from landfills is captured with GCCS and used or destroyed. For low- and middle-income countries, regular waste collection and storage of waste in sanitary landfills need to be implemented first before GCCS technology can be installed. Biocovers can be used around the world but may have the most impact in low- and middle-income countries as they may not have the expertise or infrastructure to effectively use GCCS methane use or destruction strategies (Ayandele et al., 2024d).

Action Word
Improve
Solution Title
Landfill Management
Classification
Highly Recommended
Lawmakers and Policymakers
  • Set standards for landfill emissions and goals for reductions.
  • Improve LDAR and emissions estimates by setting industry standards and investing in public research.
  • Mandate early installation of landfill covers and/or GCCSs for new landfills; mandate immediate installation for existing landfills.
  • Set standards for landfill covers and GCCS.
  • Invest in infrastructure to support biogas production and utilization.
  • Regulate industry practices for timely maintenance, such as wellhead turning and equipment monitoring.
  • Set standards for methane destruction, such as high-efficiency flares.
  • Conduct or fund research to fill the literature gap on policy options for landfill methane.
  • Reduce public food waste and loss, invest in infrastructure to separate organic waste before reaching the landfill (see Reduce Food Loss and Waste, Increase Composting, and Deploy Methane Digesters solutions).
Practitioners
  • Improve LDAR at landfills for surface and fugitive emissions.
  • Install landfill biocovers as well as GCCSs.
  • Invest in infrastructure to support biogas production and utilization.
  • Ensure timely maintenance, such as wellhead turning and equipment monitoring.
  • Improve methane destruction practices, such as using high-efficiency flares.
  • Set goals to reduce landfill methane emissions from operations and help set regional, national, international, and industry reduction goals.
  • Conduct, contribute to, or fund research on technical solutions (e.g., regional abatement strategies) and policy options for landfill methane.
  • Separate food and organic waste from non-organic waste to create separate disposal streams (see Reduce Food Loss  and Waste, Increase Composting, and Deploy Methane Digesters solutions).

Further information:

Business Leaders
  • Contract with waste collection facilities that utilize methane reduction strategies such as landfill covers, GCCSs, and robust monitoring systems.
  • Require suppliers to meet standards for low-carbon waste management.
  • If your company participates in the voluntary carbon market, fund high-integrity projects that reduce landfill emissions.
  • Proactively collaborate with government and regulatory actors to support policies that abate landfill methane.
  • Reduce your company’s food waste and loss (see Reduce Food Loss  and Waste, Increase Composting, and Deploy Methane Digesters solutions).

Further information:

Nonprofit Leaders
  • Contract with waste collection facilities that utilize methane reduction strategies such as landfill covers, GCCSs, and robust monitoring systems.
  • Assist with monitoring and estimating landfill emissions.
  • Help design policies and regulations that support landfill methane abatement.
  • Publish research on policy options for landfill methane abatement.
  • Join or support efforts such as the Global Methane Alliance.
  • Encourage policymakers to create ambitious targets and regulations.
  • Pressure landfill companies and operators to improve their practices.
  • Reduce your organization’s food waste and loss, separate organic waste from other forms, and compost organic waste (see Reduce Food Loss  and Waste, Increase Composting, and Deploy Methane Digesters solutions).

Further information:

Investors
  • Contract with waste collection facilities that utilize methane reduction strategies such as landfill covers, GCCSs, and robust monitoring systems.
  • Invest in projects that abate landfill methane emissions.
  • Pressure and influence private landfill operators within investment portfolios to implement methane abatement strategies, noting that some strategies, such as selling captured methane, can be sources of revenue and add value for investors.
  • Pressure and influence other portfolio companies to incorporate waste management and landfill methane abatement into their operations and/or net-zero targets.
  • Provide capital for nascent or regional landfill methane abatement technologies and LDAR instruments.
  • Seek impact investment opportunities, such as sustainability-linked loans in entities that set landfill methane abatement targets.
  • Reduce your company’s food waste and loss, separate organic waste from other forms, and compost organic waste (see Reduce Food Loss  and Waste, Increase Composting, and Deploy Methane Digesters solutions).

Further information:

Philanthropists and International Aid Agencies
  • Contract with waste collection facilities that utilize methane reduction strategies such as landfill covers, GCCSs, and robust monitoring systems.
  • Provide capital for methane monitoring, de-risking, and abatement in the early stages of implementing landfill methane reduction technologies.
  • Support global, national, and local policies that reduce landfill methane emissions.
  • Support accelerators or multilateral initiatives like the Global Methane Hub.
  • Explore opportunities to fund landfill methane abatement strategies such as landfill covers, GCCSs, proper methane destruction, monitoring technologies, and other equipment upgrades.
  • Advance awareness of the air quality, public health, and climate benefits of landfill methane abatement.
  • Reduce your organization’s food waste and loss, separate organic waste from other forms, and compost organic waste (see Reduce Food Loss  and Waste, Increase Composting, and Deploy Methane Digesters solutions).

Further information:

Thought Leaders
  • If applicable, contract with waste collection facilities that utilize methane reduction strategies such as landfill covers, GCCSs, and robust monitoring systems.
  • Provide technical assistance (e.g., monitoring and reporting landfill emissions) to businesses, government agencies, and landfill operators working to reduce methane emissions.
  • Help design policies and regulations that support landfill methane abatement.
  • Educate the public on the urgent need to abate landfill methane.
  • Join or support joint efforts such as the Global Methane Alliance.
  • Advocate to policymakers for more ambitious targets and regulations for landfill emissions.
  • Pressure landfill operators to improve their practices.
  • Reduce your food waste and loss, separate organic waste from other forms, and compost organic waste (see Reduce Food Loss  and Waste, Increase Composting, and Deploy Methane Digesters solutions).

Further information:

Technologists and Researchers
  • Develop new LDAR technologies that reduce cost and required capacity.
  • Develop new biocover technologies sensitive to regional supply chains and/or availability of materials.
  • Improve methane destruction practices to reduce CO₂ emissions.
  • Research and improve estimates of landfill methane emissions.
  • Create new mechanisms to reduce public food waste and loss, and separate organic waste from landfill waste (see Reduce Food Loss  and Waste, Increase Composting, and Deploy Methane Digesters solutions).

Further information:

Communities, Households, and Individuals
  • If possible, contract with waste collection facilities that utilize methane reduction strategies such as landfill covers, GCCSs, and robust monitoring systems.
  • If harmful landfill management practices impact you, document your experiences.
  • Share documentation of harmful practices and/or other key messages with policymakers, the press, and the public.
  • Advocate to policymakers for more ambitious targets and regulations for landfill emissions.
  • Support public education efforts on the urgency and need to address landfill methane.
  • Reduce your food waste and loss, separate organic waste from other forms, and compost organic waste (see Reduce Food Loss  and Waste, Increase Composting, and Deploy Methane Digesters solutions).

Further information:

Evidence Base

Consensus of effectiveness in abating landfill methane emissions: High

There is a high consensus that methane abatement technologies are effective; they can often be deployed cost effectively with an immediate mitigating effect on climate change. 

Though many strategies are universally agreed-upon as effective, waste management practices vary between countries from what we found in our research. China, India, and the United States are the three largest G20 generators of municipal solid waste, though much of the data used in our assessment are from Western countries (Zhang, 2020). Ocko et al. (2021) found that economically feasible methane abatement options (including waste diversion) could reduce 80% of landfill methane emissions from 2020 levels by 2030. Methane abatement can reduce methane emissions from existing organic waste – which Stone (2023) notes can continue for more than 30 years. 

Scharff et al. (2023) found capture efficiencies of 10–90% depending on the LFG strategy used. They compared passive methods, late control of the landfill life, and early gas capture at an active landfill. The EPA (Krause et al., 2023) found that 61% of methane generated by food waste – which breaks down relatively quickly – evades gas capture systems at landfills. This illustrates how early installation of these capture systems can greatly help reduce the total amount of methane emitted from landfills. The EPA findings also highlight the potential impact of diverting organic waste from landfills, preventing LFG from being generated in the first place. 

Ayandele et al. (2024c) found that the working face of a landfill can be a large source of LFG and suggest that timely landfill covers – biocover-style or otherwise – can reduce methane released; timing of abatement strategies is important. Daily and interim landfill covers can prevent methane escape before biocovers are installed. 

Biocovers have a reported gas destruction rate of 26–96% (EPA, 2011; Lee et al. 2017). They could offer a cost-effective way to manage any LFG that is either missed by GCCS systems or emitted in the later stages of the landfill when LFG production decreases and is no longer worth capturing and selling (Martin Charlton Communications, 2020; Nisbet et al., 2020; Sperling Hansen Associates, 2020). Biocovers can also be applied soon after organic waste is deposited at a landfill as daily or interim covers where it is not as practical to install GCCS infrastructure and gas production has not yet stabilized (Waste Today, 2019). Scarapelli et al. (2024) found in the landfills they studied that emissions from working faces are poorly monitored and 79% of the observed emissions originated from landfill work faces. Covering landfill waste with any type of landfill cover (biocover or not), will reduce the work face emissions. 

LDAR can reduce landfill methane emissions by helping to locate the largest methane leaks and so allowing for more targeted abatement strategies. LDAR can also help identify leaks in landfill covers or in the GCCS infrastructure (Industrious Labs, 2024a). 

The results presented in this document summarize findings from 24 reviews and meta-analyses and 26 original studies reflecting current evidence from six countries, Canada, China, Denmark, Mexico, South Korea, and the United States, and from sources examining global landfill methane emissions. We recognize this limited geographic scope creates bias, and hope this work inspires research and data sharing on this topic in underrepresented regions.

left_text_column_width
Appendix

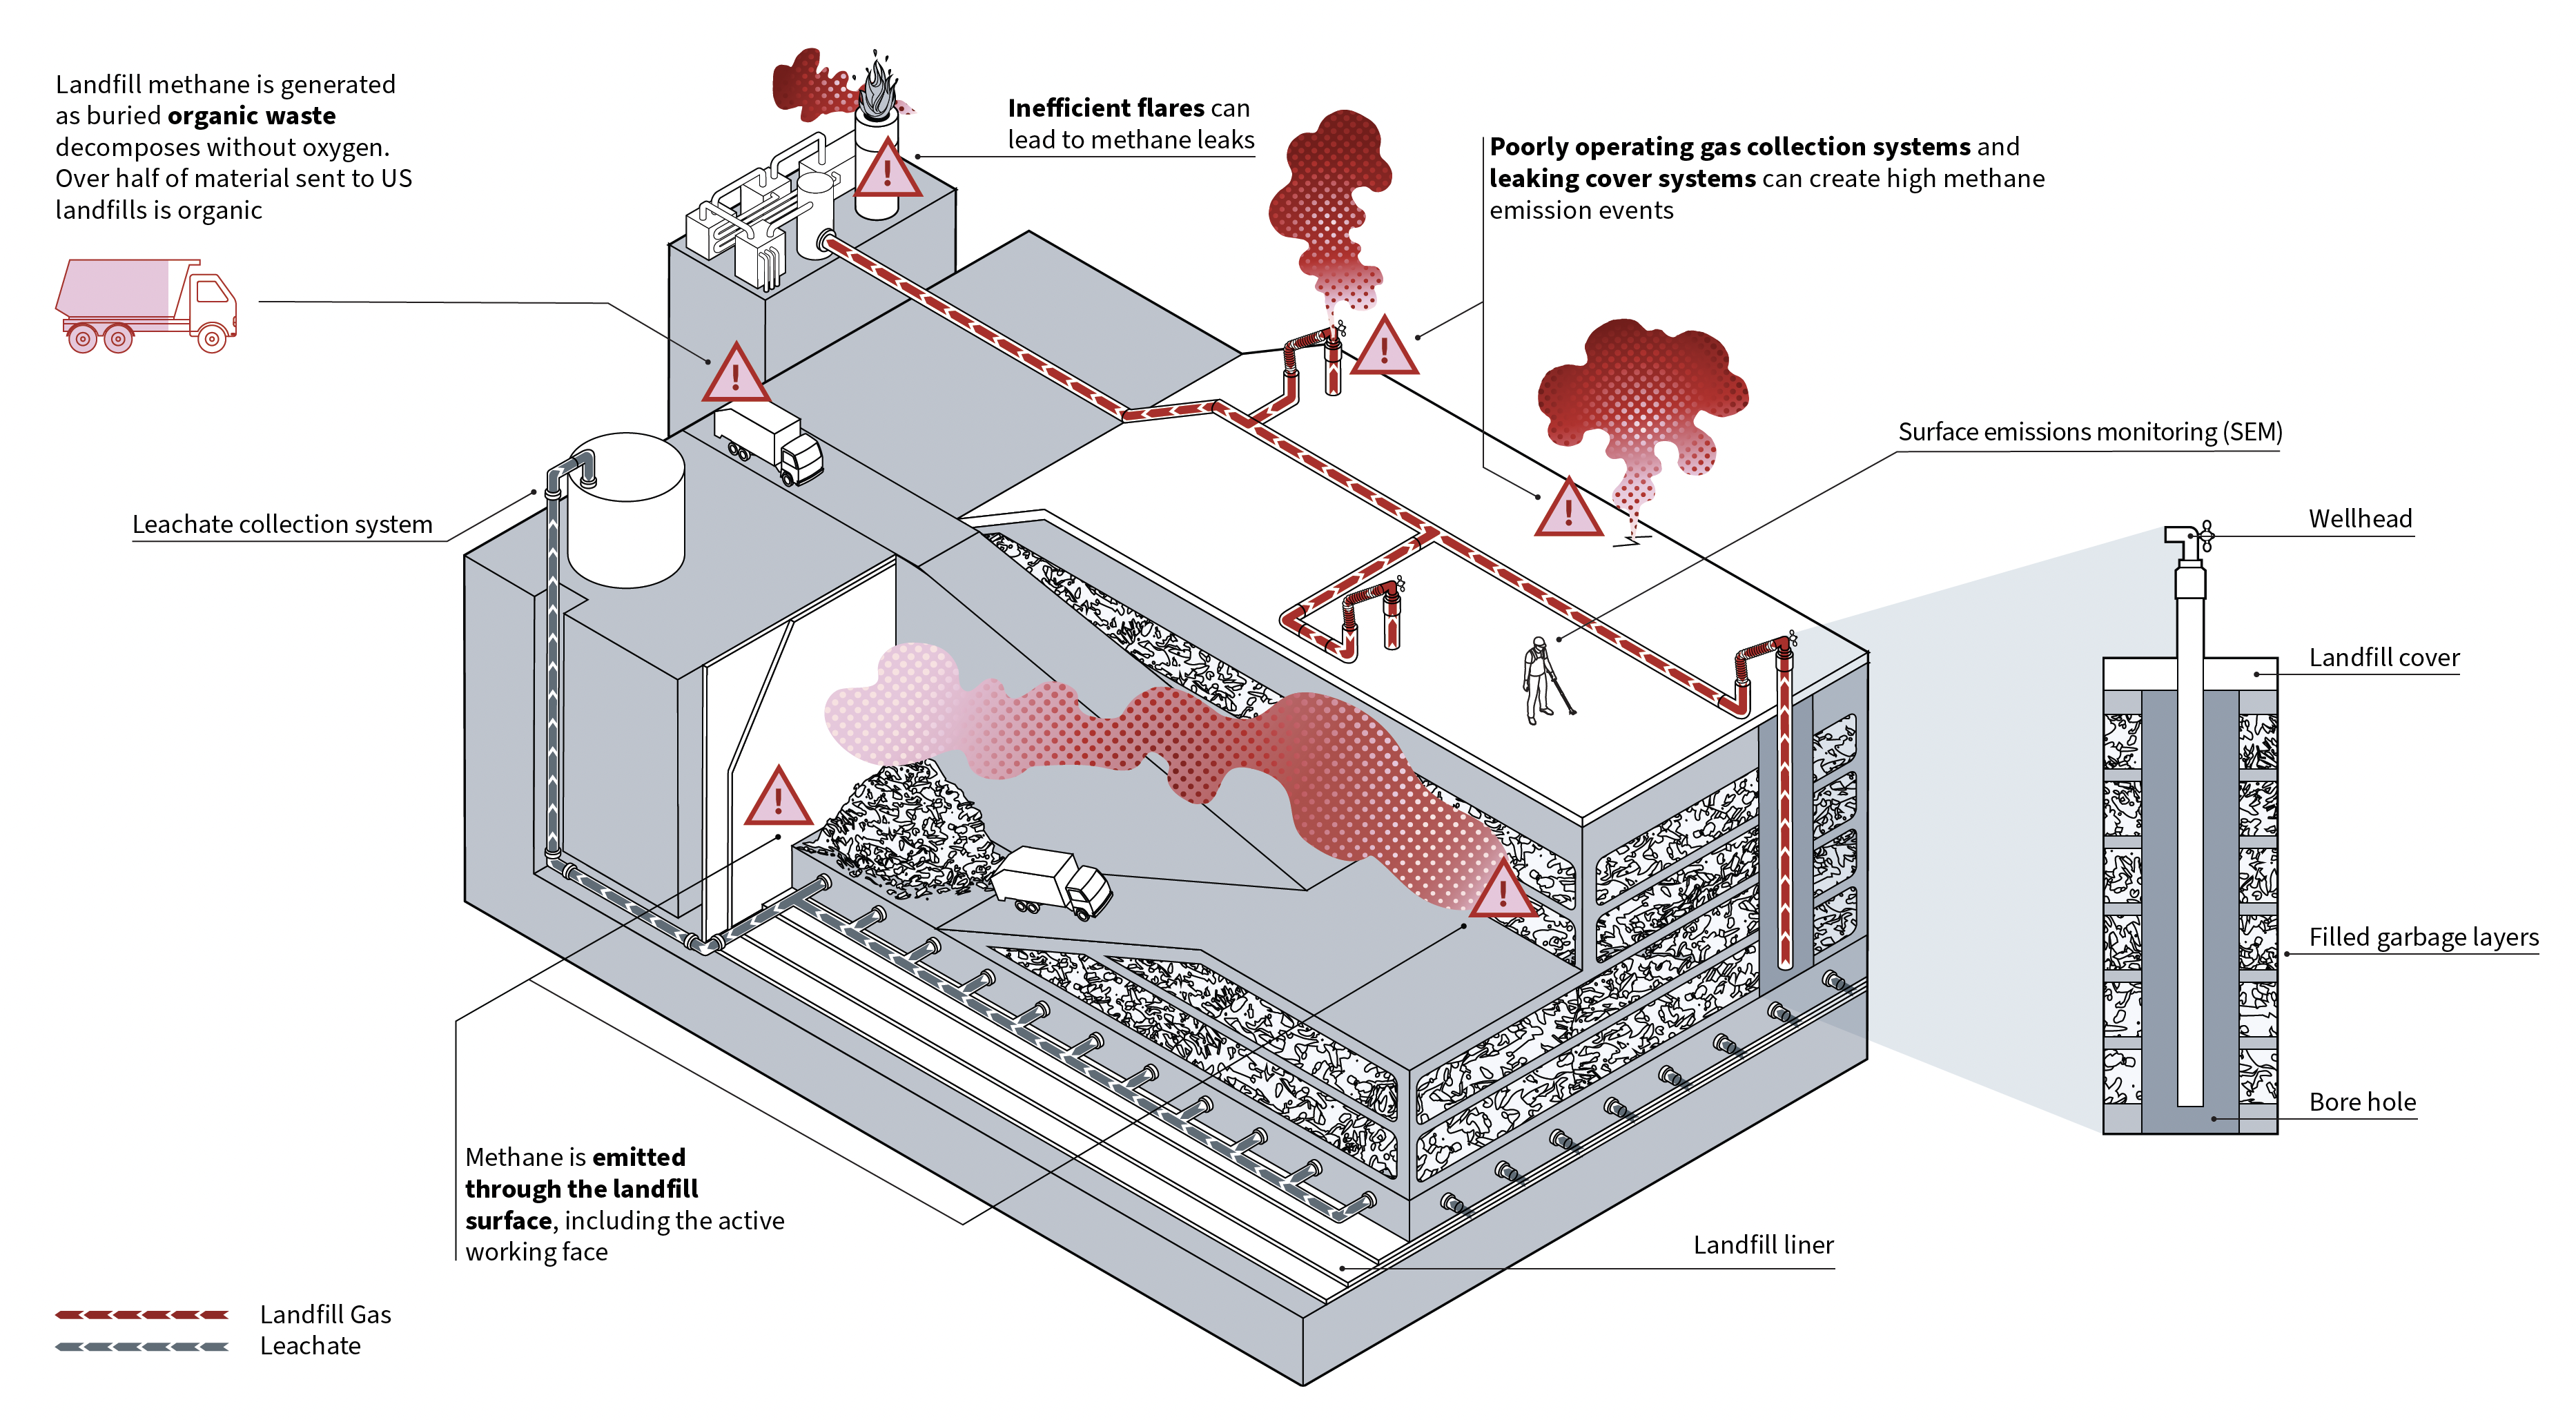
The following figures provide examples of where methane can escape from landfills and where sources of emissions have been found. This shows the difficulty in identifying where methane emissions are coming from and the importance of well maintained infrastructure to ensure methane is being abated.

left_text_column_width

Figure A1. Sources of methane emissions at landfills. Source: Garland et al. (2023).

Image
Diagram of landfill components and emissions sources

Source: Garland E., Alves O., Frankiewicz T., & Ayandele E. (2023). Mitigating landfill methane. RMIhttps://rmi.org/wp-content/uploads/dlm_uploads/2023/06/landfill_monitoring_memo_series.pdf 

Enable Download
On

Figure A2. Source of methane leaks at landfills. Source: Ayandele et al. (2024a).

Source: Ayandele, E., Frankiewicz, T., & Garland, E. (2024a). Deploying advanced monitoring technologies at US landfills. RMI

Enable Download
On
Updated Date

Deploy LED Lighting

Sector
Electricity
Image
Image
Office building exterior showing many floors of indoor lit offices
Coming Soon
Off
Summary

We define the Deploy LED Lighting solution as replacing energy-inefficient light sources with light-emitting diodes (LEDs). Lighting accounts for 15–20% of electricity use in buildings. Using LEDs reduces the electricity that building lighting consumes, and thereby cuts GHG emissions from global electricity generation.

Overview

LED technology for lighting indoor and outdoor spaces is more energy-efficient than other lighting sources currently on the market (Zissis et al., 2021). This is because LEDs are solid-state semiconductors that emit light generated through a direct conversion of the flow of electricity (electroluminescence) rather than heating a tungsten filament to make it glow. More of the electrical energy goes to producing light in an LED lamp than in less-efficient alternative lighting technologies such as incandescent light bulbs or compact fluorescent lamps (CFLs) (Koretsky, 2021; Nair & Dhoble, 2021a). This difference offers significant energy-efficiency gains (see Figure 1).

Globally, lighting-related electricity consumption can account for as much as 20% of the total annual electricity used in buildings (Gayral, 2017; Pompei et al., 2020; Pompei et al., 2022). In 2022, the IEA estimated that total electricity consumption for lighting buildings globally was 1,736 TWh (Lane, 2023). Schleich et al. (2014) and others have argued that buildings consume more electricity for lighting when occupants perceive a lighting source as efficient (rebound effect). However, the growing adoption of LED lighting over the years has significantly optimized electricity consumption from building lighting, especially in residential buildings (Lane, 2023).

According to the Intergovernmental Panel on Climate Change (IPCC, 2006), generating electricity from fossil fuels emits CO₂,  methane, and nitrous oxide. Replacing inefficient lamps with LEDs cuts these emissions by reducing electricity demand. LEDs often have a power rating of 4–10W, which is 3–10 times lower than alternatives. LEDs also last significantly longer: With a lifespan that can exceed 25,000 hours, they vastly outperform incandescent bulbs (1,000 hours) and CFLs (10,000 hours), as shown in Figure 1. LED’s longevity leads to potential long-term savings due to fewer replacements. The amount of light produced per energy input (luminous efficacy) is up to 10 times greater than alternative lighting sources. This means substantially more lighting for less energy.

Figure 1. A comparison of light sources for building lighting (data from Lane, 2023; Mathias et al., 2023; Nair & Dhoble, 2021b; Xu, 2019).

Light source type Power rating (watts) Luminous efficacy (lumens/watt) Lifespan (hours)
Incandescent 40–100 10–15 1,000
CFL 12–20 60–63 10,000
LED 4–10 110–150 25,000–100,000

The International Energy Agency (IEA) and other international bodies report LED market penetration in terms of percentages of the global lighting market (Lane, 2023). We chose this approach to track the impact of adopting LEDs.

Take Action Intro

Would you like to help deploy LED lighting? Below are some ways you can make a difference, depending on the roles you play in your professional or personal life.

These actions are meant to be starting points for involvement and may or may not be the most important, impactful, or doable actions you can take. We encourage you to explore, get creative, and take a step that is right for you!

References

Albatayneh, A., Juaidi, A., Abdallah, R., & Manzano-Agugliaro, F. (2021). Influence of the advancement in the LED lighting technologies on the optimum windows-to-wall ratio of Jordanians residential buildings. Energies, 14(17), 5446. https://www.mdpi.com/1996-1073/14/17/5446

Amann, J. T., Fadie, B., Mauer, J., Swaroop, K., & Tolentino, C. (2022). Farewell to fluorescent lighting: How a phaseout can cut mercury pollution, protect the climate, and save money. https://www.aceee.org/research-report/b2202

Behar-Cohen, F., Martinsons, C., Viénot, F., Zissis, G., Barlier-Salsi, A., Cesarini, J. P.,…Attia, D. (2011). Light-emitting diodes (LED) for domestic lighting: Any risks for the eye? Progress in Retinal and Eye Research, 30(4), 239–257. https://doi.org/10.1016/j.preteyeres.2011.04.002

Booysen, M. J., Samuels, J. A., & Grobbelaar, S. S. (2021). LED there be light: The impact of replacing lights at schools in South Africa. Energy and Buildings, 235, 110736. https://doi.org/10.1016/j.enbuild.2021.110736

Bose-O'Reilly, S., McCarty, K. M., Steckling, N., & Lettmeier, B. (2010). Mercury exposure and children's health. Current Problems in Pediatric and Adolescent Health Care, 40(8), 186–215. https://doi.org/10.1016/j.cppeds.2010.07.002

Build Up. (2019). Overview_Decarbonising the non-residential building stock. European Commission. Retrieved 05 March 2025 from https://build-up.ec.europa.eu/en/resources-and-tools/articles/overview-decarbonising-non-residential-building-stock

Cenci, M. P., Dal Berto, F. C., Schneider, E. L., & Veit, H. M. (2020). Assessment of LED lamps components and materials for a recycling perspective. Waste Management, 107, 285-293. https://doi.org/10.1016/j.wasman.2020.04.028

Environmental Protection Agency (EPA). (2024). Power sector programs - progress report. https://www.epa.gov/power-sector/progress-report

Forastiere, S., Piselli, C., Silei, A., Sciurpi, F., Pisello, A. L., Cotana, F., & Balocco, C. (2024). Energy efficiency and sustainability in food retail buildings: Introducing a novel assessment framework. Energies, 17(19), 4882. https://www.mdpi.com/1996-1073/17/19/4882

Fu, X., Feng, D., Jiang, X., & Wu, T. (2023). The effect of correlated color temperature and illumination level of LED lighting on visual comfort during sustained attention activities. Sustainability, 15(4), 3826. https://www.mdpi.com/2071-1050/15/4/3826

Gao, W., Sun, Z., Wu, Y., Song, J., Tao, T., Chen, F.,…Cao, H. (2022). Criticality assessment of metal resources for light-emitting diode (LED) production – a case study in China. Cleaner Engineering and Technology, 6, 100380. https://doi.org/10.1016/j.clet.2021.100380

Gasparotto, J., & Da Boit Martinello, K. (2021). Coal as an energy source and its impacts on human health. Energy Geoscience, 2(2), 113–120. https://doi.org/10.1016/j.engeos.2020.07.003

Gayral, B. (2017). LEDs for lighting: Basic physics and prospects for energy savings. Comptes Rendus Physique, 18(7), 453–461. https://doi.org/10.1016/j.crhy.2017.09.001

Gromada, A., & Trębska, P. (2024). Energy efficiency—case study for households in poland. Energies, 17(18), 4592. https://www.mdpi.com/1996-1073/17/18/4592

Hasan, M. M., Moznuzzaman, M., Shaha, A., & Khan, I. (2024). Enhancing energy efficiency in Bangladesh's readymade garment sector: The untapped potential of LED lighting retrofits. International Journal of Energy Sector Management, ahead-of-print(ahead-of-print). https://doi.org/10.1108/IJESM-05-2024-0009

Henneman, L., Choirat, C., Dedoussi, I., Dominici, F., Roberts, J., & Zigler, C. (2023). Mortality risk from United States coal electricity generation. 382(6673), 941–946. https://doi.org/doi:10.1126/science.adf4915

Intergovernmental Panel on Climate Change (IPCC). (2006). 2022 IPCC guidelines for national greenhouse gas inventories volume 3: Energy; Chapter 2: Stationary combustion. https://www.ipcc-nggip.iges.or.jp/public/2006gl/pdf/2_Volume2/V2_2_Ch2_Stationary_Combustion.pdf

International Energy Agency (IEA). (2022). Targeting 100% LED lighting sales by 2025. https://www.iea.org/reports/targeting-100-led-lighting-sales-by-2025

International Energy Agency (IEA). (2023). Global floor area and buildings energy intensity in the net zero scenario, 2010-2030. Retrieved 06 March 2025 from https://www.iea.org/data-and-statistics/charts/global-floor-area-and-buildings-energy-intensity-in-the-net-zero-scenario-2010-2030

International Energy Agency (IEA). (2024). World energy balances. IEA. https://www.iea.org/data-and-statistics/data-product/world-energy-balances

Iskra-Golec, I., Wazna, A., & Smith, L. (2012). Effects of blue-enriched light on the daily course of mood, sleepiness and light perception: A field experiment. 44(4), 506-513. https://doi.org/10.1177/1477153512447528

Kamat, A. S., Khosla, R., & Narayanamurti, V. (2020). Illuminating homes with LEDs in india: Rapid market creation towards low-carbon technology transition in a developing country. Energy Research & Social Science, 66, 101488. https://doi.org/10.1016/j.erss.2020.101488

Khan, N., & Abas, N. (2011). Comparative study of energy saving light sources. Renewable and Sustainable Energy Reviews, 15(1), 296–309. https://doi.org/10.1016/j.rser.2010.07.072

Koretsky, Z. (2021). Phasing out an embedded technology: Insights from banning the incandescent light bulb in europe. Energy Research & Social Science, 82, 102310. https://doi.org/10.1016/j.erss.2021.102310

Lane, K. (2023, 11 July 2023). Lighting. International Energy Agency (IEA). Retrieved 13 December 2024 from https://www.iea.org/energy-system/buildings/lighting

Lee, K., Donnelly, S., & Phillips, G. (2024). 2020 U.S. Lighting market characterization. https://www.osti.gov/biblio/2371534

Lee, K., Nubbe, V., Rego, B., Hansen, M., & Pattison, M. (2021). 2020 LED manufacturing supply chain. U. S. DOE. https://www.energy.gov/sites/default/files/2021-05/ssl-2020-led-mfg-supply-chain-mar21.pdf

Mathias, J. A., Juenger, K. M., & Horton, J. J. (2023). Advances in the energy efficiency of residential appliances in the US: A review. Energy Efficiency, 16(5), 34. https://doi.org/10.1007/s12053-023-10114-8

Moadab, N. H., Olsson, T., Fischl, G., & Aries, M. (2021). Smart versus conventional lighting in apartments - electric lighting energy consumption simulation for three different households. Energy and Buildings, 244, 111009. https://doi.org/10.1016/j.enbuild.2021.111009

Moyano, D. B., Moyano, S. B., López, M. G., Aznal, A. S., & Lezcano, R. A. G. (2020). Nominal risk analysis of the blue light from LED luminaires in indoor lighting design. Optik, 223, 165599. https://doi.org/10.1016/j.ijleo.2020.165599

Nair, G. B., & Dhoble, S. J. (2021a). 2 - fundamentals of LEDs. In G. B. Nair & S. J. Dhoble (Eds.), The fundamentals and applications of light-emitting diodes (pp. 35–57). Woodhead Publishing. https://doi.org/10.1016/B978-0-12-819605-2.00002-1

Nair, G. B., & Dhoble, S. J. (2021b). 6 - general lighting. In G. B. Nair & S. J. Dhoble (Eds.), The fundamentals and applications of light-emitting diodes (pp. 155–176). Woodhead Publishing. https://doi.org/10.1016/B978-0-12-819605-2.00006-9

Pattison, M., Hansen, M., Bardsley, N., Elliott, C., Lee, K., Pattison, L., & Tsao, J. (2020). 2019 lighting R&D opportunities. https://www.osti.gov/biblio/1618035

Periyannan, E., Ramachandra, T., & Geekiyanage, D. (2023). Assessment of costs and benefits of green retrofit technologies: Case study of hotel buildings in Sri Lanka. Journal of Building Engineering, 78, 107631. https://doi.org/10.1016/j.jobe.2023.107631

Placek, M. (2023). LED lighting in the United States - statistics & facts. Statista. Retrieved 09 February 2025 from https://www.statista.com/topics/1144/led-lighting-in-the-us/#topicOverview

Pompei, L., Blaso, L., Fumagalli, S., & Bisegna, F. (2022). The impact of key parameters on the energy requirements for artificial lighting in Italian buildings based on standard en 15193-1:2017. Energy and Buildings, 263, 112025. https://doi.org/10.1016/j.enbuild.2022.112025

Pompei, L., Mattoni, B., Bisegna, F., Blaso, L., & Fumagalli, S. (2020, 9–12 June 2020). Evaluation of the energy consumption of an educational building, based on the uni en 15193–1:2017, varying different lighting control systems. 2020 IEEE International Conference on Environment and Electrical Engineering and 2020 IEEE Industrial and Commercial Power Systems Europe (EEEIC / I&CPS Europe)

Sarigiannis, D. A., Karakitsios, S. P., Antonakopoulou, M. P., & Gotti, A. (2012). Exposure analysis of accidental release of mercury from compact fluorescent lamps (CFLs). Science of The Total Environment, 435436, 306–315. https://doi.org/10.1016/j.scitotenv.2012.07.026

Saunders, H. D., & Tsao, J. Y. (2012). Rebound effects for lighting. Energy Policy, 49, 477-478. https://doi.org/10.1016/j.enpol.2012.06.050

Schleich, J., Mills, B., & Dütschke, E. (2014). A brighter future? Quantifying the rebound effect in energy efficient lighting. Energy Policy, 72, 35–42. https://doi.org/10.1016/j.enpol.2014.04.028

Schratz, M., Gupta, C., Struhs, T. J., & Gray, K. (2016). A new way to see the light: Improving light quality with cost-effective led technology. IEEE Industry Applications Magazine, 22(4), 55–62. https://doi.org/10.1109/MIAS.2015.2459089

United Nations Industrial Development Organization (UNIDO). (2021). SADC member states welcome the introduction of new efficient lighting standards. UNIDO. Retrieved 05 March 2025 from https://www.unido.org/news/sadc-member-states-welcome-introduction-new-efficient-lighting-standards

U.S. Department of Energy (DOE). (2016). Solid-state lighting R&D plan. https://www.energy.gov/sites/prod/files/2016/06/f32/ssl_rd-plan_%20jun2016_2.pdf

Xiong, Y., Guo, H., Nor, D. D. M. M., Song, A., & Dai, L. (2023). Mineral resources depletion, environmental degradation, and exploitation of natural resources: Covid-19 aftereffects. Resources Policy, 85, 103907. https://doi.org/10.1016/j.resourpol.2023.103907

Xu, Y. (2019). Chapter 2.1 - nature and source of light for plant factory. In M. Anpo, H. Fukuda, & T. Wada (Eds.), Plant factory using artificial light (pp. 47–69). Elsevier. https://doi.org/10.1016/B978-0-12-813973-8.00002-6

Zhang, H., Cai, J., & Braun, J. E. (2023). A whole building life-cycle assessment methodology and its application for carbon footprint analysis of U.S. Commercial buildings. Journal of Building Performance Simulation, 16(1), 38–56. https://doi.org/10.1080/19401493.2022.2107071

Zissis, G., Bertoldi, P., & Serrenho, T. (2021). Update on the status of LED-lighting world market since 2018. Publications Office of the European Union. https://publications.jrc.ec.europa.eu/repository/handle/JRC122760

Credits

Lead Fellow

  • Henry Igugu, Ph.D.

Contributors

  • Ruthie Burrows, Ph.D.

  • James Gerber, Ph.D.

  • Daniel Jasper

  • Alex Sweeney

Internal Reviewers

  • Aiyana Bodi

  • Hannah Henkin

  • Megan Matthews

  • Ted Otte

  • Amanda Smith, Ph.D.

  • Tina Swanson, Ph.D.

Effectiveness

Replacing 1% of the building lighting market with LED lamps avoids approximately 7.09 Mt CO₂‑eq/yr emissions on a 100-yr basis (Table 1) or 7.15 Mt CO₂‑eq/yr on a 20-yr basis.

We estimated this solution’s effectiveness (Table 1) by multiplying the global electricity savings intensity (kWh/%) by an emissions intensity (g/kWh) for each GHG emitted due to electricity generation. Using the IEA (2024)’s energy balances data, we estimated emissions intensities of approximately 529 g/kWh for CO₂, 0.07 g/kWh for methane and 0.01 g/kWh for nitrous oxide. Country-specific data were limited. Therefore, we developed the savings intensity using the IEA’s adoption trend (%/yr) and electricity consumption reduction (kWh/yr) for residential buildings globally (Lane, 2023). We then scaled up the savings intensity to represent all buildings (since LEDs are applicable in all types of buildings), but we could not find global data specifying the energy savings potential of converting the lighting market in nonresidential buildings to LEDs. Notably, artificial lighting’s energy consumption varies across building types (Moadab et al., 2021) and is typically greater in nonresidential buildings (Build Up, 2019). This presents some level of uncertainty, but also suggests that our estimates could be conservative – and that there is potential for even greater savings in nonresidential buildings.

left_text_column_width

Table 1. Effectiveness at reducing emissions.

Unit: t CO₂‑eq/% lamps LED/yr, 100-yr basis

Estimate 7090000
Left Text Column Width
Cost

Our lifetime initial cost estimate of switching 1% of the global building lighting market to LEDs is approximately US$1.5 billion. Because LEDs use less electricity than alternative lamps, they cost less to operate, resulting in operating costs of –US$1.3 billion/yr (i.e., cost savings). Building owners typically are not paid to use LED lighting; therefore, the revenue is zero. After amortizing the initial cost over 30 years, the net annual cost for this solution is –US$1.2 billion/yr globally. Thus, replacing other bulbs with LEDs saves money despite the initial cost.

We estimated the cost (Table 2) by first identifying initial and operating costs from studies that retrofitted buildings with LEDs, such as Periyannan et al. (2023), Hasan et al. (2024), and Forastiere et al. (2024). We then divided the costs by the impact of the LED retrofit on the amount of electricity consumed by lighting in each study and multiplied this by the global electricity savings intensity (kWh/%) we estimated during the effectiveness analysis. The result was the cost per percent of lamps in buildings converted to LED lighting (US$/% lamps LED).

We estimated the cost per unit climate impact by dividing the annual cost savings per adoption unit by the CO₂‑eq emissions reduced yearly per adoption unit (Table 2).

left_text_column_width

Table 2. Cost per unit climate impact.

Unit: 2023 US$/t CO₂‑eq, 100-yr basis

median -175.0

Negative values reflect cost savings.

Left Text Column Width
Learning Curve

As LEDs became more common in building lighting, costs dropped significantly in recent years.

Trends based on LED adoption data (Lane, 2023) and the cost of LED lighting (Pattison et al., 2020) showed a 29.7% drop in cost as LED adoption doubled between 2016 and 2019.

The cost data we used to identify the learning curve for this solution (Table 3) are specific to the United States and limited to pre-2020. More recent LED cost data may show additional cost benefits, but this value may not be applicable for other countries. However, the cost data we analyzed do provide a useful sample of the broader LED cost-reduction trend.

left_text_column_width

Table 3. Learning rate: drop in cost per doubling of the installed solution base

Units: %

Estimate 29.7
Left Text Column Width
Speed of Action

Speed of action refers to how quickly a climate solution physically affects the atmosphere after it is deployed. This is different from speed of deployment, which is the pace at which solutions are adopted.

At Project Drawdown, we define the speed of action for each climate solution as gradualemergency brake, or delayed.

Deploy LED Lighting is a GRADUAL climate solution. It has a steady, linear impact on the atmosphere. The cumulative effect over time builds as a straight line.

left_text_column_width
Caveats

Our effectiveness analysis is based on the current state of LED technology. If the adoption ceiling is attained, further improvements to the amount of light that LEDs generate per unit electricity could enhance the solution’s impact through further reductions in electricity use.

The rebound effect – where building occupants use more lighting in response to increased energy-efficiency of lamps – is a well-established concern (Saunders and Tsao, 2012; Schleich et al. 2014). We attempted to address this concern by using IEA data on actual electricity consumption originating from building lighting to determine both its effectiveness and cost implications (Lane, 2023).

We did not fully account for the cost savings that potentially arise from fewer bulb replacements, since LEDs may replace various types of lamps. Because LEDs last significantly longer than all alternative lamp technologies, building owners may require fewer replacements when using LED lamps compared with other lighting sources.

left_text_column_width
Current Adoption

Lane (2023) found that LED lamps represented 50.5% of the lighting market globally for residential buildings in 2022, but does not provide adoption data specific to nonresidential buildings. Studies that provide global or geographically segmented LED adoption data for all building types are also limited. Therefore, we assume 50.5% to be representative of LED adoption across all buildings globally (Table 4).

Other studies highlight adoption levels across various countries. The data captured in these studies and reports provide context with specific adoption levels from different regions (see Geographic Guidance).

The IEA and U.S. Department of Energy (DOE) report that LEDs are increasingly the preferred choice of homeowners and the general building lighting market. This preference is evident in the growing market share of LED lamps sold and installed annually (Lane, 2023; Lee et al., 2024).

In general, the solution’s current adoption globally is substantial, and we recognize that some countries possess more room for the solution to scale. While adoption barriers vary across regions, many countries are establishing lighting standards to drive LED adoption, especially across Africa [(IEA, 2022; United Nations Industrial Development Organization (UNIDO), 2021].

left_text_column_width

Table 4. Current (2022) adoption level.

Units: % lamps LED

Estimate 50.5
Left Text Column Width
Adoption Trend

Adoption of LEDs has grown approximately 3.75%/yr over the past two decades.

Lane (2023) found that the proportion of lamps sold annually for building lighting that are LEDs grew from 1.1% in 2010 to 50.5% in 2022 (Figure 2). We estimated the adoption trend (Table 5) by determining the percentage growth between successive years, and calculating the variances.

left_text_column_width

Figure 2. Trend in LED adoption between 2010 and 2022 (adapted from Lane, 2023).

Source: Lane, K. (2023, 11 July 2023). Lighting. International Energy Agency (IEA). Retrieved 13 December 2024 from https://www.iea.org/energy-system/buildings/lighting

Enable Download
On

Data on the growth of LEDs across regional building lighting markets are limited. Lee et al. (2024)’s analysis of the U.S. lighting market found 46.5% growth 2010–2020, which translates to 4.65% annually. Zissis et al. (2021) reported 26% growth for France for 2017–2020, which averages 8.67% annually.

left_text_column_width

Table 5. 2010–2022 adoption trend.

Units: % lamps LED market share growth/yr

25th percentile 2.85
mean 4.12
median (50th percentile) 3.75
75th percentile 5.4
Left Text Column Width
Adoption Ceiling

The adoption ceiling (Table 6) is 100%, meaning all lamps in buildings are LEDs. Lane (2023) projects 100% LED market penetration by 2030. If current adoption trends continue, 100% LED adoption is a practical and achievable upper limit. However, countries will need to overcome challenges such as regulatory enforcement, financial, and technology access issues, while preventing the entrance of inferior quality LEDs into their lighting market (IEA, 2022).

left_text_column_width

Table 6. Adoption ceiling

Units: % lamps LED

Estimate 100
Left Text Column Width
Achievable Adoption

We estimate a low achievable adoption scenario of 87% based on Statista’s projections about LED lighting market penetration by 2030 (Placek, 2023). The values were similar in Zissis et al. (2021).

For the high achievable scenario, we projected 10 years beyond the 2022 adoption level using the mean adoption trend of 4.12%/yr. This translates to a 41% growth on top of the current adoption level of 50.5%, summing up to a 92% LED adoption level (Table 7).

left_text_column_width

Table 7. Range of achievable adoption levels.

Unit: % lamps LED

Current Adoption 50.5
Achievable – Low 87
Achievable – High 92
Adoption Ceiling 100
Left Text Column Width

We estimated that current adoption cuts about 0.36 Gt CO₂‑eq emissions on a 100-yr basis compared with the previous alternative lighting sources (Table 8). The low achievable adoption scenario of 87% LED lamps could cut emissions 0.62 Gt CO₂‑eq/yr due to reduced electricity consumption, while a high achievable adoption scenario of 92% LED lamps could cut emissions 0.65 Gt CO₂‑eq/yr. If the adoption ceiling of 100% LEDs for lighting buildings is reached, we estimate that 0.71 Gt CO₂‑eq/yr could be avoided (Table 8).

LED lighting could further cut electricity consumption as LED technology continues to improve. However, the technology’s future climate impacts will depend on the emissions of future electricity-generation systems.

left_text_column_width

Table 8. Climate impact at different levels of adoption.

Unit: Gt CO₂‑eq/yr 100-yr basis

Current Adoption 0.36
Achievable – Low 0.62
Achievable – High 0.65
Adoption Ceiling 0.71
Left Text Column Width
Additional Benefits

Air and Water Quality

The lower electricity demand of LEDs could help reduce emissions from power plants and so improve air quality (Amann et al., 2022). Additionally, LEDs can mitigate small amounts of mercury found in fluorescent lights (Amann et al., 2022). Mercury contamination from discarded bulbs in landfills can leach into surrounding water bodies and accumulate in aquatic life. LEDs also have longer lifespans than fluorescent and incandescent bulbs (Nair & Dhoble, 2021b) which can reduce the amount of discarded bulbs and further mitigate environmental degradation from landfills. 

Income and Work

Because LEDs use less electricity than fluorescent and incandescent light bulbs (Khan & Abas, 2011), households and businesses using LED technology can save money on electricity costs. The payback period for the initial investment from lower utility bills is about one year for residential buildings and about two months for commercial buildings (Amann et al., 2022). LED lighting can contribute to savings by minimizing energy demand for cooling, since LEDs emit less heat than fluorescent and incandescent bulbs (Albatayneh et al., 2021; Schratz et al., 2016). However, it could also lead to a greater need for space heating in some regions. LED lights also last longer than alternative lighting technologies, which can lead to lower maintenance costs (Schratz et al., 2016).

Health

Reductions in air pollution due to LED lighting’s lower electricity demand decrease exposures to pollutants such as mercury and fine particulate matter generated from fossil fuel-based power plants, improving the health of nearby communities [Environmental Protection Agency (EPA), 2024]. These pollutants have been linked to increased morbidity from cardiovascular and respiratory disease, asthma, infections, and cancer, (Gasparotto & Martinello, 2021) and to increased risk of mortality (Henneman et al., 2023). Because LEDs do not contain mercury, they can mitigate small health risks associated with mercury exposure when fluorescent light bulbs break (Bose-O’Reilly et al., 2010; Sarigiannis et al., 2012). Switching to LEDs can also enhance a visual environment and improve occupants’ well-being, visual comfort, and overall productivity when lamps with the appropriate lighting quality and correlated color temperature are selected (Fu et al., 2023; Iskra-Golec et al., 2012; Nair & Dhoble, 2021b).

left_text_column_width
Risks

We found limited data indicating risks with choosing LEDs over other lighting sources. Concerns about eye health raised in the early days of LED adoption (Behar-Cohen et al., 2011) have been allayed by studies that found that LEDs do not pose a greater risk to the eye than comparable lighting sources (Moyano et al. 2020). 

LED manufacturing uses metals like gold, indium, and gallium (Gao et al., 2022). This creates environmental risks due to mining (Xiong et al., 2023) and makes LED supply chains susceptible to macroeconomic uncertainties (Lee et al., 2021). With growing adoption of LED lights, there is also the risk of greater electronic waste at the end of the LED’s lifespan. Therefore, recycling is increasingly important (Cenci et al., 2020). 

left_text_column_width
Interactions with Other Solutions

Reinforcing

Other lighting sources such as incandescent lamps are known to produce some heat, thus adding to the cooling load. LEDs are more energy-efficient, and therefore could reduce the cooling requirements of a space. 

left_text_column_width

Competing

Some studies demonstrate an increase in the indoor heating requirements when switching to LED lighting from other lighting sources, such as incandescent lamps, that produce more heat than LEDs. The difference is often small, but worth taking into account when adopting LEDs in a building with previously energy-inefficient lighting.

left_text_column_width
Dashboard

Solution Basics

% lamps LED

tCO2-eq/unit
7.09×10⁶
units
Current 50.58792
Achievable (Low to High)

Climate Impact

GtCO2-eq/yr
Current 0.36 0.620.65
US$ per tCO2-eq
-175
Gradual

CO₂, CH₄, N₂O, BC

Trade-offs

LED lamp manufacturing creates more emissions than manufacturing other types of lamps. For example, Zhang et al. (2023) compared the manufacturing emissions of a 12.5W LED lamp with a 14W CFL and a 60W incandescent bulb. These light sources provided similar levels of illumination (850–900 lumens). The production of one LED bulb resulted in 9.81 kg CO₂‑eq emissions, while the CFL and incandescent resulted in 2.29 and 0.73 kg CO₂‑eq emissions, respectively. However, LEDs are preferred because their longevity results in fewer LED lamps required to provide the same amount of lighting over time. LEDs can last 25 times longer than incandescent lamps with an identical lumen output (Nair & Dhoble, 2021b; Xu, 2019; Zhang et al., 2023). 

left_text_column_width
% LED lamps
< 20
20–40
40–60
> 60
No data

Percentage of lamps that are LEDs, circa 2020

The percentage of lamps used to light buildings that are LEDs varies around the world, with limited data available on a per-country basis.

Miah, M. A. R., & Kabir, R. (2023). Energy savings forecast for solid-state lighting in residential and commercial buildings in Bangladesh. IEEE PES 15th Asia-Pacific Power and Energy Engineering Conference (APPEEC), pp. 1-6, doi: 10.1109/APPEEC57400.2023.10561921

U.S. Department of Energy (2024). 2020 U.S. lighting market characterization. https://www.energy.gov/sites/default/files/2024-08/ssl-lmc2020_apr24.pdf

World Furniture Online (2017). The lighting fixtures market in Australia and New Zealand. https://www.worldfurnitureonline.com/report/the-lighting-fixtures-market-in-australia-and-new-zealand/

Zissis, G., Bertoldi, P., & Serrenho, T. (2021). Update on the status of LED-lighting world market since 2018. Publications Office of the European Union. https://publications.jrc.ec.europa.eu/repository/handle/JRC122760

Geographic Guidance Introduction

The Deploy LED Lighting solution can be equally effective at reducing electricity use across global regions because the efficiency gained by replacing other bulbs with LEDs is functionally identical. However, its climate impact will vary with the emissions intensity of each region’s electricity grid. Secondary considerations associated with uptake of LED lighting also can vary with climate and hence geography. In particular, the decrease in heating associated with LED lighting can reduce demands on air conditioning, leading to increased incentive for solution uptake in warmer climates.

Historically, a few countries typically account for the bulk of LEDs purchased. For example, 30% of the 5 billion LEDs sold globally in 2016 were sold in China. In the same period, North America accounted for 15% while Western Europe, Japan, and India represented 11%, 10%, and 8% of the LEDs sold, respectively (Kamat et al., 2020; U.S. DOE, 2016). Essentially, the growing sales of LEDs drove global adoption levels from 17.6% of the building lighting market in 2016 to 50.5% in 2022 (Lane, 2023). However, current adoption still varies considerably around the world. For instance, Lee et al. (2024) reported that LED market penetration in the U.S. was 47.5% in 2020, compared with 43.3% globally in the same period (Lane, 2023). Meanwhile, LED adoption in France was 35% in 2017, and countries in the Middle East such as the United Arab Emirates, Saudi Arabia, and Turkey had over 70% LED adoption that same year; residential buildings in the United Kingdom had 13% LED adoption in 2018, while Japan had 60% LED adoption as of 2019 (Zissis et al., 2021). This demonstrates potential to scale LED adoption in the future, especially in low- and middle-income countries where the bulk of new building occurs (IEA, 2023).

Action Word
Deploy
Solution Title
LED Lighting
Classification
Highly Recommended
Lawmakers and Policymakers
  • Use regulations to phase out and replace energy-inefficient lighting sources with LEDs.
  • Set regulations that encourage sufficient lighting to limit the overuse of LEDs (or rebound effects).
  • Require that public lighting use LEDs.
  • Use financial incentives such as tax breaks, subsidies, and grants to facilitate the transition to LEDs.
  • Revise building energy-efficiency standards to reflect energy savings of LEDs.
  • Develop production standards and mandate labeling for LEDs.
  • Build sufficient inspection capacity for LED manufacturers and penalize noncompliance with standards.
  • Use energy-efficiency purchase agreements to help support utility companies during the transition to LED lighting.
  • Invest in research and development that improves the cost and efficiency of LED lighting.
  • Develop a certification program for LED lighting.
  • Create exchange programs or buy-back programs for inefficient light bulbs.
  • Start demonstration projects to promote LED lighting.
  • Join, support, or create educational programs that raise public awareness about the cost savings and energy-efficiency gains associated with LEDs.
Practitioners
  • Take advantage of or advocate for financial incentives such as tax breaks, subsidies, and grants to facilitate the production of LED lighting.
  • Help develop circular supply chains in renovating, remanufacturing, reusing, and redistributing materials.
  • Invest in research and development to improve efficiency and cost of LEDs.
  • Adhere to, or advocate for, national LED standards.
  • Develop, produce, and sell LED lighting that imitates incandescent or other familiar lighting.
  • Consider bundling services with retrofitting companies and collaborating with utility companies to offer rebates or other incentives.
  • Improve self-service of LEDs by reducing obstacles to installation and ensuring LEDs can be easily replaced.
  • Help create positive perceptions of LED lighting by showcasing usage, cost savings, and emissions reductions.
  • Create feedback mechanisms, such as apps that alert users to real-time benefits such as energy and cost savings.
  • Start demonstration projects to promote LED lighting.
  • Join, support, or create educational programs that raise public awareness about the cost savings and energy-efficiency gains associated with LEDs.
Business Leaders
  • Retrofit existing operations for LEDs, replace inefficient bulbs, and purchase only LEDs going forward.
  • Help develop circular supply chains in renovating, remanufacturing, reusing, and redistributing LED lighting materials.
  • Take advantage of financial incentives such as tax breaks, subsidies, and grants to facilitate the transition to LED lighting.
  • Invest in research and development that improves the cost and efficiency of LED lighting.
  • Join, support, or create educational programs that raise public awareness about the cost savings and energy-efficiency gains associated with LEDs.
Nonprofit Leaders
  • Retrofit existing operations for LEDs, replace inefficient bulbs, and purchase only LEDs going forward.
  • Help develop circular supply chains in renovating, remanufacturing, reusing, and redistributing LED lighting materials.
  • Take advantage of, or advocate for, financial incentives such as tax breaks, subsidies, and grants to facilitate the transition to LED lighting.
  • Advocate for regulations to phase out and replace energy-inefficient lighting sources with LEDs.
  • Advocate for production standards and labeling for LEDs.
  • Call for regulations that encourage sufficient lighting to limit the overuse of LEDs (or rebound effects).
  • Start demonstration projects to promote LED lighting.
  • Help develop, support, or administer a certification program for LED lighting.
  • Create national catalogs of LED manufacturers, suppliers, and retailers.
  • Join, support, or create educational programs that raise public awareness about the cost savings and energy-efficiency gains associated with LEDs.
Investors
  • Retrofit existing operations for LEDs, replace inefficient bulbs, and purchase only LEDs going forward.
  • Take advantage of financial incentives such as tax breaks, subsidies, and grants to facilitate the transition to LED lighting.
  • Invest in LED manufacturers, supply chains, and supportive industries.
  • Support research and development to improve the efficiency and cost of LEDs.
  • Invest in LED companies.
  • Fund companies that provide retrofitting services (energy service companies).
  • Invest in businesses dedicated to advancing LED use.
  • Ensure portfolio companies do not produce or support non-LED lighting supply chains.
  • Join, support, or create educational programs that raise public awareness about the cost savings and energy-efficiency gains associated with LEDs.
Philanthropists and International Aid Agencies
  • Retrofit existing operations for LEDs, replace inefficient bulbs, and purchase only LEDs going forward.
  • Take advantage of financial incentives such as tax breaks, subsidies, and grants to facilitate the transition to LED lighting.
  • Provide financing such as low-interest loans, grants, and micro-grants to help accelerate LED adoption.
  • Fund companies that provide retrofitting services (energy service companies).
  • Advocate for regulations to phase out energy-inefficient lighting sources and replace them with LEDs.
  • Call for regulations that encourage sufficient lighting to limit the overuse of LEDs (or rebound effects).
  • Start demonstration projects to promote LED lighting.
  • Help develop, support, or administer a certification program for LED lighting.
  • Create national catalogs of LED manufacturers, suppliers, and retailers.
  • Join, support, or create educational programs that raise public awareness about the cost savings and energy-efficiency gains associated with LEDs.
Thought Leaders
  • Retrofit buildings for LED lighting, replace inefficient bulbs, and purchase only LEDs going forward.
  • Help create positive perceptions of LED lighting by highlighting your personal usage, cost and energy savings, and emissions reductions.
  • Help develop circular supply chains in renovating, remanufacturing, reusing, and redistributing materials.
  • Take advantage of, or advocate for, financial incentives such as tax breaks, subsidies, and grants to facilitate the transition to LED lighting.
  • Advocate for regulations to phase out energy-inefficient lighting sources and replace them with LEDs.
  • Advocate for LED standards.
  • Advocate for regulations that encourage sufficient lighting and guard against overuse of LEDs (or rebound effects).
  • Start demonstration projects to promote LED lighting.
  • Help develop, support, or administer a certification program for LED lighting.
  • Create national catalogs of LED manufacturers, suppliers, and retailers.
  • Join, support, or create educational programs that raise public awareness about the cost savings and energy-efficiency gains associated with LEDs.
Technologists and Researchers
  • Develop circular supply chains in renovating, remanufacturing, reusing, and redistributing materials.
  • Improve the efficiency and cost of LEDs.
  • Improve LED lighting to imitate familiar lighting, offer customers settings, and augment color rendering.
  • Improve self-service of LEDs by reducing obstacles to installation and ensuring LEDs can be replaced individually.
  • Help develop standards for LEDs.
  • Create feedback mechanisms, such as apps that alert users to real-time benefits such as energy and cost savings.
Communities, Households, and Individuals
  • Retrofit for LEDs, replace inefficient bulbs, and purchase only LEDs going forward.
  • Help create positive perceptions of LED lighting by highlighting your personal usage, cost and energy savings, and emissions reductions.
  • Help develop circular supply chains in renovating, remanufacturing, reusing, and redistributing materials.
  • Take advantage of or advocate for financial incentives such as tax breaks, subsidies, and grants to facilitate the transition to LED lighting.
  • Advocate for regulations to phase out and replace energy-inefficient lighting sources with LEDs.
  • Advocate for LED standards.
  • Advocate for regulations that encourage sufficient lighting to limit the overuse of LEDs (or rebound effects).
  • Join, support, or create educational programs that raise public awareness about the cost savings and energy-efficiency gains associated with LEDs.
Evidence Base

The level of consensus about the effectiveness of replacing other lighting sources with LEDs is High. 

Using LEDs significantly minimizes the electricity required to light buildings, thereby reducing GHG emissions from electricity generation. Many countries are phasing out other lighting sources to reduce GHG emissions (Lane, 2023).

The IEA reported that global adoption of LEDs drove a nearly 30% reduction in annual electricity consumption for lighting in homes between 2010 and 2022 (Lane, 2023). Hasan et al. (2024) indicated that LEDs could reduce the lighting energy usage of buildings (and their resulting GHG emissions) in Bangladesh by 50%. Periyannan et al. (2023) recorded significant electricity savings after evaluating the impact of retrofitting hotels in Sri Lanka with LEDs. Forastiere et al. (2024)’s analysis of the retail buildings in Italy showed an 11% reduction in energy consumption from replacing other lamps with LEDs. Booysen et al., (2021) also achieved significant energy reduction with lighting retrofits in South African educational buildings.

The results presented in this document summarize findings from six original studies and three public sector/multilateral agency reports, which collectively reflect current evidence both globally and from six countries on four different continents. We recognize this limited geographic scope creates bias, and hope this work inspires research and data sharing on this topic in underrepresented regions.

left_text_column_width
Updated Date

Deploy Clean Cooking

Sector
Buildings
Image
Image
Family cooking on a clean stove indoors
Coming Soon
Off
Summary

We define the Deploy Clean Cooking solution as the use of cleaner cooking fuels (liquid petroleum gas, natural gas, electricity, biogas, and ethanol) in place of polluting fuels such as wood, charcoal, dung, kerosene, and coal, and/or the use of efficient cookstove technologies (together called cleaner cooking solutions). Replacing unclean fuel and cookstoves with cleaner approaches can drastically reduce GHG emissions while offering health and biodiversity benefits.

Overview

Worldwide, cooking is responsible for an estimated 1.7 Gt CO₂‑eq/yr (100-yr basis), (World Health Organization [WHO], 2023), or almost 3% of annual global emissions. Most of these emissions come from burning nonrenewable biomass fuels. Only the CO₂‑eq on a 100-yr basis is reported here due to lack of data on the relative contributions of GHGs. The International Energy Agency (IEA, 2023a) states that 2.3 billion people in 128 countries currently cook with coal, charcoal, kerosene, firewood, agricultural waste, or dung over open fires or inefficient cookstoves because they do not have the ability to regularly cook using cleaner cooking solutions. Even when sustainably harvested, biomass fuel is not climate neutral because it emits methane and black carbon (Smith, 2002).

Clean cooking reduces GHG emissions through three pathways: 

Improving efficiency

Traditional biomass or charcoal cookstoves are less than 15% efficient (Khavari et al., 2023), meaning most generated heat is lost to the environment rather than heating the cooking vessel and food. Cleaner fuels and technologies can be many times more efficient, using less energy to prepare meals than traditional fuels and cookstoves (Kashyap et al., 2024). 

Reducing carbon intensity

Cleaner fuels have lower carbon intensity, producing significantly fewer GHG emissions per unit of heat generated than conventional fuels. Carbon intensity includes CO₂, methane, and nitrous oxides as well as black carbon. For instance, charcoal cookstoves emit approximately 572 kg CO₂‑eq /GJ of heat delivered for cooking (Cashman et al., 2016). In contrast, liquefied petroleum gas (LPG) and biogas emit about 292 and 11 kg CO₂‑eq /GJ, respectively (Cashman et al., 2016) and, excluding the embodied carbon, stoves that heat with electricity generated from renewable energy sources such as solar, wind, or hydroelectric have zero emissions.

Reducing deforestation

Cleaner cooking also helps mitigate climate change by reducing deforestation (Clean Cooking Alliance [CCA], 2023) and associated GHG emissions. 

Figure 1. Classification of household cooking fuels as clean (green) and polluting (orange). Adapted from Stoner et al. 2021.

Source: Stoner, O., Lewis, J., Martínez, I. L., Gumy, S., Economou, T., & Adair-Rohani, H. (2021). Household cooking fuel estimates at global and country level for 1990 to 2030. Nature communications12(1), 5793.https://www.nature.com/articles/s41467-021-26036-x

References

Afrane, G., & Ntiamoah, A. (2011). Comparative life cycle assessment of charcoal, biogas, and liquefied petroleum gas as cooking fuels in Ghana. Journal of Industrial Ecology15(4), 539-549. https://onlinelibrary.wiley.com/doi/abs/10.1111/j.1530-9290.2011.00350.x

Afrane, G., & Ntiamoah, A. (2012). Analysis of the life-cycle costs and environmental impacts of cooking fuels used in Ghana. Applied energy98, 301-306. https://www.sciencedirect.com/science/article/abs/pii/S0306261912002590

Anenberg, S. C., Balakrishnan, K., Jetter, J., Masera, O., Mehta, S., Moss, J., & Ramanathan, V. (2013). Cleaner cooking solutions to achieve health, climate, and economic cobenefits. https://pubs.acs.org/doi/10.1021/es304942e

Bailis, R., Drigo, R., Ghilardi, A., & Masera, O. (2015). The carbon footprint of traditional woodfuels. Nature Climate Change5(3), 266-272. https://www.nature.com/articles/nclimate2491

Bensch, G., Jeuland, M., & Peters, J. (2021). Efficient biomass cooking in Africa for climate change mitigation and development. One Earth4(6), 879-890. https://www.cell.com/one-earth/pdf/S2590-3322(21)00296-7.pdf

Bennitt, F. B., Wozniak, S. S., Causey, K., Burkart, K., & Brauer, M. (2021). Estimating disease burden attributable to household air pollution: new methods within the Global Burden of Disease Study. The Lancet Global Health9, S18. https://doi.org/10.1016/S2214-109X(21)00126-1

Bergero, C., Gosnell, G., Gielen, D., Kang, S., Bazilian, M., & Davis, S. J. (2023). Pathways to net-zero emissions from aviation. Nature Sustainability6(4), 404-414. https://www.nature.com/articles/s41893-022-01046-9

​​Biswas, S., & Das, U. (2022). Adding fuel to human capital: Exploring the educational effects of cooking fuel choice from rural India. Energy Economics, 105, 105744. https://doi.org/10.1016/j.eneco.2021.105744

Cabiyo, B., Ray, I., & Levine, D. I. (2020). The refill gap: clean cooking fuel adoption in rural India. Environmental Research Letters16(1), 014035. https://iopscience.iop.org/article/10.1088/1748-9326/abd133

Cashman, S., Rodgers, M., & Huff, M. (2016). Life-cycle assessment of cookstove fuels in India and China. US Environmental Protection Agency, Washington, DC. EPA/600/R-15/325. https://cleancooking.org/wp-content/uploads/2021/07/496-1.pdf

Clean Cooking Alliance (CCA). (2023). Accelerating clean cooking as a nature-based solution. https://cleancooking.org/reports-and-tools/accelerating-clean-cooking-as-a-nature-based-climate-solution/

Clean Cooking Alliance. (2022). Clean cooking as a catalyst for sustainable food systemshttps://cleancooking.org/wp-content/uploads/2023/11/CCA_Clean-Cooking-as-a-Catalyst-for-Sustainable-Food-Systems.pdf

Climate & Clean Air Coalition (2024). Nationally determined contributions and clean cooking. https://www.ccacoalition.org/resources/nationally-determined-contributions-and-clean-cooking

Choudhuri, P., & Desai, S. (2021). Lack of access to clean fuel and piped water and children’s educational outcomes in rural India. World Development, 145, 105535. https://doi.org/10.1016/j.worlddev.2021.105535

Dagnachew, A. G., Lucas, P. L., van Vuuren, D. P., & Hof, A. F. (2018). Towards universal access to clean cooking solutions in sub-Saharan Africa. PBL Netherlands Environmental Assessment Agency.

Energy Sector Management Assistance Program. (2023). Building evidence to unlock impact finance : A field assessment of lean cooking co-benefits for climate, health, and gender. Retrieved 13 September 2024, from https://www.esmap.org/Building_Evidence_To_unloc_Impact_Finance_Benefits

Fullerton, D. G., Bruce, N., & Gordon, S. B. (2008). Indoor air pollution from biomass fuel smoke is a major health concern in the developing world. Transactions of the Royal Society of Tropical Medicine and Hygiene, 102(9), 843–851. https://doi.org/10.1016/j.trstmh.2008.05.028

Down to Earth (2022). Ujjwala: Over 9 million beneficiaries did not refill cylinder last year, Centre admits. Retrieved 20 June 2024, from https://www.downtoearth.org.in/energy/ujjwala-over-9-million-beneficiaries-did-not-refill-cylinder-last-year-centre-admits-84130

Garland, C., Delapena, S., Prasad, R., L'Orange, C., Alexander, D., & Johnson, M. (2017). Black carbon cookstove emissions: A field assessment of 19 stove/fuel combinations. Atmospheric Environment169, 140-149. https://doi.org/10.1016/j.atmosenv.2017.08.040

International Energy Agency (2022). Africa energy outlook. https://www.iea.org/reports/africa-energy-outlook-2022/key-findings

International Energy Agency (2023a). A vision for clean cooking access for all. https://iea.blob.core.windows.net/assets/f63eebbc-a3df-4542-b2fb-364dd66a2199/AVisionforCleanCookingAccessforAll.pdf 

International Energy Agency (2023b). Electricity market report. https://www.iea.org/reports/electricity-market-report-update-2023

Intergovernmental Panel on Climate Change (2022). Climate change 2022: mitigation of climate change. Contribution of the Working Group III to the sixth assessment report of the Intergovernmental Panel on Climate Change. https://www.ipcc.ch/report/ar6/wg3/

Jameel, Y., Patrone, C. M., Patterson, K. P., & West, P. C. (2022). Climate-poverty connections: Opportunities for synergistic solutions at the intersection of planetary and human well-being. https://drawdown.org/publications/climate-poverty-connections-report

Jewitt, S., Atagher, P., & Clifford, M. (2020). “We cannot stop cooking”: Stove stacking, seasonality and the risky practices of household cookstove transitions in Nigeria. Energy Research & Social Science61, 101340. https://www.sciencedirect.com/science/article/pii/S2214629619304700?via%3Dihub

Johnson, E. (2009). Charcoal versus LPG grilling: a carbon-footprint comparison. Environmental Impact Assessment Review29(6), 370-378. https://www.sciencedirect.com/science/article/abs/pii/S0195925509000420

Kapsalyamova, Z., Mishra, R., Kerimray, A., Karymshakov, K., & Azhgaliyeva, D. (2021). Why energy access is not enough for choosing clean cooking fuels? Evidence from the multinomial logit model. Journal of Environmental Management290, 112539. https://www.sciencedirect.com/science/article/pii/S0301479721006010

Khavari, B., Ramirez, C., Jeuland, M., & Fuso Nerini, F. (2023). A geospatial approach to understanding clean cooking challenges in sub-Saharan Africa. Nature Sustainability6(4), 447-457 https://www.nature.com/articles/s41893-022-01039-8

Lacey, F. G., Henze, D. K., Lee, C. J., van Donkelaar, A., & Martin, R. V. (2017). Transient climate and ambient health impacts due to national solid fuel cookstove emissions. Proceedings of the National Academy of Sciences114(6), 1269-1274.https://www.pnas.org/doi/full/10.1073/pnas.1612430114

Lansche, J., & Müller, J. (2017). Life cycle assessment (LCA) of biogas versus dung combustion household cooking systems in developing countries–a case study in Ethiopia. Journal of cleaner production165, 828-835. https://www.sciencedirect.com/science/article/abs/pii/S0959652617315597

Lee, M., Chang, J., Deng, Q., Hu, P., Bixby, H., Harper, S., ... & Liu, J. (2024). Effects of a coal to clean heating policy on acute myocardial infarction in Beijing: a difference-in-differences analysis. The Lancet Planetary Health8(11), e924-e932. https://doi.org/10.1016/S2542-5196(24)00243-2

Mazorra, J., Sánchez-Jacob, E., de la Sota, C., Fernández, L., & Lumbreras, J. (2020). A comprehensive analysis of cooking solutions co-benefits at household level: Healthy lives and well-being, gender and climate change. Science of The Total Environment707, 135968. https://www.sciencedirect.com/science/article/abs/pii/S0048969719359637

Po, J. Y. T., FitzGerald, J. M., & Carlsten, C. (2011). Respiratory disease associated with solid biomass fuel exposure in rural women and children: Systematic review and meta-analysis. Thorax, 66(3), 232–239. https://doi.org/10.1136/thx.2010.147884

Rosenthal, J., Quinn, A., Grieshop, A. P., Pillarisetti, A., & Glass, R. I. (2018). Clean cooking and the SDGs: Integrated analytical approaches to guide energy interventions for health and environment goals. Energy for Sustainable Development42, 152-159. https://www.sciencedirect.com/science/article/pii/S0973082617309857

Shaik, S. R., Muthukumar, P., & Kalita, P. C. (2022). Life cycle assessment of LPG cook-stove with porous radiant burner and conventional burner–a comparative study. Sustainable Energy Technologies and Assessments52, 102255. https://doi.org/10.1016/j.seta.2022.102255

Shankar, A. V., Quinn, A. K., Dickinson, K. L., Williams, K. N., Masera, O., Charron, D., ... & Rosenthal, J. P. (2020). Everybody stacks: Lessons from household energy case studies to inform design principles for clean energy transitions. Energy Policy141, 111468. https://doi.org/10.1016/j.enpol.2020.111468

Simkovich, S. M., Williams, K. N., Pollard, S., Dowdy, D., Sinharoy, S., Clasen, T. F., ... & Checkley, W. (2019). A systematic review to evaluate the association between clean cooking technologies and time use in low-and middle-income countries. International journal of environmental research and public health16(13), 2277. https://www.mdpi.com/1660-4601/16/13/2277

Singh, P., Gundimeda, H., & Stucki, M. (2014). Environmental footprint of cooking fuels: a life cycle assessment of ten fuel sources used in Indian households. The International Journal of Life Cycle Assessment19, 1036-1048. https://link.springer.com/article/10.1007/s11367-014-0699-0

Smith, K. R. (2002). In praise of petroleum? Science298(5600), 1847-1847. DOI: 10.1126/science.298.5600.1847

Stoner, O., Lewis, J., Martínez, I. L., Gumy, S., Economou, T., & Adair-Rohani, H. (2021). Household cooking fuel estimates at global and country level for 1990 to 2030. Nature communications12(1), 5793.https://www.nature.com/articles/s41467-021-26036-x

U.S. Environmental Protection Agency. (2022). 2021-2022 residential induction cooking tops. Retrieved 19 August 2024, from https://www.energystar.gov/partner_resources/products_partner_resources/brand-owner/eta-consumers/res-induction-cooking-tops#:~:text=Residential%20induction%20cooking%20tops%20instead,energy%20with%20approximately%2085%25%20efficiency.

World Bank (2018). A recipe for protecting the Democratic Republic of Congo’s tropical forests. Retrieved 16 January 2025, from https://www.worldbank.org/en/news/feature/2018/01/24/a-recipe-for-protecting-the-democratic-republic-of-congos-tropical-forests

 World Bank (2020). Energy Sector Management Assistance Program. (2020). The state of access to modern energy cooking serviceshttps://www.worldbank.org/en/topic/energy/publication/the-state-of-access-to-modern-energy-cooking-services

 World Bank (2023). Moving the needle on clean cooking for all. Retrieved 13 September 2024, from https://www.worldbank.org/en/results/2023/01/19/moving-the-needle-on-clean-cooking-for-all

World Health Organization (2025). Proportion of population with primary reliance on clean fuels and technologies. Retrieved 1, May 2025, from https://www.who.int/data/gho/data/themes/air-pollution/household-air-pollution 

World Health Organization (2023). Achieving universal access and net-zero emissions by 2050: a global roadmap for just and inclusive clean cooking transition. https://www.who.int/publications/m/item/achieving-universal-access-by-2030-and-net-zero-emissions-by-2050-a-global-roadmap-for-just-and-inclusive-clean-cooking-transition

World Health Organization (2024a). WHO publishes new global data on the use of clean and polluting fuels for cooking by fuel type. Retrieved 17 June 2024, https://www.who.int/news/item/20-01-2022-who-publishes-new-global-data-on-the-use-of-clean-and-polluting-fuels-for-cooking-by-fuel-type#:~:text=As%20of%202021%2C%202.3%20billion,%2D%20and%20middle%2Dincome%20countries.

World Health Organization (2024b). Household air pollution. Retrieved 17 June 2024, https://www.who.int/news-room/fact-sheets/detail/household-air-pollution-and-health

Credits

Lead Fellow

  • Yusuf Jameel, Ph.D.

Contributors

  • Ruthie Burrows, Ph.D.

  • James Gerber, Ph.D.

  • Yusuf Jameel, Ph.D.

  • Daniel Jasper

  • Heather McDiarmid, Ph.D.

  • Amanda Smith, Ph.D.

  • Alex Sweeney

Internal Reviewers

  • Aiyana Bodi

  • Hannah Henkin

  • Megan Matthews, Ph.D.

  • Ted Otte

  • Amanda Smith, Ph.D.

  • Tina Swanson, Ph.D.

Effectiveness

The climate impact of cleaner cooking depends on which fuel and technology is being replaced and what is replacing it. The WHO (2024) categorizes cooking fuels as clean, transitional, or polluting based primarily on health impacts. Clean fuels include solar, electric, biogas, LPG, and alcohols, while kerosene and unprocessed coal are polluting fuels. Biomass cooking technologies may be classified as clean, transitional, or polluting depending on the levels of fine particulate matter and carbon monoxide produced. Switching from traditional cookstoves (polluting) to improved cookstoves (transitional) can reduce emissions 20–40%, while switching to an LPG or electric cookstove can reduce emissions more than 60% (Johnson, 2009). Not including the embodied carbon, switching completely to solar-powered electric cookstoves can reduce emissions 100%.

We estimated the effectiveness of cleaner cooking by calculating the reduction in GHG emissions per household switching to cleaner cooking solutions per year (Table 1). Our analysis of national, regional, and global studies suggested that switching to cleaner fuels and technologies can reduce emissions by 0.83–3.4 t CO₂‑eq /household/yr (100-yr basis), including CO₂, methane, black carbon, and sometimes other GHGs. The large range is due to varying assumptions. For example, the IEA arrived at 3.2 t CO₂‑eq /household/yr (100-yr basis) by assuming that >50% of the households switched to electricity or LPG. In comparison, Bailis et al. (2015) assumed a switch from unclean cookstoves to improved biomass cookstoves, resulting in an emissions reduction of only 0.98 t CO₂‑eq /household/yr (100-yr basis).

left_text_column_width

Table 1. Effectiveness at reducing GHG emissions of switching from unclean cooking fuels and technologies to cleaner versions.

Unit: t CO-eq/household switching to cleaner cooking solutions/yr, 100-yr basis

25th percentile 1.5
mean 2.2
median (50th percentile) 2.3
75th percentile 3.1
Left Text Column Width

While we estimated a median reduction of 2.3 t CO₂‑eq /household switching to cleaner cooking solutions/yr (100-yr basis), the actual reduction per household might be lower because households often stack cleaner cooking fuel with unclean fuel. This could result from multiple socioeconomic factors. For instance, a household may primarily rely on LPG as its main cooking fuel but occasionally turn to firewood or kerosene for specific dishes, price fluctuation, or fuel shortages (Khavari et al., 2023). In rural areas, cleaner fuels and traditional biomass (e.g., wood or dung) are used together to cut costs or due to personal preferences.

left_text_column_width
Cost

People can obtain traditional unclean fuels and traditional woodstoves for little or no cost (Bensch et al., 2021; Kapsalyamova, 2021). Our analysis estimated the cost of woodstoves at US$1.50/household and the monetary cost of biomass fuel at US$0.00/household/yr. Over the two-yr lifespan of a woodstove, the net annualized cost is US$0.75/household/yr. While collecting this fuel might be free, it contributes to poverty because households can spend one to three hours daily collecting fuelwood. This can contribute to children, especially girls, missing school (Jameel et al., 2023). 

We estimated the median upfront cost of transitioning from primarily unclean cooking fuels and technology to cleaner cooking to be approximately US$54/household, with stoves lasting 3–10 years. However, the range of annual costs is large because several cleaner cooking technologies have significant variations in price, and cleaner fuel cost is even more variable. Our analysis showed a median annual fuel cost of US$56/household/yr with costs ranging from savings of US$9/household/yr when buying less biomass for more efficient biomass stoves to costs of US$187/household/yr for LPG. Over a five-yr lifespan, cleaner cooking solutions have a net cost of US$64/household/yr (Table 2). 

Our analysis may overestimate operational costs due to a lack of data on biomass and charcoal costs. The IEA (2023a) estimates that an annual investment of US$8 billion is needed to supply cleaner cookstoves, equipment, and infrastructure to support a transition to cleaner cooking. This translates to US$17/household/yr. 

The IEA (2023) assumes improved biomass and charcoal cookstoves are predominantly adopted in rural areas while LPG and electric stoves are adopted in urban regions because, in LMICs, economic and infrastructure challenges can limit access to LPG and electricity in rural areas. If every household were to switch exclusively to modern cooking (e.g., LPG and electricity), the cost would be much higher. The World Bank estimates the cost of implementing these solutions to be US$1.5 trillion between 2020 and 2030 or ~US$150 billion/yr over the next 10 years. This translates into an average cost of US$214/household/yr (World Bank, 2020). 

left_text_column_width

Table 2. Cost of cleaner cooking solutions.

Unit: 2023 US$/household switching to cleaner cooking solution

Median cookstove cost 1.50
Median annual fuel cost 0.00
Net annual cost 0.74

Unit: 2023 US$/household switching to cleaner cooking solution

Median cookstove cost 54
Median annual fuel cost 56
Net annual cost 64
Left Text Column Width

The median cost per unit of climate impact was US$27/t CO₂‑eq (100-yr basis, Table 3), obtained by taking the difference between median cost of cooking with polluting sources and the cost of adopting cleaner fuel, then dividing by the median reduction per household (Table 1). Beyond climate benefits, cleaner cooking offers significant other benefits (discussed under Additional Benefits below). While the median cost presented here is a reasonable first-order estimate, the actual cost of GHG reduction will depend upon several factors, including the type of stove adopted, stove usage, fuel consumption, and scale of adoption. 

left_text_column_width

Table 3. Cost per unit climate impact.

Unit: 2023 US$/t CO‑eq, 100-yr basis

median (50th percentile) 27
Left Text Column Width
Learning Curve

Deploying cleaner cooking is a mature technology, and prices are unlikely to decrease in high-income countries where cleaner cooking fuels and technologies have been completely adopted. Nonetheless, the high cost of cleaner cooking technologies and the fluctuating prices of cleaner cooking fuel have been among the main impediments in the transition of households experiencing poverty away from unclean fuels and technologies. For example, recent price surges in Africa rendered LPG unaffordable for 30 million people (IEA, 2022). Electricity prices have also fluctuated regionally. In Europe and India, prices were higher in 2023 than in 2019 (IEA, 2023b). In contrast, U.S. electricity prices have remained stable over the past five years, while China experienced an 8% decrease.

left_text_column_width
Speed of Action

Speed of action refers to how quickly a climate solution physically affects the atmosphere after it is deployed. This is different from speed of deployment, which is the pace at which solutions are adopted.

At Project Drawdown, we define the speed of action for each climate solution as gradualemergency brake, or delayed.

Deploy Clean Cooking is an EMERGENCY BRAKE climate solution. It has the potential to deliver a more rapid impact than nominal and delayed solutions. Because emergency brake solutions can deliver their climate benefits quickly, they can help accelerate our efforts to address dangerous levels of climate change. For this reason, they are a high priority.

left_text_column_width
Caveats

Households may continue using unclean cooking fuel and technologies alongside cleaner fuels and technologies (referred to as stacking). The data on cleaner cooking are typically measured as the number of households primarily relying on cleaner cooking fuel. This fails to capture the secondary fuel source used in the household. A review from LMICs revealed that stacking can range from low (28%) to as high as 100%, which would mean that every household is simultaneously using cleaner and unclean fuel (Shankar et al., 2020). This can happen due to factors like an increase in the cost of cleaner cooking fuel, cooking preference, unavailability of cleaner fuel, and unfamiliarity with cleaner cooking technologies. Stacking is challenging to avoid, and there is a growing realization from cleaner cooking practitioners of the need for cleaner approaches, even when multiple stoves are used. For example, electric stoves can be supplemented with LPG or ethanol stoves.

Permanence

There are significant permanence challenges associated with cleaner cooking. Households switch back from cleaner cooking fuels and technologies to unclean fuels and technologies (Jewitt et al., 2020). 

Finance

Finance is vital to supercharge adoption of cleaner cooking. Investment in the cleaner cooking sector remains significantly below the scale of the global challenge, with current funding at approximately US$130 million. This is many times lower than the amount needed each year to expand adoption of cleaner cooking solutions for the 2.4 billion people who still rely on polluting fuels and technologies (CCA 2023). At the current business-as-usual adoption rate, limited by severe underfunding, more than 80% of the population in sub-Saharan Africa will continue to rely on unclean fuels and technologies in 2030 (Stoner et al., 2021)

Climate funding, developmental finance, and subsidies have made some progress in increasing adoption of cleaner cooking. For instance, the World Bank invested more than US$562 million between 2015 and 2020, enabling 43 million people across 30 countries to adopt cleaner cooking solutions (World Bank, 2023; ESMAP, 2023). However, the emissions reductions these programs achieve can be overestimated. A recent analysis (Gill-Wiehl et al., 2024) found that 7.8 million clean cooking offset credits in reality only amounted to about 1.1 million credits. This discrepancy underscores the urgent need for updated methodologies and standards to accurately estimate emissions reductions and the cost of reduction per t CO₂‑eq (100-yr basis). 

left_text_column_width
Current Adoption

The WHO (2025) estimated that 74% of the global population in 2022 used cleaner cooking fuels and technologies. This translates to 1.2 billion households using cleaner cooking (Table 4) and 420 million households that have yet to switch to clean cooking solutions (Table 4). The adoption of cleaner cooking is not evenly spread across the world. On the higher end of the spectrum are the Americas and Europe, where, on average, more than 93% of people primarily rely on cleaner cooking fuels and technologies (WHO, 2025). On the lower end of the spectrum are sub-Saharan countries such as Madagascar, Mali and Uganda, where primary reliance on cleaner cooking fuel and technologies is <5%. 

left_text_column_width

Table 4. Current adoption level (2022).

Unit: households using cleaner cooking solutions

mean 1,200,000,000
Left Text Column Width
Adoption Trend

Global adoption of cleaner cooking fuel and technologies as the primary source of cooking increased from 61% of the population in 2013 to 74% in 2023 (WHO, 2025). This translates to roughly 21 million households adopting cleaner cooking technologies/yr (Table 5). This uptake, however, is not evenly distributed (see Maps section above).

Large-scale adoption across China, India, and Indonesia has driven the recent increase. Between 2011 and 2021, use of cleaner fuels and technologies as the primary means of cooking rose from 61% to 83% of the population in China. In India, adoption expanded from 38% to 71%, and in Indonesia, it increased from 47% to 87% (WHO, 2024a). In contrast, primary reliance on cleaner cooking in sub-Saharan Africa only increased from 12% in 2010 to 16% in 2020 (Stoner et al., 2021). 

Based on the existing policies, population growth, and investments, more than 75% of the sub-Saharan African population will use unclean cooking fuels and technologies in 2030 (Stoner et al., 2021). In Central and Southern Asia, about 25% of the population will use unclean cooking fuels and technologies by 2030 (Stoner et al., 2021).

left_text_column_width

Table 5. Adoption trend (2013–2023).

Unit: households switching to cleaner cooking solutions/yr

mean 21,000,000
Left Text Column Width
Adoption Ceiling

The World Bank (2020) estimated that universal adoption of modern energy cooking services by 2030 is possible with an annual investment of US$148–156 billion, with 26% of the investment coming from governments and development partners, 7% from private investment, and 67% from households. Universal adoption and use of cleaner fuels and technologies is possible with an investment of US$8–10 billion/yr (IEA, 2023a; World Bank, 2020). We therefore set the adoption ceiling at 100% of households adopting and using cleaner cooking solutions, which entails 420 million households switching from unclean solutions (Table 6).

left_text_column_width

Table 6.Cleaner cooking adoption ceiling: upper limit for new adoption of cleaner cooking solutions.

Unit: households switching to cleaner cooking solutions

mean 420,000,000
Left Text Column Width
Achievable Adoption

Universal adoption and use of cleaner cooking solutions is achievable before 2050 (Table 7). This is because if the current adoption trend continues, all households that currently use unclean cooking fuels and technologies will have switched to using cleaner versions by 2043. 

China, India, and Indonesia have shown that it is possible to rapidly expand adoption with the right set of policies and investments. In Indonesia, for example, use of cleaner cooking solutions increased from 9% of the population to 89% between 2002 and 2012 (WHO, 2025). 

left_text_column_width

Table 7. Range of achievable adoption levels.

Unit: households switching to cleaner cooking solutions

Current Adoption 0
Achievable – Low 420,000,000
Achievable – High 420,000,000
Adoption Ceiling 420,000,000
Left Text Column Width

Cooking from all fuel types is responsible for approximately 1.7 Gt CO₂‑eq (100-yr basis) emissions every year (WHO 2023), on par with global emissions from the aviation industry (Bergero et al., 2023). Unclean cooking fuels and technologies are also the largest source of black carbon (Climate & Clean Air Coalition, 2024), a short-lived climate pollutant with a GWP several hundred times higher than CO₂ that contributes to millions of premature deaths yearly (Garland et al., 2017). 

The actual reduction in climate impact will depend upon the mix of cleaner fuel and technologies that replace unclean fuel. The IEA (2023a) estimates that if the cleanest cooking fuels and technologies (e.g., electric and LPG) are adopted, emissions could be reduced by 1.5 Gt CO₂‑eq/yr (100-yr basis) by 2030. In contrast, a greater reliance on improved cookstoves as cleaner cooking solutions will result in lower emissions reductions. The WHO (2023) estimates that much of the shift by 2030 will involve using improved biomass and charcoal cookstoves, especially in rural areas, reducing emissions 0.6 Gt CO₂‑eq/yr (100-yr basis) by 2030 and ~1.6 CO₂‑eq/yr (100-yr basis) by 2050, closely matching the IEA estimate.

According to our analysis, deploying cleaner cooking can reduce emissions by 0.98 Gt CO₂‑eq/yr (100-yr basis) between now and 2050 (Table 8). Our emissions reduction estimates are lower than those of the IEA because we do not assume that the shift to cleaner cooking will be dominated by LPG and renewables.

left_text_column_width

Table 8. Climate impact at different levels of adoption.

Unit: Gt CO-eq/yr, 100-yr basis

Current Adoption 0.00
Achievable – Low 0.98
Achievable – High 0.98
Adoption Ceiling 0.98
Left Text Column Width
Additional Benefits

Air Quality and Health

Unclean cooking fuels and technologies produce household air pollution (HAP), with smoke and fine particulates sometimes reaching levels up to 100 times acceptable limits, particularly in poorly ventilated spaces (WHO, 2024b). HAP is linked to numerous health issues, such as stroke, ischemic heart disease, chronic obstructive pulmonary disease, lung cancer, and poor birth outcomes (Jameel et al., 2022). It accounts for more than 3.2 million early deaths annually (WHO 2024b). In 2019, it accounted for over 4% of all the deaths globally (Bennitt et al., 2021). The World Bank (2020) estimated that the negative health impact of unclean cooking fuels and technologies is valued at US$1.4 trillion/yr. Globally, switching to cleaner fuels and technologies could prevent 21 million premature deaths 2000–2100 (Lacey et al., 2017). A recent study offered empirical evidence of potential cardiovascular benefits stemming from household cleaner energy policies (Lee et al., 2024).

Equality

Unclean cooking disproportionately impacts women and children who are traditionally responsible for collecting fuelwood or biomass. Typically, they spend an hour every day collecting solid fuel; however, in some countries (e.g., Senegal, Niger, and Cameroon), daily average collection time can exceed three hours (Jameel et al., 2022). Time-saving cooking fuels are associated with more education in women and children (Biswas & Das, 2022; Choudhuri & Desai, 2021) and can additionally promote gender equity through economic empowerment by allowing women to pursue additional employment opportunities (CCA, 2023). In conflict zones, adoption of cleaner fuels and technologies has been shown to reduce gender-based violence (Jameel et al., 2022). Finally, cleaner cooking fuels can improve health equity as women are disproportionately exposed to indoor air pollution generated from cooking (Fullerton et al., 2008; Po et al., 2011). 

Nature protection

The unsustainable harvest of wood for cooking fuel has led to deforestation and biodiversity loss in regions such as South Asia and sub-Saharan Africa (CCA, 2022). East African nations, including Eritrea, Ethiopia, Kenya, and Uganda, are particularly affected by the rapid depletion of sustainable wood fuel resources. In the Democratic Republic of the Congo, 84% of harvested wood is charcoal or firewood (World Bank, 2018). Switching to cleaner cooking fuels and technologies can reduce deforestation and protect biodiversity (Anenberg et al., 2013; Dagnachew et al., 2018; CCA, 2022).

Income and Work

Simkovich et al. (2019) found that time gained by switching to cleaner fuel can increase daily income 3.8–4.7%. Their analysis excludes the expenses related to fuel, as well as the costs associated with delivery or transportation for refilling cleaner fuel. Mazorra et al. (2020) reported that if 50% of the time saved from not gathering firewood were redirected to income-generating activities, it could lead to an estimated annual income increase of approximately US$125 (2023 dollars) in the Gambia, US$113 in Guinea-Bissau, and US$200 in Senegal. 

left_text_column_width
Risks

The expensive nature of cleaner cooking presents a significant barrier to adoption. Households that have recently transitioned to cleaner cooking face a high risk of defaulting back to unclean fuels and technologies. For example, among the households that received free LPG connection as a part of the Pradhan Mantri Ujjwala Yojana in India, low-income households reverted to unclean fuels and technologies during extensive periods of refill gaps (Cabiyo et al., 2020). In total, 9 million recipients could not refill their LPG cylinders even once in 2021–22 due to high LPG costs and other factors (Down to Earth 2022).

Beyond the cost, there is an adjustment period  for the households adopting the cleaner cooking solution, which includes familiarizing themselves with the technology and fostering cultural and behavioral changes, including overcoming biases and adopting new habits.

left_text_column_width
Interactions with Other Solutions

Reinforcing

Shifting to cleaner cooking reduces the need to burn biomass and so contributes positively to protecting and restoring forests, grasslands, and savannas. 

left_text_column_width
Dashboard

Solution Basics

1 household switching to cleaner cooking

tCO2-eq/unit/yr
2.3
units
Current 04.2×10⁸4.2×10⁸
Achievable (Low to High)

Climate Impact

GtCO2-eq/yr
Current 0 0.980.98
US$ per tCO2-eq
27
Emergency Brake

CO₂, CH₄, BC

Trade-offs

Switching to electric cooking will meaningfully reduce GHG emissions only if the grid is powered by clean energy. A life-cycle assessment of cooking fuels in India and China (Cashman et al., 2016) showed that unclean cooking fuels such as crop residue and cow dung had a lower carbon footprint than electricity because in these countries >80% of the electricity was produced by coal and natural gas

LPG has been the leading cleaner fuel source replacing unclean cooking fuel globally (IEA, 2023a). The IEA (2023a) estimated that 33% of households transitioning to cleaner cooking fuels and technologies will do so using LPG to transition. Because LPG is a fossil fuel, increased reliance can hinder or slow the transition from fossil fuels

left_text_column_width
% population
0–15
15–30
30–45
45–60
60–75
75–100
No data

Percentage of country population relying primarily on clean cooking technologies, 2023

Access to clean cooking technology – and the benefits it confers – varies widely around the world.

World Health Organization (2025). Proportion of population with primary reliance on clean fuels and technologies for cooking (%) [Data set]. The Global Health Observatory Indicators. Retrieved May 8, 2025 from https://www.who.int/data/gho/data/indicators/indicator-details/GHO/gho-phe-primary-reliance-on-clean-fuels-and-technologies-proportion

Geographic Guidance Introduction

The Deploy Clean Cooking solution applies to geographies where low-cost, inefficient, and polluting cooking methods are common. Sub-Saharan Africa is the overwhelming target, with only 23% of the population relying on clean cooking technologies (WHO, 2025). 

There are significant correlations between the lack of clean cooking solutions and levels of extreme poverty (World Bank, 2024), and the financial cost of clean fuel and cookstoves is a significant barrier to adoption (WHO, 2023).  

Some of the key benefits of deploying clean cooking will vary based on geography and landscape. For instance, freeing up time spent collecting firewood will be more notable in areas with less dense forests, since people in such locations would have to travel further to harvest the wood (Khavari et al., 2023).

Barriers to the adoption of clean cooking can also vary with geography. Examples noted by Khavari et al. (2023) include robustness of supply chains, which can be influenced by population density and road networks.

Action Word
Deploy
Solution Title
Clean Cooking
Classification
Highly Recommended
Lawmakers and Policymakers
  • Prioritize the issue at the national level to coordinate policy, coordinate resources, and ensure a robust effort.
  • Create a dedicated coordinating body across relevant ministries, agencies, and sectors.
  • Create subsidies and fuel price caps, and ban unclean cooking fuels and technologies.
  • Remove taxes and levies on clean-cooking stoves.
  • Create dedicated teams to deliver cleaner cooking equipment.
  • Run public education campaigns appropriate for the context
Practitioners
  • Serve as a clean cooking ambassador to raise awareness within your industry and community.
  • Participate in training programs.
  • Develop feedback channels with manufacturers to enhance design and overcome local challenges.
  • Restaurant owners and cooks can adopt clean cooking in their kitchens to reduce emissions, lower costs, and improve worker health and safety. 
Business Leaders
Nonprofit Leaders
  • Ensure operations use clean cooking methods.
  • Educate the public on the benefits of clean cooking, available options, and applicable incentive programs.
  • Advocate to policymakers on issues such as targeted subsidies and providing government support.
  • Educate investors and the business community on local needs and market trends. 
Investors
Philanthropists and International Aid Agencies
  • Distribute cleaner cooking equipment and fuel.
  • Work with local policymakers to ensure that recipient communities can maintain fuel costs over the long term (possibly through fuel subsidies).
  • Provide grants to businesses in this sector.
  • Fund education campaigns appropriate for the context.
  • Advance political action through public-private partnerships such as the CCA
Thought Leaders
  • Educate the public on the health, gender, climate, and environmental impacts of unclean cooking and the benefits of cleaner cooking.
  • Hone your message to fit the context and share through appropriate messengers and platforms.
  • Use mechanisms to promote trust, such as working with local health-care workers or other respected professionals. 
Technologists and Researchers
  • Develop regional-specific technology that uses local sources of energy, such as biogas or high-efficiency charcoal.
  • Create technology that works with the local environment and economy and has reliable supply chains.
Communities, Households, and Individuals
  • Learn about the benefits and harms associated with unclean fuels and technologies.
  • Identify the right technology to purchase by considering the availability and affordability of fuels; practicality of the equipment in producing the quantity, quality, and type of preferred food, and ease of use. 
Evidence Base

There is a strong consensus on the effectiveness of cleaner cooking as a climate solution. Research over the past two decades (e.g., Anenberg et al., 2013; Mazorra et al., 2020; Rosenthal et al., 2017) has supported the contention that replacing solid fuel cooking with cleaner fuel reduces GHG emissions. 

There is high agreement and robust evidence that switching cooking from unclean fuels and technologies to cleaner alternatives such as burning LPG or electric stoves offers health, air quality, and climate change benefits (Intergovernmental Panel on Climate Change [IPCC], 2022).

The IPCC (2022) identified unclean fuels such as biomass as a major source of short-lived climate pollutants (e.g., black carbon, organic carbon, carbon monoxide, and methane) and switching to cleaner fuels and technologies can reduce the emission of short-lived climate pollutants.

Regional and country-level analyses provide additional evidence of the efficacy of cleaner cooking solutions. Khavari et al. (2023) reported that in sub-Saharan Africa, replacing unclean solid fuels with cleaner cooking could reduce GHG emissions by 0.5 Gt CO₂‑eq/yr (100-yr basis). Life cycle assessments comparing different cooking fuels and technologies (Afrane et al., 2011; Afrane et al., 2012; Lansche et al., 2017; Singh et al., 2014) also have shown that cleaner cooking fuels and technologies emit less GHG per unit of energy delivered than unclean fuels.

The IEA estimated that switching completely to clean cooking fuels and technologies by 2030 would result in a net reduction of 1.5 Gt CO₂‑eq/yr (100-yr basis) by 2030 (IEA, 2023a). 

The results presented in this document summarize findings from five reviews and meta-analyses and 23 original studies and reports reflecting current evidence from 13 countries, primarily in sub-Saharan Africa. We recognize this limited geographic scope creates bias, and hope this work inspires research and data sharing on this topic in underrepresented regions.

left_text_column_width
Updated Date
Subscribe to Health