Figure A1. Marginal abatement cost curves (MACC) for methane abatement in the O&G industry (IEA, 2024).
Image
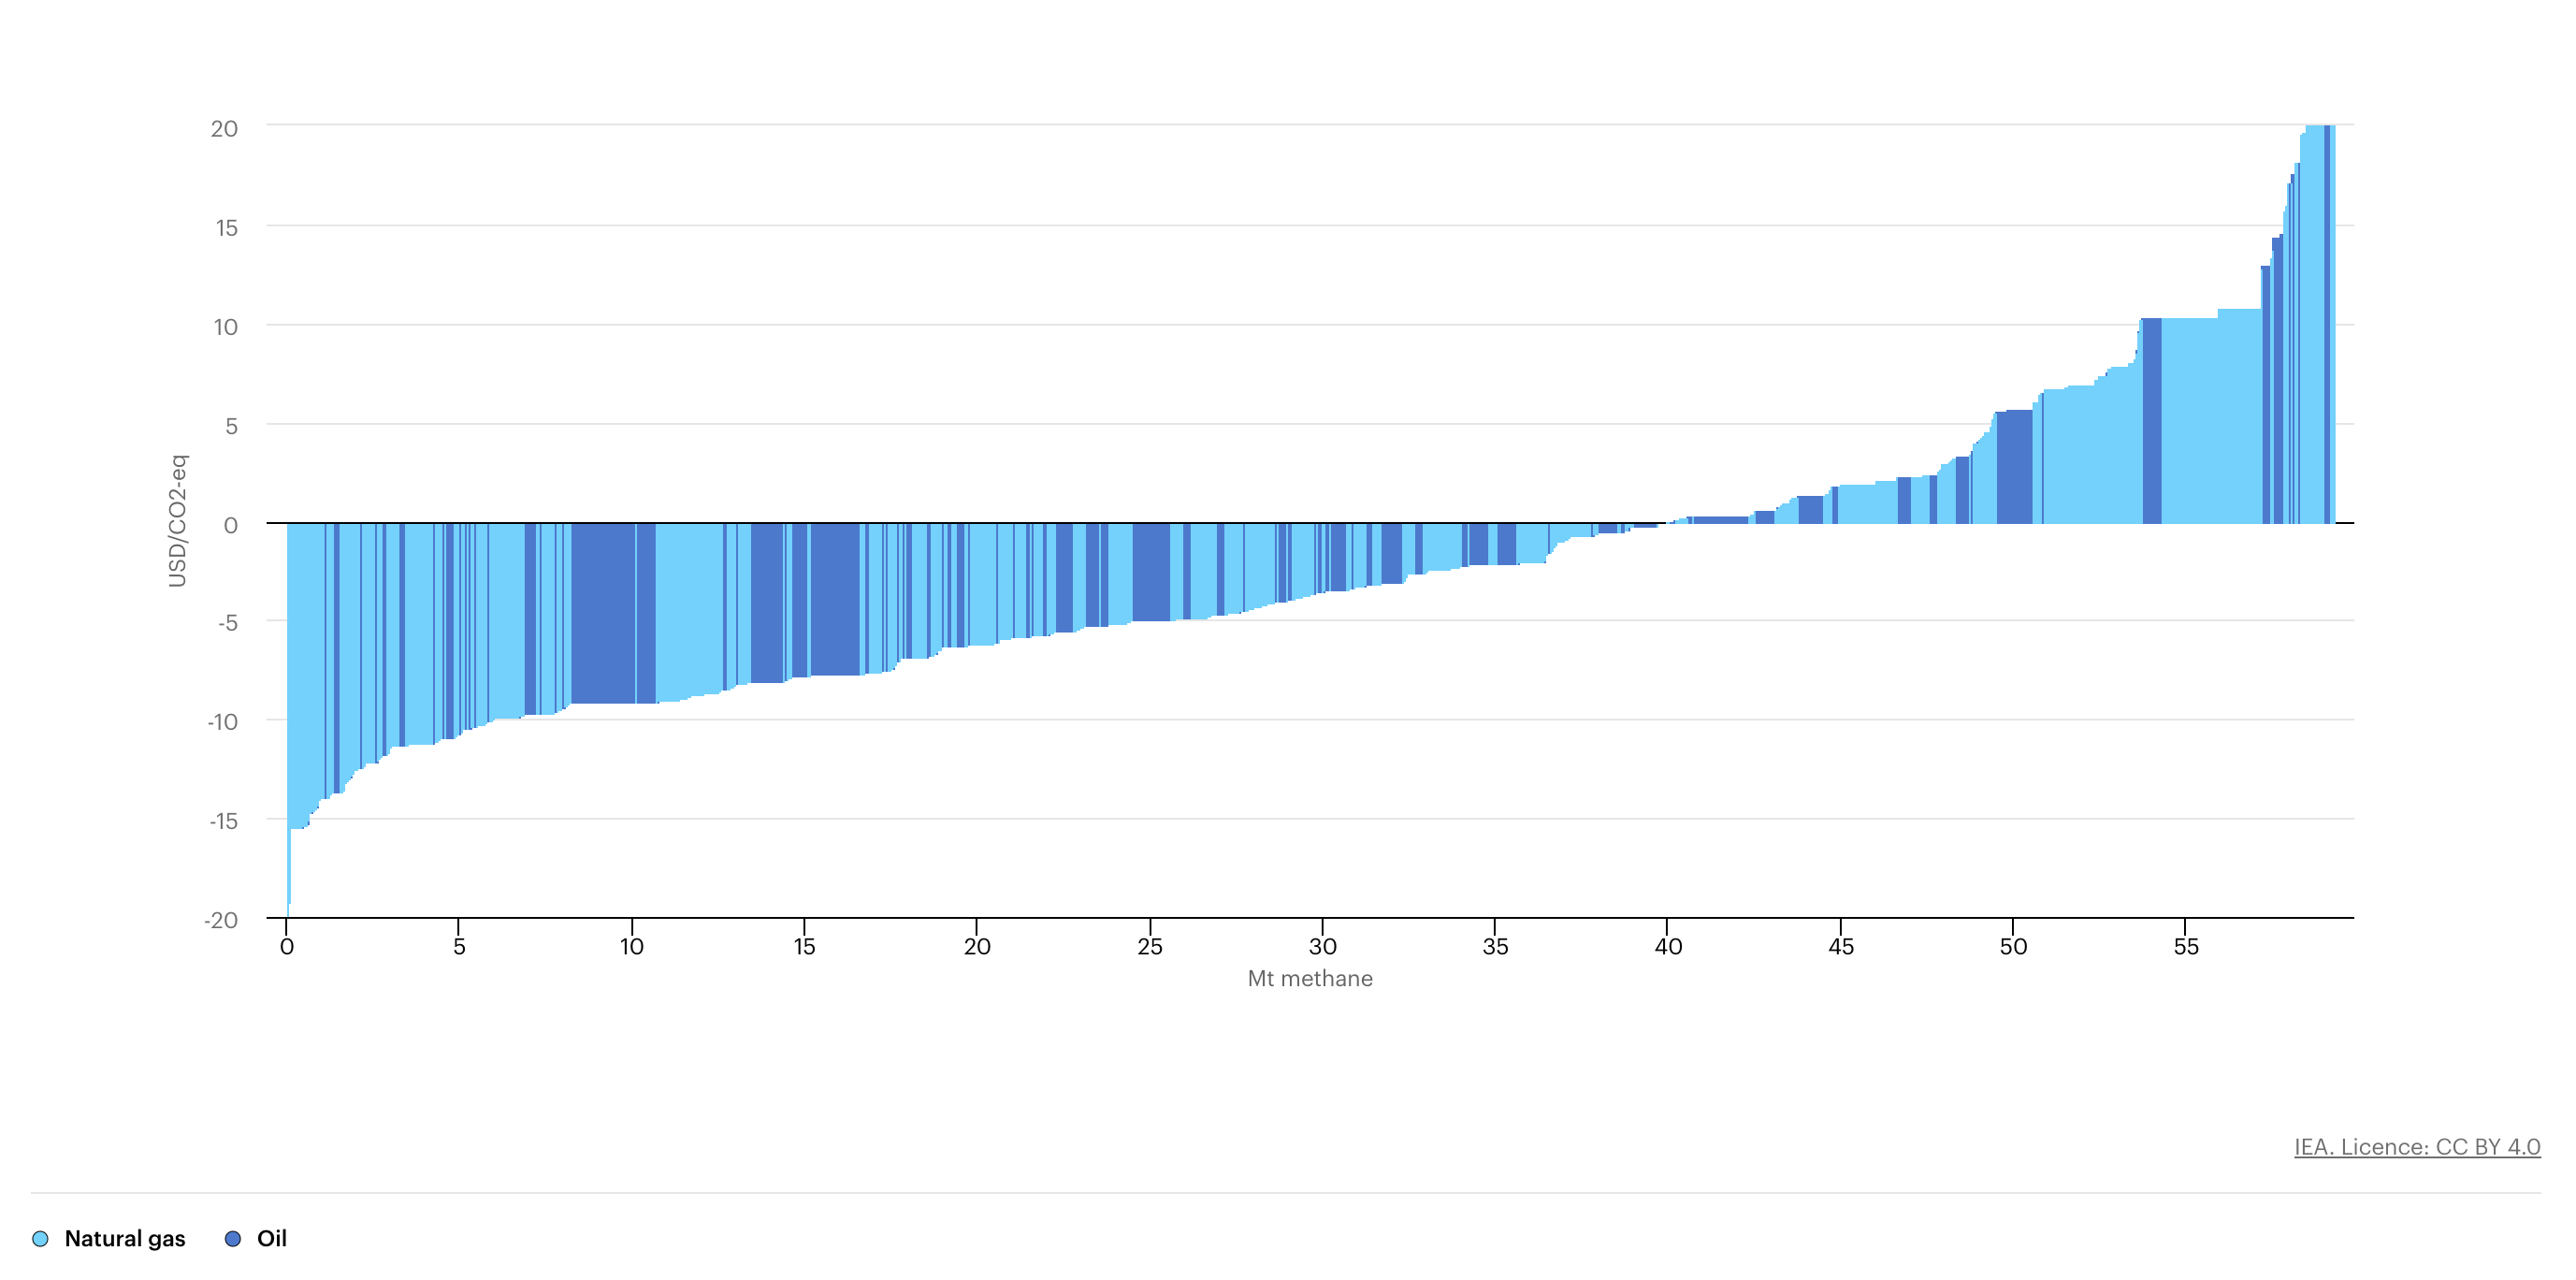
Source: International Energy Agency (Global Methane Tracker 2024).
Figure A1. Marginal abatement cost curves (MACC) for methane abatement in the O&G industry (IEA, 2024).
Source: International Energy Agency (Global Methane Tracker 2024).
Join the 80,000+ subscribers discovering how to drive meaningful climate action around the world! Every other week, you'll get expert insights, cutting-edge research, and inspiring stories.