Water Distribution Efficiency
Pumping water requires enormous amounts of electricity. Addressing leaks in water-distribution networks, especially in cities, can curb water loss, energy use, and emissions.
Reduced/Sequestered
2020–2050
To Implement
Operational Savings
Impact
Pressure management and active leakage control could reduce water losses by 36–46 percent and carbon dioxide equivalent emissions by 0.61–0.86 gigatons. Total installation cost would be US$7.87–10.96 billion, and operating savings for utilities could be US$1.02–1.45 trillion. Implementing this solution could save 311,940–389,126 million cubic meters of water over 30 years.
Introduction
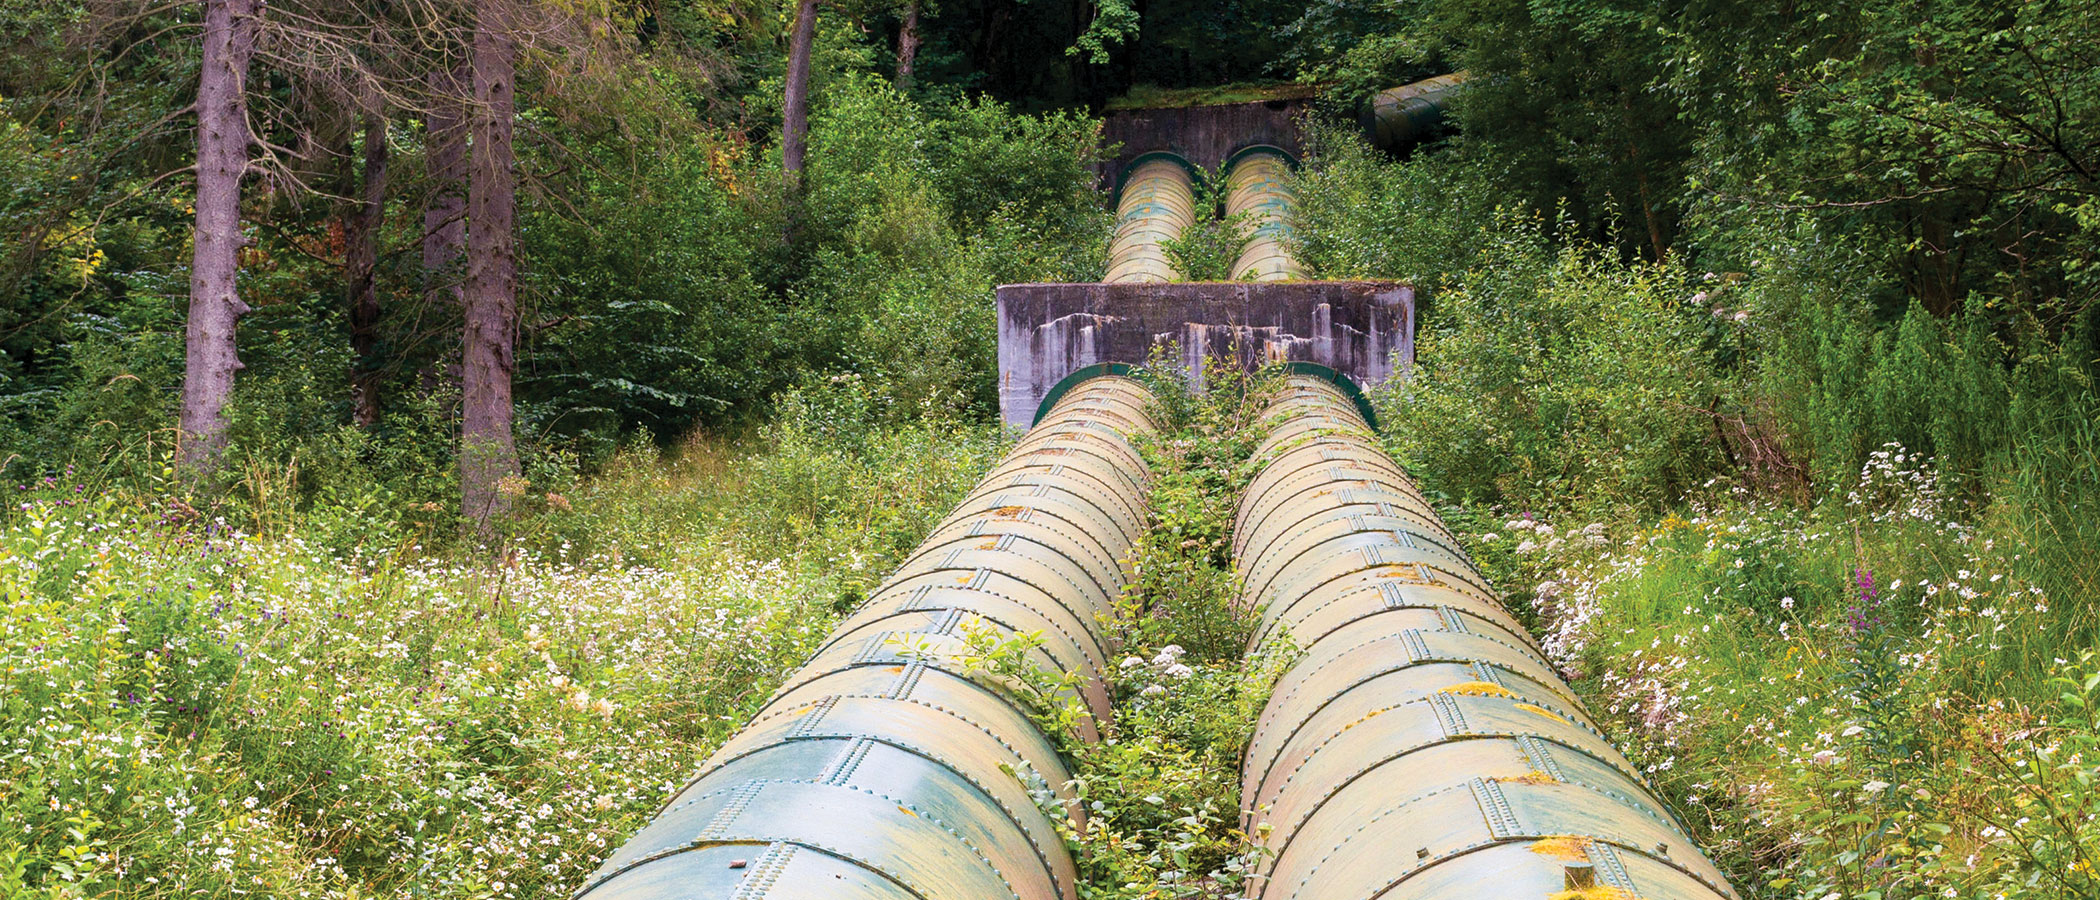
Pumping water from source to treatment plant to storage and distribution requires enormous amounts of energy. In fact, water utilities are among the biggest consumers of electricity globally.
Unfortunately, a significant portion of the water utilities manage is lost in the distribution network to problems such as pipe leakage, meter error, and unauthorized consumption. This affects the production cost and the availability of water. Saving just half of these losses would supply water to an additional 100 million people (Kingdom et. al., 2006) and dramatically boost the energy efficiency of water management.
Project Drawdown’s Water Distribution Efficiency solution reduces water leakage and water oversupply, which reduces pumping and pressurization electricity and associated greenhouse gas emissions. This solution replaces conventional water system management with no specific leak detection program.
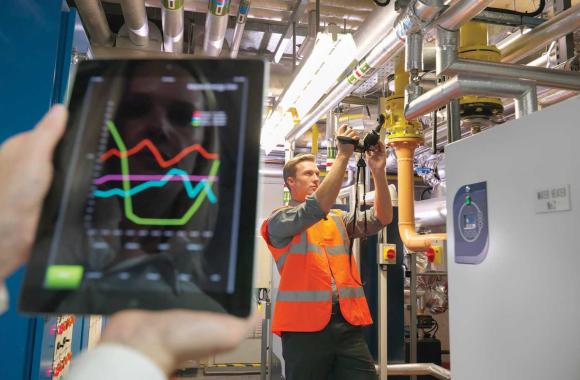
Pressure management and active leak detection are two major ways to reduce leakage. Pressure management involves installing pressure valves at water inlets and outlets to better monitor water pressure and flow, and leads to reductions in pipe bursts and leaks from broken pipes. Active leak detection can involve a range of technologies, such as thermal imaging, noise logging, or gas injection. Prices and precision vary for these approaches, but the value can be high, especially for high-operating-cost, high-water-scarcity regions.
This analysis examines the financial and emissions impacts of high adoption of pressure management and active leak control globally, and compares that with conventional system management with no specific leak detection program.
Methodology
Total Addressable Market
To estimate how much water municipalities use, we developed an exponential curve of water use per year from 20 previous estimates of global water distribution for specific years dating from 1900 to 2025 (Hejazi et al., 2013). We combined this estimate with empirical data reported by hundreds of water utilities in the International Benchmark Network Database to arrive at estimates for per-capita water production for all regions in the world. We combined this with water supply statistics from the World Health Organization and United Nations Children's Fund to arrive at urban and rural shares and a total addressable market for each region of 438 billion cubic meters of water treated and supplied in 2014.
Adoption Scenarios
We calculated impacts of increased adoption of the Water Distribution Efficiency solution from 2020 to 2050 by comparing two scenarios with a reference scenario in which the market share was fixed at current levels.
- Scenario 1: Adoption of pressure management and active leak control rises linearly to 36 percent of water supplied by the global water distribution network (311,940 million cubic meters of water produced).
- Scenario 2: Adoption of pressure management and active leak control rises linearly to 46 percent of water supplied by the global water distribution network (389,126 million cubic meters of water produced).
Emissions Model
We estimated emissions from electricity consumption for water treatment and distribution (with a weighted share for each of desalination, surface water, and groundwater) at 1.27 gigawatt-hours of electricity per million cubic meters of water supplied. We estimated leakage (over 18 data points) to reduce this by 29 percent. Emissions factors for the electricity came from the guides of the Intergovernmental Panel on Climate Change (IPCC).
Financial Model
All monetary values are presented in 2014 US$.
First costs for pressure management and active leak control were based on how much water the practices save on average, so we report them in million cubic meters of water saved. Based on nine data points covering Europe, North America, and Asia, the installation cost was US$33,402 per million cubic meters of water saved. Net implementation cost was US$17.4 billion. No first costs were applied to the conventional approach, since we assumed the solution to be in addition to the existing technology. We estimated operating costs for conventional systems from five data points coming mainly from the IB-NET Database and averaging US$444,000 per million cubic meters of water supplied. Kanakoudis & Gonelas (2016) estimate operating savings from leakage reduction activities; this results in a net operating savings of US$168 billion per million cubic meters of water supplied.
Results
Scenario 1 saved 0.61 gigatons of carbon dioxide equivalent emissions from 2020 to 2050 at a net first cost to implement of US$7.87 billion. This is expected to bring lifetime net operational savings of US$1.02 trillion.
In Scenario 2, the emissions impact is 0.86 gigatons with US$1.45 trillion in lifetime net operational savings. The net first cost to implement is US$10.96 billion.
Discussion
Pressure management and active leakage control can contribute to reducing greenhouse gas emissions. Pressure management is an important and cost-effective initial step in curbing water losses. However, it is important to note that it is not the complete solution; although it reduces leak rates and pipe bursts, it does not repair leaks. Utilities, therefore, would need to determine where to deploy pressure management and active leak control, as well as which combinations of these and other solutions are required for managing water losses in their specific situations. Our analysis does not include other leak detection approaches such as thermal imaging, noise logging, or gas injection, or other water supply systems, such as water conveyance by tanker truck.
Sustainable water management practices address not only climate change but also water security. Unpolluted water is scarce in many regions of the world, and regions with large amounts of water are not guaranteed infinite water resources. Reducing water losses can also boost utility revenues, allow for postponement of investments, and improve customer satisfaction.
References
Hejazi, M., Edmonds, J., Chaturvedi, V., Davies, E., and Eom, J. (2013). Scenarios of global municipal water-use demand projections over the 21st Century. Hydrological Sciences Journal, 58(3), pp. 519-538. URL: https://www.tandfonline.com/doi/pdf/10.1080/02626667.2013.772301
Kanakoudis, V. and Gonelas, K. (2016). Non-revenue water reduction through pressure management in Kozani’s water distribution network: from theory to practice. Desalination and water treatment, 57(25), pp. 11436-11446. DOI: https://doi.org/10.1080/19443994.2015.1049967
Kingdom, B., Liemberger, R. and Marin, P. (2006). The Challenge of Reducing Non-Revenue Water (NRW) in Developing Countries. Water Supply and Sanitation Sector Board Discussion Paper Series, 8. The World Bank Group. Accessed at: https://documents1.worldbank.org/curated/en/385761468330326484/pdf/394050Reducing1e0water0WSS81PUBLIC1.pdf
What You Can Do
Make sure your local water utility has and uses pressure management and leak detection infrastructure.
Share information on the climate change mitigation value of water system leak detection through your social media.
- Expand your knowledge by exploring another Drawdown solution.
Co-benefits
Efficient water distribution conserves freshwater resources, reducing the strain on water supplies and promoting sustainability.

