Public Transit
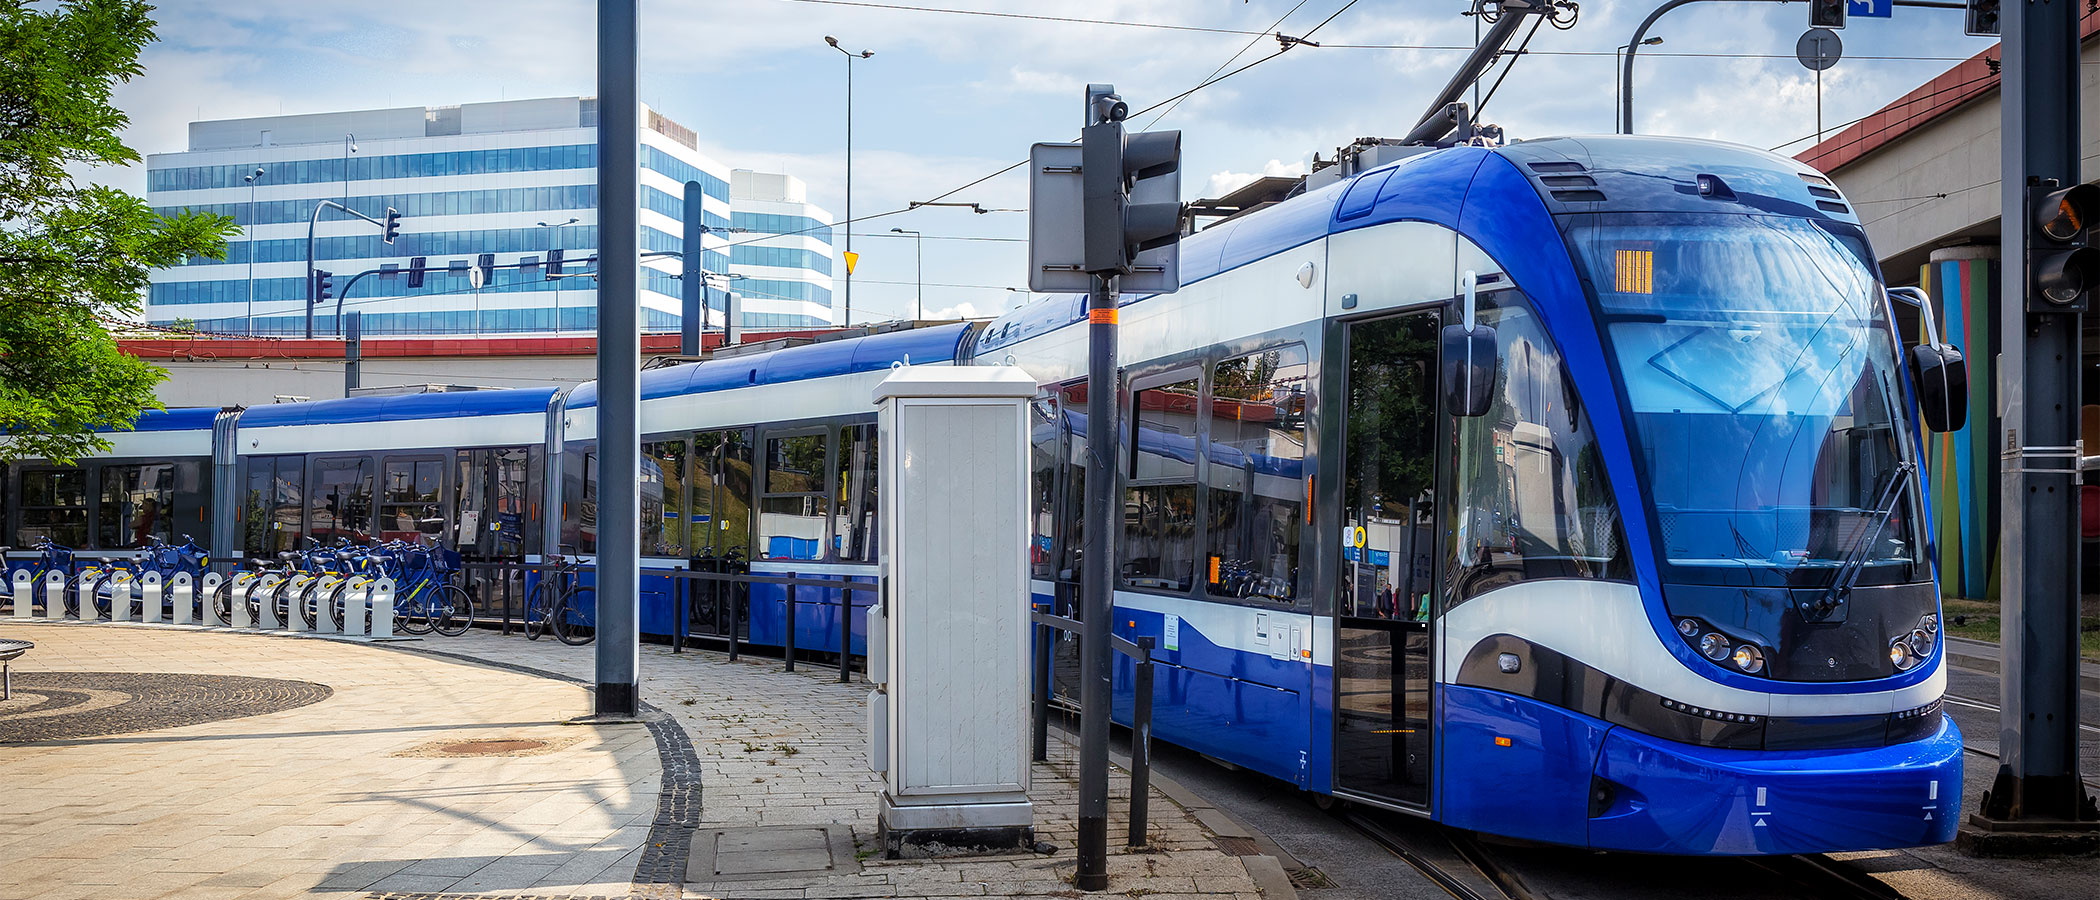
Streetcars, buses, and subways offer alternative, efficient modes of transport. Public transit can keep car use to a minimum and avert greenhouse gases.
Reduced/Sequestered
2020–2050
To Implement
Operational Savings
Impact
If public transit is used for 29 to 34 percent of all urban passenger trips, this solution can save 9.42–15.42 gigatons of carbon dioxide equivalent emissions from cars. Consumers would save US$2.81–4.59 trillion in mobility costs. Our analysis includes diverse public transit options (bus, metro, tram, and commuter rail) and examines the costs that travelers pay (car purchase and use compared with buying transit tickets).
Introduction
A collection of passenger transport modes, public transit has long been a structural part of urban environments worldwide. It uses scale to its emissions advantage. When someone uses a streetcar, bus, or subway rather than a car, they produce fewer greenhouse gas emissions.
Public transit also relieves traffic congestion and reduces accidents and fatalities. Air pollution drops. Mass transit also makes cities more equitable by providing mobility to those who cannot drive.
The population of urban areas is expected to grow from 2020 to 2050, and public transit can reduce greenhouse gas emissions and provide numerous other benefits by claiming an important share of the new travel demand.
Project Drawdown’s Public Transit solution involves the use of urban mass transit systems for passenger travel, including metro, tram/trolley, light-rail transit, bus, bus rapid transit, and minivan. We focus on the passenger taking more mass transit trips, but do not model the increase in infrastructure or public investment that may be required to supply all those trips. This solution replaces the use of conventional internal combustion engine (ICE) cars.
Methodology
Total Addressable Market
The total addressable market for public transit is defined as the total urban mobility, in passenger-kilometers, projected by institutions such as the International Energy Agency (IEA), the International Council on Clean Transportation (ICCT), and collaborative work between the Institute for Transportation and Development Policy and the University of California–Davis (ITDP/UCD).
Current global adoption (the amount of functional demand supplied in 2018) is 24 percent of the market. Much of this is attributable to high adoption in low-income countries where car ownership is low. In high-income areas such as Europe and Japan, public transit has significant and rising adoption; still, conventional ICE vehicles own the largest part of the market share in Europe and North America, as well as in other higher income regions. Meanwhile, the adoption of public transit in low-income countries is potentially threatened by economic growth, which tends to lead to a decrease in informal bus use and an increase in personal vehicles.
Adoption Scenarios
We calculated impacts of increased adoption of public transit from 2020 to 2050 by comparing two scenarios with a reference scenario in which the market share was fixed at current levels.
- Scenario 1: Stakeholders and policy makers take the appropriate decisions that will encourage public transit adoption throughout the world. The use of public transit increases to 29 percent of urban passenger kilometers.
- Scenario 2: New, modern, and reliable systems are built. Together with policy decisions that encourage transit usage and provide incentives to decrease car use, these lead to an increase of public transit modal share to 34 percent.
Emissions Model
Emissions calculations capture electricity, fuel use, and indirect emissions for public transit, all weighted according to urban passenger mode share. We obtained electricity and fuel data from ITDP/UCD and other sources. We based car emissions on fuel use. Fuel economy data came from multiple sources and represent the global car fleet.
Financial Model
This financial analysis is conducted from the perspective of the user, rather than public transit operators, municipalities, or society as a whole. This is valuable so that those deciding whether to travel by public transit or ICE vehicles have a better idea of the financial aspects of that decision.
We excluded first costs to implement from this model to prevent misinterpretation, but we did include car first costs as a fixed operating cost through depreciation. By contrasting the use of public transit with ICE vehicles, only the depreciated costs of owning and using a car are compared with the cost of purchasing a public transit ticket. The financial evaluation is thus based on the net operating costs: the weighted average ticket price (based on World Atlas) of public transit options by region, compared with the fixed operating costs (insurance and depreciation), fuel costs, and other costs of car ownership (e.g., maintenance).
Integration
To ensure that this model was well integrated with other Project Drawdown models, we used common market and car inputs across all relevant Transportation sector solutions. We restricted adoption so as to not exceed the total mobility demand represented by the total addressable market.
Results
All monetary values are presented in 2014 US$.
Scenario 1 reduces emissions by 9.42 gigatons of carbon dioxide equivalent greenhouse gases and produces US$2.81 trillion in lifetime net operational savings at a US$0 first cost to implement.
Scenario 2 reduces emissions by 15.42 gigatons of carbon dioxide equivalent greenhouse gases and produces US$ 4.59 trillion in lifetime net operational savings at a US$0 first cost to implement.
Discussion
Without public transit–focused investments and policy, it is likely that much of the projected growth in urban mobility would be taken up by ICE cars. Even if exciting developments such as electric, autonomous, and shared-car fleets become widespread, public transit would be needed on high-demand routes. We therefore need a significant effort to ensure that public transit is an attractive means of mobility for the increasingly urbanized world. We excluded public transit investment costs for governments, but we also excluded additional benefits of increased public transit usage such as reduced congestion from private vehicles and potentially more city space reclaimed from parking lots that are not required. It is unlikely that adding these elements would alter the basic conclusion that public transit is a key part of reducing urban transport emissions.
What You Can Do
Whenever possible, take the train, bus, streetcar, or subway. Demand drives infrastructure!
Encourage your employer to chip in on the cost of public transit for employees.
- Expand your knowledge by exploring another Drawdown solution.
Co-benefits
Public transit reduces fuel consumption, lowers emissions, improves air quality, and alleviates traffic congestion.
It also promotes social equity by providing affordable transportation options across income levels.
Public transit contributes to the development of vibrant, walkable communities and reduces the demand for parking spaces.

