Micro Wind Turbines
Micro wind turbines can generate clean electricity in diverse locations, from urban centers to rural areas, without access to centralized grids.
Reduced/Sequestered
2020–2050
To Implement
Operational Savings
Impact
Micro wind turbines allow for the extension of clean, renewable electricity in areas without grid access. Increasing micro wind turbine electricity generation to nearly 18.68–24.22 terawatt-hours by 2050 can deliver 0.09–0.11 gigatons of greenhouse gas emissions reductions with net first costs of US$52.87–69.56 billion.
Introduction
Micro wind turbines are often used to pump water, charge batteries, and provide electrification in rural locations. They give people a way to light their homes or cook their meals while avoiding emissions from dirty diesel generators or kerosene lamps. Experts estimate that a million or more micro wind turbines are currently in use around the world. The key factor for growing that number is cost.
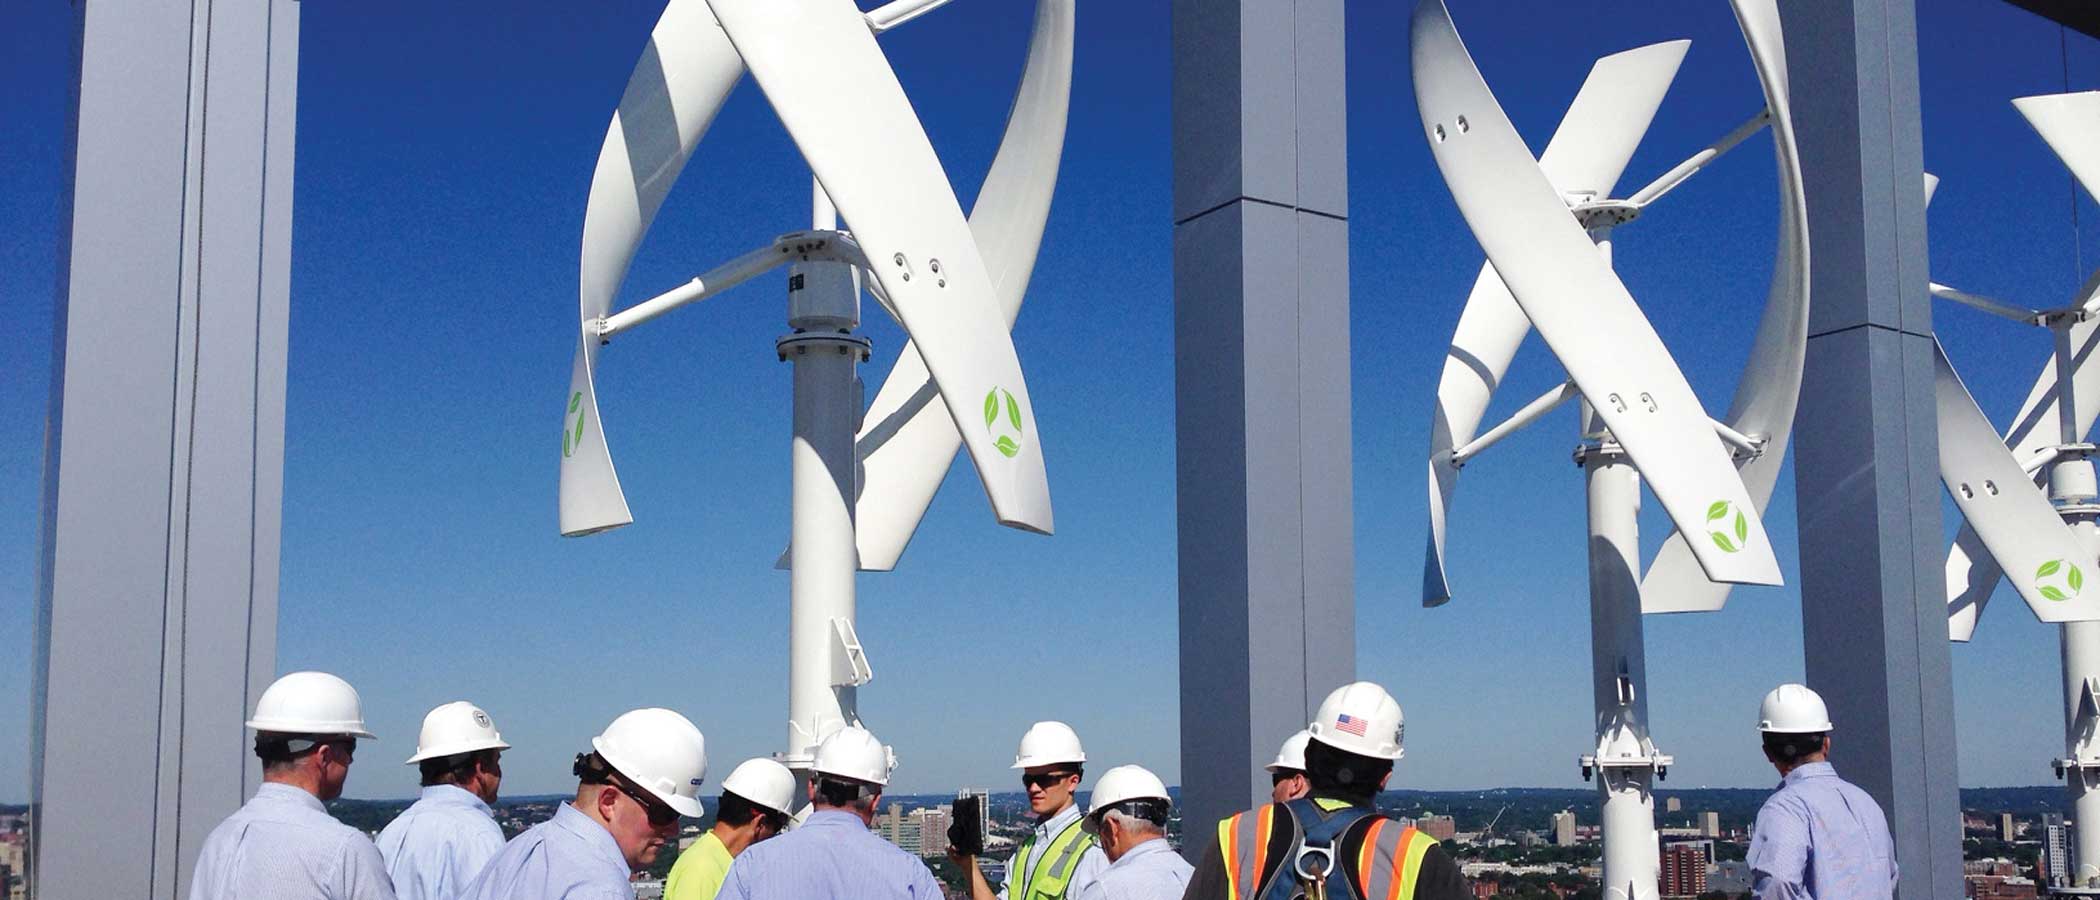
In urban areas, micro wind turbines offer an opportunity to become less dependent on the electrical grid. They are more expensive than large turbines, especially if connected to the grid. However, they can be integrated into urban infrastructure, such as building-mounted micro turbines.
The micro wind turbine market has been concentrated mostly in the US, China, the UK, and Germany. increasing electrification of emerging economy countries offers inroads for further expansion.
Project Drawdown’s Micro Wind Turbines solution involves deploying electricity-generating onshore wind turbines with capacity of 100 kilowatts or less. This solution replaces conventional electricity-generating technologies such as coal, oil, and natural gas power plants.
Methodology
Total Addressable Market
We based the total addressable market for micro wind turbines on projected global electricity generation from 2020 to 2050. The total addressable market is different for the two adoption scenarios because Scenario 2 projects extensive electrification of transportation, space heating, etc., dramatically increasing demand and therefore production of electricity worldwide. Current adoption (defined as the amount of functional demand supplied in 2018) estimated from installed capacity is 0.008 percent (2.2 terawatt-hours) of global electricity generation.
Adoption Scenarios
We calculated impacts of increased adoption of the Micro Wind Turbine solution from 2020 to 2050 by comparing two growth scenarios with a reference scenario in which the market share was fixed at current levels.
- Scenario 1: Microwind turbines generate 18.68 terawatt-hours (0 percent of the market share) in 2050. This scenario follows ambitious adoption trajectories of onshore wind adoption from IEA (2017) Energy Technology Perspectives 2DS and B2DS scenarios; IEA (2018) World Energy Outlook SDS; and Grantham Institute and Carbon Tracker (2017) strong climate mitigation policies with lower costs for solar photovoltaics and electric vehicles scenario using a medium growth trajectory. Micro wind turbines’ current share (0.22 percent) of total onshore wind is assumed to grow in parallel.
- Scenario 2: Microwind turbines generate 24.22 terawatt-hours (nearly 0 percent of the market share) in 2050, based on a high growth trend derived from the same scenarios.
Financial Model
All monetary values are presented in 2014 US$.
We assumed an average installation cost of US$6,481 per kilowatt with a learning rate of 9.7 percent, reducing the cost to US$4,536 in 2030 and US$3,742 in 2050. We used an average capacity factor of 18 percent for the solution, compared with 57 percent for conventional technologies such as coal, natural gas, and oil power plants.
We used US$0.03 per kilowatt-hour for variable operation and maintenance costs and US$127.3 per kilowatt for fixed costs, compared with US$0.005 per kilowatt-hour and US$34.7 per kilowatt for conventional technologies.
Integration
To integrate the Micro Wind Turbine solution with other Project Drawdown solutions, we adjusted the total addressable markets to account for reduced demand resulting from the deployment of energy-efficiency-enhancing solutions (e.g., LED Lighting and High-Efficiency Heat Pumps), as well as increased electrification from other solutions such as Electric Cars and High-Speed Rail. We calculated grid emissions factors based on the annual mix of electricity-generating technologies over time. We determined emissions factors for each technology through a meta-analysis of multiple sources, including both direct and indirect emissions.
Results
The net first cost to implement Scenario 1 was US$52.87 billion from 2020 to 2050, with net lifetime operational cost of US$19.40 billion. Avoided emissions total 0.09 gigatons of carbon dioxide equivalent.
Under Scenario 2, greenhouse gas emission reductions total 0.11 gigatons of carbon dioxide equivalent from 2020 to 2050. The net first cost was US$69.56 billion from 2020 to 2050, with a lifetime net operational cost of US$26.58 billion.
Discussion
We based these estimates on a conservative capacity factor. Since wind power is proportional to the cube of the wind speed, higher wind speeds result in much higher power. Doubling the wind speed in this framework would result in an order of magnitude increase in the carbon savings.
Building-integrated micro wind turbines are increasingly being explored to generate clean energy. However, because they represent an emerging technology, uncertainty about how factors such as low wind speeds, high levels of turbulence, noise, visual impact, and animal strikes influence performance makes it hard to determine their true potential, and their impact may not be felt until midway through the 21st century.
References
Grantham Institute and Carbon Tracker (2017). Expect the Unexpected. The Disruptive Power of Low-carbon Technology. Grantham Institute- Climate Change and the Environment and Carbon Tracker Initiative. Retrieved from: https://www.imperial.ac.uk/media/imperialcollege/grantham-institute/public/publications/collaborative-publications/Expect-theUnexpected_CTI_Imperial.pdf
IEA. (2017). Energy Technology Perspectives 2017 - Catalysing Energy Technology Transformations. International Energy Agency (IEA). Retrieved from: https://www.iea.org/etp/
IEA. (2018). World Energy Outlook 2018 (p. 661). International Energy Agency (IEA). Retrieved from: https://webstore.iea.org/world-energy-outlook-2018
What You Can Do
If you're an educator, pique your students' interest in clean energy by exploring micro wind turbine technologies. Encourage them to imagine ways to make it better—perhaps someday they will!
Bring micro wind turbine technology to the attention of a nonprofit organization or development agency that could help advance its application in appropriate circumstances.
- Expand your knowledge by exploring another Drawdown solution.
Co-benefits
Access to the clean and affordable energy micro wind turbines provide supports education, health care, agriculture, and small businesses.
Deploying this climate solution stimulates local economies and creates employment opportunities. The installation, operation, and maintenance of renewable energy systems require skilled labor, creating jobs and contributing to economic growth.
Shifting to clean and renewable energy sources reduces indoor and outdoor air pollution, which is a significant health concern in many developing countries. By replacing traditional fuels like wood and coal with cleaner alternatives improves air quality, reducing respiratory illnesses and related health issues.
In developing countries, this solution expands access to modern and reliable energy services, enabling communities to meet basic energy needs such as lighting, cooking, heating, and powering essential services like health-care facilities and schools.

