Agriculture is the dominant source of human-caused emissions of nitrous oxide (Figure 1; Tian et al., 2020). Nitrogen is critical for plant growth and is added to croplands in synthetic forms, such as urea, ammonium nitrate, or anhydrous ammonia; in organic forms, such as manure or compost; and by growing legume crops, which host microbes that capture nitrogen from the air and add it to the soil (Adalibieke et al., 2023; Ludemann et al., 2024). If more nitrogen is added than crops can use, the excess can be converted to other forms, including nitrous oxide, through microbial processes called denitrification and nitrification (Figure 2; Reay et al., 2012).
Improve Nutrient Management
Mode
Cut Emissions
Cluster
Shift Agriculture Practices
Image
Image
Coming Soon
Off
Summary
We define the Improve Nutrient Management solution as reducing excessive nitrogen use on croplands. Nitrogen is critical for crop production and is added to croplands as synthetic or organic fertilizers and through microbial activity. However, farmers often add more nitrogen to croplands than crops can use. Some of that excess nitrogen is emitted to the atmosphere as nitrous oxide, a potent GHG.
Overview
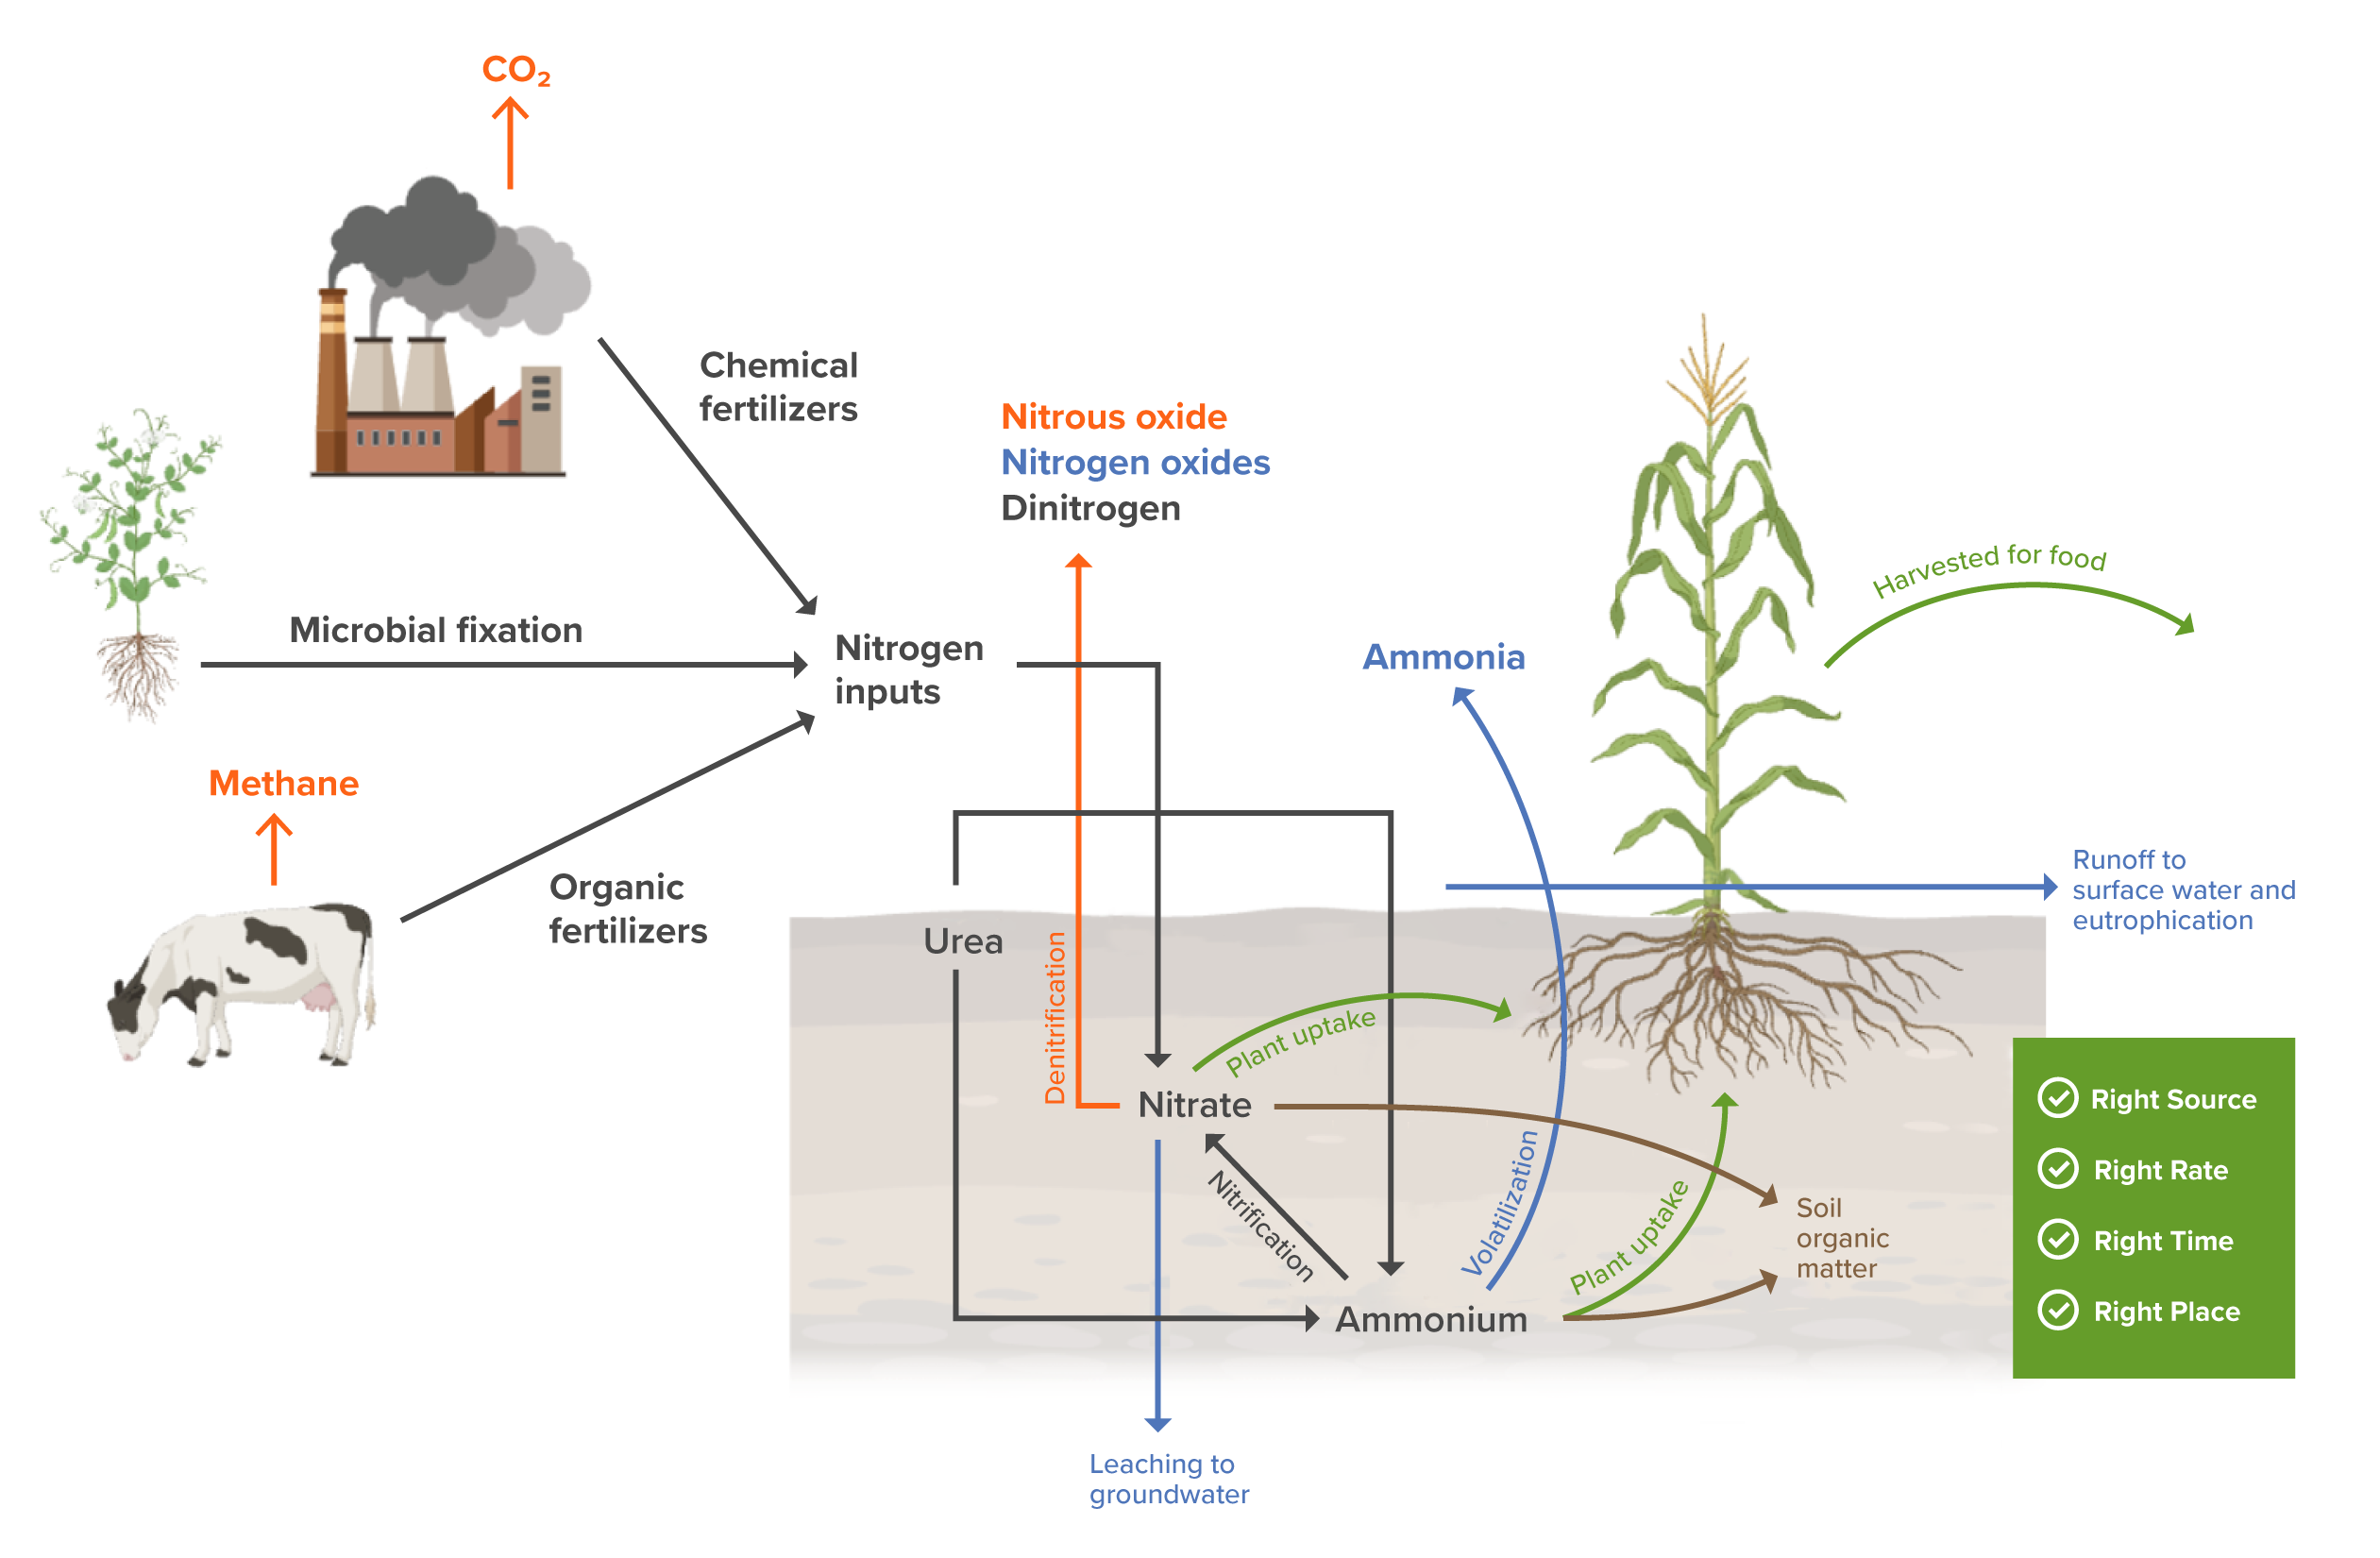
Figure 1. The agricultural nitrogen cycle represents the key pathways by which nitrogen is added to croplands and lost to the environment, including as nitrous oxide. The “4R” nutrient management principles – right source, right rate, right time, right place – increase the proportion of nitrogen taken up by the plant, therefore reducing nitrogen losses to the environment.
Image
Illustrations: BioRender CC-BY 4.0
Farmers can reduce nitrous oxide emissions from croplands by using the right amount and the right type of fertilizer at the right time and in the right place (Fixen, 2020; Gao & Cabrera Serrenho, 2023). Together, these four “rights” increase nitrogen use efficiency – the proportion of applied nitrogen that the crop uses (Congreves et al., 2021). Improved nutrient management is often a win-win for the farmer and the environment, reducing fertilizer costs while also lowering nitrous oxide emissions (Gu et al., 2023).
Improving nutrient management involves reducing the amount of nitrogen applied to match the crop’s requirements in areas where nitrogen is currently overapplied. A farmer can implement the other three principles – type, time, and place – in a number of ways. For example, fertilizing just before planting instead of after the previous season’s harvest better matches the timing of nitrogen addition to that of plant uptake, reducing nitrous oxide emissions before the crop is planted. Certain types of fertilizers are better suited for maximizing plant uptake, such as extended-release fertilizers, which allow the crop to steadily absorb nutrients over time. Techniques such as banding, in which farmers apply fertilizers in concentrated bands close to the plant roots instead of spreading them evenly across the soil surface, also reduce nitrous oxide emissions. Each of these practices can increase nitrogen use efficiency and decrease the amount of excess nitrogen lost as nitrous oxide (Gao & Cabrera Serrenho, 2023; Gu et al., 2023; Wang et al., 2024; You et al., 2023).
For this solution, we estimated a target rate of nitrogen application for major crops as the 20th percentile of the current rate of nitrogen application (in tN/t crop) in areas where yields are near a realistic ceiling. Excess nitrogen was defined as the amount of nitrogen applied beyond the target rate (see Adoption and Appendix for more details). Our emissions estimates include nitrous oxide from croplands, fertilizer runoff, and fertilizer volatilization. They do not include emissions from fertilizer manufacturing, which are addressed in the Deploy Low-Emission Industrial Feedstocks and Increase Industrial Efficiency solutions. We excluded nutrient management on pastures from this solution due to data limitations, and address nutrient management in paddy rice systems in the Improve Rice Management solution instead.
References
Adalibieke, W., Cui, X., Cai, H., You, L., & Zhou, F. (2023). Global crop-specific nitrogen fertilization dataset in 1961–2020. Scientific Data, 10(1), 617. https://doi.org/10.1038/s41597-023-02526-z
Almaraz, M., Bai, E., Wang, C., Trousdell, J., Conley, S., Faloona, I., & Houlton, B. Z. (2018). Agriculture is a major source of NOx pollution in California. Science Advances, 4(1), eaao3477. https://doi.org/10.1126/sciadv.aao3477
Antil, R. S., & Raj, D. (2020). Integrated nutrient management for sustainable crop production and improving soil health. In R. S. Meena (Ed.), Nutrient Dynamics for Sustainable Crop Production (pp. 67–101). Springer. https://doi.org/10.1007/978-981-13-8660-2_3
Bijay-Singh, & Craswell, E. (2021). Fertilizers and nitrate pollution of surface and ground water: An increasingly pervasive global problem. SN Applied Sciences, 3(4), 518. https://doi.org/10.1007/s42452-021-04521-8
Chivenge, P., Saito, K., Bunquin, M. A., Sharma, S., & Dobermann, A. (2021). Co-benefits of nutrient management tailored to smallholder agriculture. Global Food Security, 30, 100570. https://doi.org/10.1016/j.gfs.2021.100570
Deng, J., Guo, L., Salas, W., Ingraham, P., Charrier-Klobas, J. G., Frolking, S., & Li, C. (2018). Changes in irrigation practices likely mitigate nitrous oxide emissions from California cropland. Global Biogeochemical Cycles, 32(10), 1514–1527. https://doi.org/10.1029/2018GB005961
Domingo, N. G. G., Balasubramanian, S., Thakrar, S. K., Clark, M. A., Adams, P. J., Marshall, J. D., Muller, N. Z., Pandis, S. N., Polasky, S., Robinson, A. L., Tessum, C. W., Tilman, D., Tschofen, P., & Hill, J. D. (2021). Air quality–related health damages of food. Proceedings of the National Academy of Sciences, 118(20), e2013637118. https://doi.org/10.1073/pnas.2013637118
Elberling, B. B., Kovács, G. M., Hansen, H. F. E., Fensholt, R., Ambus, P., Tong, X., Gominski, D., Mueller, C. W., Poultney, D. M. N., & Oehmcke, S. (2023). High nitrous oxide emissions from temporary flooded depressions within croplands. Communications Earth & Environment, 4(1), 1–9. https://doi.org/10.1038/s43247-023-01095-8
Fixen, P. E. (2020). A brief account of the genesis of 4R nutrient stewardship. Agronomy Journal, 112(5), 4511–4518. https://doi.org/10.1002/agj2.20315
Foley, J. A., Ramankutty, N., Brauman, K. A., Cassidy, E. S., Gerber, J. S., Johnston, M., Mueller, N. D., O’Connell, C., Ray, D. K., West, P. C., Balzer, C., Bennett, E. M., Carpenter, S. R., Hill, J., Monfreda, C., Polasky, S., Rockström, J., Sheehan, J., Siebert, S., … Zaks, D. P. M. (2011). Solutions for a cultivated planet. Nature, 478(7369), 337–342. https://doi.org/10.1038/nature10452
Gao, Y., & Cabrera Serrenho, A. (2023). Greenhouse gas emissions from nitrogen fertilizers could be reduced by up to one-fifth of current levels by 2050 with combined interventions. Nature Food, 4(2), 170–178. https://doi.org/10.1038/s43016-023-00698-w
Gerber, J. S., Carlson, K. M., Makowski, D., Mueller, N. D., Garcia de Cortazar-Atauri, I., Havlík, P., Herrero, M., Launay, M., O’Connell, C. S., Smith, P., & West, P. C. (2016). Spatially explicit estimates of nitrous oxide emissions from croplands suggest climate mitigation opportunities from improved fertilizer management. Global Change Biology, 22(10), 3383–3394. https://doi.org/10.1111/gcb.13341
Gerber, J. S., Ray, D. K., Makowski, D., Butler, E. E., Mueller, N. D., West, P. C., Johnson, J. A., Polasky, S., Samberg, L. H., & Siebert, S. (2024). Global spatially explicit yield gap time trends reveal regions at risk of future crop yield stagnation. Nature Food, 5(2), 125–135. https://doi.org/10.1038/s43016-023-00913-8
Gong, C., Tian, H., Liao, H., Pan, N., Pan, S., Ito, A., Jain, A. K., Kou-Giesbrecht, S., Joos, F., Sun, Q., Shi, H., Vuichard, N., Zhu, Q., Peng, C., Maggi, F., Tang, F. H. M., & Zaehle, S. (2024). Global net climate effects of anthropogenic reactive nitrogen. Nature, 632(8025), 557–563. https://doi.org/10.1038/s41586-024-07714-4
Gu, B., Zhang, X., Lam, S. K., Yu, Y., van Grinsven, H. J. M., Zhang, S., Wang, X., Bodirsky, B. L., Wang, S., Duan, J., Ren, C., Bouwman, L., de Vries, W., Xu, J., Sutton, M. A., & Chen, D. (2023). Cost-effective mitigation of nitrogen pollution from global croplands. Nature, 613(7942), 77–84. https://doi.org/10.1038/s41586-022-05481-8
Hergoualc’h, K., Akiyama, H., Bernoux, M., Chirinda, N., del Prado, A., Kasimir, Å., MacDonald, J. D., Ogle, S. M., Regina, K., & van der Weerden, T. J. (2019). Chapter 11: nitrous oxide Emissions from managed soils, and CO₂ emissions from lime and urea application (2019 Refinement to the 2006 IPCC Guidelines for National Greenhouse Gas Inventories). Intergovernmental Panel on Climate Change. https://www.ipcc-nggip.iges.or.jp/public/2019rf/pdf/4_Volume4/19R_V4_Ch11_Soils_nitrous oxide_CO₂. pdf
Hergoualc’h, K., Mueller, N., Bernoux, M., Kasimir, Ä., van der Weerden, T. J., & Ogle, S. M. (2021). Improved accuracy and reduced uncertainty in greenhouse gas inventories by refining the IPCC emission factor for direct nitrous oxide emissions from nitrogen inputs to managed soils. Global Change Biology, 27(24), 6536–6550. https://doi.org/10.1111/gcb.15884
IPCC, 2019: Summary for Policymakers. In: Climate Change and Land: an IPCC special report on climate change, desertification, land degradation, sustainable land management, food security, and greenhouse gas fluxes in terrestrial ecosystems [P.R. Shukla, J. Skea, E. Calvo Buendia, V. Masson-Delmotte, H.-O. Pörtner, D. C. Roberts, P. Zhai, R. Slade, S. Connors, R. van Diemen, M. Ferrat, E. Haughey, S. Luz, S. Neogi, M. Pathak, J. Petzold, J. Portugal Pereira, P. Vyas, E. Huntley, K. Kissick, M. Belkacemi, J. Malley, (eds.)].
Lam, S. K., Suter, H., Mosier, A. R., & Chen, D. (2017). Using nitrification inhibitors to mitigate agricultural nitrous oxide emission: A double-edged sword? Global Change Biology, 23(2), 485–489. https://doi.org/10.1111/gcb.13338
Lawrence, N. C., Tenesaca, C. G., VanLoocke, A., & Hall, S. J. (2021). Nitrous oxide emissions from agricultural soils challenge climate sustainability in the US Corn Belt. Proceedings of the National Academy of Sciences, 118(46), e2112108118. https://doi.org/10.1073/pnas.2112108118
Ludemann, C. I., Wanner, N., Chivenge, P., Dobermann, A., Einarsson, R., Grassini, P., Gruere, A., Jackson, K., Lassaletta, L., Maggi, F., Obli-Laryea, G., van Ittersum, M. K., Vishwakarma, S., Zhang, X., & Tubiello, F. N. (2024). A global FAOSTAT reference database of cropland nutrient budgets and nutrient use efficiency (1961–2020): Nitrogen, phosphorus and potassium. Earth System Science Data, 16(1), 525–541. https://doi.org/10.5194/essd-16-525-2024
Menegat, S., Ledo, A., & Tirado, R. (2022). Greenhouse gas emissions from global production and use of nitrogen synthetic fertilisers in agriculture. Scientific Reports, 12(1), 14490. https://doi.org/10.1038/s41598-022-18773-w
Michaelowa, A., Hermwille, L., Obergassel, W., & Butzengeiger, S. (2019). Additionality revisited: Guarding the integrity of market mechanisms under the Paris Agreement. Climate Policy, 19(10), 1211–1224. https://doi.org/10.1080/14693062.2019.1628695
Mueller, N. D., Gerber, J. S., Johnston, M., Ray, D. K., Ramankutty, N., & Foley, J. A. (2012). Closing yield gaps through nutrient and water management. Nature, 490(7419), Article 7419. https://doi.org/10.1038/nature11420
Patel, N., Srivastav, A. L., Patel, A., Singh, A., Singh, S. K., Chaudhary, V. K., Singh, P. K., & Bhunia, B. (2022). Nitrate contamination in water resources, human health risks and its remediation through adsorption: A focused review. Environmental Science and Pollution Research, 29(46), 69137–69152. https://doi.org/10.1007/s11356-022-22377-2
Pinder, R. W., Davidson, E. A., Goodale, C. L., Greaver, T. L., Herrick, J. D., & Liu, L. (2012). Climate change impacts of US reactive nitrogen. Proceedings of the National Academy of Sciences, 109(20), 7671–7675. https://doi.org/10.1073/pnas.1114243109
Porter, E. M., Bowman, W. D., Clark, C. M., Compton, J. E., Pardo, L. H., & Soong, J. L. (2013). Interactive effects of anthropogenic nitrogen enrichment and climate change on terrestrial and aquatic biodiversity. Biogeochemistry, 114(1), 93–120. https://doi.org/10.1007/s10533-012-9803-3
Qiao, C., Liu, L., Hu, S., Compton, J. E., Greaver, T. L., & Li, Q. (2015). How inhibiting nitrification affects nitrogen cycle and reduces environmental impacts of anthropogenic nitrogen input. Global Change Biology, 21(3), 1249–1257. https://doi.org/10.1111/gcb.12802
Qin, Z., Deng, S., Dunn, J., Smith, P., & Sun, W. (2021). Animal waste use and implications to agricultural greenhouse gas emissions in the United States. Environmental Research Letters, 16(6), 064079. https://doi.org/10.1088/1748-9326/ac04d7
Reay, D. S., Davidson, E. A., Smith, K. A., Smith, P., Melillo, J. M., Dentener, F., & Crutzen, P. J. (2012). Global agriculture and nitrous oxide emissions. Nature Climate Change, 2(6), 410–416. https://doi.org/10.1038/nclimate1458
Rockström, J., Williams, J., Daily, G., Noble, A., Matthews, N., Gordon, L., Wetterstrand, H., DeClerck, F., Shah, M., Steduto, P., de Fraiture, C., Hatibu, N., Unver, O., Bird, J., Sibanda, L., & Smith, J. (2017). Sustainable intensification of agriculture for human prosperity and global sustainability. Ambio, 46(1), 4–17. https://doi.org/10.1007/s13280-016-0793-6
Rurinda, J., Zingore, S., Jibrin, J. M., Balemi, T., Masuki, K., Andersson, J. A., Pampolino, M. F., Mohammed, I., Mutegi, J., Kamara, A. Y., Vanlauwe, B., & Craufurd, P. Q. (2020). Science-based decision support for formulating crop fertilizer recommendations in sub-Saharan Africa. Agricultural Systems, 180, 102790. https://doi.org/10.1016/j.agsy.2020.102790
Scavia, D., David Allan, J., Arend, K. K., Bartell, S., Beletsky, D., Bosch, N. S., Brandt, S. B., Briland, R. D., Daloğlu, I., DePinto, J. V., Dolan, D. M., Evans, M. A., Farmer, T. M., Goto, D., Han, H., Höök, T. O., Knight, R., Ludsin, S. A., Mason, D., … Zhou, Y. (2014). Assessing and addressing the re-eutrophication of Lake Erie: Central basin hypoxia. Journal of Great Lakes Research, 40(2), 226–246. https://doi.org/10.1016/j.jglr.2014.02.004
Selim, M. M. (2020). Introduction to the integrated nutrient management strategies and their contribution to yield and soil properties. International Journal of Agronomy, 2020(1), 2821678. https://doi.org/10.1155/2020/2821678
Shcherbak, I., Millar, N., & Robertson, G. P. (2014). Global metaanalysis of the nonlinear response of soil nitrous oxide (nitrous oxide) emissions to fertilizer nitrogen. Proceedings of the National Academy of Sciences, 111(25), 9199–9204. https://doi.org/10.1073/pnas.1322434111
Shindell, D. T., Faluvegi, G., Koch, D. M., Schmidt, G. A., Unger, N., & Bauer, S. E. (2009). Improved attribution of climate forcing to emissions. Science, 326(5953), 716–718. https://doi.org/10.1126/science.1174760
Sobota, D. J., Compton, J. E., McCrackin, M. L., & Singh, S. (2015). Cost of reactive nitrogen release from human activities to the environment in the United States. Environmental Research Letters, 10(2), 025006. https://doi.org/10.1088/1748-9326/10/2/025006
Tian, H., Xu, R., Canadell, J. G., Thompson, R. L., Winiwarter, W., Suntharalingam, P., Davidson, E. A., Ciais, P., Jackson, R. B., Janssens-Maenhout, G., Prather, M. J., Regnier, P., Pan, N., Pan, S., Peters, G. P., Shi, H., Tubiello, F. N., Zaehle, S., Zhou, F., … Yao, Y. (2020). A comprehensive quantification of global nitrous oxide sources and sinks. Nature, 586(7828), 248–256. https://doi.org/10.1038/s41586-020-2780-0
van Grinsven, H. J. M., Bouwman, L., Cassman, K. G., van Es, H. M., McCrackin, M. L., & Beusen, A. H. W. (2015). Losses of ammonia and nitrate from agriculture and their effect on nitrogen recovery in the European Union and the United States between 1900 and 2050. Journal of Environmental Quality, 44(2), 356–367. https://doi.org/10.2134/jeq2014.03.0102
Vanlauwe, B., Descheemaeker, K., Giller, K. E., Huising, J., Merckx, R., Nziguheba, G., Wendt, J., & Zingore, S. (2015). Integrated soil fertility management in sub-Saharan Africa: Unravelling local adaptation. SOIL, 1(1), 491–508. https://doi.org/10.5194/soil-1-491-2015
Wang, C., Shen, Y., Fang, X., Xiao, S., Liu, G., Wang, L., Gu, B., Zhou, F., Chen, D., Tian, H., Ciais, P., Zou, J., & Liu, S. (2024). Reducing soil nitrogen losses from fertilizer use in global maize and wheat production. Nature Geoscience, 17(10), 1008–1015. https://doi.org/10.1038/s41561-024-01542-x
Wang, Y., Li, C., Li, Y., Zhu, L., Liu, S., Yan, L., Feng, G., & Gao, Q. (2020). Agronomic and environmental benefits of Nutrient Expert on maize and rice in Northeast China. Environmental Science and Pollution Research, 27(22), 28053–28065. https://doi.org/10.1007/s11356-020-09153-w
Ward, M. H., Jones, R. R., Brender, J. D., de Kok, T. M., Weyer, P. J., Nolan, B. T., Villanueva, C. M., & van Breda, S. G. (2018). Drinking water nitrate and human health: an updated review. International Journal of Environmental Research and Public Health, 15(7), 1557. https://doi.org/10.3390/ijerph15071557
Withers, P. J. A., Neal, C., Jarvie, H. P., & Doody, D. G. (2014). Agriculture and eutrophication: where do we go from here? Sustainability, 6(9), Article 9. https://doi.org/10.3390/su6095853
You, L., Ros, G. H., Chen, Y., Shao, Q., Young, M. D., Zhang, F., & de Vries, W. (2023). Global mean nitrogen recovery efficiency in croplands can be enhanced by optimal nutrient, crop and soil management practices. Nature Communications, 14(1), 5747. https://doi.org/10.1038/s41467-023-41504-2
Zaehle, S., Ciais, P., Friend, A. D., & Prieur, V. (2011). Carbon benefits of anthropogenic reactive nitrogen offset by nitrous oxide emissions. Nature Geoscience, 4(9), 601–605. https://doi.org/10.1038/ngeo1207
Zhang, X., Fang, Q., Zhang, T., Ma, W., Velthof, G. L., Hou, Y., Oenema, O., & Zhang, F. (2020). Benefits and trade-offs of replacing synthetic fertilizers by animal manures in crop production in China: A meta-analysis. Global Change Biology, 26(2), 888–900. https://doi.org/10.1111/gcb.14826
Credits
Lead Fellow
Avery Driscoll, Ph.D.
Contributors
Ruthie Burrows, Ph.D.
James Gerber, Ph.D.
Yusuf Jameel, Ph.D.
Daniel Jasper
Alex Sweeney
Eric Toensmeier
Internal Reviewers
Aiyana Bodi
Hannah Henkin
Ted Otte
Effectiveness
We relied on the 2019 IPCC emissions factors to calculate the emissions impacts of improved nutrient management. These are disaggregated by climate zone (“wet” vs. “dry”) and by fertilizer type (“organic” vs. “synthetic”). Nitrogen use reductions in wet climates, which include ~65% of the cropland area represented in this analysis (see Appendix for details), have the largest impact. In these areas, a 1 t reduction in nitrogen use reduces emissions by 8.7 t CO₂‑eq on average for synthetic fertilizers and by 5.0 t CO₂‑eq for organic fertilizers. Emissions savings are lower in dry climates, where a 1 t reduction in nitrogen use reduces emissions by 2.4 t CO₂‑eq for synthetic fertilizers and by 2.6 t CO₂‑eq for organic fertilizers. While these values reflect the median emissions reduction for each climate zone and fertilizer type, they are associated with large uncertainties because emissions are highly variable depending on climate, soil, and management conditions.
Based on our analysis of the adoption ceiling for each climate zone and fertilizer type (see Appendix), we estimated that a 1 t reduction in nitrogen use reduces emissions by 6.0 t CO₂‑eq at the global average (Table 1). This suggests that ~1.4% of the applied nitrogen is emitted as nitrous oxide at the global average, which is consistent with existing estimates (IPCC, 2019).
left_text_column_width
Table 1. Effectiveness at reducing emissions.
Unit: t CO₂‑eq /tN, 100-yr basis
| 25th percentile | 4.2 |
| median (50th percentile) | 6.0 |
| 75th percentile | 7.7 |
Left Text Column Width
Cost
Improving nutrient management typically reduces fertilizer costs while maintaining or increasing yields, resulting in a net financial benefit to the producer. Gu et al. (2023) found that a 21% reduction in global nitrogen use would be economically beneficial, notably after accounting for increased fertilizer use in places that do not currently have adequate access. Using data from their study, we evaluated the average cost of reduced nitrogen application considering the following nutrient management practices: increased use of high-efficiency fertilizers, organic fertilizers, and/or legumes; optimizing fertilizer rates; altering the timing and/or placement of fertilizer applications; and use of buffer zones. Implementation costs depend on the strategy used to improve nutrient management. For example, optimizing fertilizer rates requires soil testing and the ability to apply different fertilizer rates to different parts of a field. Improving timing can involve applying fertilizers at two different times during the season, increasing labor and equipment operation costs. Furthermore, planting legumes incurs seed purchase and planting costs.
Gu et al. (2023) estimated that annual reductions of 42 Mt of nitrogen were achievable globally using these practices, providing total fertilizer savings of US$37.2 billion and requiring implementation costs of US$15.9 billion, adjusted for inflation to 2023. A 1 t reduction in excess nitrogen application, therefore, was estimated to provide an average of US$507.80 of net cost savings, corresponding to a savings of US$85.21 per t CO₂‑eq of emissions reductions (Table 2).
left_text_column_width
Table 2. Cost per unit of climate impact, 100-yr basis.
Unit: 2023 US$/t CO₂‑eq
| mean | -85.21 |
Left Text Column Width
Methods and Supporting Data
Abatzoglou, J. T., Dobrowski, S. Z., Parks, S. A., & Hegewisch, K. C. (2018). TerraClimate, a high-resolution global dataset of monthly climate and climatic water balance from 1958–2015. Scientific Data, 5(1), 170191. https://doi.org/10.1038/sdata.2017.191
Adalibieke, W., Cui, X., Cai, H., You, L., & Zhou, F. (2023). Global crop-specific nitrogen fertilization dataset in 1961–2020. Scientific Data, 10(1), 617. https://doi.org/10.1038/s41597-023-02526-z
Gerber, J. S., Ray, D. K., Makowski, D., Butler, E. E., Mueller, N. D., West, P. C., Johnson, J. A., Polasky, S., Samberg, L. H., & Siebert, S. (2024). Global spatially explicit yield gap time trends reveal regions at risk of future crop yield stagnation. Nature Food, 5(2), 125–135. https://doi.org/10.1038/s43016-023-00913-8
IPCC, 2019: Summary for Policymakers. In: Climate Change and Land: an IPCC special report on climate change, desertification, land degradation, sustainable land management, food security, and greenhouse gas fluxes in terrestrial ecosystems [P.R. Shukla, J. Skea, E. Calvo Buendia, V. Masson-Delmotte, H.-O. Pörtner, D. C. Roberts, P. Zhai, R. Slade, S. Connors, R. van Diemen, M. Ferrat, E. Haughey, S. Luz, S. Neogi, M. Pathak, J. Petzold, J. Portugal Pereira, P. Vyas, E. Huntley, K. Kissick, M. Belkacemi, J. Malley, (eds.)].
Mehta, P., Siebert, S., Kummu, M., Deng, Q., Ali, T., Marston, L., Xie, W., & Davis, K. F. (2024). Half of twenty-first century global irrigation expansion has been in water-stressed regions. Nature Water, 2(3), 254–261. https://doi.org/10.1038/s44221-024-00206-9
Learning Curve
The improved nutrient management strategies considered for this solution are already well-established and widely deployed (Fixen, 2020). Large nitrogen excesses are relatively easy to mitigate through simple management changes with low implementation costs. As nitrogen use efficiency increases, further reductions may require increasingly complex mitigation practices and increasing marginal costs. Therefore, a learning curve was not quantified for this solution.
left_text_column_width
Speed of Action
Speed of action refers to how quickly a climate solution physically affects the atmosphere after it is deployed. This is different from speed of deployment, which is the pace at which solutions are adopted.
At Project Drawdown, we define the speed of action for each climate solution as gradual, emergency brake, or delayed.
Improve Nutrient Management is a GRADUAL climate solution. It has a steady, linear impact on the atmosphere. The cumulative effect over time builds as a straight line.
left_text_column_width
Caveats
Emissions reductions from improved nutrient management are permanent, though they may not be additional in all cases.
Permanence
As this solution reduces emissions rather than enhancing sequestration, permanence is not applicable.
Additionality
Additionality requires that the emissions benefits of the practice are attributable to climate-related incentives and would not have occurred in the absence of incentives (Michaelowa et al., 2019). If they are not contingent on external incentives, fertilizer use reductions implemented solely to maximize profits do not meet the threshold for additionality. However, fertilizer reductions may be additional if incentives are required to provide access to the technical knowledge and soil testing required to identify optimal rates. Other forms of nutrient management (e.g., applying nitrification inhibitors, using extended-release or organic fertilizers, or splitting applications between two time points) may involve additional costs, substantial practice change, and technical expertise. Thus, these practices are likely to be additional.
left_text_column_width
Current Adoption
Given that improved nutrient management takes a variety of forms and data on the adoption of individual practices are very limited, we leveraged several global datasets related to nitrogen use and yields to directly assess improvements in nitrogen use efficiency (see Appendix for details).
First, we calculated nitrogen use per t of crop produced using global maps of nitrogen fertilizer use (Adalibieke et al., 2023) and global maps of crop yields (Gerber et al., 2024) for 17 major crops (see Appendix). Next, we determined a target nitrogen use rate (t N/t crop) for each crop, corresponding to the 20th percentile of nitrogen use rates observed in croplands with yield gaps at or below the 20th percentile, meaning that actual yields were close to an attainable yield ceiling (Gerber et al., 2024). Areas with large yield gaps were excluded from the calculation of target nutrient use efficiency because insufficient nitrogen supply may be compromising yields (Mueller et al., 2012). Yield data were not available for a small number of crops; for these, we assumed reductions in nitrogen use to be proportional to those of other crops.
We considered croplands that had achieved the target rate and had yield gaps lower than the global median to have adopted the solution. We calculated the amount of excess nitrogen use avoided from these croplands as the difference in total nitrogen use under current fertilization rates relative to median fertilizer application rates. As of 2020, croplands that had achieved the adoption threshold for improved nutrient management avoided 10.45 Mt of nitrogen annually relative to the median nitrogen use rate (Table 3), equivalent to 11% of the adoption ceiling.
left_text_column_width
Table 3. Current (2020) adoption level.
Unit: tN/yr
| estimate | 10,450,000 |
Left Text Column Width
Adoption Trend
Global average nitrogen use efficiency increased from 47.7% to 54.6% between 2000 and 2020, a rate of approximately 0.43%/yr (Ludemann et al., 2024). This increase accelerated somewhat in the latter decade, from an average rate of 0.38%/yr to 0.53%/yr. Underlying this increase were increases in both the amount of nitrogen used and the amount of excess nitrogen. Total nitrogen additions increased by approximately 2.64 Mt/yr, with the amount of nitrogen used increasing more rapidly (1.99 Mt/yr) than the amount of excess nitrogen (0.65 Mt/yr) between 2000 and 2020 (Ludemann et al., 2024). Although nitrogen use increased between 2000 and 2020 as yields increased, the increase in nitrogen use efficiency suggests uptake of this solution.
left_text_column_width
Adoption Ceiling
We estimated the adoption ceiling of improved nutrient management to be 95.13 Mt avoided excess nitrogen use/year (Table 4), including current adoption. This value reflects our estimate of the maximum potential reduction in nitrogen application while avoiding large yield losses and consists of the potential to avoid 62.25 Mt of synthetic nitrogen use and 32.88 Mt of manure and other organic nitrogen use, in addition to current adoption. In total, this is equivalent to an additional 68% reduction in global nitrogen use. The adoption ceiling was calculated as the difference between total nitrogen use at the current rate and total nitrogen use at the target rate (as described in Current Adoption), assuming no change in crop yields. For nitrogen applied to crops for which yield data were not available, the potential reduction in nitrogen use was assumed to be proportional to that of crops for which full data were available.
left_text_column_width
Table 4. Adoption ceiling.
Unit: tN/yr
| estimate | 105,580,000 |
Left Text Column Width
Achievable Adoption
We estimated that fertilizer use reductions of 69.85–91.06 Mt of nitrogen are achievable, reflecting current adoption plus nitrogen savings due to the achievement of nitrogen application rates equal to the median and 30th percentile of nitrogen application rates occurring in locations where yield gaps are small (Table 5).
This range is more ambitious than a comparable recent estimate by Gu et al. (2023), who found that reductions of approximately 42 Mt of nitrogen are avoidable via cost-effective implementation of similar practices. Differences in target nitrogen use efficiencies underlie differences between our estimates and those of Gu et al., whose findings correspond to an increase in global average cropland nitrogen use efficiency from 42% to 52%. Our estimates reflect higher target nitrogen use efficiencies. Nitrogen use efficiencies greater than 52% have been widely achieved through basic practice modification without compromising yields or requiring prohibitively expensive additional inputs. For instance, You et al. (2023) estimated that the global average nitrogen use efficiency could be increased to 78%. Similarly, cropland nitrogen use efficiency in the United States in 2020 was estimated to be 71%, and substantial opportunities for improved nitrogen use efficiency are still available within the United States (Ludemann et al., 2024), though Lu et al. (2019) and Swaney et al. (2018) report slightly lower estimates. These findings support our slightly more ambitious range of achievable nitrogen use reductions for this solution.
left_text_column_width
Table 5. Range of achievable adoption levels.
Unit: tN/yr
| Current Adoption | 10,450,000 |
| Achievable – Low | 69,850,000 |
| Achievable – High | 91,060,000 |
| Adoption Ceiling | 105,580,000 |
Left Text Column Width
We estimated that improved nutrient management has the potential to reduce emissions by 0.63 Gt CO₂‑eq/yr, with achievable emissions reductions of 0.42–0.54 Gt CO₂‑eq/yr (Table 6). This is equivalent to an additional 56–76% reduction in total nitrous oxide emissions from fertilizer use, based on the croplands represented in our analysis.
We estimated avoidable emissions by multiplying our estimates of adoption ceiling and achievable adoption by the relevant IPCC 2019 emissions factors, disaggregated by climate zone and fertilizer type. Under the adoption ceiling scenario, approximately 70% of emissions reductions occurred in wet climates, where emissions per t of applied fertilizer are higher. Reductions in synthetic fertilizer use, which are larger than reductions in organic fertilizer use, contributed about 76% of the potential avoidable emissions. We estimated that the current implementation of improved nutrient management was associated with 0.06 Gt CO₂‑eq/yr of avoided emissions.
Our estimates are slightly more optimistic but well within the range of the IPCC 2021 estimates, which found that improved nutrient management could reduce nitrous oxide emissions by 0.06–0.7 Gt CO₂‑eq/yr.
left_text_column_width
Table 6. Climate impact at different levels of adoption.
Unit: Gt CO₂-eq/yr, 100-yr basis
| Current Adoption | 0.06 |
| Achievable – Low | 0.42 |
| Achievable – High | 0.54 |
| Adoption Ceiling | 0.63 |
Left Text Column Width
Additional Benefits
Food Security
While excessive nutrients cause environmental problems in some parts of the world, insufficient nutrients are a significant problem in others, resulting in lower agricultural yields (Foley et al., 2011). Targeted, site-specific, efficient use of fertilizers can improve crop productivity (Mueller et al., 2012; Vanlauwe et al., 2015), improving food security globally.
Health
Domingo et al. (2021) estimated about 16,000 premature deaths annually in the United States are due to air pollution from the food sector and found that more than 3,500 premature deaths per year could be avoided through reduced use of ammonia fertilizer, a secondary particulate matter precursor. Better agriculture practices overall can reduce particulate matter-related premature deaths from the agriculture sector by 50% (Domingo et al., 2021). Nitrogen oxides from fertilized croplands is another source of agriculture-based air pollution, and improved management can lead to decreased respiratory and cardiovascular disease (Almarez et al., 2018; Sobota et al., 2015).
Nitrate contamination of drinking water due to excessive runoff from agriculture fields has been linked to several health disorders, including methemoglobinemia and cancer (Patel et al., 2022; Ward et al., 2018). Reducing nutrient runoff through better management is critical to minimize these risks (Ward et al., 2018).
Income and Work
Better nutrient management reduces farmers' input costs and increases profitability (Rurinda et al., 2020; Wang et al., 2020). It is especially beneficial to smallholder farmers in sub-Saharan Africa, where site-specific nutrient management programs have demonstrated a significant increase in yield (Chivenge et al., 2021). A review of 61 studies across 11 countries showed that site-specific nutrient management resulted in an average increase in yield by 12% and increased farmer’s’ income by 15% while improving nitrogen use efficiency (Chivenge et al., 2021).
Nature protection
Nutrient runoff from agricultural systems is a major driver of water pollution globally, leading to eutrophication and hypoxic zones in aquatic ecosystems (Bijay-Singh & Craswell, 2021). Nitrogen pollution also harms terrestrial biodiversity through soil acidification and increases productivity of fast-growing species, including invasives, which can outcompete native species (Porter et al., 2013). Improved nutrient management is necessary to reduce nitrogen and phosphorus loads to water bodies (Withers et al., 2014; van Grinsven et al., 2019) and terrestrial ecosystems (Porter et al., 2013). These practices have been effective in reducing harmful algal blooms and preserving biodiversity in sensitive water systems (Scavia et al., 2014).
Resilience to Drought
Balanced nutrient concentration contributes to long-term soil fertility and improved soil health by enhancing organic matter content, microbial diversity, and nutrient cycling (Antil & Raj, 2020; Selim, 2020). Healthy soil experiences reduced erosion and has higher water content, which increases its resilience to droughts and extreme heat (Rockström et al., 2017).
left_text_column_width
Risks
Although substantial reductions in nitrogen use can be achieved in many places with no or minimal impacts on yields, reducing nitrogen application by too much can lead to yield declines, which in turn can boost demand for cropland, causing GHG-producing land use change. Reductions in only excess nitrogen application will prevent substantial yield losses.
left_text_column_width
Some nutrient management practices are associated with additional emissions. For example, nitrification inhibitors reduce direct nitrous oxide emissions (Qiao et al., 2014) but can increase ammonia volatilization and subsequent indirect nitrous oxide emissions (Lam et al., 2016). Additionally, in wet climates, nitrous oxide emissions may be reduced through the use of manure instead of synthetic fertilizers (Hergoualc’h et al., 2019), though impacts vary across sites and studies (Zhang et al., 2020). Increased demand for manure could increase livestock production, which has high associated GHG emissions. Emissions also arise from transporting manure to the site of use (Qin et al., 2021).
Although nitrous oxide has a strong direct climate-warming effect, fertilizer use can cool the climate through emissions of other reactive nitrogen-containing compounds (Gong et al., 2024). First, aerosols from fertilizers scatter heat from the sun and cool the climate (Shindell et al., 2009; Gong et al., 2024). Moreover, other reactive nitrogen compounds from fertilizers shorten the lifespan of methane in the atmosphere, reducing its warming effects (Pinder et al., 2012). Finally, nitrogen fertilizers that leave farm fields through volatilization or runoff are ultimately deposited elsewhere, enhancing photosynthesis and sequestering additional carbon in plants and soils (Zaehle et al., 2011; Gong et al., 2024). Improved nutrient management would reduce these cooling effects.
left_text_column_width
Interactions with Other Solutions
Reinforcing
Improved nutrient management will reduce emissions from the production phase of biomass crops, increasing their benefit.
left_text_column_width
Competing
Improved nutrient management will reduce the GHG production associated with each calorie and, therefore, the impacts of the Improve Diets and Reduce Food Loss and Waste solutions will be reduced
left_text_column_width
Each of these solutions could decrease emissions associated with fertilizer production, but improved nutrient management will reduce total demand for fertilizers.
left_text_column_width
Dashboard
Solution Basics
t avoided excess nitrogen application/yr
tCO2-eq/unit
6
units
Current
1.05×10⁷6.99×10⁷9.11×10⁷
Achievable (Low to High)
Climate Impact
GtCO2-eq/yr
Current 0.06
0.420.54
US$ per tCO2-eq
-85
Gradual
N₂O
tCO2-eq/ha
The Problem — Emissions of Nitrous Oxide Coming from Over-fertilized Soils
The world’s agricultural lands can emit high levels of nitrous oxide (N2O), the third most powerful greenhouse gas. These emissions stem from overusing nitrogen-based fertilizers, especially in regions in China, India, Western Europe, and central North America (in red). While crops absorb some of the nitrogen fertilizer we apply, much of what remains is lost to the atmosphere as nitrous oxide pollution or to local waterways as nitrate pollution. Using fertilizers more wisely can dramatically reduce greenhouse gas emissions and water pollution while maintaining high levels of crop production.
Analysis: Project Drawdown; Driscoll et al, In prep.
Geographic Guidance Introduction
Improved nutrient management will have the greatest emissions reduction if it is targeted at areas with the largest excesses of nitrogen fertilizer use. In 2020, China, India, and the United States alone accounted for 52% of global excess nitrogen application (Ludemann et al., 2024). Improved nutrient management could be particularly beneficial in China and India, where nutrient use efficiency is currently lower than average (Ludemann et al., 2024). You et al. (2023) also found potential for large increases in nitrogen use efficiency in parts of China, India, Australia, Northern Europe, the United States Midwest, Mexico, and Brazil under standard best management practices. Gu et al. (2024) found that nitrogen input reductions are economically feasible in most of Southern Asia, Northern and Western Europe, parts of the Middle East, North America, and Oceania.
In addition to regional patterns in the adoption ceiling, greater nitrous oxide emissions reductions are possible in wet climates or on irrigated croplands compared to dry climates. Nitrous oxide emissions tend to peak when nitrogen availability is high and soil moisture is in the ~70–90% range (Betterbach-Bahl et al., 2013; Elberling et al., 2023; Hao et al., 2025; Lawrence et al., 2021), though untangling the drivers of nitrous oxide emissions is complex (Lawrence et al., 2021). Water management to avoid prolonged periods of soil moisture in this range is an important complement to nutrient management in wet climates and on irrigated croplands (Deng et al., 2018).
Importantly, improved nutrient management, as defined here, is not appropriate for implementation in areas with nitrogen deficits or negligible nitrogen surpluses, including much of Africa. In these areas, crop yields are constrained by nitrogen availability, and an increase in nutrient inputs may be needed to achieve target yields. Additionally, nutrient management in paddy (flooded) rice systems is not included in this solution but rather in the Improve Rice Production solution.
Action Word
Improve
Solution Title
Nutrient Management
Classification
Highly Recommended
Lawmakers and Policymakers
- Focus policies and regulations on the four nutrient management principles – right rate, type, time, and place.
- Create dynamic nutrient management policies that account for varying practices, environments, drainage, historical land use, and other factors that may require adjusting nutrient regulations.
- Offer financial assistance responsive to local soil and weather conditions, such as grants and subsidies, insurance programs, and tax breaks, to encourage farmers to comply with regulations.
- Mandate insurance schemes that allow farmers to reduce fertilizer use.
- Mandate nutrient budgets or ceilings that are responsive to local yield, weather, and soil conditions.
- Require farmers to formulate nutrient management and fertilizer plans.
- Mandate efficiency rates for manure-spreading equipment.
- Ensure access to and require soil tests to inform fertilizer application.
- Invest in research on alternative organic nutrient sources.
- Create and expand education programs and extension services that highlight the problems that arise from the overuse of fertilizers, benefits of soil management such as cost-savings, and penalties for non-compliance
- Create ongoing support groups among farmers.
Further information:
- Nutrient management. Watershed Agricultural Council
- Nutrient management. U.S. Department of Agriculture
- Toolbox. Global Partnership on Nutrient Management
- Government relations and public policy job function action guide. Project Drawdown (2022)
- Legal job function action guide. Project Drawdown (2022)
Practitioners
- Use the four nutrient management principles – right rate, type, time, and place – to guide fertilizer application.
- Utilize or advocate for financial assistance and tax breaks for farmers to improve nutrient management techniques.
- Create and adhere to nutrient and fertilizer management plans.
- Conduct soil tests to inform fertilizer application.
- Use winter cover crops, crop rotations, residue retention, and split applications for fertilizer.
- Improve the efficiency of, and regularly calibrate, manure-spreading equipment.
- Leverage agroecological practices such as nutrient recycling and biological nitrogen fixation.
- Join, create, or participate in partnerships or certification programs dedicated to improving nutrient management.
- Take advantage of education programs, support groups, and extension services focused on improved nutrient management.
Further information:
- Nutrient management. Watershed Agricultural Council
- Nutrient management. U.S. Department of Agriculture
- Toolbox. Global Partnership on Nutrient Management
Business Leaders
- Provide incentives for farmers in primary sourcing regions to adopt best management practices for reducing nitrogen application.
- Invest in companies that use improved nutrient management techniques or produce equipment or research for fertilizer application and testing.
- Advocate to policymakers for improved nutrient management techniques, incentives, and regulations.
- Join, create, or participate in partnerships or certification programs dedicated to improving nutrient management practices.
- Promote products produced with improved nutrient management techniques and educate consumers about the importance of the practice.
- Create or support education programs and extension services that highlight the problems that arise from the overuse of fertilizers, benefits of soil management such as cost-savings, and penalties for non-compliance.
- Create ongoing support groups among farmers.
Further information:
- Nutrient management. Watershed Agricultural Council
- Nutrient management. U.S. Department of Agriculture
- Toolbox. Global Partnership on Nutrient Management
- Climate solutions at work. Project Drawdown (2021)
- Drawdown-aligned business framework. Project Drawdown (2021)
Nonprofit Leaders
- Start model farms to demonstrate improved nutrient management techniques, conduct experiments, and educate local farmers.
- Conduct and share research on improved nutrient management techniques, alternative organic fertilizers, or local policy options.
- Advocate to policymakers for improved nutrient management techniques, incentives, and regulations.
- Engage with businesses to encourage corporate responsibility and/or monitor water quality and soil health.
- Join, create, or participate in partnerships or certification programs dedicated to improving nutrient management practices.
- Create or support education programs and extension services that highlight the problems that arise from the overuse of fertilizers, benefits of soil management such as cost-savings, and penalties for non-compliance.
- Create ongoing support groups among farmers.
Further information:
- Nutrient management. Watershed Agricultural Council
- Nutrient management. U.S. Department of Agriculture
- Toolbox. Global Partnership on Nutrient Management
Investors
- Invest in companies developing technologies that support improved nutrient management such as precision fertilizer applicators, alternative fertilizers, soil management equipment, and software.
- Invest in ETFs and ESG funds that hold companies committed to improved nutrient management techniques in their portfolios.
- Encourage companies in your investment portfolio to adopt improved nutrient management.
- Provide access to capital at reduced rates for farmers adhering to improved nutrient management.
Further information:
- Nutrient management. Watershed Agricultural Council
- Nutrient management. U.S. Department of Agriculture
- Toolbox. Global Partnership on Nutrient Management
Philanthropists and International Aid Agencies
- Provide financing for farmers to improve nutrient management.
- Start model farms to demonstrate nutrient management techniques, conduct experiments, and educate local farmers.
- Conduct and share research on improved nutrient management, alternative organic fertilizers, or local policy options.
- Advocate to policymakers for improved nutrient management techniques, incentives, and regulations.
- Engage with businesses to encourage corporate responsibility and/or monitor water quality and soil health.
- Join, create, or participate in partnerships or certification programs dedicated to improving nutrient management practices.
- Create or support education programs and extension services that highlight the problems that arise from the overuse of fertilizers, benefits of soil management such as cost-savings, and penalties for non-compliance.
- Create ongoing support groups among farmers.
Further information:
- Nutrient management. Watershed Agricultural Council
- Nutrient management. U.S. Department of Agriculture
- Toolbox. Global Partnership on Nutrient Management
Thought Leaders
- Start model farms to demonstrate techniques, conduct experiments, and educate local farmers.
- Conduct and share research on improved nutrient management, alternative organic fertilizers, or local policy options.
- Advocate to policymakers for improved nutrient management techniques, incentives, and regulations.
- Engage with businesses to encourage corporate responsibility and/or monitor water quality and soil health.
- Join, create, or participate in partnerships dedicated to improving nutrient management practices.
- Create or support education programs and extension services that highlight the problems that arise from the overuse of fertilizers, benefits of soil management such as cost-savings, and penalties for non-compliance.
- Create ongoing support groups among farmers.
Further information:
- Nutrient management. Watershed Agricultural Council
- Nutrient management. U.S. Department of Agriculture
- Toolbox. Global Partnership on Nutrient Management
Technologists and Researchers
- Improve technology and cost-effectiveness of precision fertilizer application, slow-release fertilizer, alternative organic fertilizers, nutrient recycling, and monitoring equipment.
- Create tracking and monitoring software to support farmers' decision-making.
- Research and develop the application of AI and robotics for precise fertilizer application.
- Improve data and analytics to monitor soil and water quality, assist farmers, support policymaking, and assess the impacts of policies.
- Develop education and training applications to promote improved nutrient management and provide real-time feedback.
Further information:
- Nutrient management. Watershed Agricultural Council
- Nutrient management. U.S. Department of Agriculture
- Toolbox. Global Partnership on Nutrient Management
Communities, Households, and Individuals
- Create or join community-supported agriculture programs that source from farmers who used improved nutrient management practices.
- Conduct soil tests on your lawn and garden and reduce fertilizer use if you are over-fertilizing.
- Volunteer for soil and water quality monitoring and restoration projects.
- Start model farms to demonstrate techniques, conduct experiments, and educate local farmers.
- Advocate to policymakers for improved nutrient management techniques, incentives, and regulations.
- Engage with businesses to encourage corporate responsibility and/or monitor water quality and soil health.
- Join, create, or participate in partnerships dedicated to improving nutrient management.
- Create or support education programs and extension services that highlight the problems that arise from the overuse of fertilizers, benefits of soil management such as cost-savings, and penalties for non-compliance.
- Create ongoing support groups among farmers.
Further information:
- Nutrient management. Watershed Agricultural Council
- Nutrient management. U.S. Department of Agriculture
- Toolbox. Global Partnership on Nutrient Management
Sources
- Which factors influence farmers’ intentions to adopt nutrient management planning?, Daxini, A., et al. (2018)
- Quantification of environmental-economic trade-offs in nutrient management policies, Kaye-Blake, et al. (2019)
- Regulating farmer nutrient management: A three-state case study on the Delmarva Peninsula, Perez, M. R. (2015)
- Promise and performance of agricultural nutrient management policy: lessons from the Baltic Sea, Thorsøe, M. H., et al. (2021)
- Exploring nutrient management options to increase nitrogen and phosphorus use efficiencies in food production of China, Wang, M., et al. (2018)
- Quantifying nutrient budgets for sustainable nutrient management, Zhang, X., et al. (2020)
Evidence Base
There is high scientific consensus that reducing nitrogen surpluses through improved nutrient management reduces nitrous oxide emissions from croplands.
Nutrient additions to croplands produce an estimated 0.9 Gt CO₂‑eq/yr (range 0.7–1.1 Gt CO₂ -e/yr) of direct nitrous oxide emissions from fields, plus approximately 0.3 Gt CO₂‑eq/yr of indirect emissions from fertilizers that runoff into waterways or erode (Tian et al., 2020). Nitrous oxide emissions from croplands are directly linked to the amount of nitrogen applied. Furthermore, the amount of nitrous oxide emitted per unit of applied nitrogen is well quantified for a range of different nitrogen sources and field conditions (Reay et al., 2012; Shcherbak et al., 2014; Gerber et al., 2016; Intergovernmental Panel on Climate Change [IPCC], 2019; Hergoualc’h et al., 2021). Tools to improve nutrient management have been extensively studied, and practices that improve nitrogen use efficiency through right rate, time, place, and type principles have been implemented in some places for several decades (Fixen, 2020; Ludemann et al., 2024).
Recently, Gao & Cabrera Serrenho (2023) estimated that fertilizer-related emissions could be reduced up to 80% by 2050 relative to current levels using a combination of nutrient management and new fertilizer production methods. You et al. (2023) found that adopting improved nutrient management practices would increase nitrogen use efficiency from a global average of 48% to 78%, substantially reducing excess nitrogen. Wang et al. (2024) estimated that the use of enhanced-efficiency fertilizers could reduce nitrogen losses to the environment 70–75% for maize and wheat systems. Chivenge et al. (2021) found comparable results in smallholder systems in Africa and Asia.
The results presented in this document were produced through analysis of global datasets. We recognize that geographic biases can influence the development of global datasets and hope this work inspires research and data sharing on this topic in underrepresented regions.
left_text_column_width
Appendix
In this analysis, we calculated the potential for reducing crop nitrogen inputs and associated nitrous oxide emissions by integrating spatially explicit, crop-specific data on nitrogen inputs, crop yields, attainable yields, irrigated extent, and climate. Broadly, we calculated a “target” yield-scaled nitrogen input rate based on pixels with low yield gaps and calculated the difference between nitrous oxide emissions under the current rate and under the hypothetical target emissions rate, using nitrous oxide emissions factors disaggregated by fertilizer type and climate.
Emissions factors
We used Tier 1 emissions factors from the IPCC 2019 Refinement to the 2006 Guidelines for National Greenhouse Gas Inventories, including direct emissions factors as well as indirect emissions from volatilization and leaching pathways. Direct emissions factors represent the proportion of applied nitrogen emitted as nitrous oxide, while we calculated volatilization and leaching emissions factors by multiplying the proportion of applied nitrogen lost through these pathways by the proportion of volatilized or leached nitrogen ultimately emitted as nitrous oxide. Including both direct and indirect emissions, organic and synthetic fertilizers emit 4.97 kg CO₂‑eq/kg nitrogen and 8.66 kg CO₂‑eq/kg nitrogen, respectively, in wet climates, and 2.59 kg CO₂‑eq/kg nitrogen and 2.38 kg CO₂‑eq/kg nitrogen in dry climates. We included uncertainty bounds (2.5th and 97.5th percentiles) for all emissions factors.
We classified each pixel as “wet” or “dry” using an aridity index (AI) threshold of 0.65, calculated as the ratio of annual precipitation to potential evapotranspiration (PET) from TerraClimate data (1991–2020), based on a threshold of 0.65. For pixels in dry climates that contained irrigation, we took the weighted average of wet and dry emissions factors based on the fraction of cropland that was irrigated (Mehta et al., 2024). We excluded irrigated rice from this analysis due to large differences in nitrous oxide dynamics in flooded rice systems.
Current, target, and avoidable nitrogen inputs and emissions
Using highly disaggregated data on nitrogen inputsfrom Adalibieke et al. (2024) for 21 crop groups (Table S1), we calculated total crop-specific inputs of synthetic and organic nitrogen. We then averaged over 2016–2020 to reduce the influence of interannual variability in factors like fertilizer prices. These values are subsequently referred to as “current” nitrogen inputs. We calculated nitrous oxide emissions under current nitrogen inputs as the sum of the products of nitrogen inputs and the climatically relevant emissions factors for each fertilizer type.
Next, we calculated target nitrogen application rates in terms of kg nitrogen per ton of crop yield using data on actual and attainable yields for 17 crops from Gerber et al., 2024 (Table S1). For each crop, we first identified pixels in which the ratio of actual to attainable yields was above the 80th percentile globally. The target nitrogen application rate was then calculated as the 20th percentile of nitrogen application rates across low-yield-gap pixels. Finally, we calculated total target nitrogen inputs as the product of actual yields and target nitrogen input rates. We calculated hypothetical nitrous oxide emissions from target nitrogen inputs as the product of nitrogen inputs and the climatically relevant emissions factor for each fertilizer type.
The difference between current and target nitrogen inputs represents the amount by which nitrogen inputs could hypothetically be reduced without compromising crop productivity (i.e., “avoidable” nitrogen inputs). We calculated avoidable nitrous oxide emissions as the difference between nitrous oxide emissions with current nitrogen inputs and those with target nitrogen inputs. For crops for which no yield or attainable yield data were available, we applied the average percent reduction in nitrogen inputs under the target scenario from available crops to the nitrogen input data for missing crops to calculate the avoidable nitrogen inputs and emissions.
This simple and empirically driven method aimed to identify realistically low but nutritionally adequate nitrogen application rates by including only pixels with low yield gaps, which are unlikely to be substantially nutrient-constrained. We did not control for other factors affecting nitrogen availability, such as historical nutrient application rates or depletion, rotation with nitrogen fixing crops, or tillage and residue retention practices.
left_text_column_width
Table S1. Crops represented by the source data on nitrogen inputs (Adalibieke et al., 2024) and estimated and attainable yields (Gerber et al., 2024). Crop groups included consistently in both datasets are marked as “both,” and crop groups represented in the nitrogen input data but not in the yield datasets are marked as “nitrogen only.”
| Crop | Dataset(s) |
|---|---|
| Barley | Both |
| Cassava | Both |
| Cotton | Both |
| Maize | Both |
| Millet | Both |
| Oil Palm | Both |
| Potato | Both |
| Rice | Both |
| Rye | Both |
| Rapeseed | Both |
| Sorghum | Both |
| Soybean | Both |
| Sugarbeet | Both |
| Sugarcane | Both |
| Sunflower | Both |
| Sweet Potato | Both |
| Wheat | Both |
| Groundnut | Nitrogen only |
| Fruits | Nitrogen only |
| Vegetables | Nitrogen only |
| Other | Nitrogen only |
Left Text Column Width
Updated Date
Improve Forest Management
Mode
Cut Emissions
Cluster
Protect & Manage Ecosystems
Image
Image

Coming Soon
On
Action Word
Improve
Solution Title
Forest Management
Classification
Highly Recommended
Updated Date
Protect Seafloors
Mode
Cut Emissions
Cluster
Protect & Manage Ecosystems
Image
Image
Coming Soon
Off
Summary
Protect Seafloors is the long-term protection of the seafloor from degradation, which helps preserve existing sediment carbon stocks and avoid CO₂ emissions. Advantages of seafloor protection include the conservation of biodiversity and marine ecosystems, potentially low costs, and the ability for immediate implementation. Disadvantages include uncertainties in the effectiveness of legal protection at preventing degradation and in the amount of CO₂ emissions avoided, as well as the risk of displacement of degradation to non-protected areas and/or an increase in other types of degradation. Given these limitations, we conclude that Seafloor Protection is a climate solution “Worth Watching” until more research can clearly show the carbon benefits of protection.
Overview
What is our assessment?
Based on our analysis, seafloor protection could avoid some CO₂ emissions while preserving critical marine ecosystems from degradation. However, the effectiveness of protection and the magnitude of avoided CO₂ emissions associated with protection are understudied and currently unclear, making this potential climate solution “Worth Watching.”
| Plausible | Could it work? | Yes |
|---|---|---|
| Ready | Is it ready? | No |
| Evidence | Are there data to evaluate it? | Limited |
| Effective | Does it consistently work? | No |
| Impact | Is it big enough to matter? | Yes |
| Risk | Is it risky or harmful? | No |
| Cost | Is it cheap? | Yes |
What is it?
Protect Seafloors aims to reduce human impacts that can degrade sediment carbon stocks and increase CO₂ emissions. Protection is conferred through legal mechanisms, such as Marine Protected Areas (MPAs), which are managed with the primary goal of conserving nature. The seafloor stores over 2,300 Gt of carbon (~8,400 Gt CO₂‑eq) in the top one meter of sediment. This marine carbon can be stable and remain sequestered for millennia. However, degradation of the seafloor from a range of human activities can disturb bottom sediments, resuspending the carbon and increasing its microbial conversion into CO₂. Currently, degradation of the seafloor primarily results from fishing practices, such as trawling and dredging, which are estimated to occur across 1.3% of the global ocean. Additional sources of degradation include undersea mining, infrastructure development (for offshore wind farms, oil, and gas), and laying telecommunications cables. Estimates of seafloor degradation are highly uncertain due to data limitations and the unpredictable nature of how these activities may expand in the future.
Does it work?
More evidence is needed to confirm whether legal seafloor protection is effective at reducing degradation and the extent to which degradation results in increased CO₂ emissions. While ~8% of the seafloor is currently protected through MPAs, there is mixed evidence that legal protection reduces degradation and CO₂ emissions. For instance, in a review of 49 studies examining the impacts of bottom trawling and dredging on sediment organic carbon stocks, most (61%) showed no change, while nearly a third (29%) showed carbon loss. More recent work suggests that trawling intensity might drive these mixed results, with more heavily trawled areas showing clear reductions in sediment organic carbon. Additionally, the few existing global estimates of CO₂ emissions from trawling and dredging range from 0.03 to 0.58 Gt CO₂/yr, highlighting the need for further research. The effectiveness of MPAs at preventing seafloor degradation is also mixed. In strictly protected areas with enforcement of no-take policies that prevent bottom fishing, MPAs could help minimize degradation and retain seafloor carbon. However, implementation can be challenging, as over half of existing MPAs generally allow high-impact activities. For instance, trawling and dredging occur more frequently in MPAs than in non-protected areas in the territorial waters of Europe.
Why are we excited?
Advantages of seafloor protection include its potential low cost and its ability to conserve often understudied biodiversity and ecosystems. Human activities, such as trawling and dredging, impact marine organisms on the seafloor, and ecosystem recovery can take years to occur. In the case of undersea mining, ecosystems may never fully recover. Increases in CO₂ emissions along the seafloor from degradation can also enhance local acidification and reduce the ocean's buffering capacity, both of which can affect marine organisms and the carbon sequestration capacity of seawater. Protection can also increase fisheries yields in neighboring waters and reduce other negative impacts of seafloor disturbances. While costs are somewhat uncertain, MPA expenses have been estimated to be an order of magnitude less than the often unseen ecosystem service benefits gained with protection, suggesting MPA expansion could provide cost savings.
Why are we concerned?
Disadvantages of seafloor protection include uncertainties surrounding the effectiveness of preventing degradation and avoiding CO₂ emissions, as well as the potential increased risk of disturbance to other ocean areas. The amount and fate of CO₂ generated due to the degradation of seafloor carbon is complex and understudied. It can take months or even centuries for CO₂ produced at depth to reach the sea surface and atmosphere. Current estimates of CO₂ emissions due to dredging and trawling are widely debated and highly variable due to differing methods and assumptions. Large amounts of organic carbon will inevitably re-settle after seafloor disturbances, with no impact on CO₂, but estimates of just how much remain uncertain. The risk of protection-induced leakage, where a reduction in disturbances, such as trawling and dredging in MPAs, leads to increased fishing effort in other ocean areas, is also potentially high.
References
Amoroso, R. O., Pitcher, C. R., Rijnsdorp, A. D., McConnaughey, R. A., Parma, A. M., Suuronen, P., ... & Jennings, S. (2018). Bottom trawl fishing footprints on the world’s continental shelves. Proceedings of the National Academy of Sciences, 115(43), E10275-E10282. https://doi.org/10.1073/pnas.1802379115
Atwood, T. B., Witt, A., Mayorga, J., Hammill, E., & Sala, E. (2020). Global patterns in marine sediment carbon stocks. Frontiers in Marine Science, 7, 165. https://doi.org/10.3389/fmars.2020.00165
Atwood, T.B., Sala, E., Mayorga, J. et al. Reply to: Quantifying the carbon benefits of ending bottom trawling. Nature, 617, E3–E5 (2023). https://doi.org/10.1038/s41586-023-06015-6
Atwood, T. B., Romanou, A., DeVries, T., Lerner, P. E., Mayorga, J. S., Bradley, D., ... & Sala, E. (2024). Atmospheric CO₂ emissions and ocean acidification from bottom-trawling. Frontiers in Marine Science, 10, 1125137. https://doi.org/10.3389/fmars.2023.1125137
Balmford, A., Gravestock, P., Hockley, N., McClean, C.J. and Roberts, C.M. (2004). The worldwide costs of marine protected areas. Proceedings of the National Academy of Sciences, 101(26), pp.9694-9697. https://doi.org/10.1073/pnas.0403239101
Burdige, D. J. (2005). Burial of terrestrial organic matter in marine sediments: a re-assessment. Global Biogeochem. Cycles, 19:GB4011. https://doi.org/10.1029/2004GB002368
Burdige, D. J. (2007). Preservation of organic matter in marine sediments: controls, mechanisms, and an imbalance in sediment organic carbon budgets? Chem. Rev., 107, 467–485. https://doi.org/10.1021/cr050347q
Carr, M. E., Friedrichs, M. A. M., Schmeltz, M., Aita, M. N., Antoine, D., Arrigo, K., et al. (2006). A comparison of global estimates of marine primary production from ocean color. Deep-sea Res. II, Top. Stud. Oceanogr., 53, 741–770. https://doi.org/10.1016/j.dsr2.2006.01.028
Clare, M. A., Lichtschlag, A., Paradis, S., & Barlow, N. L. M. (2023). Assessing the impact of the global subsea telecommunications network on sedimentary organic carbon stocks. Nature Communications, 14(1), 2080. https://doi.org/10.1038/s41467-023-37854-6
Dureuil, M., Boerder, K., Burnett, K. A., Froese, R., & Worm, B. (2018). Elevated trawling inside protected areas undermines conservation outcomes in a global fishing hot spot. Science, 362(6421), 1403-1407. https://doi.org/10.1126/science.aau0561
Epstein, G., Middelburg, J. J., Hawkins, J. P., Norris, C. R., & Roberts, C. M. (2022). The impact of mobile demersal fishing on carbon storage in seabed sediments. Global Change Biology, 28(9), 2875-2894. https://doi.org/10.1111/gcb.16105
Estes, E. R., Pockalny, R., D’Hondt, S., Inagaki, F., Morono, Y., Murray, R. W., ... & Hansel, C. M. (2019). Persistent organic matter in oxic subseafloor sediment. Nature Geoscience, 12(2), 126-131. https://doi.org/10.1038/s41561-018-0291-5
Kandasamy, S., & Nagender Nath, B. (2016). Perspectives on the terrestrial organic matter transport and burial along the land-deep sea continuum: caveats in our understanding of biogeochemical processes and future needs. Frontiers in Marine Science, 3, 259. https://doi.org/10.3389/fmars.2016.00259
Muller-Karger, F. E., Varela, R., Thunell, R., Luerssen, R., Hu, C., and Walsh, J. J. (2005). The importance of continental margins in the global carbon cycle. Geophys. Res. Lett., 32:L01602. https://doi.org/10.1029/2004gl021346
Putuhena, H., White, D., Gourvenec, S., & Sturt, F. (2023). Finding space for offshore wind to support net zero: A methodology to assess spatial constraints and future scenarios, illustrated by a UK case study. Renewable and Sustainable Energy Reviews, 182, 113358. https://doi.org/10.1016/j.rser.2023.113358
Sala, E., Mayorga, J., Bradley, D., Cabral, R. B., Atwood, T. B., Auber, A., ... & Lubchenco, J. (2021). Protecting the global ocean for biodiversity, food and climate. Nature, 592(7854), 397-402. https://doi.org/10.1038/s41586-021-03371-z
Sala, E., & Giakoumi, S. (2018). No-take marine reserves are the most effective protected areas in the ocean. ICES Journal of Marine Science, 75(3), 1166-1168. https://doi.org/10.1093/icesjms/fsx059
Siegel, D. A., DeVries, T., Doney, S. C., & Bell, T. (2021). Assessing the sequestration time scales of some ocean-based carbon dioxide reduction strategies. Environmental Research Letters, 16(10), 104003. https://doi.org/10.1088/1748-9326/ac0be0
(TMC, 2022) The Metals Company. (2022). How much seafloor will the nodule collection industry impact? Retrieved April 17, 2025, from https://metals.co/how-much-seafloor-will-the-nodule-collection-industry-impact/
UNEP-WCMC and IUCN (2024). Protected Planet Report 2024. UNEP-WCMC and IUCN: Cambridge, United Kingdom; Gland, Switzerland. https://digitalreport.protectedplanet.net/
Zhang, W., Porz, L., Yilmaz, R., Wallmann, K., Spiegel, T., Neumann, A., ... & Schrum, C. (2024). Long-term carbon storage in shelf sea sediments reduced by intensive bottom trawling. Nature Geoscience, 1-9. https://doi.org/10.1038/s41561-024-01581-4
van de Velde, S. J., Hylén, A., & Meysman, F. J. (2025). Ocean alkalinity destruction by anthropogenic seafloor disturbances generates a hidden CO₂ emission. Science Advances, 11(13), https://doi.org/eadp9112.10.1126/sciadv.adp9112
Watson, S. C., Somerfield, P. J., Lemasson, A. J., Knights, A. M., Edwards-Jones, A., Nunes, J., ... & Beaumont, N. J. (2024). The global impact of offshore wind farms on ecosystem services. Ocean & Coastal Management, 249, 107023. https://doi.org/10.1016/j.ocecoaman.2024.107023
Credits
Lead Fellow
- Christina Richardson
Internal Reviewer
- Christina Swanson
Action Word
Protect
Solution Title
Seafloors
Classification
Keep Watching
Updated Date
Protect Coastal Wetlands
Mode
Cut Emissions
Cluster
Protect & Manage Ecosystems
Image
Image
Coming Soon
On
Action Word
Protect
Solution Title
Coastal Wetlands
Classification
Highly Recommended
Updated Date
Protect Peatlands
Mode
Cut Emissions
Cluster
Protect & Manage Ecosystems
Image
Image
Coming Soon
On
Overview
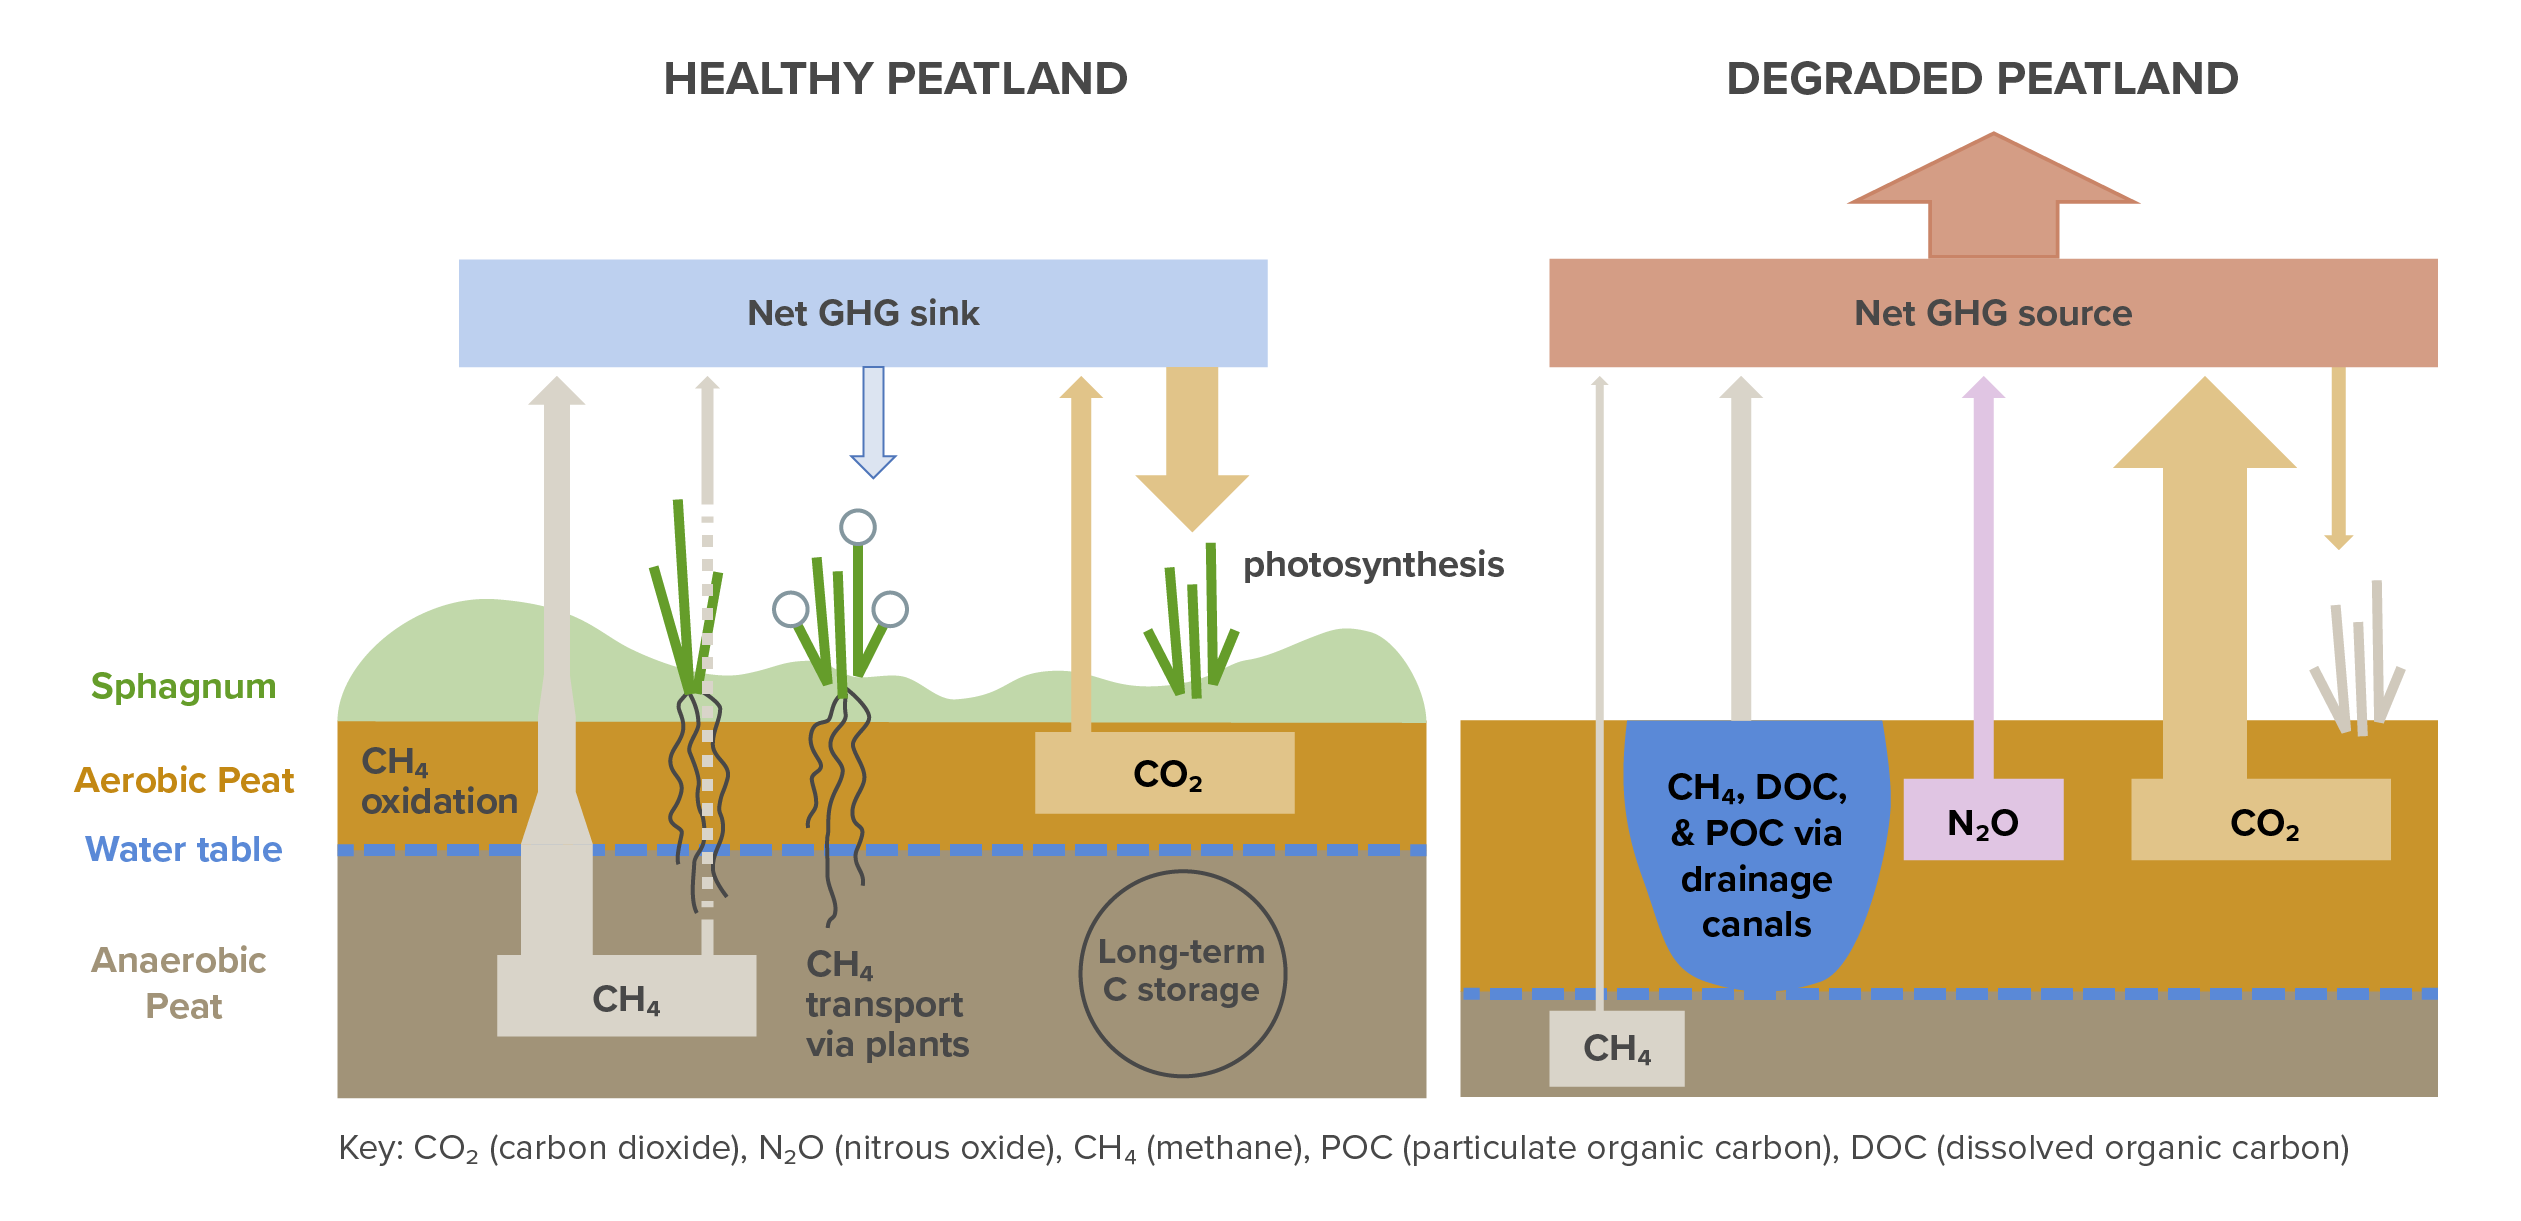
Figure 2. Greenhouse gas emissions and sequestration in intact peatlands (left) and a drained peatland (right). Intact peatlands are a net greenhouse gas sink, sequestering carbon in peat through photosynthesis but also emitting methane due to waterlogged soils. Drained peatlands are a greenhouse gas source, producing emissions from peat decomposition and drainage canals.
Image
Action Word
Protect
Solution Title
Peatlands
Classification
Highly Recommended
Updated Date
Protect Grasslands & Savannas
Mode
Cut Emissions
Cluster
Protect & Manage Ecosystems
Image
Image
Coming Soon
On
Action Word
Protect
Solution Title
Grasslands & Savannas
Classification
Highly Recommended
Updated Date
Protect Forests
Mode
Cut Emissions
Cluster
Protect & Manage Ecosystems
Image
Image

Coming Soon
Off
Summary
We define the Protect Forests solution as the long-term protection of tree-dominated ecosystems through establishment of protected areas (PAs), managed with the primary goal of conserving nature, and land tenure for Indigenous peoples. These protections reduce forest degradation, avoiding GHG emissions and ensuring continued carbon sequestration by healthy forests. This solution addresses protection of forests on mineral soils. The Protect Peatlands and Protect Coastal Wetlands solutions address protection of forested peatlands and mangrove forests, respectively, and the Restore Forests solution addresses restoring degraded forests.
Overview
Forests store carbon in biomass and soils and serve as carbon sinks, taking up an estimated 12.8 Gt CO₂‑eq/yr (including mangroves and forested peatlands; Pan et al., 2024). Carbon stored in forests is released into the atmosphere through deforestation and degradation, which refer to forest clearing or reductions in ecosystem integrity from human influence (DellaSala et al., 2025). Humans cleared an average of 0.4% (16.3 Mha) of global forest area annually 2001–2019 (excluding wildfire but including mangroves and forested peatlands; Hansen et al., 2013). This produced a gross flux of 7.4 Gt CO₂‑eq/yr (Harris et al., 2021), equivalent to ~14% of total global GHG emissions over that period (Dhakal et al., 2022). Different forest types store varying amounts of carbon and experience different rates of clearing; in this analysis, we individually evaluate forest protection in boreal, temperate, subtropical, and tropical regions. We included woodlands in our definition of forests because they are not differentiated in the satellite-based data used in this analysis.
We consider forests to be protected if they 1) are formally designated as PAs (UNEP-WCMC and IUCN, 2024), or 2) are mapped as Indigenous peoples’ lands in the global study by Garnett et al. (2018). The International Union for Conservation of Nature defines PAs as areas managed primarily for the long-term conservation of nature and ecosystem services. They are disaggregated into six levels of protection, ranging from strict wilderness preserves to sustainable-use areas that allow for some natural resource extraction, including logging. We included all levels of protection in this analysis, primarily because not all PAs have been classified into these categories. We rely on existing maps of Indigenous peoples’ lands but emphasize that much of their extent has not been fully mapped nor recognized for its conservation benefits (Garnett et al., 2018). Innovative and equity-driven strategies for forest protection that recognize the land rights, sovereignty, and stewardship of Indigenous peoples and local communities are critical for achieving just and effective forest protection globally (Dawson et al., 2024; Fa et al., 2020; FAO, 2024; Garnett et al., 2018; Tran et al., 2020; Zafra-Calvo et al., 2017).
Indigenous peoples’ lands and PAs reduce, but do not eliminate, forest clearing relative to unprotected areas (Baragwanath et al., 2020; Blackman & Viet 2018; Li et al., 2024; McNicol et al., 2023; Sze et al. 2022; Wolf et al., 2023; Wade et al., 2020). We rely on estimates of current PA effectiveness for this analysis but highlight that improving management to further reduce land use change within PAs is a critical component of forest protection (Jones et al., 2018; Meng et al., 2023; Vijay et al., 2018; Visconti et al., 2019; Watson et al., 2014).
Market-based strategies and other policies can complement legal protections by increasing the value of intact forests and reducing incentives for clearing (e.g., Garett et al., 2019; Golub et al., 2021; Heilmayr et al., 2020; Lambin et al., 2018; Levy et al., 2023; Macdonald et al., 2024; Marin et al., 2022; Villoria et al., 2022; West et al., 2023). The estimates in this report are based on legal protection alone because the effectiveness of market-based strategies is difficult to quantify, but strategies such as sustainable commodities programs, reducing or redirecting agricultural subsidies, and strategic infrastructure planning will be further discussed in an Appendix (coming soon).
References
Adams, V. M., Iacona, G. D., & Possingham, H. P. (2019). Weighing the benefits of expanding protected areas versus managing existing ones. Nature Sustainability, 2(5), 404–411. https://doi.org/10.1038/s41893-019-0275-5
Anderegg, W. R. L., Trugman, A. T., Badgley, G., Anderson, C. M., Bartuska, A., Ciais, P., Cullenward, D., Field, C. B., Freeman, J., Goetz, S. J., Hicke, J. A., Huntzinger, D., Jackson, R. B., Nickerson, J., Pacala, S., & Randerson, J. T. (2020). Climate-driven risks to the climate mitigation potential of forests. Science, 368(6497), eaaz7005. https://doi.org/10.1126/science.aaz7005
Arneth, A., Leadley, P., Claudet, J., Coll, M., Rondinini, C., Rounsevell, M. D. A., Shin, Y.-J., Alexander, P., & Fuchs, R. (2023). Making protected areas effective for biodiversity, climate and food. Global Change Biology, 29(14), 3883–3894. https://doi.org/10.1111/gcb.16664
Baragwanath, K., & Bayi, E. (2020). Collective property rights reduce deforestation in the Brazilian Amazon. Proceedings of the National Academy of Sciences, 117(34), 20495–20502. https://doi.org/10.1073/pnas.1917874117
Barnes, M. D., Glew, L., Wyborn, C., & Craigie, I. D. (2018). Prevent perverse outcomes from global protected area policy. Nature Ecology & Evolution, 2(5), 759–762. https://doi.org/10.1038/s41559-018-0501-y
Bliege Bird, R., & Nimmo, D. (2018). Restore the lost ecological functions of people. Nature Ecology & Evolution, 2(7), 1050–1052. https://doi.org/10.1038/s41559-018-0576-5
Blackman, A., & Veit, P. (2018). Titled Amazon Indigenous Communities Cut Forest Carbon Emissions. Ecological Economics, 153, 56–67. https://doi.org/10.1016/j.ecolecon.2018.06.016
Brennan, A., Naidoo, R., Greenstreet, L., Mehrabi, Z., Ramankutty, N., & Kremen, C. (2022). Functional connectivity of the world’s protected areas. Science, 376(6597), 1101–1104. https://doi.org/10.1126/science.abl8974
Brinck, K., Fischer, R., Groeneveld, J., Lehmann, S., Dantas De Paula, M., Pütz, S., Sexton, J. O., Song, D., & Huth, A. (2017). High resolution analysis of tropical forest fragmentation and its impact on the global carbon cycle. Nature Communications, 8(1), 14855. https://doi.org/10.1038/ncomms14855
Bruner, A. G., Gullison, R. E., & Balmford, A. (2004). Financial Costs and Shortfalls of Managing and Expanding Protected-Area Systems in Developing Countries. BioScience, 54(12), 1119–1126. https://doi.org/10.1641/0006-3568(2004)054[1119:FCASOM]2.0.CO;2
Buotte, P. C., Law, B. E., Ripple, W. J., & Berner, L. T. (2020). Carbon sequestration and biodiversity co-benefits of preserving forests in the western United States. Ecological Applications, 30(2), e02039. https://doi.org/10.1002/eap.2039
Curtis, P. G., Slay, C. M., Harris, N. L., Tyukavina, A., & Hansen, M. C. (2018). Classifying drivers of global forest loss. Science, 361(6407), 1108–1111. https://doi.org/10.1126/science.aau3445
Dawson, N. M., Coolsaet, B., Bhardwaj, A., Booker, F., Brown, D., Lliso, B., Loos, J., Martin, A., Oliva, M., Pascual, U., Sherpa, P., & Worsdell, T. (2024). Is it just conservation? A typology of Indigenous peoples’ and local communities’ roles in conserving biodiversity. One Earth, 7(6), 1007–1021. https://doi.org/10.1016/j.oneear.2024.05.001
de Souza, S. E. X. F., Vidal, E., Chagas, G. de F., Elgar, A. T., & Brancalion, P. H. S. (2016). Ecological outcomes and livelihood benefits of community-managed agroforests and second growth forests in Southeast Brazil. Biotropica, 48(6), 868–881. https://doi.org/10.1111/btp.12388
Delacote, P., Le Velly, G., & Simonet, G. (2022). Revisiting the location bias and additionality of REDD+ projects: The role of project proponents status and certification. Resource and Energy Economics, 67, 101277. https://doi.org/10.1016/j.reseneeco.2021.101277
Delacote, P., Velly, G. L., & Simonet, G. (2024). Distinguishing potential and effective additionality of forest conservation interventions. Environment and Development Economics, 1–21. https://doi.org/10.1017/S1355770X24000202
DellaSala, D. A., Mackey, B., Kormos, C. F., Young, V., Boan, J. J., Skene, J. L., Lindenmayer, D. B., Kun, Z., Selva, N., Malcolm, J. R., & Laurance, W. F. (2025). Measuring forest degradation via ecological-integrity indicators at multiple spatial scales. Biological Conservation, 302, 110939. https://doi.org/10.1016/j.biocon.2024.110939
Dhakal, S., J.C. Minx, F.L. Toth, A. Abdel-Aziz, M.J. Figueroa Meza, K. Hubacek, I.G.C. Jonckheere, Yong-Gun Kim, G.F. Nemet, S. Pachauri, X.C. Tan, T. Wiedmann, 2022: Emissions Trends and Drivers. In IPCC, 2022: Climate Change 2022: Mitigation of Climate Change. Contribution of Working Group III to the Sixth Assessment Report of the Intergovernmental Panel on Climate Change [P.R. Shukla, J. Skea, R. Slade, A. Al Khourdajie, R. van Diemen, D. McCollum, M. Pathak, S. Some, P. Vyas, R. Fradera, M. Belkacemi, A. Hasija, G. Lisboa, S. Luz, J. Malley, (eds.)]. Cambridge University Press, Cambridge, UK and New York, NY, USA. doi: 10.1017/9781009157926.004
Dinerstein, E., Joshi, A. R., Hahn, N. R., Lee, A. T. L., Vynne, C., Burkart, K., Asner, G. P., Beckham, C., Ceballos, G., Cuthbert, R., Dirzo, R., Fankem, O., Hertel, S., Li, B. V., Mellin, H., Pharand-Deschênes, F., Olson, D., Pandav, B., Peres, C. A., … Zolli, A. (2024). Conservation Imperatives: Securing the last unprotected terrestrial sites harboring irreplaceable biodiversity. Frontiers in Science, 2. https://doi.org/10.3389/fsci.2024.1349350
Dye, A. W., Houtman, R. M., Gao, P., Anderegg, W. R. L., Fettig, C. J., Hicke, J. A., Kim, J. B., Still, C. J., Young, K., & Riley, K. L. (2024). Carbon, climate, and natural disturbance: A review of mechanisms, challenges, and tools for understanding forest carbon stability in an uncertain future. Carbon Balance and Management, 19(1), 35. https://doi.org/10.1186/s13021-024-00282-0
Ellison, D., N. Futter, M., & Bishop, K. (2012). On the forest cover–water yield debate: From demand- to supply-side thinking. Global Change Biology, 18(3), 806–820. https://doi.org/10.1111/j.1365-2486.2011.02589.x
ESA CCI (2019). Copernicus Climate Change Service, Climate Data Store: Land cover classification gridded maps from 1992 to present derived from satellite observation. Copernicus Climate Change Service (C3S) Climate Data Store (CDS). Accessed November 2024. doi: 10.24381/cds.006f2c9a
Fa, J. E., Watson, J. E., Leiper, I., Potapov, P., Evans, T. D., Burgess, N. D., Molnár, Z., Fernández-Llamazares, Á., Duncan, T., Wang, S., Austin, B. J., Jonas, H., Robinson, C. J., Malmer, P., Zander, K. K., Jackson, M. V., Ellis, E., Brondizio, E. S., & Garnett, S. T. (2020). Importance of Indigenous Peoples’ lands for the conservation of Intact Forest Landscapes. Frontiers in Ecology and the Environment, 18(3), 135–140. https://doi.org/10.1002/fee.2148
FAO. 2024. The State of the World’s Forests 2024 – Forest-sector innovations towards a more sustainable future. Rome. https://doi.org/10.4060/cd1211en
Filoso, S., Bezerra, M. O., Weiss, K. C. B., & Palmer, M. A. (2017). Impacts of forest restoration on water yield: A systematic review. PLOS ONE, 12(8), e0183210. https://doi.org/10.1371/journal.pone.0183210
Fletcher, M.-S., Hamilton, R., Dressler, W., & Palmer, L. (2021). Indigenous knowledge and the shackles of wilderness. Proceedings of the National Academy of Sciences, 118(40), e2022218118. https://doi.org/10.1073/pnas.2022218118
Fuller, C., Ondei, S., Brook, B. W., & Buettel, J. C. (2020). Protected-area planning in the Brazilian Amazon should prioritize additionality and permanence, not leakage mitigation. Biological Conservation, 248, 108673. https://doi.org/10.1016/j.biocon.2020.108673
Gallemore, C., Bowsher, A., Atheeque, A., Groff, E., & Furtado, J. (n.d.). The geography of avoided deforestation and sustainable forest management offsets: The enduring question of additionality. Climate Policy, 0(0), 1–17. https://doi.org/10.1080/14693062.2024.2383418
Gallemore, C., Bowsher, A., Atheeque, A., Groff, E., & Furtado, J. (2023). The geography of avoided deforestation and sustainable forest management offsets: The enduring question of additionality. Climate Policy, 0(0), 1–17. https://doi.org/10.1080/14693062.2024.2383418
Garnett, S. T., Burgess, N. D., Fa, J. E., Fernández-Llamazares, Á., Molnár, Z., Robinson, C. J., Watson, J. E. M., Zander, K. K., Austin, B., Brondizio, E. S., Collier, N. F., Duncan, T., Ellis, E., Geyle, H., Jackson, M. V., Jonas, H., Malmer, P., McGowan, B., Sivongxay, A., & Leiper, I. (2018). A spatial overview of the global importance of Indigenous lands for conservation. Nature Sustainability, 1(7), 369–374. https://doi.org/10.1038/s41893-018-0100-6
Garrett, R. D., Levy, S., Carlson, K. M., Gardner, T. A., Godar, J., Clapp, J., Dauvergne, P., Heilmayr, R., le Polain de Waroux, Y., Ayre, B., Barr, R., Døvre, B., Gibbs, H. K., Hall, S., Lake, S., Milder, J. C., Rausch, L. L., Rivero, R., Rueda, X., … Villoria, N. (2019). Criteria for effective zero-deforestation commitments. Global Environmental Change, 54, 135–147. https://doi.org/10.1016/j.gloenvcha.2018.11.003
Gibbs, H. K., Ruesch, A. S., Achard, F., Clayton, M. K., Holmgren, P., Ramankutty, N., & Foley, J. A. (2010). Tropical forests were the primary sources of new agricultural land in the 1980s and 1990s. Proceedings of the National Academy of Sciences, 107(38), 16732–16737. https://doi.org/10.1073/pnas.0910275107
Golub, A., Herrera, D., Leslie, G., Pietracci, B., & Lubowski, R. (2021). A real options framework for reducing emissions from deforestation: Reconciling short-term incentives with long-term benefits from conservation and agricultural intensification. Ecosystem Services, 49, 101275. https://doi.org/10.1016/j.ecoser.2021.101275
Graham, V., Geldmann, J., Adams, V. M., Negret, P. J., Sinovas, P., & Chang, H.-C. (2021). Southeast Asian protected areas are effective in conserving forest cover and forest carbon stocks compared to unprotected areas. Scientific Reports, 11(1), 23760. https://doi.org/10.1038/s41598-021-03188-w
Grantham, H. S., Duncan, A., Evans, T. D., Jones, K. R., Beyer, H. L., Schuster, R., Walston, J., Ray, J. C., Robinson, J. G., Callow, M., Clements, T., Costa, H. M., DeGemmis, A., Elsen, P. R., Ervin, J., Franco, P., Goldman, E., Goetz, S., Hansen, A., … Watson, J. E. M. (2020). Anthropogenic modification of forests means only 40% of remaining forests have high ecosystem integrity. Nature Communications, 11(1), 5978. https://doi.org/10.1038/s41467-020-19493-3
Gray, C. L., Hill, S. L. L., Newbold, T., Hudson, L. N., Börger, L., Contu, S., Hoskins, A. J., Ferrier, S., Purvis, A., & Scharlemann, J. P. W. (2016). Local biodiversity is higher inside than outside terrestrial protected areas worldwide. Nature Communications, 7(1), 12306. https://doi.org/10.1038/ncomms12306
Griscom, B. W., Adams, J., Ellis, P. W., Houghton, R. A., Lomax, G., Miteva, D. A., Schlesinger, W. H., Shoch, D., Siikamäki, J. V., Smith, P., Woodbury, P., Zganjar, C., Blackman, A., Campari, J., Conant, R. T., Delgado, C., Elias, P., Gopalakrishna, T., Hamsik, M. R., … Fargione, J. (2017). Natural climate solutions. Proceedings of the National Academy of Sciences, 114(44), 11645–11650. https://doi.org/10.1073/pnas.1710465114
Hansen, M. C., Potapov, P. V., Moore, R., Hancher, M., Turubanova, S. A., Tyukavina, A., Thau, D., Stehman, S. V., Goetz, S. J., Loveland, T. R., Kommareddy, A., Egorov, A., Chini, L., Justice, C. O., & Townshend, J. R. G. (2013). High-Resolution Global Maps of 21st-Century Forest Cover Change. Science, 342(6160), 850–853. https://doi.org/10.1126/science.1244693. Data available on-line from: http://earthenginepartners.appspot.com/science-2013-global-forest. Accessed through Global Forest Watch on 01/12/2024. www.globalforestwatch.org
Harris, N. L., Gibbs, D. A., Baccini, A., Birdsey, R. A., de Bruin, S., Farina, M., Fatoyinbo, L., Hansen, M. C., Herold, M., Houghton, R. A., Potapov, P. V., Suarez, D. R., Roman-Cuesta, R. M., Saatchi, S. S., Slay, C. M., Turubanova, S. A., & Tyukavina, A. (2021). Global maps of twenty-first century forest carbon fluxes. Nature Climate Change, 11(3), 234–240. https://doi.org/10.1038/s41558-020-00976-6
Heilmayr, R., Rausch, L. L., Munger, J., & Gibbs, H. K. (2020). Brazil’s Amazon Soy Moratorium reduced deforestation. Nature Food, 1(12), 801–810. https://doi.org/10.1038/s43016-020-00194-5
Herrera, D., Ellis, A., Fisher, B., Golden, C. D., Johnson, K., Mulligan, M., Pfaff, A., Treuer, T., & Ricketts, T. H. (2017). Upstream watershed condition predicts rural children’s health across 35 developing countries. Nature Communications, 8(1), 811. https://doi.org/10.1038/s41467-017-00775-2
Herrera, D., Pfaff, A., & Robalino, J. (2019). Impacts of protected areas vary with the level of government: Comparing avoided deforestation across agencies in the Brazilian Amazon. Proceedings of the National Academy of Sciences, 116(30), 14916–14925. https://doi.org/10.1073/pnas.1802877116
Jones, K. R., Venter, O., Fuller, R. A., Allan, J. R., Maxwell, S. L., Negret, P. J., & Watson, J. E. M. (2018). One-third of global protected land is under intense human pressure. Science, 360(6390), 788–791. https://doi.org/10.1126/science.aap9565
Kolden, C. A., Abatzoglou, J. T., Jones, M. W., & Jain, P. (2024). Wildfires in 2023. Nature Reviews Earth & Environment, 5(4), 238–240. https://doi.org/10.1038/s43017-024-00544-y
Kreye, M. M., Adams, D. C., & Escobedo, F. J. (2014). The Value of Forest Conservation for Water Quality Protection. Forests, 5(5), Article 5. https://doi.org/10.3390/f5050862
Lambin, E. F., Gibbs, H. K., Heilmayr, R., Carlson, K. M., Fleck, L. C., Garrett, R. D., le Polain de Waroux, Y., McDermott, C. L., McLaughlin, D., Newton, P., Nolte, C., Pacheco, P., Rausch, L. L., Streck, C., Thorlakson, T., & Walker, N. F. (2018). The role of supply-chain initiatives in reducing deforestation. Nature Climate Change, 8(2), 109–116. https://doi.org/10.1038/s41558-017-0061-1
Lawrence, D., Coe, M., Walker, W., Verchot, L., & Vandecar, K. (2022). The unseen effects of deforestation: biophysical effects on climate. Frontiers in Forests and Global Change, 5. https://doi.org/10.3389/ffgc.2022.756115
Levy, S. A., Cammelli, F., Munger, J., Gibbs, H. K., & Garrett, R. D. (2023). Deforestation in the Brazilian Amazon could be halved by scaling up the implementation of zero-deforestation cattle commitments. Global Environmental Change, 80, 102671. https://doi.org/10.1016/j.gloenvcha.2023.102671
Li, G., Fang, C., Watson, J. E. M., Sun, S., Qi, W., Wang, Z., & Liu, J. (2024). Mixed effectiveness of global protected areas in resisting habitat loss. Nature Communications, 15(1), 8389. https://doi.org/10.1038/s41467-024-52693-9
Lindenmayer, D. (2024). Key steps toward expanding protected areas to conserve global biodiversity. Frontiers in Science, 2. https://doi.org/10.3389/fsci.2024.1426480
Lutz, J. A., Furniss, T. J., Johnson, D. J., Davies, S. J., Allen, D., Alonso, A., Anderson-Teixeira, K. J., Andrade, A., Baltzer, J., Becker, K. M. L., Blomdahl, E. M., Bourg, N. A., Bunyavejchewin, S., Burslem, D. F. R. P., Cansler, C. A., Cao, K., Cao, M., Cárdenas, D., Chang, L.-W., … Zimmerman, J. K. (2018). Global importance of large-diameter trees. Global Ecology and Biogeography, 27(7), 849–864. https://doi.org/10.1111/geb.12747
Macdonald, K., Diprose, R., Grabs, J., Schleifer, P., Alger, J., Bahruddin, Brandao, J., Cashore, B., Chandra, A., Cisneros, P., Delgado, D., Garrett, R., & Hopkinson, W. (2024). Jurisdictional approaches to sustainable agro-commodity governance: The state of knowledge and future research directions. Earth System Governance, 22, 100227. https://doi.org/10.1016/j.esg.2024.100227
McCallister, M., Krasovskiy, A., Platov, A., Pietracci, B., Golub, A., Lubowski, R., & Leslie, G. (2022). Forest protection and permanence of reduced emissions. Frontiers in Forests and Global Change, 5. https://doi.org/10.3389/ffgc.2022.928518
Marin, F. R., Zanon, A. J., Monzon, J. P., Andrade, J. F., Silva, E. H. F. M., Richter, G. L., Antolin, L. A. S., Ribeiro, B. S. M. R., Ribas, G. G., Battisti, R., Heinemann, A. B., & Grassini, P. (2022). Protecting the Amazon forest and reducing global warming via agricultural intensification. Nature Sustainability, 5(12), 1018–1026. https://doi.org/10.1038/s41893-022-00968-8
McNicol, I. M., Keane, A., Burgess, N. D., Bowers, S. J., Mitchard, E. T. A., & Ryan, C. M. (2023). Protected areas reduce deforestation and degradation and enhance woody growth across African woodlands. Communications Earth & Environment, 4(1), 1–14. https://doi.org/10.1038/s43247-023-01053-4
Melo, F. P. L., Parry, L., Brancalion, P. H. S., Pinto, S. R. R., Freitas, J., Manhães, A. P., Meli, P., Ganade, G., & Chazdon, R. L. (2021). Adding forests to the water–energy–food nexus. Nature Sustainability, 4(2), 85–92. https://doi.org/10.1038/s41893-020-00608-z
Meng, Z., Dong, J., Ellis, E. C., Metternicht, G., Qin, Y., Song, X.-P., Löfqvist, S., Garrett, R. D., Jia, X., & Xiao, X. (2023). Post-2020 biodiversity framework challenged by cropland expansion in protected areas. Nature Sustainability, 6(7), 758–768. https://doi.org/10.1038/s41893-023-01093-w
Morales-Hidalgo, D., Oswalt, S. N., & Somanathan, E. (2015). Status and trends in global primary forest, protected areas, and areas designated for conservation of biodiversity from the Global Forest Resources Assessment 2015. Forest Ecology and Management, 352, 68–77. https://doi.org/10.1016/j.foreco.2015.06.011
Mykleby, P. M., Snyder, P. K., & Twine, T. E. (2017). Quantifying the trade-off between carbon sequestration and albedo in midlatitude and high-latitude North American forests. Geophysical Research Letters, 44(5), 2493–2501. https://doi.org/10.1002/2016GL071459
Nabuurs, G-J., R. Mrabet, A. Abu Hatab, M. Bustamante, H. Clark, P. Havlík, J. House, C. Mbow, K.N. Ninan, A. Popp, S. Roe, B. Sohngen, S. Towprayoon, 2022: Agriculture, Forestry and Other Land Uses (AFOLU). In IPCC, 2022: Climate Change 2022: Mitigation of Climate Change. Contribution of Working Group III to the Sixth Assessment Report of the Intergovernmental Panel on Climate Change [P.R. Shukla, J. Skea, R. Slade, A. Al Khourdajie, R. van Diemen, D. McCollum, M. Pathak, S. Some, P. Vyas, R. Fradera, M. Belkacemi, A. Hasija, G. Lisboa, S. Luz, J. Malley, (eds.)]. Cambridge University Press, Cambridge, UK and New York, NY, USA. doi: 10.1017/9781009157926.009
Naidoo, R., Gerkey, D., Hole, D., Pfaff, A., Ellis, A. M., Golden, C. D., Herrera, D., Johnson, K., Mulligan, M., Ricketts, T. H., & Fisher, B. (2019). Evaluating the impacts of protected areas on human well-being across the developing world. Science Advances, 5(4), eaav3006. https://doi.org/10.1126/sciadv.aav3006
Oldekop, J. A., Rasmussen, L. V., Agrawal, A., Bebbington, A. J., Meyfroidt, P., Bengston, D. N., Blackman, A., Brooks, S., Davidson-Hunt, I., Davies, P., Dinsi, S. C., Fontana, L. B., Gumucio, T., Kumar, C., Kumar, K., Moran, D., Mwampamba, T. H., Nasi, R., Nilsson, M., … Wilson, S. J. (2020). Forest-linked livelihoods in a globalized world. Nature Plants, 6(12), 1400–1407. https://doi.org/10.1038/s41477-020-00814-9
Pan, Y., Birdsey, R. A., Phillips, O. L., Houghton, R. A., Fang, J., Kauppi, P. E., Keith, H., Kurz, W. A., Ito, A., Lewis, S. L., Nabuurs, G.-J., Shvidenko, A., Hashimoto, S., Lerink, B., Schepaschenko, D., Castanho, A., & Murdiyarso, D. (2024). The enduring world forest carbon sink. Nature, 631(8021), 563–569. https://doi.org/10.1038/s41586-024-07602-x
Phillips, C. A., Rogers, B. M., Elder, M., Cooperdock, S., Moubarak, M., Randerson, J. T., & Frumhoff, P. C. (2022). Escalating carbon emissions from North American boreal forest wildfires and the climate mitigation potential of fire management. Science Advances, 8(17), eabl7161. https://doi.org/10.1126/sciadv.abl7161
Reddington, C. L., Butt, E. W., Ridley, D. A., Artaxo, P., Morgan, W. T., Coe, H., & Spracklen, D. V. (2015). Air quality and human health improvements from reductions in deforestation-related fire in Brazil. Nature Geoscience, 8(10), 768–771. https://doi.org/10.1038/ngeo2535
Richter, J., Goldman, E., Harris, N., Gibbs, D., Rose, M., Peyer, S., Richardson, S., & Velappan, H. (2024). Spatial Database of Planted Trees (SDPT Version 2.0) [Dataset]. https://doi.org/10.46830/writn.23.00073
Rogers, B. M., Mackey, B., Shestakova, T. A., Keith, H., Young, V., Kormos, C. F., DellaSala, D. A., Dean, J., Birdsey, R., Bush, G., Houghton, R. A., & Moomaw, W. R. (2022). Using ecosystem integrity to maximize climate mitigation and minimize risk in international forest policy. Frontiers in Forests and Global Change, 5. https://doi.org/10.3389/ffgc.2022.929281
Ruseva, T., Marland, E., Szymanski, C., Hoyle, J., Marland, G., & Kowalczyk, T. (2017). Additionality and permanence standards in California’s Forest Offset Protocol: A review of project and program level implications. Journal of Environmental Management, 198, 277–288. https://doi.org/10.1016/j.jenvman.2017.04.082
Sarira, T. V., Zeng, Y., Neugarten, R., Chaplin-Kramer, R., & Koh, L. P. (2022). Co-benefits of forest carbon projects in Southeast Asia. Nature Sustainability, 5(5), 393–396. https://doi.org/10.1038/s41893-022-00849-0
Seymour, F., Wolosin, M., & Gray, E. (2022, October 23). Policies underestimate forests’ full effect on the climate. World Resources Institute. https://www.wri.org/insights/how-forests-affect-climate
Smith, C., Baker, J. C. A., & Spracklen, D. V. (2023). Tropical deforestation causes large reductions in observed precipitation. Nature, 615(7951), 270–275. https://doi.org/10.1038/s41586-022-05690-1
Soto-Navarro, C., Ravilious, C., Arnell, A., de Lamo, X., Harfoot, M., Hill, S. L. L., Wearn, O. R., Santoro, M., Bouvet, A., Mermoz, S., Le Toan, T., Xia, J., Liu, S., Yuan, W., Spawn, S. A., Gibbs, H. K., Ferrier, S., Harwood, T., Alkemade, R., … Kapos, V. (2020). Mapping co-benefits for carbon storage and biodiversity to inform conservation policy and action. Philosophical Transactions of the Royal Society B: Biological Sciences, 375(1794), 20190128. https://doi.org/10.1098/rstb.2019.0128
Sunderlin, W. D., Angelsen, A., Belcher, B., Burgers, P., Nasi, R., Santoso, L., & Wunder, S. (2005). Livelihoods, forests, and conservation in developing countries: An Overview. World Development, 33(9), 1383–1402. https://doi.org/10.1016/j.worlddev.2004.10.004
Sweeney, B. W., Bott, T. L., Jackson, J. K., Kaplan, L. A., Newbold, J. D., Standley, L. J., Hession, W. C., & Horwitz, R. J. (2004). Riparian deforestation, stream narrowing, and loss of stream ecosystem services. Proceedings of the National Academy of Sciences, 101(39), 14132–14137. https://doi.org/10.1073/pnas.0405895101
Sze, J. S., Carrasco, L. R., Childs, D., & Edwards, D. P. (2022). Reduced deforestation and degradation in Indigenous Lands pan-tropically. Nature Sustainability, 5(2), 123–130. https://doi.org/10.1038/s41893-021-00815-2
Tauli-Corpuz, V., Alcorn, J., Molnar, A., Healy, C., & Barrow, E. (2020). Cornered by PAs: Adopting rights-based approaches to enable cost-effective conservation and climate action. World Development, 130, 104923. https://doi.org/10.1016/j.worlddev.2020.104923
Tran, T. C., Ban, N. C., & Bhattacharyya, J. (2020). A review of successes, challenges, and lessons from Indigenous protected and conserved areas. Biological Conservation, 241, 108271. https://doi.org/10.1016/j.biocon.2019.108271
UNEP-WCMC and IUCN (2024), Protected Planet: The World Database on Protected Areas (WDPA) and World Database on Other Effective Area-based Conservation Measures (WD-OECM) [Online], Accessed November 2024, Cambridge, UK: UNEP-WCMC and IUCN. Available at: www.protectedplanet.net.
Vijay, V., Fisher, J. R. B., & Armsworth, P. R. (2022). Co-benefits for terrestrial biodiversity and ecosystem services available from contrasting land protection policies in the contiguous United States. Conservation Letters, 15(5), e12907. https://doi.org/10.1111/conl.12907
Villoria, N., Garrett, R., Gollnow, F., & Carlson, K. (2022). Leakage does not fully offset soy supply-chain efforts to reduce deforestation in Brazil. Nature Communications, 13(1), 5476. https://doi.org/10.1038/s41467-022-33213-z
Visconti, P., Butchart, S. H. M., Brooks, T. M., Langhammer, P. F., Marnewick, D., Vergara, S., Yanosky, A., & Watson, J. E. M. (2019). Protected area targets post-2020. Science, 364(6437), 239–241. https://doi.org/10.1126/science.aav6886
Wade, C. M., Austin, K. G., Cajka, J., Lapidus, D., Everett, K. H., Galperin, D., Maynard, R., & Sobel, A. (2020). What Is Threatening Forests in Protected Areas? A Global Assessment of Deforestation in Protected Areas, 2001–2018. Forests, 11(5), Article 5. https://doi.org/10.3390/f11050539
Waldron, A., Adams, V., Allan, J., Arnell, A., Asner, G., Atkinson, S., Baccini, A., Baillie, J., Balmford, A., & Austin Beau, J. (2020). Protecting 30% of the planet for nature: Costs, benefits and economic implications. https://pure.iiasa.ac.at/id/eprint/16560/1/Waldron_Report_FINAL_sml.pdf
Walton, Z. L., Poudyal, N. C., Hepinstall-Cymerman, J., Johnson Gaither, C., & Boley, B. B. (2016). Exploring the role of forest resources in reducing community vulnerability to the heat effects of climate change. Forest Policy and Economics, 71, 94–102. https://doi.org/10.1016/j.forpol.2015.09.001
Watson, J. E. M., Dudley, N., Segan, D. B., & Hockings, M. (2014). The performance and potential of protected areas. Nature, 515(7525), 67–73. https://doi.org/10.1038/nature13947
West, T. A. P., Wunder, S., Sills, E. O., Börner, J., Rifai, S. W., Neidermeier, A. N., Frey, G. P., & Kontoleon, A. (2023). Action needed to make carbon offsets from forest conservation work for climate change mitigation. Science, 381(6660), 873–877. https://doi.org/10.1126/science.ade3535
Wolf, C., Levi, T., Ripple, W. J., Zárrate-Charry, D. A., & Betts, M. G. (2021). A forest loss report card for the world’s protected areas. Nature Ecology & Evolution, 5(4), 520–529. https://doi.org/10.1038/s41559-021-01389-0
Zafra-Calvo, N., Pascual, U., Brockington, D., Coolsaet, B., Cortes-Vazquez, J. A., Gross-Camp, N., Palomo, I., & Burgess, N. D. (2017). Towards an indicator system to assess equitable management in protected areas. Biological Conservation, 211, 134–141. https://doi.org/10.1016/j.biocon.2017.05.014
Credits
Lead Fellow
Avery Driscoll, Ph.D.
Contributors
Ruthie Burrows, Ph.D.
James Gerber, Ph.D.
Yusuf Jameel, Ph.D.
Daniel Jasper
Alex Sweeney
Internal Reviewers
Hannah Henkin
Ted Otte
Tina Swanson, Ph.D.
Paul West, Ph.D.
Effectiveness
We estimated that one hectare of forest protection provides total carbon benefits of 0.299–2.204 t CO₂‑eq/yr depending on the biome (Table 1; Appendix). This effectiveness estimate includes avoided emissions and preserved sequestration capacity attributable to the reduction in forest loss conferred by protection (Equation 1). First, we calculated the difference between the rate of human-caused forest loss outside of PAs (Forest lossbaseline) and the rate inside of PAs (Forest lossprotected). We then multiplied the annual rate of avoided forest loss by the sum of the carbon stored in one hectare of forest (Carbonstock) and the amount of carbon that one hectare of intact forest takes up over a 30-yr timeframe (Carbonsequestration).
Equation 1.
Effectiveness= (Forest lossbaseline- Forest lossprotected)* (Carbonstock + Carbonsequestration)
Each of these factors varies across biomes. Based on our definition, for instance, the effectiveness of forest protection in boreal forests is lower than that in tropical and subtropical forests primarily because the former face lower rates of human-caused forest loss (though greater wildfire impacts). Importantly, the effectiveness of forest protection as defined here reflects only a small percentage of the carbon stored (394 t CO₂‑eq ) and absorbed (4.25 t CO₂‑eq/yr ) per hectare of forest (Harris et al., 2021). This is because humans clear ~0.4% of forest area annually, and forest protection is estimated to reduce human-caused forest loss by an average of 40.5% (Curtis et al., 2018; Wolf et al., 2023).
left_text_column_width
Table 1. Effectiveness at avoiding emissions and sequestering carbon (t CO₂‑eq /ha/yr, 100-yr basis), with carbon sequestration calculated over a 30-yr timeframe. Differences in values between biomes are driven by variation in forest carbon stocks and sequestration rates, baseline rates of forest loss, and effectiveness of PAs at reducing forest loss. See the Appendix for source data and calculation details. Emissions and sequestration values may not sum to total effectiveness due to rounding.
Unit: t CO₂‑eq/ha/yr
| Avoided emissions | 0.207 |
| Sequestration | 0.091 |
| Total effectiveness | 0.299 |
Unit: t CO₂‑eq/ha/yr
| Avoided emissions | 0.832 |
| Sequestration | 0.572 |
| Total effectiveness | 1.403 |
Unit: t CO₂‑eq/ha/yr
| Avoided emissions | 1.860 |
| Sequestration | 0.344 |
| Total effectiveness | 2.204 |
Unit: t CO₂‑eq/ha/yr
| Avoided emissions | 1.190 |
| Sequestration | 0.300 |
| Total effectiveness | 1.489 |
Left Text Column Width
Cost
We estimated that forest protection costs approximately US$2/t CO₂‑eq (Table 2). Data related to the costs of forest protection are limited, and these estimates are uncertain. The costs of forest protection include up-front costs of land acquisition and ongoing costs of management and enforcement. The market price of land reflects the opportunity cost of not using the land for other purposes (e.g., agriculture or logging). Protecting forests also generates revenue, notably through increased tourism. Costs and revenues vary across regions, depending on the costs of land and enforcement and potential for tourism.
The cost of land acquisition for ecosystem protection was estimated by Dienerstein et al. (2024), who found a median cost of US$988/ha (range: US$59–6,616/ha), which we amortized over 30 years. Costs of PA maintenance were estimated at US$9–17/ha/yr (Bruner et al., 2004; Waldron et al., 2020). These estimates reflect the costs of effective enforcement and management, but many existing PAs do not have adequate funds for effective enforcement (Adams et al., 2019; Barnes et al., 2018; Burner et al., 2004). Tourism revenues directly attributable to forest protection were estimated to be US$43/ha/yr (Waldron et al., 2020), not including downstream revenues from industries that benefit from increased tourism. Inclusion of a tourism multiplier would substantially increase the estimated economic benefits of forest protection.
left_text_column_width
Table 2. Cost per unit of climate impact.
Unit: 2023 US$/t CO₂‑eq, 100-yr basis
| median | 2 |
Left Text Column Width
Methods and Supporting Data
Crezee, B. et al. Mapping peat thickness and carbon stocks of the central Congo Basin using field data. Nature Geoscience 15: 639-644 (2022). https://www.nature.com/articles/s41561-022-00966-7. Data downloaded from https://congopeat.net/maps/, using classes 4 and 5 only (peat classes).
Curtis, P. G., Slay, C. M., Harris, N. L., Tyukavina, A., & Hansen, M. C. (2018). Classifying drivers of global forest loss. Science, 361(6407), 1108–1111. https://doi.org/10.1126/science.aau3445
ESA CCI (2019). Copernicus Climate Change Service, Climate Data Store: Land cover classification gridded maps from 1992 to present derived from satellite observation. Copernicus Climate Change Service (C3S) Climate Data Store (CDS). Accessed November 2024. doi: 10.24381/cds.006f2c9a
Garnett, S. T., Burgess, N. D., Fa, J. E., Fernández-Llamazares, Á., Molnár, Z., Robinson, C. J., Watson, J. E. M., Zander, K. K., Austin, B., Brondizio, E. S., Collier, N. F., Duncan, T., Ellis, E., Geyle, H., Jackson, M. V., Jonas, H., Malmer, P., McGowan, B., Sivongxay, A., & Leiper, I. (2018). A spatial overview of the global importance of Indigenous lands for conservation. Nature Sustainability, 1(7), 369–374. https://doi.org/10.1038/s41893-018-0100-6
Giri C, Ochieng E, Tieszen LL, Zhu Z, Singh A, Loveland T, Masek J, Duke N (2011). Status and distribution of mangrove forests of the world using earth observation satellite data (version 1.3, updated by UNEP-WCMC). Global Ecology and Biogeography 20: 154-159. doi: 10.1111/j.1466-8238.2010.00584.x . Data URL: http://data.unep-wcmc.org/datasets/4
Gumbricht, T. et al. An expert system model for mapping tropical wetlands and peatlands reveals South America as the largest contributor. Global Change Biology 23, 3581–3599 (2017). https://onlinelibrary.wiley.com/doi/full/10.1111/gcb.13689
Hansen, M. C., Potapov, P. V., Moore, R., Hancher, M., Turubanova, S. A., Tyukavina, A., Thau, D., Stehman, S. V., Goetz, S. J., Loveland, T. R., Kommareddy, A., Egorov, A., Chini, L., Justice, C. O., & Townshend, J. R. G. (2013). High-Resolution Global Maps of 21st-Century Forest Cover Change. Science, 342(6160), 850–853. https://doi.org/10.1126/science.1244693. Data available on-line from: http://earthenginepartners.appspot.com/science-2013-global-forest. Accessed through Global Forest Watch on 01/12/2024. www.globalforestwatch.org
Harris, N. L., Gibbs, D. A., Baccini, A., Birdsey, R. A., de Bruin, S., Farina, M., Fatoyinbo, L., Hansen, M. C., Herold, M., Houghton, R. A., Potapov, P. V., Suarez, D. R., Roman-Cuesta, R. M., Saatchi, S. S., Slay, C. M., Turubanova, S. A., & Tyukavina, A. (2021). Global maps of twenty-first century forest carbon fluxes. Nature Climate Change, 11(3), 234–240. https://doi.org/10.1038/s41558-020-00976-6
Hastie, A. et al. Risks to carbon storage from land-use change revealed by peat thickness maps of Peru. Nature Geoscience 15: 369-374 (2022). https://www.nature.com/articles/s41561-022-00923-4
Miettinen, J., Shi, C. & Liew, S. C. Land cover distribution in the peatlands of Peninsular Malaysia, Sumatra and Borneo in 2015 with changes since 1990. Global Ecological Conservation. 6, 67– 78 (2016). https://www.sciencedirect.com/science/article/pii/S2351989415300470
UNEP-WCMC and IUCN (2024), Protected Planet: The World Database on Protected Areas (WDPA) and World Database on Other Effective Area-based Conservation Measures (WD-OECM) [Online], Accessed November 2024, Cambridge, UK: UNEP-WCMC and IUCN. Available at: www.protectedplanet.net.
Wolf, C., Levi, T., Ripple, W. J., Zárrate-Charry, D. A., & Betts, M. G. (2021). A forest loss report card for the world’s protected areas. Nature Ecology & Evolution, 5(4), 520–529. https://doi.org/10.1038/s41559-021-01389-0
Xu et al. PEATMAP: Refining estimates of global peatland distribution based on a meta-analysis. CATENA 160: 134-140 (2018). https://www.sciencedirect.com/science/article/pii/S0341816217303004
Learning Curve
A learning curve is defined here as falling costs with increased adoption. The costs of forest protection do not fall with increasing adoption, so there is no learning curve for this solution.
left_text_column_width
Speed of Action
Speed of action refers to how quickly a climate solution physically affects the atmosphere after it is deployed. This is different from speed of deployment, which is the pace at which solutions are adopted.
At Project Drawdown, we define the speed of action for each climate solution as gradual, emergency brake, or delayed.
Protect Forests is an EMERGENCY BRAKE climate solution. It has the potential to deliver a more rapid impact than nominal and delayed solutions. Because emergency brake solutions can deliver their climate benefits quickly, they can help accelerate our efforts to address dangerous levels of climate change. For this reason, they are a high priority.
left_text_column_width
Caveats
Additionality, or the degree to which emissions reductions are above and beyond a baseline, is a key caveat for emissions avoided through forest protection (e.g., Fuller et al., 2020; Ruseva et al., 2017). Emissions avoided via forest protection are only considered additional if that forest would have been cleared or degraded without protection (Delacote et al., 2022; Delacote et al., 2024; Gallemore et al., 2020). In this analysis, additionality is addressed by using baseline rates of forest loss outside of PAs in the effectiveness calculation. Additionality is particularly important when forest protection is used to generate carbon offsets. However, the likelihood of forest removal in the absence of protection is often difficult to determine at the local level.
Permanence, or the durability of stored carbon over long timescales, is another important consideration not directly addressed in this solution. Carbon stored in forests can be compromised by natural factors, like drought, heat, flooding, wildfire, pests, and diseases, which are further exacerbated by climate change (Anderegg et al., 2020; Dye et al., 2024). Forest losses via wildfire in particular can create very large pulses of emissions (e.g., Kolden et al. 2024; Phillips et al. 2022) that negate accumulated carbon benefits of forest protection. Reversal of legal protections, illegal forest clearing, biodiversity loss, edge effects from roads, and disturbance from permitted uses can also cause forest losses directly or reduce ecosystem integrity, further increasing vulnerability to other stressors (McCallister et al., 2022).
left_text_column_width
Current Adoption
We estimated that approximately 1,673 Mha of forests are currently recognized as PAs or Indigenous peoples’ lands (Table 3; Garnett et al., 2018; UNEP-WCMC and IUCN, 2024). Using two different maps of global forests that differ in their methodologies and definitions (ESA CCI, 2019; Hansen et al., 2013), we found an upper-end estimate of 1,943 Mha protected and a lower-end estimate of 1,404 Mha protected. These two maps classify forests using different thresholds for canopy cover and vegetation height, different satellite data, and different classification algorithms (see the Appendix for additional details).
Based on our calculations, tropical forests make up the majority of forested PAs, with approximately 936 Mha under protection, followed by boreal forests (467 Mha), temperate forests (159 Mha), and subtropical forests (112 Mha). We estimate that 49% of all forests have some legal protection, though only 7% of forests are under strict protection (IUCN class I or II), with the remaining area protected under other IUCN levels, as OECMs, or as Indigenous peoples’ lands.
left_text_column_width
Table 3. Current (circa 2023) forest and woodland area under legal protection by biome (Mha). The low and high values are calculated using two different maps of global forest cover that differ in methodology for defining a forest (ESA CCI, 2019; Hansen et al., 2013). Biome-level values may not sum to global totals due to rounding.
Unit: Mha
| low | 313 |
| mean | 467 |
| high | 621 |
Unit: Mha
| low | 135 |
| mean | 159 |
| high | 183 |
Unit: Mha
| low | 85 |
| mean | 112 |
| high | 138 |
Unit: Mha
| low | 872 |
| mean | 936 |
| high | 1,000 |
Unit: Mha
| low | 1,404 |
| mean | 1,673 |
| high | 1,943 |
Left Text Column Width
Adoption Trend
We calculated the rate of PA expansion based on the year the PA was established. We do not have data on the expansion rate of Indigenous peoples’ lands, so the calculated adoption trend reflects only PAs. An average of 19 Mha of additional forests were protected each year between 2000 and 2020 (Table 4; Figure 1), representing a roughly 2% increase in PAs per year (excluding Indigenous peoples’ lands that are not located in PAs). There were large year-to-year differences in how much new forest area was protected over this period, ranging from only 6.4 Mha in 2020 to over 38 Mha in both 2000 and 2006. Generally, the rate at which forest protection is increasing has been decreasing, with an average increase of 27 Mha/yr between 2000–2010 declining to 11 Mha/yr between 2010–2020. Recent rates of forest protection (2010–2020) are highest in the tropics (5.6 Mha/yr), followed by temperate regions (2.4 Mha/yr) and the boreal (2.0 Mha/yr), and lowest in the subtropics (0.7 Mha/yr).
left_text_column_width
Figure 1. Trend in forest protection by climate zone. These values reflect only the area located within PAs; Indigenous peoples’ lands, which were not included in the calculation of the adoption trend, are excluded.
Enable Download
On
Table 4. 2000–2020 adoption trend.
Unit: Mha protected/yr
| 25th percentile | 1.3 |
| mean | 2.8 |
| median (50th percentile) | 2.0 |
| 75th percentile | 3.4 |
Unit: Mha protected/yr
| 25th percentile | 1.9 |
| mean | 2.8 |
| median (50th percentile) | 2.5 |
| 75th percentile | 3.1 |
Unit: Mha protected/yr
| 25th percentile | 0.5 |
| mean | 1.0 |
| median (50th percentile) | 0.7 |
| 75th percentile | 1.1 |
Unit: Mha protected/yr
| 25th percentile | 5.4 |
| mean | 12.5 |
| median (50th percentile) | 7.7 |
| 75th percentile | 17.8 |
Unit: Mha protected/yr
| 25th percentile | 9 |
| mean | 19 |
| median (50th percentile) | 13 |
| 75th percentile | 25 |
Left Text Column Width
Adoption Ceiling
We estimated an adoption ceiling of 3,370 Mha of forests globally (Table 5), defined as all existing forest areas, excluding peatlands and mangroves. Of the calculated adoption ceiling, 469 Mha of boreal forests, 282 Mha of temperate forests, 211 Mha of subtropical forests, and 734 Mha of tropical forests are currently unprotected. The high and low values represent estimates of currently forested areas from two different maps of forest cover that use different methodologies and definitions (ESA CCI, 2019; Hansen et al., 2013). While it is not socially, politically, or economically realistic that all existing forests could be protected, these values represent the technical upper limit to adoption of this solution. Additionally, some PAs allow for ongoing sustainable use of resources, enabling some demand for wood products to be met via sustainable use of trees in PAs.
left_text_column_width
Table 5. Adoption ceiling.
Unit: Mha protected
| low | 686 |
| mean | 936 |
| high | 1,186 |
Unit: Mha protected
| low | 385 |
| mean | 441 |
| high | 498 |
Unit: Mha protected
| low | 260 |
| mean | 323 |
| high | 385 |
Unit: Mha protected
| low | 1,557 |
| mean | 1,669 |
| high | 1,782 |
Unit: Mha protected
| low | 2,889 |
| mean | 3,370 |
| high | 3,851 |
Left Text Column Width
Achievable Adoption
We defined the lower end of the achievable range for forest protection as all high integrity forests in addition to forests in existing PAs and Indigenous peoples’ lands, totaling 2,297 Mha. We estimated that there are 624 Mha of unprotected high integrity forests, based on maps of forest integrity developed by Grantham et al. (2020). High integrity forests have experienced little disturbance from human pressures (i.e., logging, agriculture, and buildings), are located further away from areas of human disturbance, and are well-connected to other forests. High integrity forests are a top priority for protection as they have particularly high value with respect to biodiversity and ecosystem service provisioning. These forests are also not currently being used to meet human demand for land or forest-derived products, and thus their protection may be more feasible.
To estimate the upper end of the achievable range, we excluded the global areas of planted trees and tree crops from the adoption ceiling (Richter et al., 2024), comprising approximately 335 Mha globally (Table 6). Planted trees include tree stands established for crops such as oil palm, products such as timber and fiber production, and those established as windbreaks or for ecosystem services such as erosion control. These stands are often actively managed and are unlikely to be protected.
left_text_column_width
Table 6. Range of achievable adoption levels.
Unit: Mha protected
| Current Adoption | 467 |
| Achievable – Low | 847 |
| Achievable – High | 861 |
| Adoption ceiling | 936 |
Unit: Mha protected
| Current Adoption | 159 |
| Achievable – Low | 204 |
| Achievable – High | 378 |
| Adoption ceiling | 441 |
Unit: Mha protected
| Current Adoption | 112 |
| Achievable – Low | 126 |
| Achievable – High | 219 |
| Adoption ceiling | 323 |
Unit: Mha protected
| Current Adoption | 936 |
| Achievable – Low | 1,120 |
| Achievable – High | 1,577 |
| Adoption ceiling | 1,669 |
Unit: Mha protected
| Current Adoption | 1,673 |
| Achievable – Low | 2,297 |
| Achievable – High | 3,035 |
| Adoption ceiling | 3,370 |
Left Text Column Width
We estimated that forest protection currently avoids approximately 2.00 Gt CO₂‑eq/yr, with potential impacts of 2.49 Gt CO₂‑eq/yr at the low-achievable scenario, 3.62 Gt CO₂‑eq/yr at the high-achievable scenario, and 4.10 Gt CO₂‑eq/yr at the adoption ceiling (Table 7). Although not directly comparable due to the inclusion of different land covers, these values are aligned with Griscom et al. (2017) estimates that forest protection could avoid 3.6 Gt CO₂‑eq/yr and the IPCC estimate that protection of all ecosystems could avoid 6.2 Gt CO₂‑eq/yr (Nabuurs et al., 2022).
Note that the four adoption scenarios vary only with respect to the area under protection. Increases in either the rate of forest loss that would have occurred if the area had not been protected or in the effectiveness of PAs at avoiding forest loss would substantially increase the climate impacts of forest protection. For instance, a hypothetical 50% increase in the rate of forest loss outside of PAs would increase the carbon impacts of the current adoption, low achievable, high achievable, and adoption ceiling scenarios to 3.0, 3.7, 5.4, and 6.1 Gt CO₂‑eq/yr, respectively. Similarly, if legal forest protection reduced forest loss twice as much as it currently does, the climate impacts of the four scenarios would increase to 3.9, 4.8, 7.0, and 7.8 Gt CO₂‑eq/yr, respectively.
left_text_column_width
Table 7. Climate impact at different levels of adoption.
Unit: Gt CO₂‑eq/yr, 100-yr basis
| Boreal | 0.14 |
| Achievable – Low | 0.25 |
| Achievable – High | 0.26 |
| Adoption ceiling | 0.28 |
Unit: Gt CO₂‑eq/yr, 100-yr basis
| Current Adoption | 0.22 |
| Achievable – Low | 0.29 |
| Achievable – High | 0.53 |
| Adoption ceiling | 0.62 |
Unit: Gt CO₂‑eq/yr, 100-yr basis
| Current Adoption | 0.25 |
| Achievable – Low | 0.28 |
| Achievable – High | 0.48 |
| Adoption ceiling | 0.71 |
Unit: Gt CO₂‑eq/yr, 100-yr basis
| Current Adoption | 1.39 |
| Achievable – Low | 1.67 |
| Achievable – High | 2.35 |
| Adoption ceiling | 2.49 |
Unit: Gt CO₂‑eq/yr, 100-yr basis
| Current Adoption | 2.00 |
| Achievable – Low | 2.49 |
| Achievable – High | 3.62 |
| Adoption ceiling | 4.10 |
Left Text Column Width
Additional Benefits
Water quality
Forests act as a natural water filter and can maintain and improve water quality (Melo et al., 2021). Forests can also retain nutrients from polluting the larger watershed (Sweeney et al., 2004). For example, forests can uptake excess nutrients like nitrogen, reducing their flow into surrounding water (Sarira et al., 2022). These excessive nutrients can cause eutrophication and algal blooms that negatively impact water quality and aquatic life.
Biodiversity
Forests are home to a wide range of species and habitats and are essential for safeguarding biodiversity. Forests have high above- and belowground carbon density, high tree species richness, and often provide habitat to threatened and endangered species (Buotte et al., 2020). PAs can aid in avoiding extinctions by protecting rare and threatened species (Dinerstein et al. 2024). In Southeast Asia, protecting 58% of threatened forests could safeguard about half of the key biodiversity areas in the region (Sarira et al., 2022).
Resilience to extreme weather events
Protected forests are more biodiverse and therefore more resilient and adaptable, providing higher-quality ecosystem services to surrounding communities (Gray et al., 2016). Protected forests can also buffer surrounding areas from the effects of extreme weather events. By increasing plant species richness, forest preservation can contribute to drought and fire tolerance (Buotte et al., 2020). Forests help regulate local climate by reducing temperature extremes (Lawrence et al., 2022). Studies have shown that the extent of forest coverage helps to alleviate vulnerability associated with heat effects (Walton et al., 2016). Tropical deforestation threatens human well-being by removing critical local cooling effects provided by tropical forests, exacerbating extreme heat conditions in already vulnerable regions (Seymour et al., 2022).
Food security
Protecting forests in predominantly natural areas can improve food security by supporting crop pollination of nearby agriculture. Sarira et al. (2022) found that protecting 58% of threatened forests in Southeast Asia could support the dietary needs of about 305,000–342,000 people annually. Forests also provide a key source of income and livelihoods for subsistence households and individuals (de Souza et al., 2016; Herrera et al., 2017; Naidoo et al., 2019). By maintaining this source of income through forest protection, households can earn sufficient income to ensure food security.
Health
Protected forests can benefit the health and well-being of surrounding communities through impacts on the environment and local economies. Herrera et al. (2017) found that in rural areas of low- and middle-income countries, household members living downstream of higher tree cover had a lower probability of diarrheal disease. Proximity to PAs can benefit local tourism, which may provide more economic resources to surrounding households. Naidoo et al. (2019) found that households near PAs in low- and middle-income countries were more likely to have higher levels of wealth and were less likely to have children who were stunted. Reducing deforestation can improve health by lowering vector-borne diseases, mitigating extreme weather impacts, and improving air quality (Reddington et al., 2015).
Equality
Indigenous peoples have a long history of caring for and shaping landscapes that are rich with biodiversity (Fletcher et al., 2021). Indigenous communities provide vital ecological functions for preserving biodiversity, like seed dispersal and predation (Bliege Bird & Nimmo, 2018). Indigenous peoples also have spiritual and cultural ties to their lands (Garnett et al., 2018). Establishing protected areas must prioritize the return of landscapes to Indigenous peoples so traditional owners can feel the benefits of biodiversity. However, the burden of conservation should not be placed on Indigenous communities without legal recognition or support (Fa et al., 2020). In fact, land grabs and encroachments on Indigenous lands have led to greater deforestation pressure (Sze et al., 2022). Efforts to protect these lands must include legal recognition of Indigenous ownership to support a just and sustainable conservation process (Fletcher et al., 2021).
left_text_column_width
Risks
Ecosystem protection initiatives that are not led by or undertaken in close collaboration with local communities can compromise community sovereignty and create injustice and inequity (Baragwanath et al., 2020; Blackman & Viet 2018; Dawson et al., 2024; Fa et al., 2020; FAO, 2024; Garnett et al. 2018; Sze et al. 2022; Tauli-Corpuz et al., 2020). Forest protection has the potential to be a win-win for climate and communities, but only if PAs are established with respect to livelihoods and other socio-ecological impacts, ensuring equity in procedures, recognition, and the distribution of benefits (Zafra-Calvo et al., 2017).
Leakage is a key risk of relying on forest protection as a climate solution. Leakage occurs when deforestation-related activities move outside of PA boundaries, resulting in the relocation of, rather than a reduction in, emissions from forest loss. If forest protection efforts are not coupled with policies to reduce incentives for forest clearing, leakage will likely offset some of the emissions avoided through forest protection. Additional research is needed to comprehensively quantify the magnitude of leakage effects, though two regional-scale studies found only small negative effects (Fuller et al., 2020; Herrera et al., 2019).
left_text_column_width
Interactions with Other Solutions
Reinforcing
Other intact and degraded ecosystems often occur within areas of forest protection. Therefore, forest protection can facilitate natural restoration of these other degraded ecosystems, and increase the health of adjacent ecosystems.
left_text_column_width
Reducing the demand for agricultural land will reduce barriers to forest protection.
left_text_column_width
Competing
Forest protection will decrease the availability and increase the prices of wood feedstocks for other applications.
left_text_column_width
Dashboard
Solution Basics
1 hectare of forest protected
tCO2-eq/unit/yr
0.3
units
Current
4.67×10⁸8.47×10⁸8.61×10⁸
Achievable (Low to High)
Climate Impact
GtCO2-eq/yr
Current 0.14
0.250.26
US$ per tCO2-eq
2
Emergency Brake
CO₂
Solution Basics
1 hectare of forest protected
tCO2-eq/unit/yr
1.4
units
Current
1.59×10⁸2.04×10⁸3.77×10⁸
Achievable (Low to High)
Climate Impact
GtCO2-eq/yr
Current 0.22
0.290.53
US$ per tCO2-eq
2
Emergency Brake
CO₂
Solution Basics
1 hectare of forest protected
tCO2-eq/unit/yr
2.2
units
Current
1.12×10⁸1.26×10⁸2.19×10⁸
Achievable (Low to High)
Climate Impact
GtCO2-eq/yr
Current 0.25
0.280.48
US$ per tCO2-eq
2
Emergency Brake
CO₂
Solution Basics
1 hectare of forest protected
tCO2-eq/unit/yr
1.49
units
Current
9.36×10⁸1.12×10⁹1.58×10⁹
Achievable (Low to High)
Climate Impact
GtCO2-eq/yr
Current 1.39
1.672.35
US$ per tCO2-eq
2
Emergency Brake
CO₂
% tree cover
Tree cover, 2000 (excluding mangroves and peatlands)
We exclude mangroves and peatlands because they are addressed in other solutions.
Global Forest Watch (2023). Global peatlands [Data set]. Retrieved December 6, 2024 from https://data.globalforestwatch.org/datasets/gfw::global-peatlands/about
Hansen, M.C., Potapov, P.V., Moore, R., Hancher, M., Turubanova, S.A., Tyukavina, A., Thau, D., Stehman, S.V., Goetz, S.J., Loveland, T.R., Kommareddy, A., Egorov, A., Chini, L., Justice, C.O., and Townshend, J.R.G. (2013). High-resolution global maps of 21st-century forest cover change [Data set]. Science 342 (15 November): 850-53. https://glad.earthengine.app/view/global-forest-change
UNEP-WCMC (2025). Ocean+ habitats (version 1.3) [Data set]. Retrieved November 2024 from habitats.oceanplus.org
Geographic Guidance Introduction
The adoption, potential adoption, and effectiveness of forest protection are highly geographically variable. While forest protection can help avoid emissions anywhere that forests occur, areas with high rates of forest loss from human drivers and particularly carbon-rich forests have the greatest potential for avoiding emissions via forest protection. The tropics and subtropics are high-priority areas for forest protection as they contain 55% of currently unprotected forest area, forest loss due to agricultural expansion is particularly concentrated in these regions (Curtis et al., 2018; West et al., 2014; Gibbs et al., 2010), and tend to have larger biomass carbon stocks than boreal forests (Harris et al., 2021).
Developed countries also have significant potential to protect remaining old and long unlogged forests and foster recovery in secondary natural forests. The top 10 forested countries include Canada, the USA, Russia and even Australia, with the latter moving towards ending commodity production in its natural forests and increasing formal protection. Restoration of degraded forests is addressed in the “Forest Restoration” solution, but including regenerating forests in well designed protected areas is well within the capacity of every developed country.
Buffering and reconnecting existing high integrity forests is a low risk climate solution that increases current and future forest ecosystem resilience and adaptive capacity (Brennan et al., 2022; Brink et al., 2017; Grantham et al., 2020; Rogers et al., 2022). Forests with high ecological integrity provide outsized benefits for carbon storage and biodiversity and have greater resilience, making them top priorities for protection (Grantham et al., 2020; Rogers et al., 2022). Within a given forest, large-diameter trees similarly provide outsized carbon storage and biodiversity benefits, comprising only 1% of trees globally but storing 50% of the above ground forest carbon (Lutz et al., 2018). Additionally, forests that improve protected area connectivity (Brennan et al., 2022; Brink et al., 2017), areas at high risk of loss (particularly to expansion of commodity agriculture; Curtis et al., 2018; Hansen et al., 2013), and areas with particularly large or specialized benefits for biodiversity, ecosystem services, and human well-being (Dinerstein et al., 2024; Sarira et al., 2022; Soto-Navarro et al., 2020) may be key targets for forest protection.
Action Word
Protect
Solution Title
Forests
Classification
Highly Recommended
Lawmakers and Policymakers
- Set achievable targets and pledges for PA designation and set clear effectiveness goals for PAs, emphasizing the effectiveness of current PAs before seeking to expand designations.
- Use a variety of indicators to measure effectiveness, such as estimated avoided deforestation.
- Ensure public procurement utilizes deforestation-free products and supply chains.
- Grant Indigenous communities full property rights and autonomy and support them in monitoring, managing, and enforcing PAs.
- Ensure PAs don’t displace, violate rights, or reduce access to vital resources for local and Indigenous communities.
- Invest in PA infrastructure, monitoring, management, and enforcement mechanisms.
- Utilize real-time monitoring and satellite data such as the “Real-Time System for Detection of Deforestation” (DETER).
- Join, support, or create certification schemes like the Forest Stewardship Council for sustainable logging practices.
- Conduct proactive land-use planning to avoid roads and other development projects that may interfere with PAs or incentivize deforestation.
- Create processes for legal grievances, dispute resolution, and restitution.
- Remove harmful agricultural and logging subsidies.
- Prioritize reducing food loss and waste.
- Create education programs that educate the public on PA regulations, the benefits of the regulations, and how to use forest resources sustainably.
Further information:
- Forests, people, climate.
- Protected planet: The world database on protected areas and world database on other effective area-based conservation measures. UNEP-WCMC & IUCN
- Agriculture, forestry and other land uses (AFOLU). IPCC
- Government relations and public policy job function action guide. Project Drawdown
- Legal job function action guide. Project Drawdown
Practitioners
- Set achievable targets and pledges for PA designation and set clear effectiveness goals for PAs, emphasizing the effectiveness of current PAs before seeking to expand designations
- Use a variety of indicators to measure effectiveness, such as estimated avoided deforestation.
- Ensure PAs don’t displace, violate rights, or reduce access to vital resources for local and Indigenous communities.
- Utilize real-time monitoring and satellite data such as the “Real-Time System for Detection of Deforestation” (DETER).
- Create sustainable use regulations for PA areas that provide resources to the local community.
- Conduct proactive land-use planning to avoid infrastructure or development projects that may interfere with PAs or incentivize deforestation.
- Grant Indigenous communities full property rights and autonomy and support them in monitoring, managing, and enforcing PAs.
- Join, support, or create certification schemes like the Forest Stewardship Council for sustainable logging practices.
- Create processes for legal grievances, dispute resolution, and restitution.
- Create education programs that educate the public on PA regulations, the benefits of the regulations, and how to use forest resources sustainably.
Business Leaders
- Create deforestation-free supply chains, utilizing data, information, and the latest technology to inform product sourcing.
- Integrate deforestation-free business and investment policies and practices in Net-Zero strategies.
- Only purchase carbon credits from high-integrity, verifiable carbon markets and do not use them as replacements for reducing emissions.
- Help shift the public narrative around carbon markets as integrity increases to boost education, dialogue, and awareness.
- Develop financial instruments to invest in PA jurisdictions, focusing on supporting Indigenous communities.
- Join or create public-private partnerships, alliances, or coalitions of stakeholders and rightsholders to support PAs and advance deforestation-free markets.
- Join, support, or create certification schemes like the Forest Stewardship Council for sustainable logging practices.
- Conduct proactive land-use planning to avoid infrastructure or development projects that may interfere with PAs or incentivize deforestation.
- Amplify the voices of local communities and civil society to promote robust media coverage.
- Invest in and support Indigenous and local communities' capacity for public relations and communications.
- Support education programs that educate the public on PA regulations, the benefits of the regulations, and how to use forest resources sustainably.
- Leverage political influence to advocate for stronger PA policies at national and international levels, especially policies that reduce deforestation pressure.
Further information:
- Forests, people, climate.
- Protected planet: The world database on protected areas and world database on other effective area-based conservation measures. UNEP-WCMC & IUCN
- Agriculture, forestry and other land uses (AFOLU). IPCC
- Climate solutions at work. Project Drawdown
- Drawdown-aligned business framework. Project Drawdown
Nonprofit Leaders
- Ensure operations utilize deforestation-free products and supply chains.
- Advocate for PAs and for public investments and evaluation indicators to strengthen the effectiveness of PAs.
- Assist in managing and monitoring PAs, utilizing real-time monitoring and satellite data such as the “Real-Time System for Detection of Deforestation” (DETER).
- Provide financial support for PAs management, monitoring, and enforcement.
- Assist in conducting proactive land-use planning to avoid infrastructure or development projects that may interfere with PAs or incentivize deforestation.
- Advocate for creating legal grievance processes, dispute resolution mechanisms, and restitution procedures for violations or disagreements over PAs.
- Support high-integrity carbon markets, institutions, rules, and norms to cultivate the demand for high-quality carbon credits.
- Help shift the public narrative around carbon markets as integrity increases to boost education, dialogue, and awareness.
- Support PAs, businesses, and investors by sharing data, information, and investment frameworks that successfully avoid deforestation.
- Help shift public narratives to mobilize public action and build political will for PAs by creating educational campaigns and strengthening networks of stakeholders and rightsholders.
- Join, support, or create certification schemes like the Forest Stewardship Council for sustainable logging practices.
- Amplify the voices of local communities and civil society to promote robust media coverage.
- Invest in and support Indigenous and local communities' capacity for legal protection and public relations.
- Advocate for non-timber forest products to support local and Indigenous communities.
- Advocate to remove harmful agricultural subsidies and prioritize reducing food loss and waste.
Investors
- Create deforestation-free investment portfolios, utilizing data, information, and the latest technology to inform investments.
- Invest in PA infrastructure, monitoring, management, and enforcement mechanisms.
- Invest in green bonds or high-integrity carbon credits for forest conservation efforts.
- Develop financial instruments to invest in PA jurisdictions, focusing on supporting Indigenous communities.
- Support PAs, other investors, and NGOs by sharing data, information, and investment frameworks that successfully avoid investments that drive deforestation.
- Join, support, or create science-based certification schemes like the Forest Stewardship Council for sustainable logging practices.
- Help shift public narratives to mobilize public action and build political will for PAs by creating educational campaigns and strengthening networks of stakeholders and rightsholders.
- Require portfolio companies to eliminate deforestation from their supply chains and ask that they demonstrate strong PA practices.
- Consider opportunities to invest in forest monitoring technologies or bioeconomy products derived from standing forests (e.g., nuts, berries, or other derivatives)
Philanthropists and International Aid Agencies
- Ensure operations utilize deforestation-free products and supply chains.
- Provide financial support for PAs management, monitoring, and enforcement.
- Assist in monitoring PAs, utilizing real-time monitoring and satellite data such as the “Real-Time System for Detection of Deforestation” (DETER).
- Assist in conducting proactive land-use planning to avoid infrastructure or development projects that may interfere with PAs or incentivize deforestation.
- Support and finance high-integrity carbon markets, institutions, rules, and norms to cultivate the demand for high-quality carbon credits.
- Help shift the public narrative around carbon markets as integrity increases to boost education, dialogue, and awareness.
- Support PAs, businesses, and investors by sharing data, information, and investment frameworks that successfully avoid deforestation.
- Help shift public narratives to mobilize public action and build political will for PAs by creating educational campaigns and strengthening networks of stakeholders and rightsholders.
- Amplify the voices of local communities and civil society to promote robust media coverage.
- Invest in and support Indigenous and local communities' capacity for public relations and communications.
- Financially support Indigenous land tenure.
- Join, support, or create certification schemes like the Forest Stewardship Council for sustainable logging practices.
- Advocate for PAs and for public investments and evaluation indicators to strengthen the effectiveness of PAs.
- Advocate for legal grievances, dispute resolution, and restitution processes.
Thought Leaders
- Advocate for PAs and for public investments and evaluation indicators to strengthen the effectiveness of PAs.
- Assist in monitoring PAs, utilizing real-time monitoring and satellite data such as the “Real-Time System for Detection of Deforestation” (DETER).
- Assist in conducting proactive land-use planning to avoid infrastructure or development projects that may interfere with PAs or incentivize deforestation.
- Advocate for legal grievances, dispute resolution, and restitution processes.
- Support high-integrity carbon markets, institutions, rules, and norms to cultivate the demand for high-quality carbon credits.
- Help shift the public narrative around carbon markets as integrity increases to boost education, dialogue, and awareness.
- Support PAs, businesses, and investors by sharing data, information, and investment frameworks that successfully avoid deforestation.
- Help shift public narratives to mobilize public action and build political will for PAs by creating educational campaigns and strengthening networks of stakeholders and rightsholders.
- Amplify the voices of local communities and civil society to promote robust media coverage.
- Support Indigenous and local communities' capacity for public relations and communications.
Technologists and Researchers
- Improving PA monitoring methods and data collection, utilizing satellite imagery and GIS tools.
- Develop land-use planning tools that help avoid infrastructure or development projects that may interfere with PAs or incentivize deforestation.
- Create tools for local communities to monitor PAs, such as mobile apps, e-learning platforms, and mapping tools.
- Conduct evaluations of the species richness of potential PAs and recommend areas of high biodiversity to be designated as PAs.
- Develop verifiable carbon credits using technology such as blockchain to improve the integrity of carbon markets.
- Develop supply chain tracking software for investors and businesses seeking to create deforestation-free portfolios and products.
Communities, Households, and Individuals
- Ensure purchases and investments utilize deforestation-free products and supply chains.
- Advocate for PAs and for public investments and evaluation indicators to strengthen the effectiveness of PAs.
- Assist in monitoring PAs, utilizing real-time monitoring and satellite data such as the “Real-Time System for Detection of Deforestation” (DETER).
- Assist in conducting proactive land-use planning to avoid infrastructure or development projects that may interfere with PAs or incentivize deforestation.
- Advocate for legal grievances, dispute resolution, and restitution processes.
- Support Indigenous and local communities' capacity for public relations and communications.
- Assist with evaluations of the species richness of potential PAs and advocate for PAs in areas of high biodiversity that are threatened.
- Help shift public narratives to mobilize public action and build political will for PAs by creating educational campaigns and strengthening networks of stakeholders and rightsholders.
- Undertake forest protection and expansion initiatives locally by working to preserve existing forests and restore degraded forest areas.
- Engage in citizen science initiatives by partnering with researchers or conservation groups to monitor PAs and document threats.
Sources
- Forests, people, climate.
- Protected planet: The world database on protected areas and world database on other effective area-based conservation measures. UNEP-WCMC & IUCN
- Making protected areas effective for biodiversity, climate and food, Arneth et al.
- Collective property rights reduce deforestation in the Brazilian Amazon, Baragwanath et al.
- Prevent perverse outcomes from global protected area policy, Barnes et al.
- Is it just conservation? A typology of Indigenous peoples’ and local communities’ roles in conserving biodiversity, Dawson et al.
- Agriculture, forestry and other land uses (AFOLU). IPCC
- Protected-area planning in the Brazilian Amazon should prioritize additionality and permanence, not leakage mitigation, Fuller et al.
- Mixed effectiveness of global protected areas in resisting habitat loss, Li et al.
- Key steps toward expanding protected areas to conserve global biodiversity, Lindenmayer
- Cornered by PAs: Adopting rights-based approaches to enable cost-effective conservation and climate action, Tauli-Corpuz, V.
Evidence Base
There is high scientific consensus that forest protection is a key strategy for reducing forest loss and addressing climate change. Rates of forest loss are lower inside of PAs and Indigenous peoples’ lands than outside of them. Globally, Wolf et al. (2021) found that rates of forest loss inside PAs are 40.5% lower on average than in unprotected areas, and Li et al. (2024) estimated that overall forest loss is 14% lower in PAs relative to unprotected areas. Regional studies find similar average effects of PAs on deforestation rates. For instance, McNichol et al. (2023) reported 39% lower deforestation rates in African woodlands in PAs relative to unprotected areas, and Graham et al. (2021) reported 69% lower deforestation rates in PAs relative to unprotected areas in Southeast Asia. In the tropics, Sze et al. (2022) found that rates of forest loss were similar between Indigenous lands and PAs, with forest loss rates reduced 17–29% relative to unprotected areas. Baragwanath & Bayi (2020) reported a 75% decline in deforestation in the Brazilian Amazon when Indigenous peoples are granted full property rights.
Reductions in forest loss lead to proportionate reductions in CO₂ emissions. The Intergovernmental Panel on Climate Change (IPCC) estimated that ecosystem protection, including forests, peatlands, grasslands, and coastal wetlands, has a technical mitigation potential of 6.2 Gt CO₂‑eq/yr, 4.0 Gt of which are available at a carbon price less than US$100 tCO₂‑eq/yr (Nabuurs et al., 2022). Similarly, Griscom et al. (2017) found that avoiding human-caused forest loss is among the most effective natural climate solutions, with a potential impact of 3.6 Gt CO₂‑eq/yr (including forests on peatlands), nearly 2 Gt CO₂‑eq/yr of which is achievable at a cost below US$10/t CO₂‑eq/yr.
The results presented in this document were produced through analysis of 12 global datasets. We recognize that geographic biases can influence the development of global datasets and hope this work inspires research and data sharing on this topic in underrepresented regions.
left_text_column_width
Appendix
In this analysis, we integrated global land cover data, maps of forest loss rates, shapefiles of PAs and Indigenous people’s lands, country-scale data on reductions in forest loss inside of PAs, and biome-scale data on forest carbon stocks and sequestration rates to calculate currently protected forest area, total global forest area, and avoided emissions from forest protection. Forested peatlands and mangroves are excluded from this analysis and addressed in the Protect Peatlands and Protect Coastal Wetlands solutions, respectively.
Land cover data
We used two land cover data products to estimate forest extent inside and outside of PAs and Indigenous people’s lands, including: 1) the Global Forest Watch (GFW) tree cover dataset (Hansen et al., 2013), resampled to 30 second resolution, and 2) the 2022 European Space Agency Climate Change Initiative (ESA CCI) land cover dataset at native resolution (300 m). For the ESA CCI dataset, all non-flooded tree cover classes (50, 60, 70, 80, 90) and the “mosaic tree and shrub (>50%)/herbaceous cover (<50%)” class (100) and associated subclasses were included as forests. Both products are associated with uncertainty, which we did not address directly in our calculations. We include estimates from both products in order to provide readers with a sense of the variability in values that can stem from different land cover classification methods, which are discussed in more detail below.
These two datasets have methodological differences that result in substantially different classifications of forest extent, including their thresholds for defining forests, their underlying satellite data, and the algorithms used to classify forests based on the satellite information. For example, the ESA CCI product classifies 300-meter pixels with >15% tree cover as forests (based on our included classes), attempts to differentiate tree crops, relies on a 2003–2012 baseline land cover map coupled with a change-detection algorithm, and primarily uses imagery from MERIS, PROBA-V, and Sentinel missions (ESA CCI 2019). In contrast, the Global Forest Watch product generally requires >30% tree cover at 30-meter resolution, does not exclude tree crops, relies on a regression tree model for development of a baseline tree cover map circa 2010, and primarily uses Landsat ETM+ satellite imagery (Hansen et al., 2013). We recommend that interested readers refer to the respective user guides for each data product for a comprehensive discussion of the complex methods used for their development.
We used the Forest Landscape Integrity Index map developed by Grantham et al. (2020), which classifies forests with integrity indices ≥9.6 as high integrity. These forests are characterized by minimal human disturbance and high connectivity. Mangroves and peatlands were excluded from this analysis. We used a map of mangroves from Giri et al. (2011) and a map of peatlands compiled by Global Forest Watch to define mangrove and peatland extent (accessed at https://data.globalforestwatch.org/datasets/gfw::global-peatlands/about). The peatlands map is a composite of maps from five publications: Crezee et al. (2022), Gumbricht et al. (2017), Hastie et al. (2022), Miettinen et al. (2016), and Xu et al. (2018). For each compiled dataset, the data were resampled to 30-second resolution by calculating the area of each grid cell occupied by mangroves or peatlands. For each grid cell containing forests, the “eligible” forest area was calculated by subtracting the mangrove and peatland area from the total forest area for each forest cover dataset (GFW, ESA CCI, and high-integrity forests).
Protected forest areas
We identified protected forest areas using the World Database on Protected Areas (WDPA, 2024), which contains boundaries for each PA and additional information, including their establishment year and IUCN management category (Ia to VI, not applicable, not reported, and not assigned). For each PA polygon, we extracted the forest area from the GFW, ESA CCI, and high-integrity dataset (after removing the peatland and mangrove areas).
Each protected area was classified into a climate zone based on the midpoint between its minimum and maximum latitude. Zones included tropical (23.4°N–23.4°S), subtropical (23.4°–35° latitude), temperate (35°–50° latitude), and boreal (>50° latitude) in order to retain some spatial variability in emissions factors. We aggregated protected forest cover areas (from each of the two forest cover datasets and the high-integrity forest data) by IUCN class and climate zone. To evaluate trends in adoption over time, we also aggregated protected areas by establishment year. We used the same method to calculate the forest area that could be protected, extracting the total area of each land cover type by climate zone (inside and outside of existing PAs).
We used maps from Garnett et al. (2018) to identify Indigenous people’s lands that were not inside established PAs. We calculated the total forest area within Indigenous people’s lands (excluding PAs, mangroves, and peatlands) using the same three forest area data sources.
Forest loss and emissions factors
Forest loss rates were calculated for unprotected areas using the GFW forest loss dataset for 2001–2022, resampled to 1 km resolution. Forest losses were reclassified according to their dominant drivers based on the maps originally developed by Curtis et al. (2018), with updates accessible through GFW. Dominant drivers of forest loss include commodity agriculture, shifting agriculture, urbanization, forestry, and wildfire. We classified all drivers except wildfire as human-caused forest loss for this analysis. We calculated the area of forest loss attributable to each driver within each climate zone, which represented the “baseline” rate of forest loss outside of PAs.
To calculate the difference in forest loss rates attributable to protection, we used country-level data from Wolf et al. (2021) on the ratio of forest loss in unprotected areas versus PAs, controlling for a suite of socio-environmental characteristics. We classified countries into climate zones based on their median latitude and averaged the ratios within climate zones. We defined the avoided forest loss attributable to protection as the product of the baseline forest loss rate and the ratio of forest loss outside versus inside of PAs.
We calculated the carbon benefits of avoided forest loss by multiplying avoided forest loss by average forest carbon stocks and sequestration rates. Harris et al. (2021) reported carbon stocks and sequestration rates by climate zone (boreal, temperate, subtropical, and tropical), and forest type. Carbon stocks and sequestration rates for primary and old secondary (>20 years old) forests were averaged for this analysis. We calculated carbon sequestration over a 20-yr period to provide values commensurate with the one-time loss of biomass carbon stocks.
left_text_column_width
Updated Date
Reduce Food Loss & Waste
Mode
Cut Emissions
Cluster
Curb Growing Demands
Image
Image
Coming Soon
On
Action Word
Reduce
Solution Title
Food Loss & Waste
Classification
Highly Recommended
Updated Date
Improve Diets
Mode
Cut Emissions
Cluster
Curb Growing Demands
Image
Image
Coming Soon
On
Action Word
Improve
Solution Title
Diets
Classification
Highly Recommended
Updated Date