Electric Cars
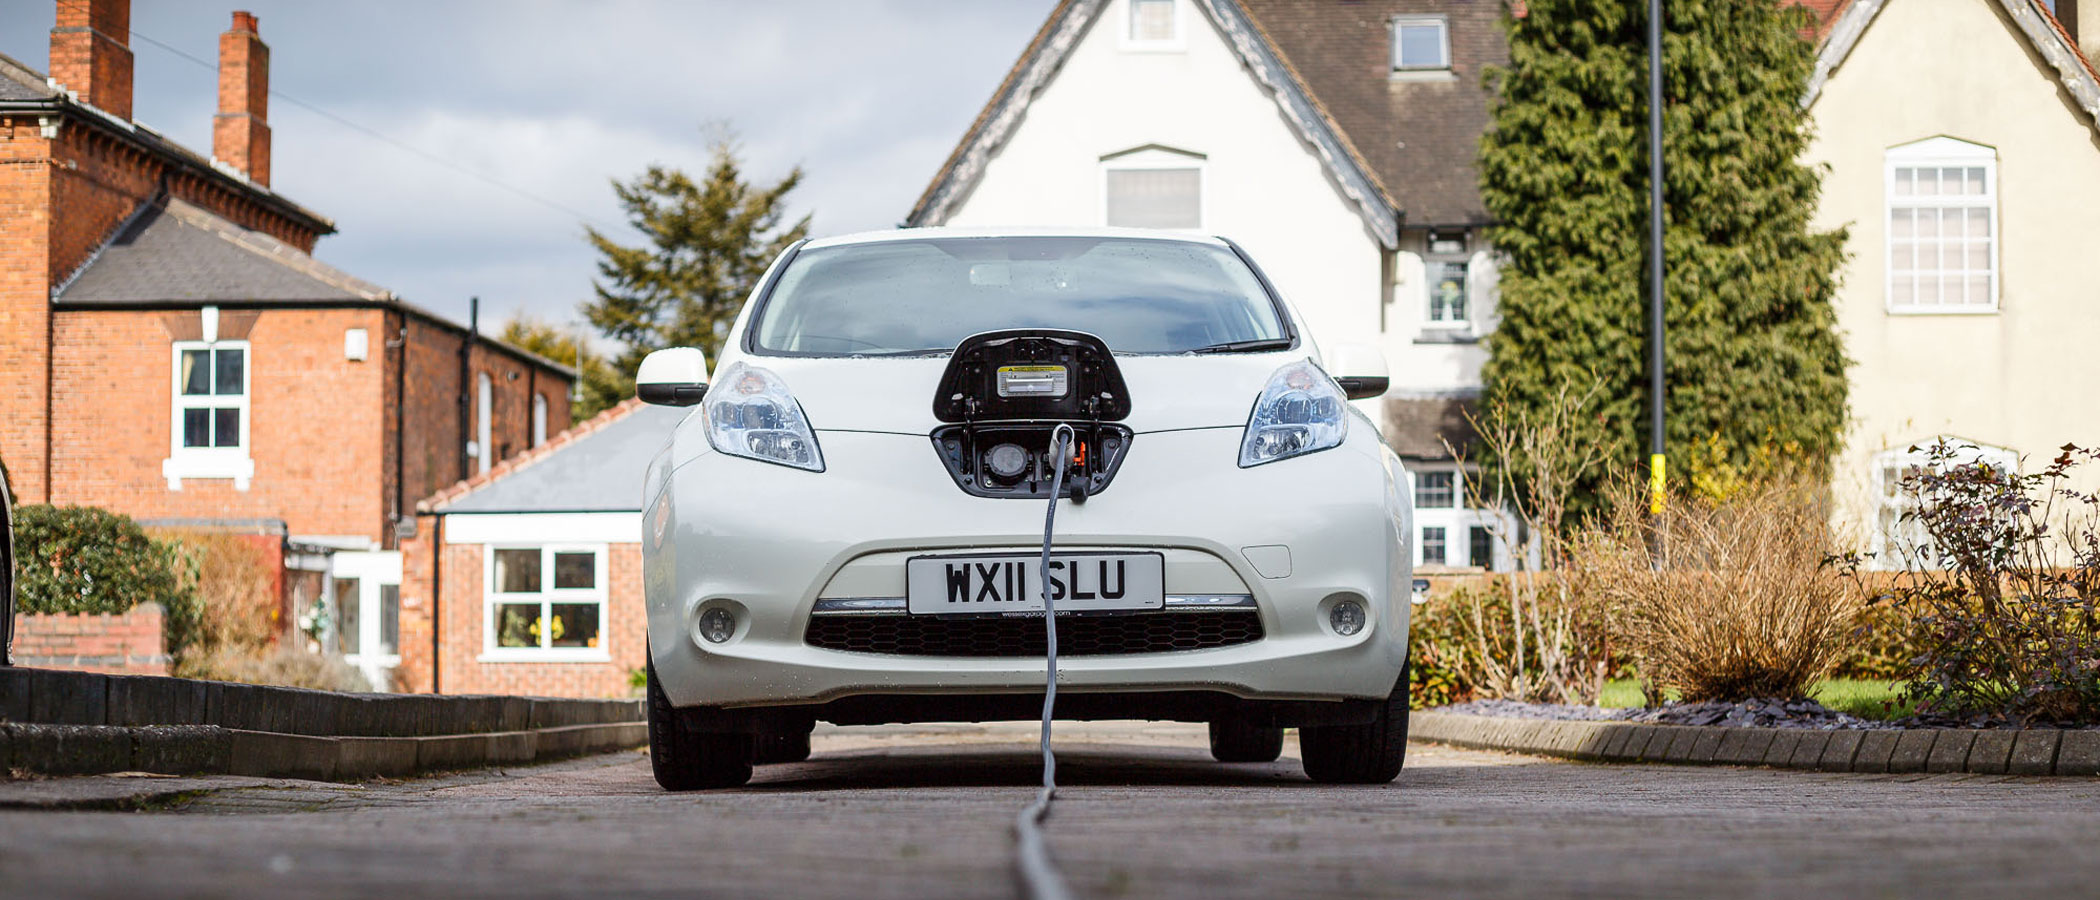
Electric cars supplant those powered by gasoline or diesel. They always reduce emissions—dramatically so when powered by renewable electricity.
Reduced/Sequestered
2020–2050
To Implement
Operational Savings
Impact
Some 2 million electric cars were sold in 2018. If electric car ownership rises to 21–33 percent of total passenger kilometers at a first cost of US$572.68–6.02 billion less than that of the conventional cars, by 2050, we could avoid 7.66–9.76 gigatons of carbon dioxide equivalent greenhouse gases as well as US$11.59–15.54 trillion in fuel costs. This analysis includes emissions from electricity generation and the higher emissions associated with producing electric cars instead of internal-combustion cars. Electric cars are more expensive, but we assume electric car prices will decline slightly due to declining battery costs.
Introduction
Project Drawdown’s electric cars solution involves the use of cars that are at least partly powered by an electric drive train with batteries that can be charged by plugging in. We classify this mainly as an urban mode, but do consider its impact on intercity passenger travel. It replaces the use of conventional internal combustion engine (ICE) cars.
Most light-duty vehicles in use today rely on internal combustion engines. Electric vehicles (EVs) use a more energy-efficient electric motor and have high-capacity batteries that can be charged from the electric grid. The grid in general produces fewer greenhouse gas emissions than do conventional vehicles, and is growing cleaner around the world. EVs also are simpler to make and have fewer moving parts than ICE cars, require little maintenance, and use no fossil fuels.
The EV market is maturing, with early adopters driving the high growth seen over the past 10 years. Even though EVs comprise still only a small fraction of vehicles today, we expect the market to grow dramatically over the coming decades, replacing a large share of conventional vehicles and reducing carbon dioxide emissions from road transportation.
Methodology
For purposes of this assessment, both battery EVs and plug-in hybrid EVs are included in specified shares. All relevant variables (e.g., fuel use) are weighted according to this share.
Total Addressable Market
The total addressable market for electric cars is the total number of urban and non-urban passenger-kilometers projected by sources such as the International Energy Agency (IEA) and the International Council on Clean Transport (ICCT) to 2050. For current adoption (defined as the amount of functional demand supplied in 2018) we use 0.47 percent of all passenger cars in the global fleet or 0.22 percent of the total global mobility in passenger-kilometers, based on several sources. We averaged the total passenger-kilometers of light-duty vehicles from data provided by the IEA, ICCT, the Institute for Transportation and Development Policy (ITDP), and University of California, Davis (UCD).
Adoption Scenarios
We calculated the impacts of increased adoption of electric cars from 2020 to 2050 by comparing two growth scenarios with a reference scenario in which the market share was fixed at current levels.
- Scenario 1: Adoption is based on the 2°C scenario from the IEA’s Energy Technology Perspectives Report (2016). All EV passenger-kilometers are assumed to be urban-only until 2020, after which the non-urban share increases 5 percent annually until 2026. From 2026 on, the share of urban EV passenger-kilometers remains at 70 percent. This assumption addresses the perceived “range anxiety” problem of EVs, which should decline as battery technology and charging networks advance. This scenario assumes electric car adoption will reach 11.77 trillion passenger kilometers (21 percent of the total addressable market).
- Scenario 2: We base the total stock of EV cars out to 2050 on IEA projections (IEA, 2017) and historical EV sales (IEA & EVI, 2019).The urban share of EV mobility drops 5 percent per year from 2021 until 2030, representing more extensive support for nonurban driving and reduced range anxiety. This scenario assumes electric car adoption will reach 16.58 trillion passenger kilometers (33 percent of the total addressable market).
Emissions Model
We based emissions estimates on electricity and fuel usage data from a range of sources, with emissions factors calculated based on Intergovernmental Panel on Climate Change (IPCC) guidelines and recent sources for grid emissions factors, and including indirect emissions. EV production generates 6 percent higher indirect emissions than ICE vehicles.
Financial Model
All monetary values are presented in 2014 US$.
We estimated the first costs for purchasing an EV or ICE vehicle using recent data from several sources that cover key markets such as the US, China, EU, and Japan as well as the world as a whole. We weighted costs by market sales by region and model. We set purchase costs for EVs almost US$11,000 (43 percent) higher than ICE vehicles (US$36,000 versus US$25,000).
Operating costs included grid electricity for EVs (adjusted for the ratio of battery to plug-in hybrid EVs in each scenario), and fuel (for the plug-in hybrid and ICE). We based electricity and fuel use on several sources, including the US Energy Information Administration. We derived weighted global average fuel prices from recent IEA estimates, and calculated electricity prices using data from 51 countries over 10 years. Operating costs included maintenance costs and insurance.
Integration
We harmonized common variables across solutions for consistency, including vehicle prices, fuel prices, operating costs, total addressable market, and market data. We accounted for the additional demand on the electricity grid resulting from the growth of EV usage in the integrated total market for electricity. To avoid double-counting emissions benefits, the EV results do not reflect the cleaner grid; instead, these additional emissions benefits accrue to the supply-side energy solutions. Additionally, as we integrated EVs with the Carpooling solution, we assumed increased occupancy over time.
Results
Scenario 1 leads to 866 million EVs on the roads in 2050, compared with 5.2 million in 2018. This rapid growth saves 7.66 gigatons of carbon dioxide equivalent greenhouse gas emissions between 2020 and 2050, and US$11.59 trillion in lifetime operational costs for the full lifetime of all units installed during that period. The net savings to implement is $572.68 billion.
Scenario 2 projects that 1.2 billion EVs would join the global fleet by 2050, resulting in 9.76 gigatons of emissions avoided. The net first savings to implement is US$6.02 billion, and the lifetime net operational savings are US$15.54 trillion.
Discussion
EV adoption reduces greenhouse gas emissions as well as operating costs for households.
Consumer education is key to EV adoption in order to relieve concerns about the upfront price and operating range. As battery technology matures and economies of scale grow, both the purchase price and range of EVs will become more attractive to consumers. However, to get to that point may require financial incentives for consumers as well as a focus on the mass market rather than high-end consumers.
In addition, potential problems from increased battery production would have to be managed, such as sourcing key metals, whose supply chains can have negative environmental and social impacts. Disposal of old batteries is also an issue.
References
International Energy Agency (IEA). (2016b). Energy Technology Perspectives 2016: Towards Sustainable Urban Energy Systems. Paris: International Energy Agency. Retrieved from International Energy Agency website: http://www.iea.org/etp/etp2016/
International Energy Agency (IEA). (2017). Energy Technology Perspectives 2017 - Catalysing Energy Technology Transformations. Retrieved from: https://www.iea.org/etp/
International Energy Agency (IEA). (2019). Global EV Outlook 2019: Scaling-up the transition to electric mobility. https://doi.org/10.1787/35fb60bd-en
What You Can Do
If you have an EV, invite a friend or colleague along for a ride. If you don’t, take a test drive with a car dealer.
Encourage your community, employer, or a local business to install an EV charging station.
- Expand your knowledge by exploring another Drawdown solution.
Co-benefits
Electric cars help reduce air pollution in urban areas. Improved air quality is associated with improved respiratory and cardiovascular health.
Improving the quality of the air we breathe has been shown to reduce illnesses such as heart disease, asthma, pneumonia, diabetes, stroke, and lung cancer.
A widespread transition to electrified vehicles could prevent thousands of premature infant deaths caused by exposure to poor air quality
Because air pollution disproportionately affects marginalized communities, improving air quality by transitioning to electrified vehicles could improve equity across populations.


